Article

Pore Structure Multifractal Characteristics of Coal Reservoirs in the Central and Eastern Qinshui Basin and Influencing Factors

1
Key Laboratory of Coalbed Methane Resource and Reservoir Formation Process, China University of Mining and Technology, Xuzhou 221116, China
2
PetroChina Research Institute of Petroleum Exploration & Development, Beijing 100083, China
3
CNPC Key Laboratory of Unconventional Oil and Gas, Beijing 100083, China
4
PetroChina Coal Bed Methane Company Ltd., Beijing 100095, China
*
Authors to whom correspondence should be addressed.
Processes 2023, 11(1), 286; https://doi.org/10.3390/pr11010286
Submission received: 20 December 2022 / Revised: 4 January 2023 / Accepted: 6 January 2023 / Published: 16 January 2023

Abstract

:
The heterogeneity of the pore structure of coal reservoirs affects the desorption and diffusion characteristics of coalbed methane, and determining its distribution law is conducive to improving the theory of coalbed methane development. The central and eastern parts of the Qinshui Basin are rich in coalbed methane resources, but the heterogeneity characteristics of the pore structure of coal reservoirs are not clear. NMR has the advantages of being fast, non-destructive and full-scale, and multifractal can describe the self-similarity of NMR T2 curve at different scales so as to analyze the complexity of pore distribution. Based on this, 15 samples with different coal ranks were collected from the central and eastern Qinshui Basin (Ro,max between 1.54 and 2.78%), and quantitative pore characterization experiments such as low-field nuclear magnetic resonance (LF-NMR) and low-temperature liquid nitrogen adsorption (LTN2A) were conducted. Based on multifractal theory, the heterogeneity law of pore structure was quantitatively evaluated, and its influencing factors were elucidated. The results showed that the BJH pore volume of coal samples in the study area ranged from 0.0005–0.0028 cm3/g, with an average of 0.0014 cm3/g, and the BET specific surface area was 0.07–2.52 m2/g, with an average of 0.41 m2/g. The NMR T2 spectrum peaked at 0.1–1, 10–100 and 100–1000 ms, and the spectrum was mostly bimodal or trimodal, indicating that pores of different pore sizes were developed. There were great differences in the pore structure of different coal ranks; high-rank coal was dominated by micropores, and the proportion of mesopores and macropores of medium-rank coal was higher. The pore structure of coal samples showed obvious multifractal characteristics, and the fractal characteristics of the sparse region (low-value information) were more significant; they dominated the pore distribution and had a stronger influence on the distribution of pore space. Pore structure heterogeneity is closely related to the degree of coalification, and with the increase in coalification, it is closely related to coal lithotype and quality, and high mineral and inertinite contents lead to the enhancement of pore structure heterogeneity in coal reservoirs, while Ro,max, Mad and vitrinite group contents have opposite effects. The research results provide theoretical guidance for the subsequent exploration and development of coalbed methane in the region.

1. Introduction

Coal is a highly heterogeneous porous medium with complex pore structure, diverse causes and large-scale span [1,2,3]. Pore structure has important effects on the reservoir properties, seepage capacity and methane distribution of coal reservoirs, and the concentration mechanism and transport form of methane in pores at different scales vary [4,5,6]. It is of great significance to clarify the heterogeneity of pore structure.
The strong heterogeneity of the pore structure of coal reservoirs makes it difficult to characterize it in fine terms with traditional Euclidean geometry, and the introduction of fractal theory provides a favorable tool for studying the heterogeneity of the pore structure of reservoirs [7]. Since Mandelbrot (1967) proposed fractal theory, many scholars have developed different fractal models (Menger sponge model, BET model, FHH model, etc.) based on different test methods (SEM, mercury intrusion porosimetry, liquid nitrogen adsorption, etc.). Furthermore, the heterogeneity characteristics and influencing factors of the pore structure of unconventional reservoirs were explored, and the influence mechanism of the heterogeneity of the pore structure on the adsorption seepage capacity of reservoirs was further revealed. With the development of pore structure characterization methods in reservoirs toward multimeans comprehensive characterization, scholars have also begun to try the organic combinations of different test methods and their corresponding fractal theories. With the development of pore structure characterization methods in reservoirs toward multimeans comprehensive characterization, scholars have also begun to try the organic combination of different test methods and their corresponding fractal theories. For example, Song et al. (2018) explored the influencing factors of the pore structure of structural coal by using the high-pressure mercury intrusion porosimetry (MIP) + Menger cavernous model combined with the low-temperature liquid N2 adsorption(LTN2A) + FHH fractal model and completed the qualitative-quantitative evaluation of pore heterogeneity of different levels of size to a certain extent [8]. However, high-pressure mercury intrusion porosimetry (MIP) and low-temperature liquid N2 adsorption (LTN2A) are destructive experiments, which have limitations in the characterization scale, and the characterization results are only credible within a certain range. Second, the pore size distribution of unconventional reservoirs is random and extremely heterogeneous, while the characterization of pore heterogeneity of different levels of size by the FHH model or Menger sponge model is artificial and subjective and cannot accurately reflect the pore structure information under different levels and scales of unconventional reservoirs [9,10,11]. Therefore, to more comprehensively and accurately characterize the heterogeneity characteristics of the pore structure of unconventional reservoirs, low-field nuclear magnetic resonance (LF-NMR) testing techniques and multifractal theory are introduced. NMR has the advantages of a fast, non-destructive and wide characterization range in characterizing reservoir pore structure and has been widely used in the study of petrophysical properties of hydrogen-containing reservoir fluids such as water and methane, which can evaluate reservoir structural parameters such as porosity, permeability, pore size distribution (PSD), a saturation of different types of fluids, and pore connectivity [12,13,14,15,16,17,18]. As an extension of singlet fractals, multifractals can characterize fractal characteristics at different scales of porous medium [13,19,20,21]. The combination of NMR and multifractal theory can not only characterize the pore structure characteristics of unconventional reservoirs at a full scale but also characterize the heterogeneity of unconventional reservoir pore structures more comprehensively and accurately.
The Qinshui Basin is the first coalbed methane field in China, with reserves of 100 billion cubic meters. Full-scale characterization of coal reservoir pore structure characteristics, accurate characterization of coal reservoir pore structure heterogeneity characteristics and its influencing factors have practical significance for the efficient development of coalbed methane in this gas field and can provide a reference for the exploration and development of coalbed methane in other regions. In this work, 15 medium-high rank coal samples from the central and eastern parts of the Qinshui Basin were collected, and NMR and LTN2A experiments were conducted on these samples to explore the heterogeneity of medium-high rank coal reservoirs combined with multifractal theory. The objectives of this paper are (1) to characterize the pore structure characteristics of medium-high rank coal reservoirs in the Qinshui coalfield on a full scale and (2) to reveal the heterogeneity characteristics and influencing factors of the pore structure of medium-high rank coal reservoirs and provide a theoretical basis for the subsequent development of coalbed methane.

2. Samples and Experimental Methods
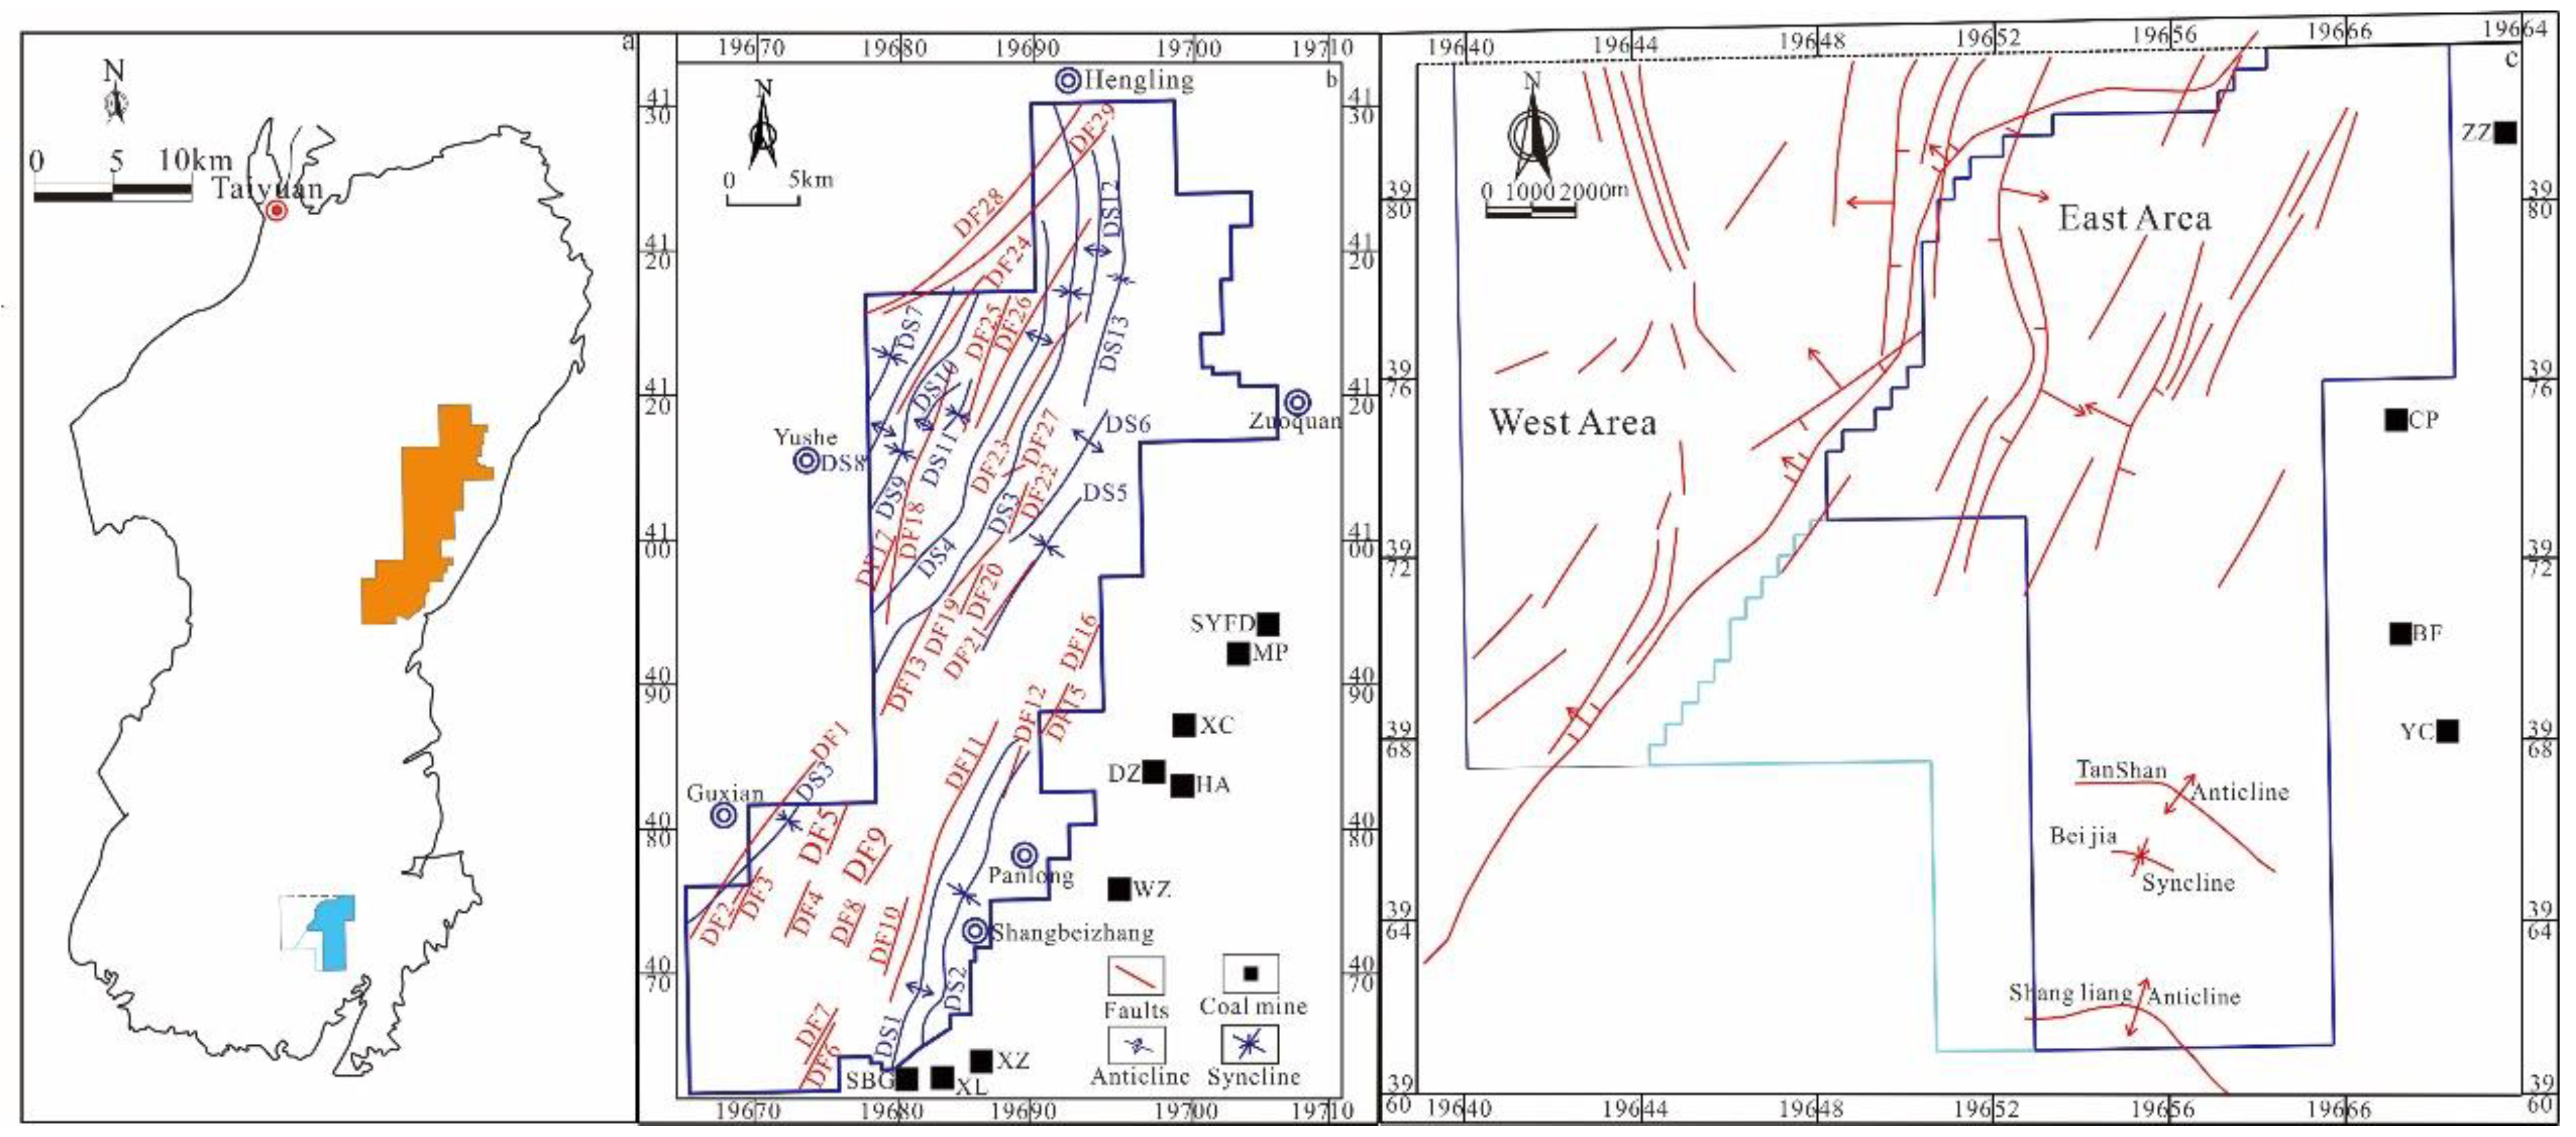
2.1. Samples

In this study, a total of 15 samples were collected; they were taken from production mines in the east and south of Qinshui Basin, including 6 medium rank coal samples and 9 high rank coal samples. Bulk fresh samples are collected from the working face of the mine, sealed with plastic wrap and transported to the laboratory to complete the preparation of powder, column (φ25 × 50 mm) and other samples of different specifications for subsequent experimental testing. Medium-high rank coal samples were collected from Xialiang (XL), Huaian (HA), Mapu (MP), Xinzhuang (XZ), Xincun (XC), Shibangou (SBG), Sanyuanfuda (SYFD), Wenzhuang (WZ), Bofang (BF), Gaoliang (GL), Yechuan (YC), Changping (CP), Zhaozhuang (ZZ) and other production mines in the Qinshui Coal field (Figure 1).

2.2. Experiments

On the basis of industrial analysis, coal lithotype identification and LTN2A experiments, LF-NMR experiments were conducted on medium-high rank coal samples. Among them, the industrial analysis testing of coal is completed by an automatic industrial analyzer 5E-6600, following ASTM Standards D3173-11, D3174-11, and D3175-11. The experimental parameters include moisture content (Mad), ash yield (Ad) and volatile yield (Vdaf). The measurements of Ro,max and identification of coal macerals are completed on the MPV-SP microphotometer by using the counting point method following ASTM Standard D2798-11a.
The LTN2A experiment instrument is a TriStar II 3020 specific surface and porosity analyzer. After drying and degassing, the nitrogen adsorption capacity of 2 g 40–60 mesh powder samples was determined at 77 K under different relative pressures (0.001~0.998) based on the multipoint Brunauer–Emmett–Teller (BET) and Barrett–Joyner–Halenda (BJH) models. The nitrogen adsorption branch data were interpreted to obtain the specific surface area, pore volume and pore size distribution parameters.
LF-NMR experiments were conducted on the Rec Core2500 low-field nuclear magnetic resonance measuring instrument in the China petroleum exploration and development research institute Langfang branch. The sample size was Φ2.5 cm × 5 cm, and samples were cut in the laboratory. The LF-NMR experiment was divided into two parts: (1) Using 100% saline saturated + LF-NMR: Before the experiment, the samples were placed in a drying oven at 70 °C for 24 h to constant weight, then vacuumized for 8 h, and finally placed in saline for 24 h under vacuum pressure to saturate the samples, and then LF-NMR was conducted on the 100% saturated samples. (2) High-speed centrifugation + LF-NMR: The samples were removed and placed in a centrifuge for 1 h at high speed of 10,000 r/min, and LF-NMR was conducted on the centrifuged samples. By using two series of LF-NMR with 100% saturated saline and 10,000 r/min high-speed centrifugation, each sample can obtain two T2 spectra in 100% saturated water and residual water for the calculation of the T2 cutoff value.
NMR relaxation includes three relaxation mechanisms: free relaxation, surface relaxation and diffusion relaxation, which together affect the T2 relaxation time:
1 T 2 = 1 T 2 B + 1 T 2 S + 1 T 2 D
where T2 is the relaxation time; T2B is the free relaxation time, and T2S is the surface relaxation caused by fluid interaction with the inner surface of the pore. T2D is the relaxation time caused by diffusion.
The value of T2B is usually 2–3 s, which is much larger than T2. A uniform magnetic field (corresponding to a very small magnetic field intensity) is adopted in the experiment, and the echo time TE obtained in the experiment is sufficiently small.
Therefore, T2 can represent surface relaxation. The surface relaxation rate (ρ2) and the surface-volume ratio (S/V) are directly proportional, and T2 can be simplified as [13]:
1 T 2 = ρ 2 ( S V )
where ρ2 is the surface relaxation rate and S and V are the surface area and pore volume of the sample, respectively. For porous media that can be simplified as spherical pores and columnar pores, the relationship between relaxation time T2 and pore radius rc can be translated into:
1 T 2 = F s ( ρ 2 r c )
where Fs is the geometric shape factor (spherical pores, Fs = 3; columnar pore, Fs = 2). Therefore, the relationship between relaxation time T2 and pore radius rc can be simplified as:
r c = F s ρ 2 T 2 = C T 2
where C is the conversion coefficient.

2.3. Calculation of Multifractal Dimension

Multifractals can be described mathematically by the singular spectrum α-f(α) and generalized dimension spectrum q-Dq. Because of the simplicity of the q-Dq language, the heterogeneity of the pore distribution in coal samples is analyzed by using the q-Dq language. q-Dq languages need to determine two parameters: the mass probability pi(ε) and the generalized fractal dimension Dq.
The key step of multifractal analysis of the pore distribution in porous media is to define pi(ε) with different box sizes ε for a certain study area based on the calculation principle of the box dimension to quantitatively describe the partial distribution characteristics of the object. According to the dichotomy division principle, the length of the research interval L is divided into 2k boxes of size ε. The size of ε is L × 2−k.
The expression of pi(ε) is:
p i ( ε ) = N i ( ε ) i = 1 N ( ε ) N i ( ε )
where Ni(ε) is the accumulated porosity or pore volume in the ith box; pi(ε) is the mass probability function, which is an exponential function of the interval size ε and can be expressed as:
p i ( ε ) ε α i
where αi is the singularity index, which can reflect the partial singularity intensity [22], and the higher the value is, the higher the smoothness or regularity or tidiness of the data. In contrast, the greater the degree of variation or heterogeneity of the data.
For boxes of size ε with multifractal behavior, the number of boxes N(ε) increases exponentially with increasing scale ε:
N α ( ε ) ε f ( α )
where f(α) represents a multifractal singular spectrum, is a monotone function, and is the fractal dimension of a subset with the same singularity exponent.
The probability distribution function of q with size ε can be defined as:
χ ( q , ε ) ε ( q 1 ) D q
where Dq is the generalized dimension related to q, which can be defined as [23]:
D q = lim ε 0 1 q 1 lg [ i = 1 N i ( ε ) p i q ( ε ) ] lg ( ε )
where q is the statistical moments of order (− ꝏ < < q + ꝏ, q ≠ 1), the paper scope for. The variation in the data reflects the probability distribution characteristics of the research object. q < 0 reflects the pore distribution characteristics of the low-porosity region, while q > 0 emphasizes the pore distribution characteristics of the high-porosity region. Therefore, multifractals divide the pore distribution data into regions with local high porosity or local low porosity, depending on scale.
The mass index of order q can be represented as:
τ ( q ) = lim ε 0 lg χ ( q , ε ) lg ε
Combined with Equations (8)–(10), the mass function τ(q) can be expressed as:
τ ( q ) = ( 1 q ) D q
The singular intensity α(q) represents the singular intensity of the q-order statistical moment, and the relation between its mass function τ(q) is [24]:
α ( q ) = ln ( τ ( q ) ) ln ( q )
f(α) represents a multifractal singularity spectrum and is the fractal dimension of a subset with the same singularity exponent. By the same token, the relation with τ(q) is:
f ( α ) = q α ( q ) τ ( q )
The Dq corresponding to q = 0, 1, and 2 are the capacity dimension D0, information dimension D1, and association dimension D2, respectively. Riedi et al. (1999) showed that the Hurst index H could express its meaning instead of D2 [25], and its expression was as follows:
H = ( D 2 + 1 ) / 2
In the equation, H is also known as the long-range correlation index (0.5–1), which reflects the correlation among spatial variables. Therefore, the H-index describes the connectivity between pores in different pore size ranges of the study object [26].

3. Results

3.1. Coal Lithotype and Quality

In the middle and high-rank coal in the central and eastern parts of the Qinshui Basin, Ro,max is 1.54~2.48%, and the macerals are vitrinite and inertinite, whose contents are 50.84~88.75% and 5.42~49.16%, respectively, with averages of 75.23% and 20.06%, respectively. The mineral content ranges from 2.42% to 30.67%, with an average of 10.90%. The Mad of the samples ranged from 0.66% to 2.32%, with an average of 1.46%, and the Vdaf ranged from 9.29% to 29.80%, with an average of 15.27% (Table 1). With increasing maturity, the Mad of medium-high rank coal shows an increasing trend, while Vdaf shows a decreasing trend (Figure 2a,b), indicating that Vdaf and Mad can represent the degree of coalification to a certain extent. Ad ranges from 3.82% to 24.20%, with an average of 13.28%, showing a strong positive correlation with the content of inorganic minerals in coal (Figure 2c). The fixed carbon content (FCad) represents the carbon content in coal after removing moisture, volatiles and ash. The FCad of middle-high rank coal ranges from 53.22% to 85.97%, with an average of 74.25%. The fixed carbon content is closely related to coalification and positively related to Ro,max. Coal with high FCad tends to have greater metamorphism. Second, there is a negative correlation between FCad and Ad, which means that a large amount of terrigenous debris destroys the coal-forming environment and leads to a decrease in FCad. Vitrinite-rich coal has higher Mad and FCad and lower Vdaf than inertinite coal.

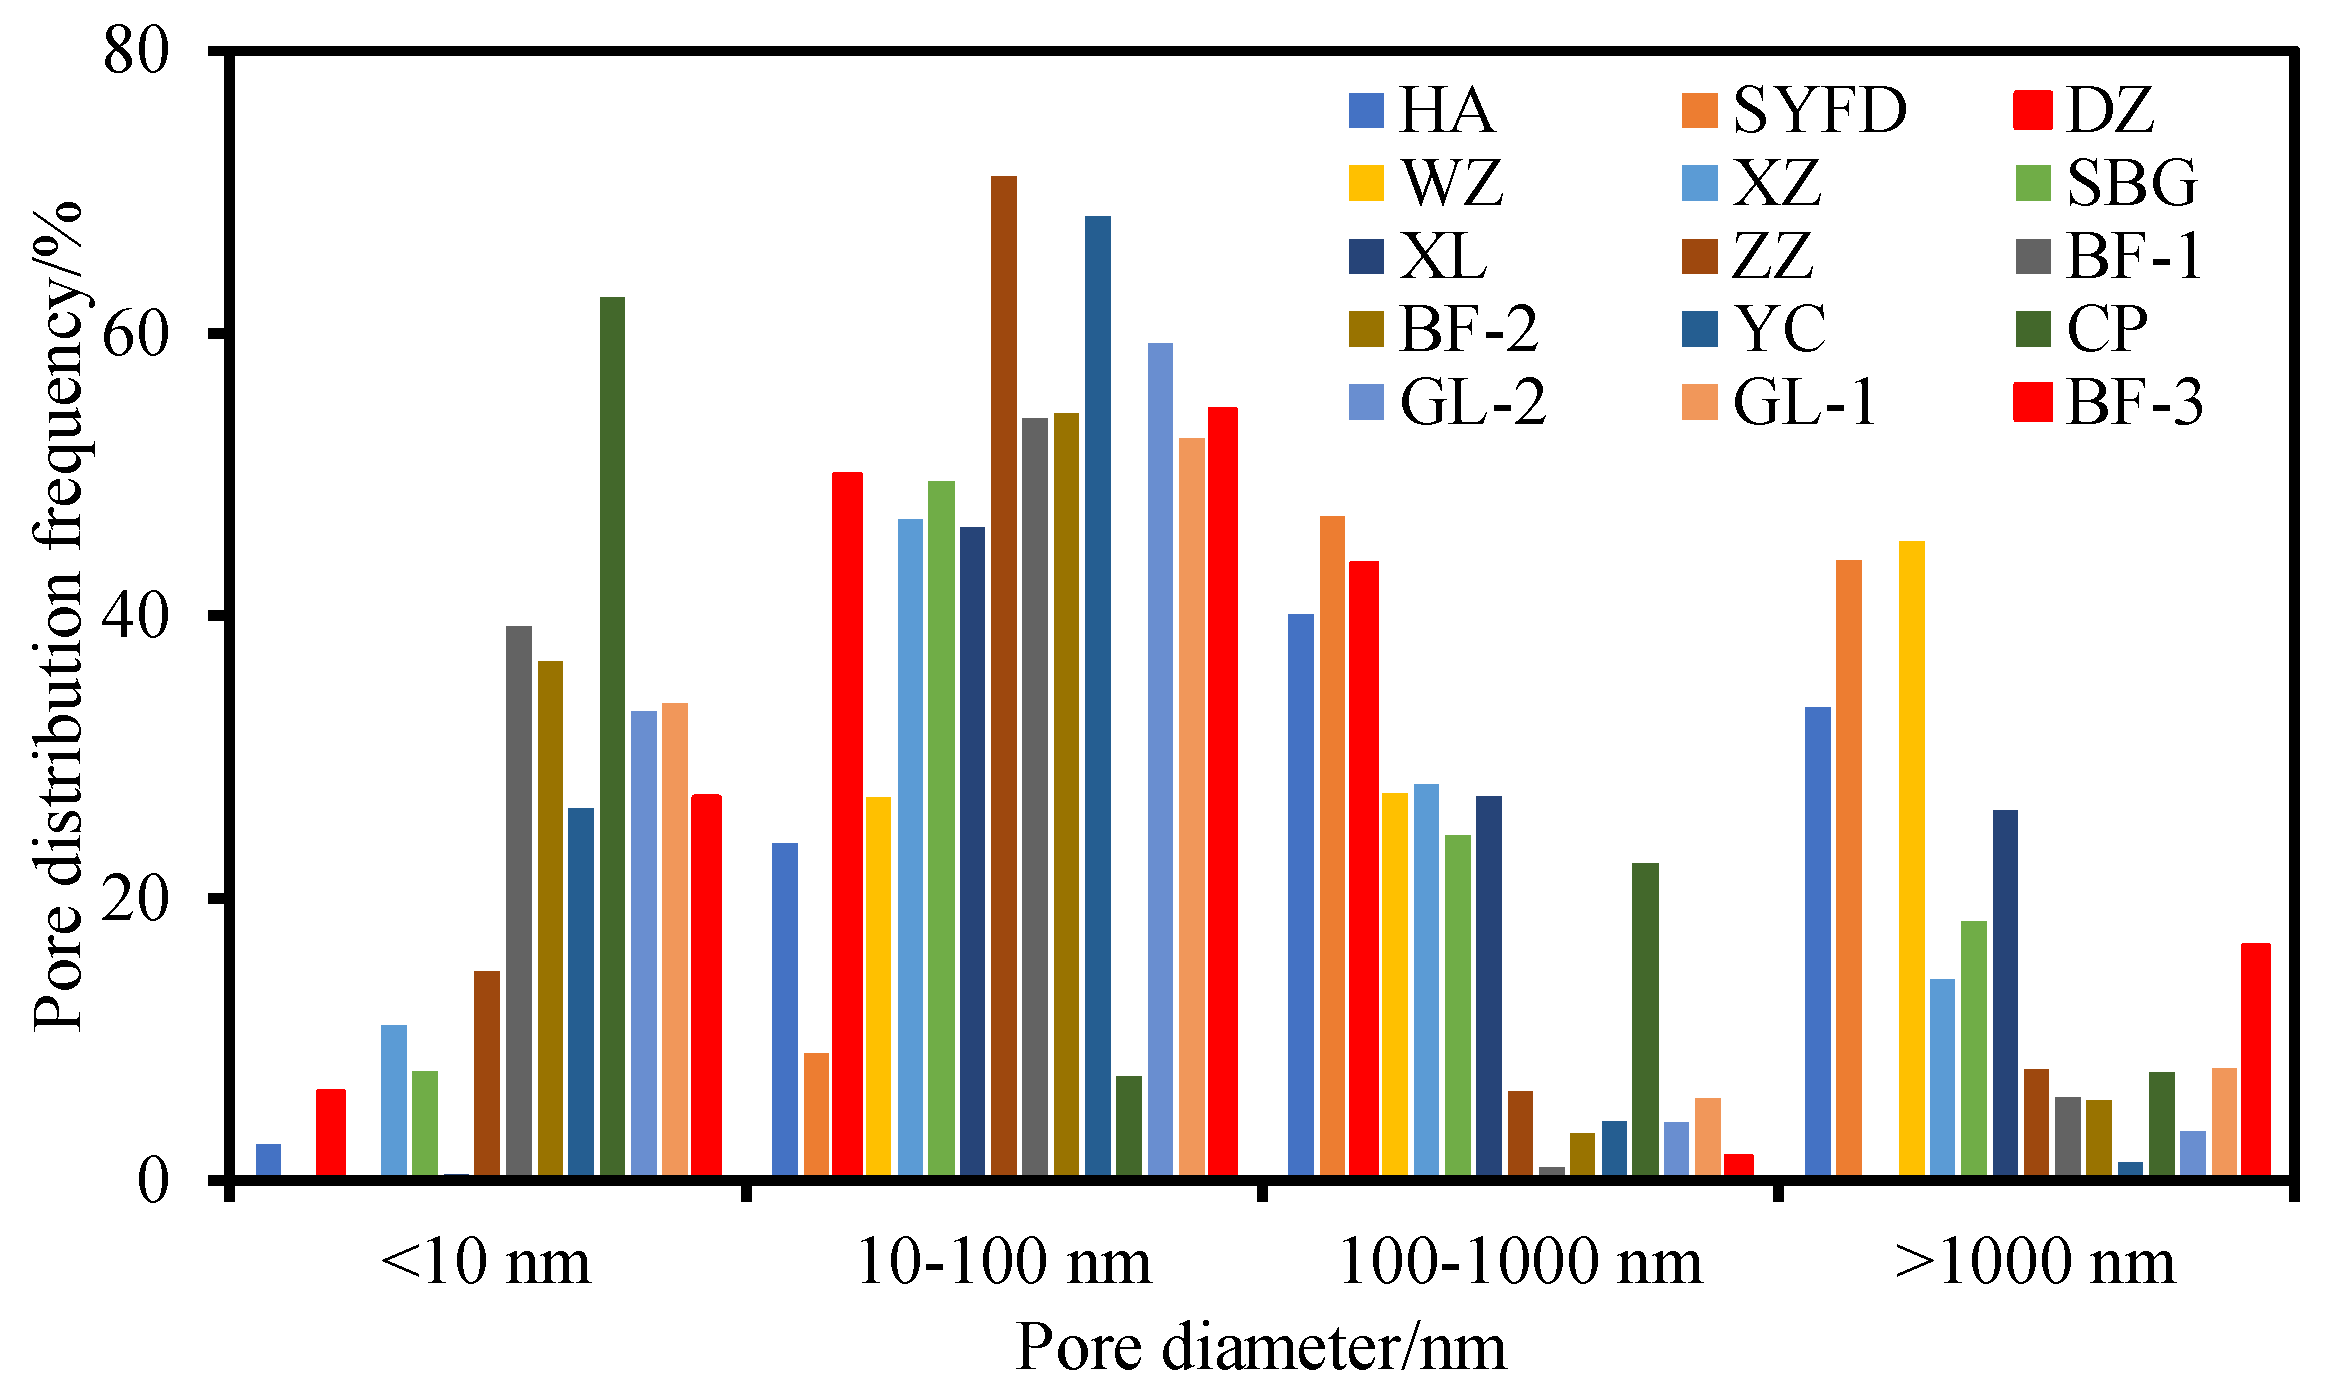
3.2. Pore Structure Based on Nuclear Magnetic Resonance

To quantitatively research the pore structure of coal, the pore structure characteristics of different rank coal samples were analyzed based on NMR experiments. In the relaxation time curve of the T2 spectrum, the peaks of the T2 spectrum distribution reflect various pore types in coal. The peaks at 0.5–2.5 ms, 20–50 ms and >100 ms correspond to adsorption pores (<100 nm, including micropores and small pores), seepage pores (>100 nm, including mesoporous and macroporous pores) and microfractures. The envelope area can reflect the characteristics of pore development at different scales. The T2 spectrum distribution curves of medium-high rank coal samples under saturated and centrifugal conditions show the following characteristics: (1) Under 100% saturated water conditions, the T2 spectrum distribution is wide, ranging from 0.1 to 1000 ms, indicating that the medium-high rank coal samples have a wide range of pore throat sizes, and pores of different sizes are developed. The morphology of the T2 spectrum is mainly bimodal, GL-1, CP and ZZ are trimodal, and SYFD is unimodal. The left peak of all samples is between 1 and 1.0 ms, which represents the development characteristics of micropores (adsorption pores, <100 nm), and the right peak is mainly between 10 and 100 ms. The right peak of some samples was between 10 and 1000 ms. Second, the left peak is generally higher than the right peak in most samples, and the envelope area of the left peak is much larger than that of the right peak, indicating that the reservoir's physical property is poor, the pore throat radius is small, and the small-size pores (micro-small pores) dominate. (2) The T2 spectrum curve of middle-rank coal presents significant differences from that of high-rank coal: Compared with the dominant left peak height and envelope area of high rank coal, the right peak area of middle rank coal is relatively increased, and the height and envelope area of the left and right peak of some middle rank coal are similar. The height and envelope area of the right peak of the HA sample are even higher than those of the left peak, which means that micropores are absolutely dominant in high-rank coal (micropore dominant type). However, to a certain extent, the medium-ranking coal develops large pores (macropores and mesopores, macropores and micropores coexisting), which is consistent with the characterization results based on the previous mercury injection, nitrogen-carbon dioxide adsorption experiment [27]. (3) The left and right peaks of high-rank coal are discontinuous, and there is a clear dividing line between micropores, macro-meso pores and microfractures, indicating poor connectivity between pores at different scales, while the left and right peaks of middle-rank coal are continuous, which means that the connectivity between micropores, macro-meso pores and microfractures of middle-rank coal is better, and the pore connectivity of middle-rank coal is more developed (Figure 3).
The surface relaxation rate ρ2 is the key parameter for converting the T2 spectrum into the pore size distribution, and its calculation method can be found in Xie et al. [28], Zheng et al. [20] and Zhang et al. [29], Using the SVR method, the T2 relaxation time of the adsorption pores are first retrieved by using the pore spectrum peak of the NMR experiment. Then, the SVR value of the medium-high rank coal is obtained by BJH pore volume and BET-specific surface area from the LTN2A experiment (Table 1). Finally, the surface relaxation rate ρ2 of the medium-high rank coal is calculated by Equation (2). The adsorption peak relaxation time of medium-high rank coal is between 0.75 and 1.0 ms, and the surface relaxation rate ρ2 is between 0.08 × 10⁻⁸ and 1.78 × 10⁻⁸ m/ms. The surface relaxation rate ρ2 of medium-rank coal is between 0.43 × 10⁻⁸ and 1.78 × 10⁻⁸ m/ms, and the average surface relaxation rate ρ2 of medium-rank coal is 0.81 × 10⁻⁸ m/ms, which is slightly lower than the calculated results of Xie et al. (2015) (ρ2 = 1.18 × 10⁻⁸ m/ms) [28]. The surface relaxation rate ρ2 of high-rank coal is between 0.08 × 10⁻⁸ and 1.75 × 10⁻⁸ m/ms, with an average value of 0.55 × 10⁻⁸ m/ms, which is close to the previously calculated results of high-rank coal (0.54 × 10⁻⁸ m/ms) [28]. The surface relaxation rate ρ2 of coal samples is closely related to the coalification degree. With the increase in the coalification degree, the surface relaxation rate ρ2 of medium-high rank coal shows an overall decreasing trend (Figure 4a) [20,28]. On this basis, the conversion coefficient C of medium-high rank coal is calculated, and then the T2 spectral relaxation time distribution curve of medium-high rank coal is transformed into the pore diameter distribution curve of medium-high rank coal. The results show that micropores (<10 nm), transition pores (10–100 nm), mesopores (100–1000 nm) and macropores (>1000 nm) of medium-high rank coal accounted for 0.05~62.51% (20.11%), 7.35~71.11% (44.93%), 0.90~47.05% (19.11) and 0.03~45.27% (15.85%), respectively (Using Hodot’s (1966) aperture classification scheme) (Figure 5). With the increase in the coalification degree, the proportion of adsorption pores in medium-high rank coal increases gradually, while the proportion of mesopores and macropores fracture decreases as a whole.

3.3. Multifractal Dimension

In the continuous interval from q = −10 to q = 10, there is a linear relationship (R2 > 0.93) between the fitting curves of log χ(q,ε) and log ε for medium-high rank coal(Figure 6), which satisfies the scale invariance. The log χ(q,ε)-logε curves include two parts: the linear fitting part with a negative slope when q > 0 (the descending stage) and the linear fitting part with a positive slope when q < 0 (the near-horizontal part), indicating that the pores of middle- and high-rank coal have multifractal behavior in different pore diameter segments [30]. Second, with the increase in q, the fitting curve gradually becomes dense, which indicates that the pores of the coal sample are mainly distributed in a small interval of the characterized pore size range.
For multifractals, the slope of the curves on both sides of q = 0 changes obviously, and the pore system is not uniform. The τq of middle-high rank coal in the Qinshui coalfield presents a nonlinear increasing trend with increasing q, and the τq-q curve deviates from a straight line and presents a convex feature (Figure 7b), indicating that the pore distribution of middle-high rank coal has a multifractal feature. The generalized dimension spectrum Dq-q of medium-high rank coal can be observed as follows: a. The Dq-q spectrum of medium-high rank coal shows a monotonically decreasing inverse S-shape. As the absolute value of q increases, the Dq-q spectrum curve changes from a strong inverse S-shape to a slightly inverse S-shape and then to near level, and the slope of the fitting curve of the Dq-q spectrum decreases gradually; b. The Dq-q spectrum of medium-high rank coal intersects at the point (0,1), the capacity dimension D0 is equal to 1, the information dimension D1 is between 0.81 and 0.90, and the correlation dimension D2 is between 0.75 and 0.89 (Table 2). D0, D1, and D2 of medium-high rank coal meet the requirements of D0 > D1 > D2 [31], indicating that the pore structure of medium-high rank coal shows multifractal characteristics. Taking q = 0 as the boundary, the Dq-q spectrum of medium-high rank coal can be divided into two parts: wide branch (q < 0, sparse region mainly) and narrow branch (q > 0, dense region mainly). The shape difference of the left and right branches well reflects the complexity of the pore structure in the regions with different densities of medium-high rank coal. The wide left and narrow right of the Dq-q spectrum indicate that the pore structure in the sparse region of medium-high rank coal is more heterogeneous.
The multifractal parameters show a strong correlation, and the correlation coefficient is above 0.9 (Table 3). Second, the multifractal singular spectrum is another basic language used to describe the multifractal characteristics of the pore structure of porous media. There is a strong correlation between the parameters of the Dq-q spectrum and the f(α)-α spectrum. The f(α)-α spectrum is an equivalent mathematical description to the Dq-q spectrum, which can equally quantify the heterogeneity of the pore structure in different density regions of porous media. Both can be used to describe the multifractal behavior of pore structures [23].
The symmetry of the f(α)-α spectrum represents the difference in pore structure heterogeneity in different density regions (sparse and dense regions). When the F(α)-α spectrum is symmetric, the pore structure is homogeneous, while when it is asymmetric, the pore structure is heterogeneous. The worse the symmetry is, the stronger the heterogeneity is. The f(α)-α spectra of medium-high rank coal show a continuously convex parabola shape (Figure 7c), and the symmetry difference of f(α)-α spectra means that the pore structure of medium-high rank coal shows a multifractal behavior, with a regional high-value area (dense area) or low-value area (sparse area) of the pore volume. The results are consistent with those of the log χ(q,ε)-logε curve, τ(q)-q curve and generalized dimension spectrum D(q)-q.
Δf(Δf = f(αmin) − f(αmax)) reflects the shape characteristics of the multifractal singular spectrum (f(α) − α spectrum). If Δf < 0, f(α) is a right hook shape, the sparse region is dominant. In contrast, if Δf > 0, f(α) is left hooked, which means that dense regions dominate [8,32]. The Δf of middle-high rank coal ranges from −0.82 to −0.19 and is less than 0. The f(α)-α spectrum shows a right hook shape, indicating that the pore distribution in middle-high rank coal is dominated by sparse areas (low-value information). With α0 as the boundary, the left and right peaks of f(α) represent different variable information. The left peak α0αq+(q > 0) corresponds to a high pore volume value (dense pore volume distribution probability area) or maximum pore volume, and the right peak αqα0(q < 0) corresponds to a low pore volume value (sparse area) or minimum pore volume. The width difference Rd(Rd = (α0αq+) − (αqα0)) reflects the deviation degree of the singular spectrum. If Rd > 0, f(α) is skewed to the left, and the dense area has a significant effect on the distribution of pore space, whereas the sparse area has a significant effect on the distribution of pore space. The Rd of middle-high rank coal ranges from −1.62 to −1.48, all of which are less than 0, indicating that the sparse region has a significant influence on the distribution of pore space. α010 and α-100 correspond to the widths of the lower branch (dense region) and the upper branch (sparse region). The difference between the two widths, Δα(αmin-αmax), represents the difference in the heterogeneity of the pore distribution between dense and sparse areas, which reflects the nonuniformity of the probability measure distribution in the fractal structure of coal pores and the obvious difference in the heterogeneity of the pore structure in different density areas.
The multifractal spectrum characteristic parameters(D-10-D10(∆D), D-10-D0 and D0-D10) and the generalized dimension spectrum characteristic parameters (∆α, α0, Rd and ∆f) can be obtained from the Dq-q spectrum and f(α)-α spectrum and used to quantitatively evaluate the complexity of the pore structure in the whole pore system, sparse region and dense region. There is a positive correlation between D-10-D0 and D0-D10 and between α-10-α0 and α0-α10 in medium-high order coal(Figure 8), which means that the heterogeneity of pore structure caused by coalification occurs in both sparse and dense areas, and the values of D0-D10, D-10-D0, α-10-α0 and α0-α10 in medium-rank coal are higher than those in high-rank coal. That is, the pore structure of high-rank coal is more uniform, and the difference between different density regions is smaller (smaller ∆D and ∆α). It should be noted that the D-10-D0 and α-10-α0 values of medium-high rank coal are higher than those of D0-D10 and α0-α10 respectively, indicating that the multifractal characteristics of pore structure in sparse areas are more significant and complex than those in dense areas.

4. Discussion

4.1. Multifractal Dimension as an Indicator of Pore Structure Heterogeneity

Liu et al. (2018) elaborated on the significance of multifractal parameters [32], in which D0-D1 provided the dispersion degree information of pore distribution [8,26]. The shape of the Dq spectra and spectral width D10--D10+(ΔD) reflect the heterogeneity of the pore structure within the overall pore size of the sample. The larger ΔD is, the greater the difference in pore size distribution, the greater the local fluctuation in pore volume with pore size, and the more complex the pore structure. Otherwise, the pore structure tends to be uniform and single fractal [33,34]. The larger Δα is, the stronger the pore space variability, the more uneven the distribution and the more complex the pore structure. The larger Δα is, the stronger the pore space variability, the more heterogeneous the pore distribution and the more complex the pore structure. The f(α)-α spectrum can be used to quantify the intensity of a set consisting of subregions with similar singularities (α) (probability of occurrence) by using the singularity intensity f(α). A larger f(α) value indicates a larger proportion of the region with singular α. For the f(α)-α spectrum, f(α10) corresponds to the singular intensity of the concentrated region, and the larger the f(α10) value is, the greater the proportion of the homogeneous region. f(α-10) represents the singularity intensity of sparse regions, and the larger the value of f(α-10), the larger the proportion of heterogeneous regions. The distribution of f(α-10) and f(α10) values is significantly different in coal with different degrees of coalification.

4.2. Influencing Factors of Pore Structure Heterogeneity

With the increase in Ro,max, the value of f(α10) of medium-high rank coal gradually increases, and the value of f(α-10) gradually decreases. That is, in the process of coalification, the proportion of homogenous regions of medium-high rank coal increases and gradually dominates, while the proportion of heterogeneous regions decreases, and the pore structure of medium-high rank coal reservoirs tends to be homogenized. Therefore, it can be observed that with the increase in Ro,max, ΔD and Δα of medium-high rank coal show a decreasing trend. Generally, pore connectivity is closely related to the heterogeneity of pore structure, and a complex pore structure can effectively reduce pore connectivity. Therefore, with the increase in Ro,max, the H value of medium-high rank coal increases, and the pore connectivity of the coal seam gradually improves. Vdaf and FCad are closely related to coalification. The larger FCad is, the lower Vdaf is, and the greater the degree of coalification is. Therefore, it can be observed that the relationship between FCad and H, ΔD, Δα, Δf, f(α-10) and f(α10) is basically the same as Ro,max, while Vdaf is the opposite; that is, the higher the degree of coalification is, the more homogeneous the pore structure of the medium-high rank coal reservoir. Second, the correlation between Vdaf and FCad and multifractal parameters is relatively low compared with Ro,max. This is because Vdaf is similar to Ro,max, but it reflects the overall properties of coal samples, including various macerals, and its resolution to the degree of coalification is inferior to Ro,max (Figure 9).
Generally, the organic macromolecule structure in low-metamorphic bituminous coal is loose and reticular, and the pore structure is irregular and disordered, with many isolated pores between the chains. In the process of coalification, under the action of overlying strata pressure and geothermal heat, polycondensation and aromatization make the organic macromolecular structure of multilateral condensation, resulting in a highly ordered and parallel arrangement of aromatic planes. The rank rationality of the organic macromolecule structure is enhanced, and then the coal skeleton becomes compact, the microcrystalline structure becomes more compact, the layer spacing decreases significantly, the pore size between chains decreases, and some pores are compressed or even closed, forming a uniform pore size distribution and regular coal surface, which leads to a reduction in the heterogeneity of the pore structure of medium-high rank coal [35,36,37].
With the increase in Mad, the f(α10) value of medium-high rank coal increases, while the value of f(α-10) decreases. With the increase in Mad, the proportion of the homogeneous region gradually increases, while the proportion of the heterogeneous region decreases, the pore structure tends to be homogenized, and the pore connectivity is enhanced. Therefore, Mad is positively correlated with H and negatively correlated with ΔD, Δα and Δf (Figure 10). With the deepening of dryness (Mad decreasing), the H value of the middle-high rank coal reservoir shows a downward trend [38]. The ΔD, Δα and Δf values of medium-high rank coal show an increasing trend, which means that the increase in internal moisture in coal enhances the heterogeneity of the pore structure of medium-high rank coal while reducing its connectivity, which may be closely related to the capillary phenomenon in the pore. Under the action of capillary force, the water molecules in the medium-high rank coal adsorb on the pore surface or fill in the small size pores and throats, and the reservoir changes from the macropore-micropore coexisting type to the micropore dominant type, with narrow pore throats and homogenization of pores [39].
In coal composition, mineral content has a weak negative correlation with H and a weak positive correlation with ΔD, Δα and Δf (Figure 11), which means that the increase in mineral content enhances the complexity of pore structure and deteriorates the pore connectivity of the reservoir. Heterogeneous coal macromolecules are interlinked to form extremely rough and uneven pore surfaces [40], and most minerals accumulate and fill in the pore-fracture system of the coal matrix. Due to the influence of mineral blockage, the pore structure in coal is more complicated. Clarkson and Wilson believed that mineral filling would produce obvious protrusions and increase the irregular and disordered surface shape of coal samples [41], and the roughness of the pore surface and the complexity of the pore structure are increased. Removing the mineral particles filled in the pore can simplify the pore structure and increase the homogeneity of the pore structure.
To more clearly reveal the relationship between the coal macerals and the heterogeneity of pore structure, the correlation between V/I and multifractal parameters was analyzed. With increasing V/I, the overall H of medium-high rank coal increases, while the values of ΔD, Δα and Δf decrease (Figure 12). With the increase in V/I, the proportion of homogenous regions in the pore structure of medium-high rank coal increases and gradually dominates, while the proportion of heterogeneous regions decreases, and the pore structure tends to be homogenized; that is, compared with inertinite-rich coal, vitrinite rich coal has lower heterogeneity and better pore connectivity. This is because the micropore size difference of coal is small, and the difference in micropore volume depends on vitrinite content [42]. This result is similar to that of Lin et al. [43].

5. Conclusions

In this study, LF-NMR and maceral tests were carried out on 15 samples collected from the central and eastern Qinshui Basin. The heterogeneity of the pore structure was characterized by the multifractal method, and its influencing factors were revealed. The following conclusions were obtained:
  • The LF-NMR T2 spectrum of coal samples shows a bimodal or trimodal pattern. The high-rank coal belongs to the dominant microporous type, while the middle-rank coal belongs to the macroporous and mesoporous, macroporous and microporous coexisting type. The connectivity between micropores, macropores, mesopores and microfractures in medium-rank coal is better than that in high-rank coal.
  • The pore size distribution of medium-high rank coal has obvious multifractal characteristics, and the Dq-q spectrum has a monotonically decreasing inverse S-shape. The capacity dimension D0 is 1, the information dimension D1 is between 0.81 and 0.90, and the correlation dimension D2 is between 0.75 and 0.89. The f(α)-α spectra are continuously convex parabola shapes, Δf is between −0.82~ and −0.19, and Rd is between −1.62~ and −1.48. Sparse regions (low-value information) dominate the pore distribution and have a more significant impact on the distribution of pore space. Meanwhile, the multifractal characteristics of the pore structure in sparse regions are more significant and complex.
  • The homogeneity degree of the pore structure and pore connectivity is improved with the increase of Ro,max, Mad and vitrinite content and deteriorates with increasing mineral content and inertinite content.

Author Contributions

C.D.: Conceptualization, Methodology, Formal analysis, Resources, Writing—original draft, Writing—review and editing; X.F.: Conceptualization, Methodology, Supervision; Z.D.: Methodology, Investigation; Funding acquisition; J.K.: Methodology, Conceptualization, Writing and editing; Funding acquisition; B.Z.: Methodology, Conceptualization, Writing and editing; J.L.: Methodology, Conceptualization, Writing and editing; X.H.: Methodology, Investigation R.D.: Methodology, Investigation; X.L.: Methodology, Investigation. All authors have read and agreed to the published version of the manuscript.

Funding

The research is sponsored by the National Natural Science Foundation of China, 42202198; Natural Science Foundation of Jiangsu Province,BK20221149; the mechanism and experimental study of in situ bio gasification of coalbed methane, 2021DJ2302; the research and experiment on scale benefit development technology of deep coalbed methane in Daning-Jixian Area, 2022KT1401.

Data Availability Statement

The datasets used and/or analyzed during the current study are available from the corresponding author upon reasonable request.

Conflicts of Interest

The authors declare no conflict of interest.

References

  1. Ozdemir, E. Modeling of coal bed methane (CBM) production and CO2 sequestration in coal seams. Int. J. Coal Geol. 2009, 77, 145–152. [Google Scholar] [CrossRef] [Green Version]
  2. Clarkson, C.R.; Qanbari, F. Transient flow analysis and partial water relative permeability curve derivation for low permeability undersaturated coalbed methane wells. Int. J. Coal Geol. 2015, 152, 110–124. [Google Scholar] [CrossRef]
  3. Li, H.; Shi, S.; Lu, J.; Ye, Q.; Lu, Y.; Zhu, X. Pore structure and multifractal analysis of coal subjected to microwave heating. Powder Technol. 2019, 346, 97–108. [Google Scholar] [CrossRef]
  4. Bustin, A.M.M.; Bustin, R.M. Total gas-in-place, gas composition and reservoir properties of coal of the Mannville coal measures, Central Alberta. Int. J. Coal Geol. 2016, 153, 127–143. [Google Scholar] [CrossRef]
  5. Cui, X.; Bustin, A.M.M.; Bustin, R.M. Measurements of gas permeability and diffusivity of tight reservoir rocks: Different approaches and their applications. Geofluids 2009, 9, 208–223. [Google Scholar] [CrossRef]
  6. Zhang, R.; Liu, S.M. Experimental and theoretical characterization of methane and CO2 sorption hysteresis in coals based on Langmuir desorption. Int. J. Coal Geol. 2017, 171, 49–60. [Google Scholar] [CrossRef]
  7. Lopes, R.; Betrouni, N. Fractal and multifractal analysis: A review. Med. Image Anal. 2009, 13, 634–649. [Google Scholar] [CrossRef]
  8. Song, Z.Z.; Liu, G.D.; Yang, W.W.; Zou, H.Y.; Sun, M.L.; Wang, X.L. Multi-fractal distribution analysis for pore structure characterization of tight sandstone—A case study of the Upper Paleozoic tight formations in the Longdong District, Ordos Basin. Mar. Pet. Geol. 2018, 92, 842–854. [Google Scholar] [CrossRef]
  9. Zhao, P.; Wang, Z.; Sun, Z.; Cai, J.; Wang, L. Investigation on the pore structure and multifractal characteristics of tight oil reservoirs using NMR measurements: Permian Lucaogou Formation in Jimusaer Sag, Junggar Basin. Mar. Pet. Geol. 2017, 86, 1067–1081. [Google Scholar] [CrossRef]
  10. Gould, D.J.; Vadakkan, T.J.; Poche, R.A.; Dickinson, M.E. Multifractal and lacunarity analysis of microvascular morphology and remodeling. Microcirculation 2011, 18, 136–151. [Google Scholar] [CrossRef]
  11. Zhang, Z.; Weller, A. Fractal dimension of pore-space geometry of an Eocene sandstone formation. Geophysics 2014, 79, D377–D387. [Google Scholar] [CrossRef]
  12. Yao, Y.B.; Liu, D.M.; Che, Y.; Tang, D.Z.; Tang, S.H.; Huang, W.H. Petrophysical characterization of coals by low-field nuclear magnetic resonance (NMR). Fuel 2010, 89, 1371–1380. [Google Scholar] [CrossRef]
  13. Zheng, S.; Yao, Y.; Liu, D.; Cai, Y.; Liu, Y. Characterizations of full-scale pore size distribution, porosity and permeability of coals: A novel methodology by nuclear magnetic resonance and fractal analysis theory. Int. J. Coal Geol. 2018, 196, 148–158. [Google Scholar] [CrossRef]
  14. Lai, F.; Li, Z.; Zhang, W.; Dong, H.; Kong, F.; Jiang, Z. Investigation of pore characteristics and irreducible water saturation of tight reservoir using experimental and theoretical methods. Energy Fuels 2018, 32, 3368–3379. [Google Scholar] [CrossRef]
  15. Lai, J.; Wang, G.; Cao, J.; Xiao, C.; Wang, S.; Pang, X.; Dai, Q.; He, Z.; Fan, X.; Yang, L.; et al. Investigation of pore structure and petrophysical property in tight sandstones. Mar. Pet. Geol. 2018, 91, 179–189. [Google Scholar] [CrossRef]
  16. Lai, J.; Wang, G.; Fan, Z.; Zhou, Z.; Chen, J.; Wang, S. Fractal analysis of tight shaly sandstones using nuclear magnetic resonance measurements. Aapg Bull. 2018, 102, 175–193. [Google Scholar] [CrossRef]
  17. Lai, J.; Wang, G.; Wang, Z.; Chen, J.; Pang, X.; Wang, S.; Zhou, Z.; He, Z.; Qin, Z.; Fan, X. A review on pore structure characterization in tight sandstones. Earth-Sci. Rev. 2018, 177, 436–457. [Google Scholar] [CrossRef]
  18. Shao, X.H.; Pang, X.Q.; Li, H.; Zhang, X. Fractal analysis of pore network in tight gas sandstones using NMR method: A case study from the Ordos Basin, China. Energy Fuels 2017, 31, 10358–10368. [Google Scholar] [CrossRef]
  19. Qin, L.; Zhai, C.; Liu, S.; Xu, J.; Wu, S.; Dong, R. Fractal dimensions of low rank coal subjected to liquid nitrogen freeze-thaw based on nuclear magnetic resonance applied for coalbed methane recovery. Powder Technol. 2018, 325, 11–20. [Google Scholar] [CrossRef]
  20. Zheng, S.; Yao, Y.; Liu, D.; Cai, Y.; Liu, Y. Nuclear magnetic resonance surface relaxivity of coals. Int. J. Coal Geol. 2019, 205, 1–13. [Google Scholar] [CrossRef]
  21. Hu, Y.; Guo, Y.; Zhang, J.; Shangguan, J.; Li, M.; Quan, F.; Li, G. A method to determine nuclear magnetic resonance T-2 cutoff value of tight sandstone reservoir based on multifractal analysis. Energy Sci. Eng. 2020, 8, 1135–1148. [Google Scholar] [CrossRef] [Green Version]
  22. Halsey, T.C.; Jensen, M.H.; Kadanoff, L.P.; Procaccia, I.; Shraiman, B.I. Fractal measures and their singularities: The characterization of strange sets. Phys. Rev. A 1986, 33, 1141–1151. [Google Scholar] [CrossRef]
  23. Muller, J. Characterization of pore space in chalk by multifractal analysis. J. Hydrol. 1996, 187, 215–222. [Google Scholar] [CrossRef]
  24. Chhabra, A.; Jensen, R.V. Direct determination of the f(α) singularity spectrum. Phys. Rev. Lett. 1989, 62, 1327–1330. [Google Scholar] [CrossRef] [PubMed]
  25. Riedi, R.H.; Crouse, M.S.; Ribeiro, V.J.; Baraniuk, R.G. A multifractal wavelet model with application to network traffic. IEEE Trans. Inf. Theory 1999, 45, 992–1018. [Google Scholar] [CrossRef] [Green Version]
  26. Li, W.; Liu, H.F.; Song, X.X. Multifractal analysis of Hg pore size distributions of tectonically deformed coals. Int. J. Coal Geol. 2015, 144, 138–152. [Google Scholar] [CrossRef]
  27. Zhang, M.; Fu, X.H.; Duan, C.C.; Li, Y.S. Influencing factor analysis of the coal matrix compressibility of middle-high rank coals. J. Nat. Gas Sci. Eng. 2020, 81, 103462. [Google Scholar] [CrossRef]
  28. Xie, S.B.; Yao, Y.B.; Chen, J.Y.; Yao, W. Research of micro-pore structure in coal reservoir using low-field NMR. J. China Coal Soc. 2015, 40, 170–176. (in Chinese). [Google Scholar] [CrossRef]
  29. Zhang, Y.B.; Li, Q.G.; Hu, Q.T.; Zhai, C.; Song, M.Y.; Xu, J.Z.; Deng, Y.Z.; Liu, P.; Sun, Y.; Shi, J.L.; et al. Pore wetting process characterization of Equal-Sized granular coals by using LF-NMR technology. Fuel 2022, 313, 122670. [Google Scholar] [CrossRef]
  30. Torre, I.G.; Losada, J.C.; Heck, R.J.; Tarquis, A.M. Multifractal analysis of 3D images of tillage soil. Geoderma 2018, 311, 167–174. [Google Scholar] [CrossRef]
  31. Caniego, F.J.; Martin, M.A.; San Jose, F. Renyi dimensions of soil pore size distribution. Geoderma 2003, 112, 205–216. [Google Scholar] [CrossRef]
  32. Liu, K.Q.; Ostadhassan, M.; Zou, J.; Gentzis, T.; Rezaee, R.; Bubach, B.; Carvajal-Ortiz, H. Multifractal analysis of gas adsorption isotherms for pore structure characterization of the Bakken Shale. Fuel 2018, 219, 296–311. [Google Scholar] [CrossRef] [Green Version]
  33. Paz-Ferreiro, J.; Vazquez, E.V.; Miranda, J.G.V. Assessing soil particle-size distribution on experimental plots with similar texture under different management systems using multifractal parameters. Geoderma 2010, 160, 47–56. [Google Scholar] [CrossRef]
  34. Vazquez, E.V.; Ferreiro, J.P.; Miranda, J.G.V.; Gonzalez, A.P. Multifractal analysis of pore size distributions as affected by simulated rainfall. Vadose Zone J. 2008, 7, 500–511. [Google Scholar] [CrossRef]
  35. Zhu, J.-F.; Liu, J.-Z.; Yang, Y.-M.; Cheng, J.; Zhou, J.-H.; Cen, K.-F. Fractal characteristics of pore structures in 13 coal specimens: Relationship among fractal dimension, pore structure parameter, and slurry ability of coal. Fuel Process. Technol. 2016, 149, 256–267. [Google Scholar] [CrossRef]
  36. Naveen, P.; Asif, M.; Ojha, K. Integrated fractal description of nanopore structure and its effect on CH4 adsorption on Jharia coals, India. Fuel 2018, 232, 190–204. [Google Scholar] [CrossRef]
  37. Pan, J.; Zhu, H.; Hou, Q.; Wang, H.; Wang, S. Macromolecular and pore structures of Chinese tectonically deformed coal studied by atomic force microscopy. Fuel 2015, 139, 94–101. [Google Scholar] [CrossRef]
  38. Gao, M.; Ji, P.; Miao, Z.; Wan, K.; He, Q.; Xue, S.; Pei, Z. Pore structure evolution and fractal characteristics of Zhaotong lignite during drying. Fuel 2020, 267. [Google Scholar] [CrossRef]
  39. Zhao, L.; Ni, G.; Sun, L.; Qian, S.; Shang, L.; Kai, D.; Xie, J.; Gang, W. Effect of ionic liquid treatment on pore structure and fractal characteristics of low rank coal. Fuel 2020, 262, 117309. [Google Scholar] [CrossRef]
  40. Yi, M.H.; Cheng, Y.P.; Wang, C.H.; Wang, Z.Y.; Hu, B.; He, X.X. Effects of composition changes of coal treated with hydrochloric acid on pore structure and fractal characteristics. Fuel 2021, 294, 120506. [Google Scholar] [CrossRef]
  41. Ni, G.; Li, S.; Rahman, S.; Xun, M.; Wang, H.; Xu, Y.; Xie, H. Effect of nitric acid on the pore structure and fractal characteristics of coal based on the low-temperature nitrogen adsorption method. Powder Technol. 2020, 367, 506–516. [Google Scholar] [CrossRef]
  42. Clarkson, C.R.; Bustin, R.M. Variation in micropore capacity and size distribution with composition in bituminous coal of the Western Canadian Sedimentary Basin: Implications for coalbed methane potential. Fuel 1996, 75, 1483–1498. [Google Scholar] [CrossRef]
  43. Lin, Y.; Qin, Y.; Qiao, J.; Li, G.; Zhang, H. Effect of coalification and maceration on pore differential development characteristics of high-volatile bituminous coal. Fuel 2022, 318, 123634. [Google Scholar] [CrossRef]
Figure 1. Location of the middle-high rank coals ((a) Qinshui Basin (b) Yushe-wuxiang Block (c) Shizhuangnan Block)) (Cited from Zhang et al.).
Processes 11 00286 g001
Figure 2. The relationships between proximate analysis parameters.
Processes 11 00286 g002
Figure 3. The T2 curves of middle-high rank coals.
Processes 11 00286 g003
Figure 4. The relationships between Ro,max and the pore distribution frequency parameters. ((a) Ro,max VS ρ2 (b,c) Ro,max VS distribution frequency).
Processes 11 00286 g004
Figure 5. The pore distribution frequency of middle-high rank coals by NMR.
Processes 11 00286 g005
Figure 6. Log–log plots of the partition function versus box scale. ((a) HA sample (b) XL sample).
Processes 11 00286 g006
Figure 7. The relationship of multifractal dimension parameters ((a) Generalized fractal dimension spectrum (b) mass distribution functions τ(q) (c) multifractal singular spectrum).
Processes 11 00286 g007
Figure 8. The relationships between (a) D0-D10 vs. D-10-D0, (b) α0-α10 vs. α-10-α0 and (c) f(α-10) vs. f(α10).
Processes 11 00286 g008
Figure 9. The relationship between multifractal parameters and Ro,max and Vdaf and FCad.
Processes 11 00286 g009
Figure 10. The relationship between multifractal parameters and Mad.
Processes 11 00286 g010
Figure 11. The relationships between multifractal parameters and mineral content.
Processes 11 00286 g011
Figure 12. The relationships between multifractal parameters and vitrinite, inertinite and V/I.
Processes 11 00286 g012
Table 1. Results of proximate analysis and maceral composition.
SamplesRo,max
%
Mad
%
Ad
%
Vdaf
%
V
%
I
%
Mineral
%
BJH
cm3·g−1
BET SSA
m2·g−1
ρ2
10−8 m/ms
HA1.540.9812.6522.9350.8449.1620.530.002800.540.48
XZ1.880.8224.2029.8082.3017.7030.670.001900.440.52
SBG1.971.5115.2317.1087.7512.2514.540.002500.430.65
SYFD1.591.013.8216.0886.5913.413.480.002600.261.00
WZ1.731.125.2416.0068.3131.692.660.001600.091.78
DZ1.630.6619.4528.2968.8831.1226.630.002300.540.43
XL2.041.0213.3616.7757.0542.959.300.001100.071.75
BF-12.521.7214.069.7680.5112.297.200.000680.190.40
BF-22.591.2413.979.3578.0917.624.290.000520.150.39
BF-32.782.0712.199.5985.538.775.700.000520.150.47
GL-12.722.188.329.2988.755.425.830.000720.200.40
GL-22.712.3210.169.8377.7315.916.360.000740.210.40
YC2.591.5813.8110.8582.068.978.970.001050.250.47
CP2.591.6423.0011.9069.7415.3514.910.001802.520.08
ZZ2.482.089.7811.5079.3518.222.420.000560.120.62
Table 2. Multifractal parameters of middle- and high-rank coals.
SamplesD-10D0D1D2D10D0-D1HDα-10α0α10α0-α10α-10-α0αRd
HA3.381.000.850.810.710.1540.902.683.721.440.660.782.283.06−1.51
XZ3.071.000.890.880.830.1070.942.243.381.310.800.512.062.58−1.55
SBG3.061.000.890.880.840.1060.942.233.371.310.810.502.062.57−1.56
SYFD3.551.000.810.750.640.1930.882.913.901.510.590.922.403.31−1.48
WZ3.141.000.890.870.820.1140.932.323.451.340.800.542.122.66−1.58
DZ3.341.000.840.800.720.1560.902.623.681.430.680.742.253.00−1.51
XL3.071.000.900.880.860.1040.942.213.371.310.840.472.062.53−1.59
BF-13.011.000.900.890.880.0970.952.133.311.290.880.412.022.43−1.61
BF-23.031.000.900.890.880.0980.952.153.331.290.870.422.042.46−1.62
BF-32.991.000.900.890.880.0960.952.113.291.280.880.412.012.42−1.60
GL-13.031.000.900.890.880.0990.952.163.341.300.870.432.042.47−1.61
GL-23.051.000.900.890.870.1010.942.173.351.300.860.442.052.49−1.61
YC3.041.000.900.890.870.1000.942.173.341.300.870.432.052.48−1.61
CP3.021.000.900.890.870.0990.942.153.321.290.860.432.032.46−1.60
ZZ2.991.000.900.890.880.0950.952.113.291.280.870.412.012.41−1.60
Table 3. Correlation analysis of multifractal parameters.
ParametersD-10D1D2D10D0-D1HDα-10α0α10α0-α10α-10-α0αRd
D-101−0.981−0.989−0.9920.995−0.9890.9991.000.999−0.9840.9951.000.9970.924
D1 10.9960.986−0.9940.973−0.984−0.983−0.9840.976−0.983−0.980−0.983−0.940
D2 10.987−0.9980.980−0.989−0.990−0.9910.976−0.986−0.988−0.987−0.929
D10 1−0.9920.988−0.996−0.993−0.9920.997−0.999−0.990−0.997−0.963
D0-D1 1−0.9860.9950.9960.996−0.9820.9920.9940.9940.932
H 1−0.989−0.989−0.9890.980−0.987−0.988−0.989−0.928
D 10.9990.999−0.9910.9980.99810.940
α-10 11.000−0.9860.9960.9990.9980.928
α0 1−0.9850.9950.9990.9970.928
α10 1−0.997−0.982−0.994−0.974
α0-α10 10.9930.9990.958
α-10-α0 10.9970.918
α 10.947
Rd 1
Disclaimer/Publisher’s Note: The statements, opinions and data contained in all publications are solely those of the individual author(s) and contributor(s) and not of MDPI and/or the editor(s). MDPI and/or the editor(s) disclaim responsibility for any injury to people or property resulting from any ideas, methods, instructions or products referred to in the content.

