Article

Experimental and Calculational Study on Effects of Flow Additive on Flowability of Fine Coating Particles

1
Particle Technology Research Center, Department of Chemical & Biochemical Engineering, Western University, London, ON N6A 5B9, Canada
2
School of Chemical Engineering and Technology, Tianjin University, Tianjin 300072, China
*
Authors to whom correspondence should be addressed.
Processes 2023, 11(1), 2; https://doi.org/10.3390/pr11010002
Submission received: 2 November 2022 / Revised: 29 November 2022 / Accepted: 2 December 2022 / Published: 20 December 2022
(This article belongs to the Section Particle Processes)

Abstract

:
A method of encapsulation of inorganic additives with organic materials was developed to improve the fine power flowability and film quality for powder coating. The flowability tests angle of repose (AOR) and avalanche angle (AVA) were conducted for the coating samples to characterize the effectiveness of the encapsulated additives on group C fine powder flowability. The results show that both AOR and AVA are significantly affected by the encapsulating materials, the encapsulating material weight percentage, as well as the total loading ratios of additives added in fine powders. Polyester shows the best performance on the modification of the additive due to the high similarity to host powder coating. AOR/AVA first decreases and then decreases with the encapsulating material weight. An optimum percentage exists at approximately 10%. A similar trend is observed with the additive loading ratio, and the minimal AOR/AVA is obtained at additive loading ratios between 0.5% and 0.8%. The effective surface area coefficient (η) was introduced to improve the adhesion force model to determine the optimum additive loading ratio for various host particle and additive particle sizes, which agrees well with the experimental results.

1. Introduction

Compared to liquid coating, powder coating technology has gained high popularity, because it is not only environmentally friendly but also cost effective for its high powder recyclability and elimination of organic solvent [1,2,3]. However, traditional powder coating has some disadvantages, such as the film surface appearance being inferior to liquid coating and the film thickness being much higher than that of liquid coating. To overcome these issues, fine powder coating was introduced where the particle size of coating powder was reduced from 30~60 μm to 10~30 μm [4]. The reduction in powder size can greatly improve the film surface appearance and reduce the film thickness [4]. The film surface quality can be comparable to that of a liquid coating.
However, according to Geldart Powder Classification [5], the above stated fine powders are usually Group C powder, and their cohesive properties lead to poor flowability. The major challenge here is to improve the flowability of powders, so that the fine particles can be fluidized, pneumatically transported, and then sprayed onto substrates homogenously. There are several ways to improve the flowability of Group C powders, and for dry powder coating specifically, the effect of flow conditioner has been investigated by many researchers [6,7,8,9,10].
Certain types of nano particles are ideal to serve as flow conditioners as they can form “tree structure” with low bulk density. These nano particles can attach onto the surface of coating particles and reduce the inter-particle cohesion force between the fine particles so as to improve the flowability of the fine powders effectively. There are several types of commercial nano additives that have been successfully used in the fine powder coating industry to improve the flowability of Group C powders. However, the commercially used nano additives are usually inorganic materials, therefore they have poor compatibility and dispersibility with the organic coating powders, which can introduce film defects. There are two major types of defects: fisheyes and seeds. The former appears due to a large surface depression and the latter is formed due to the small agglomerates of additive particles. One logical way to increase the compatibility of the additives and the coating powder is to use organic nano additives to replace the inorganic; however, our previous work has shown that organic nano particles, e.g., polyester, cannot increase the flowability of fine powders effectively, and the costs of manufacturing the organic nano particles are extremely high. Therefore, it is not feasible for industrial applications. Encapsulation of inorganic nano additives with organic materials, i.e., the powder coating resins, can be a feasible way to overcome the above stated issues. On one hand, the inorganic core helps to maintain the dendritic structure and thus keep the function of flow conditioner; on the other hand, the organic shell of similar properties with the host coating increases the compatibility of additive and coating particles.
For the nano material encapsulation, there are many methods available, such as chemical vapor deposition [11,12], physical vapor deposition [13,14], sol–gel method [15,16] and anti-solvent process [17,18]. In this study, since the integrity and uniformity of encapsulation film was not the primary concern, an effective and economic process, wet encapsulation method, was adopted.
Another factor that can greatly affect the Group C powder flowability is the additive loading ratio (weight percentage of the additives). Some previous work from our group found that there is an optimum additive loading ratio at which the fine powders have the best flowability, while above which the Group C powder flowability starts to decrease [8,9,10]. This optimum loading ratio is usually determined by powder flowability test curves, e.g., angle of repose vs. additive loading ratio. Furthermore, this optimum additive loading ratio can vary depending on the host particle size, additive particle size and the fine particle material etc. There is little theoretical work, and no model is readily available to predict the optimum additive loading ratio for various additives and powders.
Several models have been proposed to calculate the adhesion force that can affect the flowability of the fine particles [19,20,21,22,23]. Those models were simplified models, only dealing with the adhesion between two particles with a single small particle in between. Chen et al. developed a method to integrate the surface area coverage (SAC) to predict the adhesion of cohesive powders, but the effect of the additive loading ratio on powder flowability was not investigated [24].
In this study, a method to encapsulate inorganic nano particles with organic materials is proposed to produce the ideal nano additive that can improve the flowability of fine powders, while having good compatibility and dispersibility with the organic fine coating powders. Three types of modified additives were produced by encapsulating the commercial nano additives with the three most widely used powder coating resins epoxy, polyester and hybrid, respectively, with a wet encapsulation method. The encapsulated additives were evaluated by TEM to ensure they were in nano scale. Functionality tests of the modified additives were conducted through the flowability measurements of fine polyurethane coating powder samples with modified additives. The angle of repose (AOR, a semi-static flowability) and avalanche angle (AVA, a semi-dynamic flowability) of the fine powder samples were tested to characterize their flowability. The effective surface area coefficient (η) was proposed to improve the adhesion force model and to predict the optimum additive loading ratio for various additive encapsulating materials and various host particle sizes. The predictions were validated with the experimental results. This paper provides a facile and efficient way to modify the flow additives and enhance their performance and also to improve the adhesion force model and the performance prediction. Both experimental and calculational study will provide guidance on the improvement and evaluation of flow additives.

2. Experiments and Methods

2.1. Materials

The paint chips of polyurethane powder were provided by Seibert Powder Coating Inc., Cleveland, OH, USA. The nano additive used in this study is nano silica (AEROSIL®R972) produced by Evonik Corporation, Essen, Germany. Three different materials, epoxy, polyester and hybrid, were used to encapsulate the additives. The detailed information of all the materials is summarized in Table 1.

2.2. Experimental Procedure

2.2.1. Additive Preparation

The wet encapsulation method was used to prepare the additives. For each material, four mass ratios were used, as shown in Table 2. Encapsulating material (epoxy, polyester or hybrid) was dissolved into acetone in a flask. After two hours of stirring (200 rpm, room temperature) and one hour ultrasound bath or till the solution became clear and transparent, the inorganic additive was added into the solution slowly and then stirring was continued until all the solvent evaporated. Then, encapsulated additive lumps were obtained. The obtained lumps from the modification step were ground to nano size by a home-made lab scale jet mill (Figure 1). Under 20 psi feeding air pressure and 20 psi working air pressure, the encapsulated nano additives were ground and collected by a HEPA collection system. After the additive preparation, twelve groups of additives were obtained and named as “resin type—resin ratio in encapsulated additive”, e.g., EY-5%, as seen from Table 2. The morphology of modified additive was observed by TEM (TEM, JEOL 2011, JEOL Ltd., Tokyo, Japan).

2.2.2. Coating Powder Preparation and Characterization

Fine polyurethane powder (FPP) was employed as host powder in this study. A lab scale air classifying mill ACM (ACM-03, Donghui, China) was used to grind the chips down into a fine powder with D50 = 22 μm, as shown in Figure 2.
The coating powder samples were prepared by mixing the fine polyurethane powder and the modified additives. To ensure the particle size of polyurethane powder and additives fully mixed, the powder samples were sieved by ultrasonic vibrating screen (325 mesh) twice after mixing FPP samples with additives manually. For each encapsulating material, the additives were coated under four material-to-additive mass ratios, and the additives were mixed with the fine polyurethane powder under five loading ratios. In total, 66 fine polyurethane coating powder (FPP) samples were prepared for flowability testing, as listed in Table 3. The FPP coating films are defined as “FPP-additive name” or “FPP-additive loading” under different conditions, e.g., FPP-EY-5% or FPP-LOA0.3%. The scanning electron microscopy (S-2600N Scanning Electron Microscope, Hitachi Ltd., Tokyo, Japan) was used to obtain images of powder coating samples.

2.3. Evaluation of Powder Flowability

2.3.1. Angle of Repose

Angle of repose (AOR) for each sample was measured by powder characteristic tester (PT-N Powder Characteristic Tester, Hosokawa Micron Powder Systems Co., Summit, NJ, USA). The standard test procedures (ASTM D6393-08) for bulk solids characterization were followed during the test. For each powder sample, this procedure was repeated 3~6 times and three data sets with differences smaller than 0.6 were selected. The average of the three data points were calculated for the tested sample. The schematic of AOR measurement is shown in Figure 3.

2.3.2. Avalanche Angle

Avalanche angle (AVA) was measured by a powder analyzer (Revolution Powder Analyzer, Mercury Scientific Inc., Newtown, CT, USA). For the AVA test, a tapped volume of 120 mL of powder was placed into a 11 cm diameter, 3.5 cm wide cylindrical drum, a standard accessory of the Revolution Powder Analyzer. Then, the drum with powder inside was set to rotate at various rotation speeds by two high-precision silicone rollers controlled by a step motor. The behavior of the powder inside the drum whose rotation speed was set at 0.6 rpm was recorded by a digital camera with the assistance of backlight illumination. During the rotation process, 200 avalanches occurred in the drum and average AVA was obtained by a computer with manufacture supplied software. The schematic of AVA measurement is shown in Figure 4.

3. Results and Discussion

3.1. Effect of Encapsulating Materials

The particle sizes and structures of additive before and after encapsulation with the 15 wt% polyester are characterized by TEM under 130 k magnification in Figure 5. Figure 5a shows the “tree structure” of the commercial nano silica before encapsulation, while Figure 5b shows that the “tree structure” is still remained after encapsulation and the additive particle size is increased but still in nano scale. The existence of the “tree structure”, which is considered to be the functional structure as flow conditioner [25], indicates that the encapsulated additives still have the function as flow conditioners.
Both the AOR and AVA results are compared under three different encapsulating materials with the additive loading ratio 0.8 wt%, as shown in Figure 6. Polyester, as an additive modification material, shows the best performance on improving the flowability, while the epoxy modified additive shows the worst performance. Since the components of hybrid are epoxy and polyester, the performance of this material on improving flowability of FPP samples is in the middle, better than FPP-EY samples but worse than FPP-PE group. This is because the host powder is FPP, whose main component is polyester resin. When the host powder and additive encapsulating materials are of higher similarity, the flowability is more enhanced. It can also be seen that when the R-E ratio is on the low end (5%), the difference on AOR/AVA among three different materials is small, only approximately 0.1~0.2°, while such difference becomes larger with increasing R-E ratios.

3.2. Effect of R-E Ratio on Flowability of FPP Samples

Figure 7 shows the effect of the resin-to-encapsulating material (R-E) ratio on the AOR and AVA under the specific additive loading ratio. As shown in Figure 7a, all the sample groups have similar trends with various LOAs: AOR decreases with the increase of the R-E ratio of epoxy to a minimum value when the epoxy R-E ratio is approximately 5~10% range. After that, with the increase of the R-E ratio of epoxy (10~20%), AOR increases gradually. There exists a minimum AOR at approximately 10% R-E ratio of epoxy. The similar trends can also be observed for different R-E ratios of polyester and hybrid, as shown in Figure 7b,c. AOR decreases with increasing R-E ratio of encapsulating material from 0% to 10% and then increases after this R-E ratio. The only difference between Figure 7a and the other two graphs is the decreasing rate of AOR with epoxy resin is slightly lower than that with the other two materials, when the R-E ratio is lower than 10%.
Figure 7d–f show the AVA value as a function of specific R-E ratio under the specific additive loading ratio. It is observed that all the sample groups have similar trends with various R-E ratios. Taking Figure 7d as an example, AVA decreases with the increase of the R-E ratio of epoxy to a minimum value when the R-E ratio of epoxy is in 5~10% range. After that, with the increase of R-E ratio, from 10% to 20%, AVA increases gradually. The minimum AVA exists between 5% and 10% R-E ratio. The similar trends can also be observed for different R-E ratio of polyester and hybrid, as shown in Figure 7e,f. AVA decreases with increasing R-E ratio from 0% to 5%, and an optimum AVA existing between 5% and 10% of encapsulating material, then increases with the increase of R-E ratio.
From the above stated findings, both the AOR and AVA of FPP samples can be controlled by changing the R-E ratio. The modified additives could out-perform the control group with proper encapsulated material ratios, e.g., 5% and 10%.

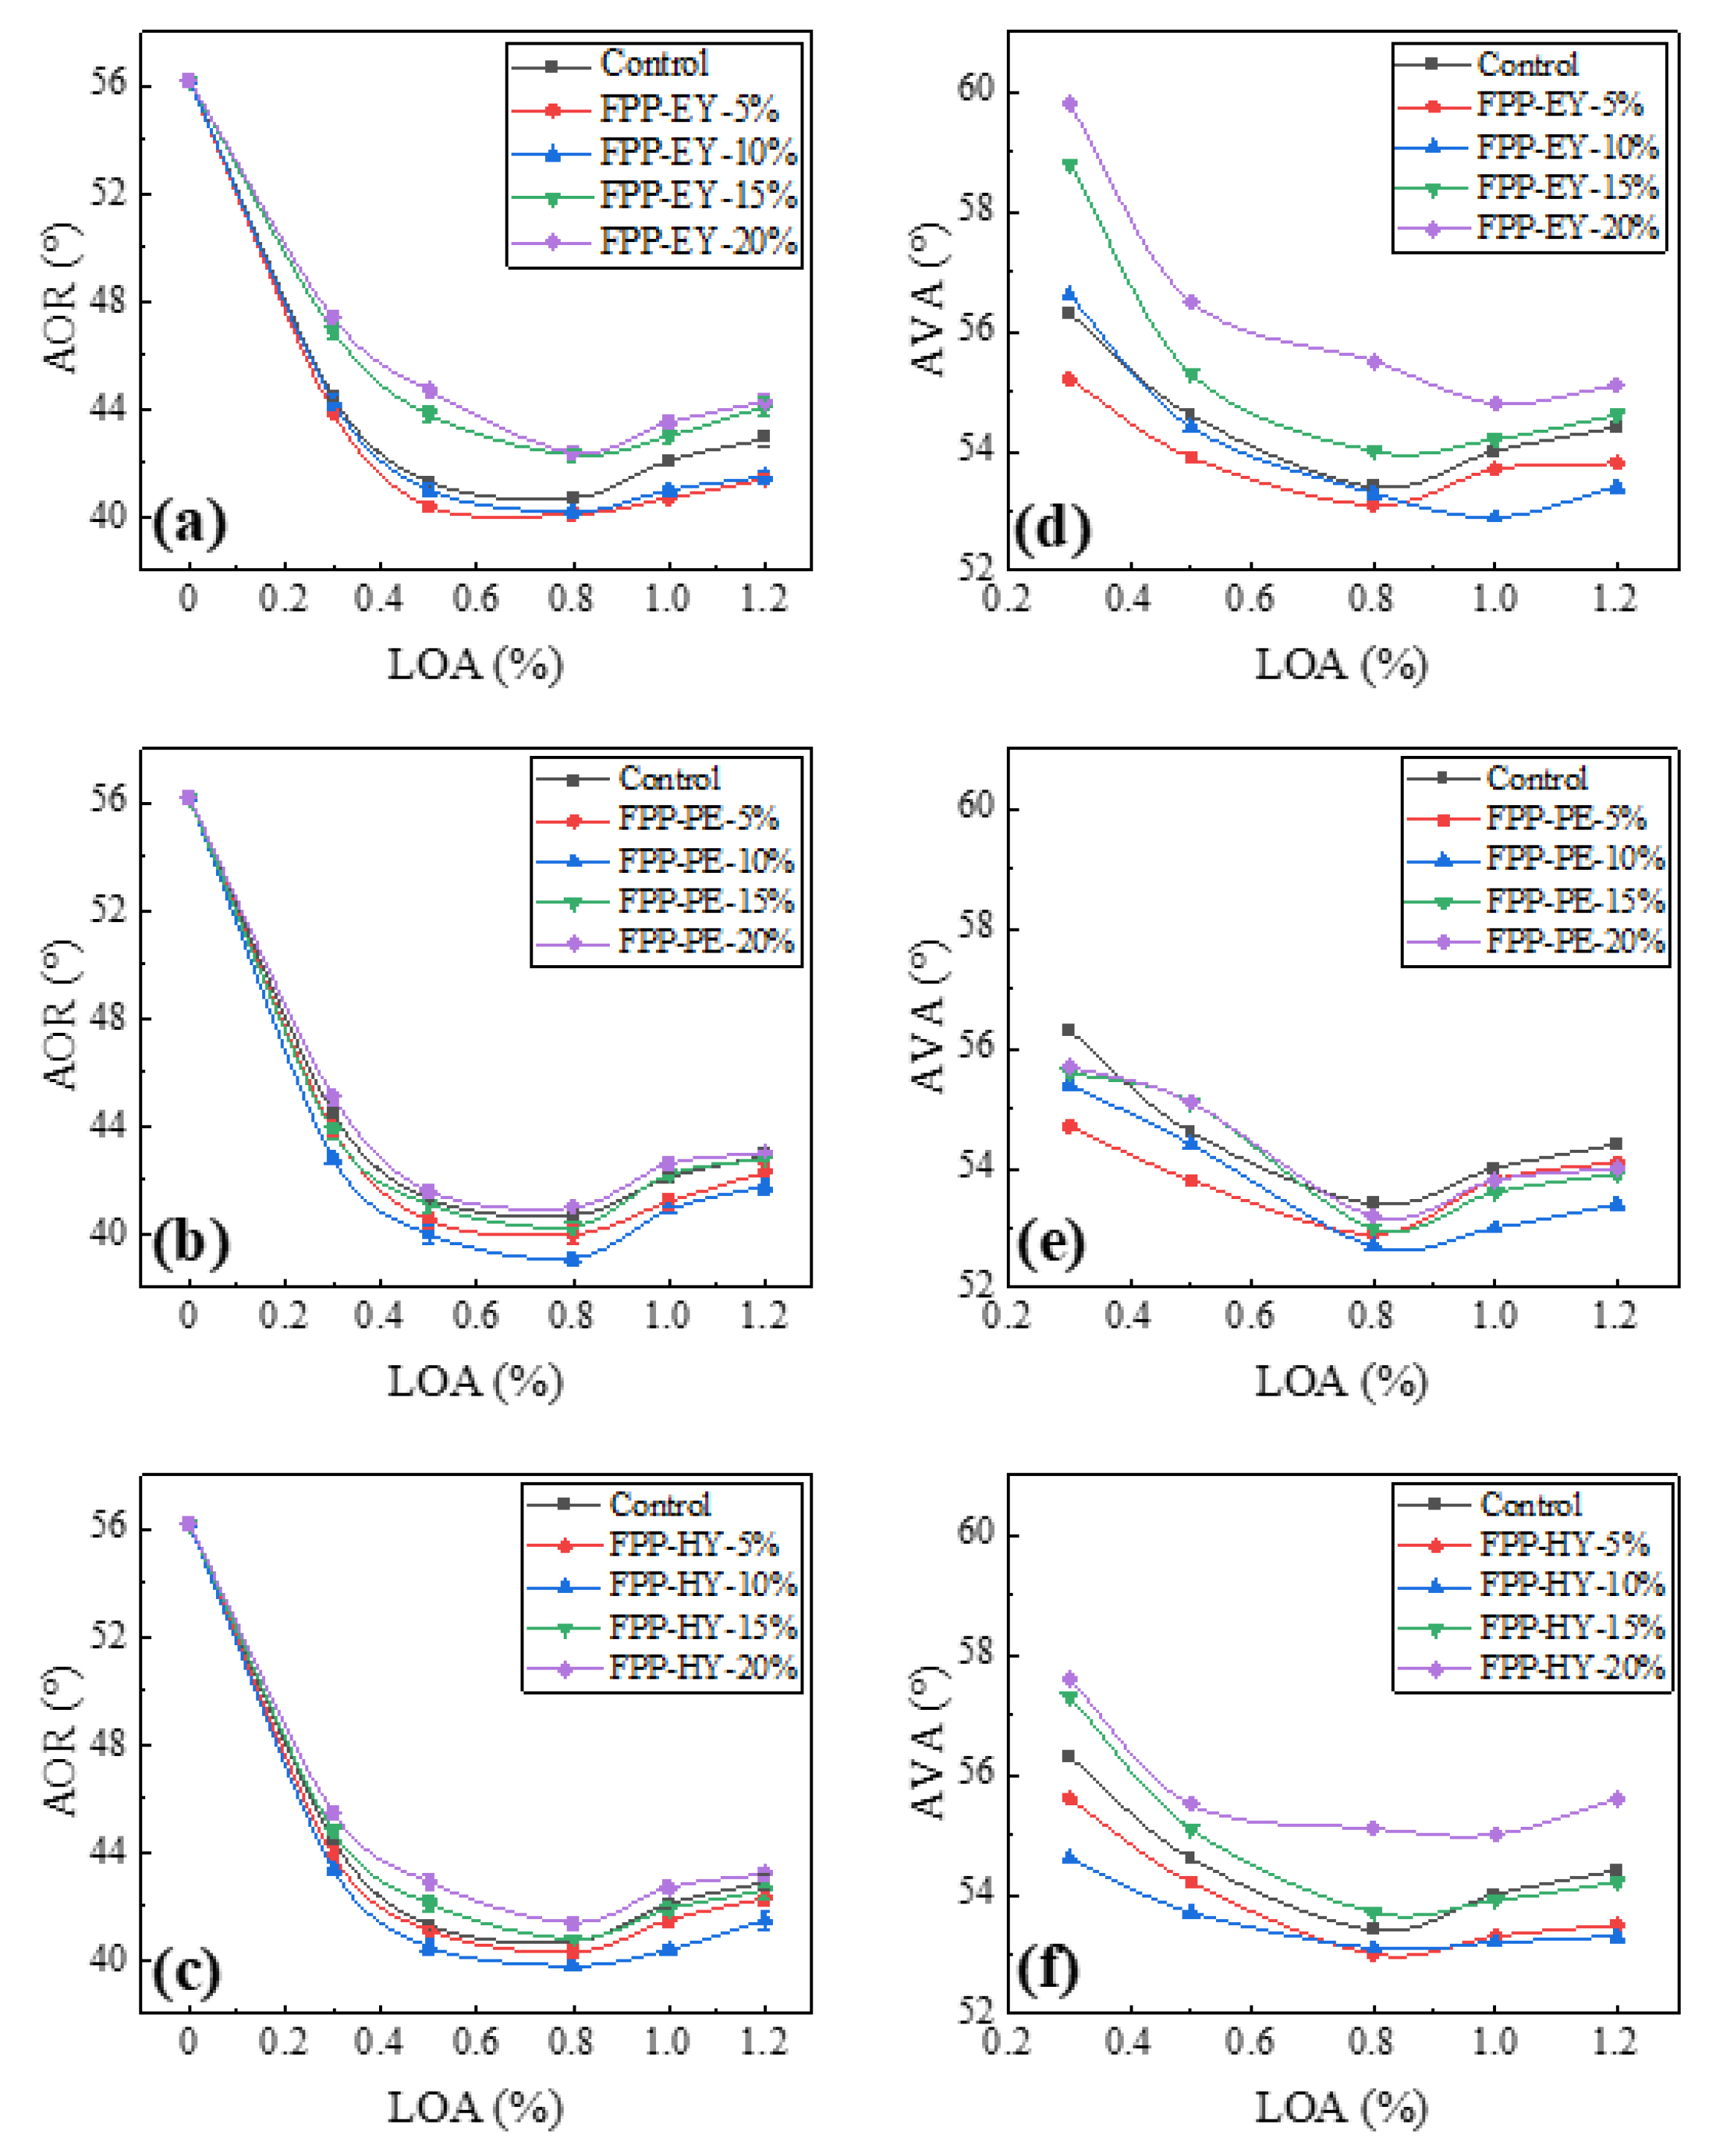
3.3. Effect of Additive Loading Ratio on Flowability of FPP Samples

AOR variations as a function of the additive loading ratio are shown in Figure 8a–c for all three encapsulating materials and the control group which is with the pure nano silica without modification. One can note that for all samples with the encapsulated additives, AOR have similar variation trend compared to the control group. Initially, AOR decreases drastically with increasing additive loading ratio, e.g., 0~0.5%; then, AOR only decreases slightly to a minimum value when additive loading ratio increases to a critical value (0.5~0.8%); after that, AOR starts to increase with increasing additive loading ratio (0.8~1.2%). It is also clear that for each sample, there is a minimum AOR existing between additive loading ratios of 0.5% and 0.8%, which corresponds to the optimum additive loading ratio. Such observations agree with the previous studies on the commercial additives [8,9,10], indicating that the modified additives are still as functional as the additives without modification, regardless of the type of encapsulating materials.
AVA variations as a function of the additive loading ratio are shown in Figure 8d–f. It is worth mentioning that AVA cannot be tested for the pure FPP sample without adding additive, due to its poor flow property, therefore a small dosage of additives (0.3 wt%) were added to the fine powder sample. One could note that for all samples with the encapsulated additives, AVA has similar patterns in its variations with the control group. Initially, AVA decreases gradually with the increase of additive loading ratio, from 0.3% to 0.8%; then, AVA only decreases slowly until the additive loading ratio increases to a critical value (0.6~0.8%); after that, AVA starts to increase with increasing additive loading ratio (0.8~1.2%) slightly. There is an optimum additive loading ratio, which corresponds to the minimum AVA value, and it is between 0.8% and 1.0%. Such observation agrees with the AOR test results stated above, indicating that there should be a correlation between AVA and AOR.
The relationship of the avalanche angle (AVA) and angle of repose (AOR) is shown in Figure 9 for different LOA, different encapsulating materials and various R-E ratios. There is a linear correlation between these two parameters, indicating that AVA can be represented by AOR and vice versa. By fitting all the data points, the mathematical expression of this linear correlation could be obtained. The error of this correlation is only ±3%. No discontinuity is observed for all the loading ratios of the additive groups.
To explain the variation of AOR/AVA trends at different loading ratios, SEM images of FPP particle surfaces with different additive loading ratios can provide more insights as shown in Figure 10. At low additive loading ratios (0.3%), the additives attach to the surface of the fine coating particle sporadically (Figure 10a). By increasing the additive loading ratio to 0.5% (Figure 10b), more additives appear on the surface of the particles. However, there are still many uncovered particle surfaces. When the additive loading ratio increases from 0.5% to 1.0% (Figure 10c), the additives occupy the whole particle surface. These SEM images indicate that when the loading ratio of the additives increases from 0.3% to 1.2% (Figure 10d), the number of the additive particles increases drastically, which leads to a significant increase in the additive surface area due to its nano scale size, so that the additive surface area must be taken into consideration because the adhesion force between the particles is closely related to the surface areas of both host particles and additive particles. At low additive loading ratio, the total additive surface area is much lower than the total powder particle surface area, which is still the dominant factor. At this stage, AOR and AVA decrease drastically as shown in Figure 8. When increasing the additive loading ratio, the additive surface area is also increasing, while the exposed surface area of host particles is decreasing so that the surface area of the additives is approaching the surface area of the fine particles. Correspondingly, AOR decreases slightly (Figure 8). Keep increasing the additive loading ratio to one critical value, the additive surface area equals to the particle surface area and then beyond. The additive surface area becomes the dominant factor. At this stage, AOR starts to increase.

3.4. Modeling of Cohesion Force of Fine Particles with Flow Additives

The experimental results show that both the AOR and AVA of the fine powder decrease drastically and then decrease to minimum values with increasing additive loading ratio; after that, they start to increase with increasing additive loading ratio. Meanwhile, for all samples, those minimum values appeared to be between 0.5% and 0.8% additive loading ratios. Such flowability variation was explained by the surface area ratio between the host particles and the additive particles. To validate the stated theory, the detailed force analysis and mathematical modeling were discussed quantitatively.
The geography of the combination of the host particles (fine coating particles) and the guest particles (additive particles) are quite complicated, as seen in Figure 10. As it is extremely challenging to count the forces exerted on each individual particle, not to mention the interactions between the particles, some assumptions were made that the individual additive particles of monosized spheres are evenly coated on the host particle surface and there is an available surface area of host particles not covered by additive and other host particles on the host particles.
Guest particles, whose particle size is much smaller than that of host particles, can be introduced to increase the distance of two host particles (H0), therefore reducing the van der Waals force. A 3D model, three guest particles (distributed on the vertices of an equilateral triangle) forming the gap between the two host particles stably [24], was established, as shown in Figure 11.
The major adhesion force, van der Waals force, between the two host particles can be expressed as [26]:
F van = AR 12 H 0 2
where A is the Hamaker Constant (10−19 J), R is the host particle size, and H0 is the distance between two host particles’ surfaces.
As the surface area S is the target parameter to discuss in this study, Equation (1) expressed in terms of surface area S as:
F van = A 12 H 0 2 4 π R 2 4 π R = A 12 H 0 2   ·   4 π R S = A 48 π H 0 2 R S
Equation (2) is for the simplest scenario of surface area S. In reality, with an increase of the additive particle loading ratio, more additive particles adhere to the host particle surface, so that the exposed surface area of the host particles decreases with increasing additive loading ratio until it is entirely covered by the additive particles (at this stage, the available surface area of the host particles is zero), whereas the surface area of the additive particles on each host particle increases with increasing guest particle loading. Therefore, surface area coverage (SAC) of host particles is introduced, and the total effective surface area (SHG) can be expressed as:
S HG = S host 1 SAC + η S guest
where Shost is the surface area that is not covered by the additive particles and η is the effective surface area coefficient to estimate the surface area of the additive particles that is not covered by the other (guest and host) particles, and the Sguest is the total surface area of the additive particles associated with each host particle.
Then, the adhesion force is expressed as:
F van , HG = A 48 π H 0 2 R S HG
The Surface Area Coverage (SAC) can be calculated in a similar method as reported by [24]:
SAC = π d 2 4 N 4 π d + D 2 2 N × d 2 4 D 2 × 100 %
This implies that the loading ratio of the guest particle (LOA) is:
LOA = Nd 3 ρ d D 3 ρ D + Nd 3 ρ d × 100 %
where ρ d is the density of guest particle and ρ D is the density of host particles.
Combining Equations (5) and (6), the relation between the loading ratio and SAC can be obtained as:
SAC = D ρ D · LOA d ρ d 1 LOA
One should note that at a critical additive loading ratio, the maximum value for SAC is 100%. At this point, the exposed surface of the host particle is zero because it is entirely covered by the additive particles. This critical additive loading ratio can be calculated from Equation (7). Even if the loading ratio is increasing beyond the critical value, the SAC remains at 100%, as shown in Table 4. However, the effective surface area (SHG) of additive particles would still increase.
The distance between host particles [24] can be calculated as:
H 0 = D + d 2 1.21 SAC d 2 D
With Equations (4)–(8), the adhesion force can be calculated. Figure 12 shows the variation of the adhesion force as a function of additive loading ratio under different effective surface area coefficient (η). It can be observed that the variation of the adhesion force agrees well with the variation of AOR and AVA results. The adhesion force decreases drastically until a minimum value with the additive loading ratio reaches a critical value and then increases with increasing additive loading ratio. The optimum additive loading ratio is 0.7%, which agrees with the optimum additive loading ratio observed by experiments. It is worth mentioning that for all effective surface coefficients, the critical additive loading ratio is constant at 0.7% so that the effective surface area coefficient only affects the absolute value of the adhesion force but has little effect on the critical additive loading ratio.
Figure 12 also shows that with different effective surface area coefficient (η), the adhesion force may shift up or down. However, all the minimum adhesion force values correspond to the same critical loading ratio of the additives. Such findings can explain the variations shown in Figure 7 and Figure 8. As the surface area coefficient (η) is related to the surface properties of the additives, different encapsulation materials and their loading ratio correspond to different surface area coefficient (η). In this case, 10% PE corresponds to the lowest surface area coefficient (η) so that the adhesion force is the lowest. Accordingly, the flowability is best, as seen in Figure 7 and Figure 8.
From the above discussions, the proposed adhesion force model can serve well to predict the optimum loading ratio of additives independent of the effective surface area coefficient. The predicted results agree well with the experimental results. Then, the effect of the fine powder particle size on the optimum additive loading ratio can be predicted.
From Equation (1), one can see that the van der Waals force increases with increasing host particle size (R). However, such effect on van der Waals force is also related (inversely proportional) to gravity. Therefore, to properly evaluate the force between the fine particles, a dimensionless parameter α is introduced, which was defined as van der Waals force (Fvan,HG) divided by gravity (G), as shown in Equation (9).
α = F v a n , H G G
The dimensionless parameter α between fine particles as a function of the loading ratio of additives for four different sizes of fine powders are plotted in Figure 13 under fixed additive size (16 nm) with fixed effective surface area coefficient (0.1). It can be observed that the optimum additive loading ratios (corresponding to the minimum dimensionless force) are not the same anymore when the host powder particle sizes are different. A larger host particle has a lower optimum additive loading ratio and vice versa. For example, the optimum additive loading ratios are 0.4%, 0.5%, 0.7% and 1% for host particles that have particle sizes of 45, 28, 22 and 16 μm, respectively.
A series of semi-dynamic flowability tests (AVA) were performed on 22 μm and 30 μm coating powders to validate the above discussed model. As shown in Figure 14, the optimum additive loading ratio is approximately 0.5% for 30 μm coating particles under the model of fixed guest particle size (16 nm) and fixed effective surface area coefficient (0.1), while for 22 μm particles, the optimum additive loading ratio is approximately 0.7%. Compared with the experimental flowability results, the optimum additive loading ratios is approximately 0.5% and 0.8% for 30 μm and 22 μm particles, respectively, which indicates the predicted results agree well with the experimental results. Consequently, the adhesion model facilities the quick estimation of the optimum loading ratio of the additives and provides the guidance for the fine powder processing with additives.

4. Conclusions

A major objective of this work is to examine the effectiveness of the encapsulation of inorganic additives with organic materials to improve fine power flowability and film quality for powder coating. Both the AOR and AVA tests show that encapsulated nano silica are still as functional as the commercial nano silica additive. For fixed additive loading ratio, AOR/AVA decreases to a minimum value and then increases gradually with the increase of the R-E ratio. There is an optimum R-E ratio existing (approximately 10%). By comparing all the three encapsulating materials, polyester shows the best performance on the modification of the additive for fine polyurethane powder. The additive loading ratio has a significant effect on the powder flowability. Initially, AOR/AVA decreases dramatically with increasing additive loading ratio; then, AOR/AVA only decreases slightly to a minimum value when additive loading ratio increases to a critical value; after that, AOR/AVA starts to increase with increasing additive loading ratio. For all samples, there is a minimum AOR/AVA existing between 0.5% and 0.8% additive loading ratios, which are corresponding to the optimum additive loading ratio.
Based on the experimental results, an improved cohesion force mathematical model, which takes into consideration the host powder particle size, additive particle size, loading ratio of additive and the surface area of the host particles and additives, is proposed. With this model, the AOR and AVA variations and optimum loading ratio of additive can be well explained. Most importantly, the optimum loading ratio of additive can be predicted by this cohesion force model quantitatively for various host particle sizes. A lower optimum additive loading ratio for a larger host particle size and a larger optimum additive loading ratio for a smaller host particle size are predicted.

Author Contributions

Conceptualization, J.Z. and H.Z. (Hui Zhang); methodology, H.Z. (Hui Zhang); software, D.B. and J.X.; validation, H.Z. (Hui Zhang), H.Z. (Haiping Zhang) and D.B.; formal analysis, D.B.; investigation, D.B. and L.S.; resources, H.Z. (Hui Zhang); data curation, D.B.; writing—original draft preparation, D.B.; writing—review and editing, H.Z. (Hui Zhang) and H.Z. (Haiping Zhang); visualization, J.X.; supervision, H.Z. (Hui Zhang); project administration, J.Z.; funding acquisition, H.Z. (Hui Zhang). All authors have read and agreed to the published version of the manuscript.

Funding

This research was funded by Evonik Corporation (USA) and the Natural Sciences and Engineering Research Council of Canada (NSERC), Discovery Grant RGPIN-2018-06256.

Data Availability Statement

Not applicable.

Conflicts of Interest

The authors declare no conflict of interest.

References

  1. Xie, J.; Zhang, H.; Shao, Y.; Bao, D.; Zhang, H.; Zhu, J. Investigation of the performance of fumed silica as flow additive in polyester powder coatings. Coatings 2020, 10, 977. [Google Scholar] [CrossRef]
  2. Licari, J.J. Coating Materials for Electronic Applications: Polymers, Processing, Reliability, Testing; William Andrew: Norwich, NY, USA, 2003. [Google Scholar]
  3. Fu, J.; Krantz, M.; Zhang, H.; Zhu, J.; Kuo, H.; Wang, Y.M.; Lis, K. Investigation of the recyclability of powder coatings. Powder Technol. 2011, 211, 38–45. [Google Scholar] [CrossRef]
  4. Zhu, J.; Zhang, H. Ultrafine powder coatings: An innovation. Powder Coat. 2005, 16, 39–47. [Google Scholar]
  5. Geldart, D. Types of gas fluidization. Powder Technol. 1973, 7, 285–292. [Google Scholar] [CrossRef]
  6. Dixit, K. Flow Improvement of Fine Propellant Powder Using Nano-Additives. Ph.D. Thesis, Indian Institute of Technology Gandhinagar, Palaj, Indian, 2016. [Google Scholar]
  7. Han, M.; Zhou, Y.; Zhu, J. Improvement on flowability and fluidization of Group C particles after nanoparticle modification. Powder Technol. 2020, 365, 208–214. [Google Scholar] [CrossRef]
  8. Zhou, Y.; Zhu, J. Group C+ particles: Enhanced flow and fluidization of fine powders with nano-modulation. Chem. Eng. Sci. 2019, 207, 653–662. [Google Scholar] [CrossRef]
  9. Xu, C.C.; Zhang, H.; Zhu, J. Improving flowability of cohesive particles by partial coating on the surfaces. Can. J. Chem. Eng. 2009, 87, 403–414. [Google Scholar] [CrossRef]
  10. Huang, Q.; Zhang, H.; Zhu, J. Flow properties of fine powders in powder coating. Particuology 2010, 8, 19–27. [Google Scholar] [CrossRef]
  11. Oku, T.; Niihara, K.; Suganuma, K. Formation of carbon nanocapsules with SiC nanoparticles prepared by polymer pyrolysis. J. Mater. Chem. 1998, 8, 1323–1325. [Google Scholar] [CrossRef]
  12. Chen, D.; Colas, J.; Mercier, F.; Boichot, R.; Charpentier, L.; Escape, C.; Balat-Pichelin, M.; Pons, M. High temperature properties of AlN coatings deposited by chemical vapor deposition for solar central receivers. Surf. Coat. Technol. 2019, 377, 124872. [Google Scholar] [CrossRef]
  13. Zhang, Y.; Zhang, Q.; Li, Y.; Wang, N.; Zhu, J. Coating of carbon nanotubes with tungsten by physical vapor deposition. Solid State Commun. 2000, 115, 51–55. [Google Scholar] [CrossRef]
  14. Annat, S.; Rashtchi, H.; Atapour, M.; Golozar, M.A.; Elmkhah, H.; Zhiani, M. Preparation and performance of nanometric Ti/TiN multi-layer physical vapor deposited coating on 316L stainless steel as bipolar plate for proton exchange membrane fuel cells. J. Power Sources 2019, 435, 226818. [Google Scholar]
  15. Ruys, A.J.; Mai, Y.W. The nanoparticle-coating process: A potential sol-gel route to homogeneous nanocomposites. Mater. Sci. Eng. A 1999, 265, 202–207. [Google Scholar] [CrossRef]
  16. Bitaraf, M.; Ghazi, M.E.; Izadifard, M. Studying Structural and Optical Properties of TiO2 -SnO2 Core-Shell Synthesized by Sol-Gel Route. Cryst. Res. Technol. 2020, 55, 1900145. [Google Scholar] [CrossRef]
  17. Wang, Y.; Dave, R.N.; Pfeffer, R. Polymer coating/encapsulation of nanoparticles using a supercritical anti-solvent process. J. Supercrit. Fluid. 2004, 28, 85–99. [Google Scholar] [CrossRef]
  18. Wang, M.; Fu, Y.; Chen, G.; Shi, Y.; Li, X.; Zhang, H.; Shen, Y. Fabrication and characterization of carboxymethyl chitosan and tea polyphenols coating on zein nanoparticles to encapsulate β-carotene by anti-solvent precipitation method. Food Hydrocoll. 2018, 77, 577–587. [Google Scholar] [CrossRef]
  19. Johnson, K.L.; Kendall, K.; Roberts, A.D. Surface energy and the contact of elastic solids. Proc. R. Soc. London. A Math. Phys. Sci. 1971, 324, 301–313. [Google Scholar]
  20. Derjaguin, B.V.; Muller, V.M.; Toporov, Y.P. Effect of contact deformations on the adhesion of particles. J. Colloid Interface Sci. 1975, 53, 314–326. [Google Scholar] [CrossRef]
  21. Podczeck, F. Particle-Particle Adhesion in Pharmaceutical Powder Handling; World Scientific: London, UK, 1998. [Google Scholar]
  22. Peng, M.; Han, X.; Xiao, G.-Z.; Chen, X.-L.; Xiong, W.; Yang, K.-Y.; Luo, H. Spherical volume elements scheme for calculating van der Waals force between irregular particles and rough surfaces. Chin. J. Phys. 2021, 72, 645–654. [Google Scholar] [CrossRef]
  23. Shang, X.-Y.; Zhao, K.; Qian, W.-X.; Zhu, Q.-Y.; Zhou, G.-Q. On the Calculation of Van der Waals Force between Clay Particles. Minerals 2020, 10, 993. [Google Scholar] [CrossRef]
  24. Chen, Y.; Yang, J.; Dave, R.N.; Pfeffer, R. Fluidization of coated group C powders. AIChE J. 2008, 54, 104–121. [Google Scholar] [CrossRef]
  25. Zhu, J.; Zhang, H. Fluidization Additives to Fine Powders. U.S. Patent WO2004007594A1, 22 January 2004. [Google Scholar]
  26. Hamaker, H.C. The London—Van der Waals attraction between spherical particles. Physica 1937, 4, 1058–1072. [Google Scholar] [CrossRef]
Figure 1. Picture of home-made lab scale jet mill.
Processes 11 00002 g001
Figure 2. SEM image of fine polyurethane powder (D50 = 22 μm).
Processes 11 00002 g002
Figure 3. Schematic of AOR measurement.
Processes 11 00002 g003
Figure 4. Schematic of AVA measurement.
Processes 11 00002 g004
Figure 5. TEM images of additives (130 k magnification). (a) The commercial nano silica before encapsulation; (b) The nano silica after encapsulation by polyester at R-E ratio of 15%.
Processes 11 00002 g005
Figure 6. Effects of encapsulating materials at LOA of 0.8%. (a) AOR; (b) AVA.
Processes 11 00002 g006
Figure 7. Effects of R-E ratio on AOR and AVA. (a, d) FPP-EY; (b, e) FPP-PE; (c, f) FPP-HY.
Processes 11 00002 g007
Figure 8. Effects of LOA on AOR and AVA. (a, d) FPP-EY; (b, e) FPP-PE; (c, f) FPP-HY.
Processes 11 00002 g008
Figure 9. Correlation between semi-static and semi-dynamic flowability of fine coating powder under different LOA.
Processes 11 00002 g009
Figure 10. SEM images of 10% Epoxy with different LOA. (a) 0.3%; (b) 0.5%; (c) 1.0%; (d) 1.2%.
Processes 11 00002 g010
Figure 11. (a) Contact of fine coating particle and additive particles; (b) Location of additive particles.
Processes 11 00002 g011
Figure 12. Van der Waals force vs. LOA under various effective surface area coefficient.
Processes 11 00002 g012
Figure 13. Dimensionless force between particles vs. LOA for different host particle size (η = 0.1).
Processes 11 00002 g013
Figure 14. Effects of LOA on flowability of fine particles under different host particle size (η = 0.1). (a) 22 μm; (b) 30 μm.
Processes 11 00002 g014
Table 1. List of materials used in this study.
MaterialsTypeSuppliers
Powder coatingsPolyurethane--Seibert
Commercial AdditiveNano-SilicaAEROSIL®R972Degussa
Modification MaterialsEpoxyD.E.R.™ 661Dow
PolyesterCRYLCOAT®2689-0Cytec
HybridCRYLCOAT 316Cytec
D.E.R.™ 672UDow
Table 2. List of additive samples.
Additive NameEncapsulating ResinResin-to-Encapsulated Additive Ratio (R-E Ratio)
EY-5%Epoxy5%
EY-10%Epoxy10%
EY-15%Epoxy15%
EY-20%Epoxy20%
PE-5%Polyester5%
PE-10%Polyester10%
PE-15%Polyester15%
PE-20%Polyester20%
HY-5%Hybrid5%
HY-10%Hybrid10%
HY-15%Hybrid15%
HY-20%Hybrid20%
Table 3. List of 66 FPP samples.
Encapsulating ResinResin Ratio in Encapsulated Additive (R-E Ratio)Loading Ratio of Additive (LOA)
Control Samples000.3%0.5%0.8%1.0%1.2%
Epoxy5%-0.3%0.5%0.8%1.0%1.2%
10%-0.3%0.5%0.8%1.0%1.2%
15%-0.3%0.5%0.8%1.0%1.2%
20%-0.3%0.5%0.8%1.0%1.2%
Polyester5%-0.3%0.5%0.8%1.0%1.2%
10%-0.3%0.5%0.8%1.0%1.2%
15%-0.3%0.5%0.8%1.0%1.2%
20%-0.3%0.5%0.8%1.0%1.2%
Hybrid5%-0.3%0.5%0.8%1.0%1.2%
10%-0.3%0.5%0.8%1.0%1.2%
15%-0.3%0.5%0.8%1.0%1.2%
20%-0.3%0.5%0.8%1.0%1.2%
Table 4. SAC of host particle covered by additives.
Loading RatioSACSHG (×1010 m2)
0.01%1.4%15.08
0.3%42.9%11.28
0.5%71.7%8.64
0.7%100%6.04
0.8%100%6.94
1.0%100%8.68
1.2%100%10.41
Disclaimer/Publisher’s Note: The statements, opinions and data contained in all publications are solely those of the individual author(s) and contributor(s) and not of MDPI and/or the editor(s). MDPI and/or the editor(s) disclaim responsibility for any injury to people or property resulting from any ideas, methods, instructions or products referred to in the content.

