Article

Investigation of Island Growth on Fluidized Particles Coated by Means of Aerosol

1
Thermal Process Engineering, Otto von Guericke University, Universitätsplatz 2, 39106 Magdeburg, Germany
2
Industrial Chemistry, Otto von Guericke University, Universitätsplatz 2, 39106 Magdeburg, Germany
*
Authors to whom correspondence should be addressed.
Processes 2023, 11(1), 165; https://doi.org/10.3390/pr11010165
Submission received: 13 December 2022 / Revised: 29 December 2022 / Accepted: 3 January 2023 / Published: 5 January 2023
(This article belongs to the Special Issue Computational and Experimental Study of Granulation in Fluidized Beds)

Abstract

:
In this study, an aerosol fluidized bed is used to coat particles. A new aerosol generator is used to obtain coating solution droplets with a diameter of around 1 μ m or smaller. Glass particles, which have a mean diameter of 653 μ m, were the non-porous core material and the coating solution was sodium benzoate. Scanning electron microscope pictures were analyzed by MATLAB image processing for evaluating the coverage with the curvature effect. Monte Carlo simulation was used to describe the coating of fluidized particles by aerosol droplets. The purpose of this work was the determination of possible island growth on particles, and investigation of the reasons of it by comparing the experimental and simulation results. The preferential deposition of droplets on already occupied positions is seen as the main possible reason for island growth.

1. Introduction

In many industries, such as the chemical, pharmaceutical, and food industries, the process of particle coating is widely used for protective or functional purposes [1,2,3]. The coating quality (e.g., surface coverage, coating layer thickness, coating porosity, and coating uniformity) has importance for functionality. For a better understanding of the relation between process conditions and the functionality of coated particles, precise identification of coating quality is required [4].
Coating of particles in spray fluidized bed (SFB) is an established industrial process that is continually improved by the increasing availability of respective mathematical models and experimental methods [1,4,5,6]. However, SFB coatings are usually thick and coarsely structured. Indeed, the droplets produced by two-fluid nozzles or pressure nozzles in an SFB are in the range of 20 to 150 μ m, with 40 μ m being a typical mean droplet size [7,8]. SFB coatings are usually around 30 μ m or thicker due to the fact that the droplets are large. Piezoelectric, ink-jet printing nozzles could be alternative atomizers to reduce the droplet size but they are limited in their ability to provide large throughputs of high solid content liquids. In this case, existing SFB technologies are not suitable to produce core-shell or encapsulated particles with an ultrathin and high-resolution coating for the chemical, pharmaceutical, biochemical, and biomedical industries [9].
By contrast, ultrathin and high-resolution coating (potentially nanoscale and nanostructured) can be expected in aerosol fluidized beds (AFB). Existing wet technologies can also provide extremely thin coating, but they have serious limitations as they cannot easily be scaled up and are not applicable for bulk material. In contrast to wet processing, dry particles will be directly produced by AFB coating at low cost, the process being unconditionally scalable. Moreover, much smaller droplets than in regular sprays would prevent agglomeration, which is an issue in conventional SFBs [1].
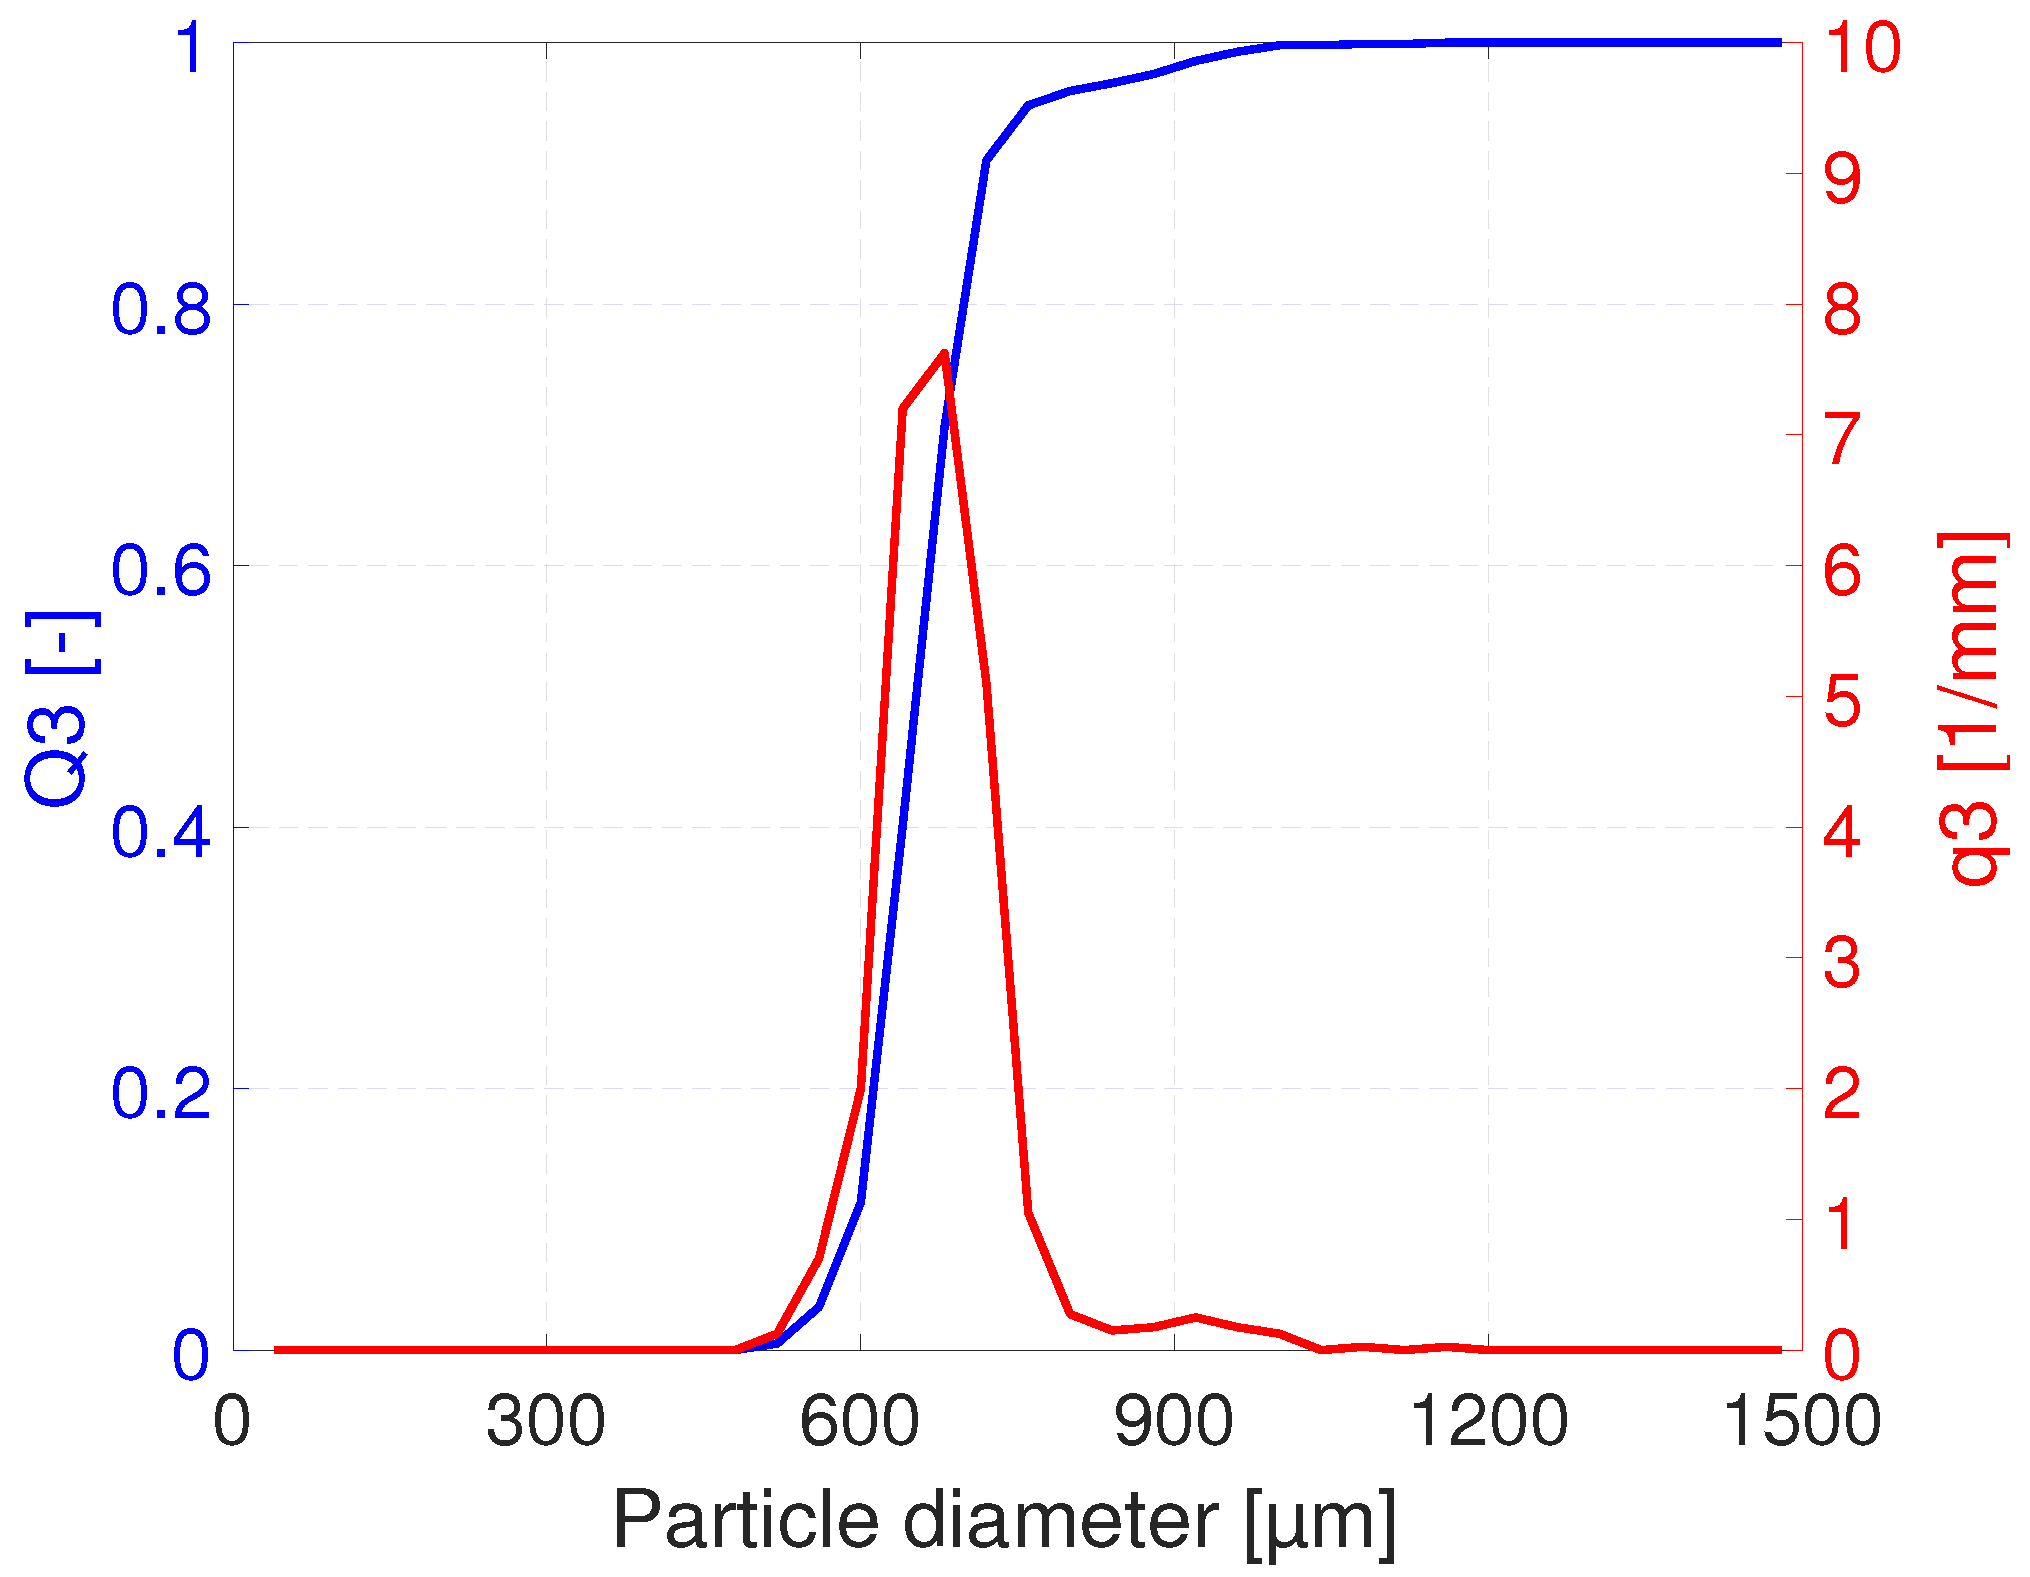
On the other hand, the process of AFB coating is in its infancy, with just a couple of investigations having been published on this process. In a proof of principle, Mezhericher et al. [9] studied the AFB coating on big porous particles (the particle material was γ -Al 2 O 3 and the mean particle size was 638 µm). The pressure of air in the aerosol generator was 1.5 bar (gauge), the fluidization air temperature was 50 °C. In that study, they showed that no agglomeration occurred in the experiment, as expected (as Rieck et al. [10] pointed out that the agglomeration tendency is decreasing with decreasing size of the droplets). They compared the AFB coating results with SFB coating results and concluded that processing time is short and coating is ultrathin with AFB, compared to SFB, due to small aerosol droplets. Subsequently, Zhang et al. [1] studied the aerosol coating in a Wurster fluized bed. They used fine core glass particles (mean particle size was 63 μ m) and changed the process parameters to explore the effect of them on coating. Based on that study, a higher temperature of fluidization air favors drying but leads to rapid evaporation of droplets before they deposit on particles.
Both previous investigations provided some indications that droplet deposition may not be random during early coating, but without further analysis. Therefore, the present work is the first to more systematically investigate the aspect of potential island growth of coated spots before the attainment of full surface coverage. From the point of view of protective coating quality, island growth is unfavorable, but patchy particles may be highly interesting for other applications, for example as catalysts [11]. Goulas and van Ommen [12] studied atomic layer deposition (ALD) of platinum to produce catalytically active nanoparticles. Cao et al. [13] studied composite catalyst design and synthesis by selective ALD. Notably, these studies are about atomic layers, whereas literature about island growth caused by droplet deposition on surfaces is missing. Since there might be a certain analog between those two processes, mechanisms of atomic layer growth may be of interest. In this respect, the Frank–van der Merwe, Volmer–Weber, and Stranski–Krastanov modes of atomic layer growth are known [14,15]. In the Frank–van der Merwe mode, coating atoms have stronger interaction with the core particle surface than with each other. This leads to complete coating monolayer formation on the surface before another coating layer starts to grow, which can be assumed as the optimum growing mode. By contrast, in the Volmer–Weber mode, the coating atoms have stronger interaction with each other than with the core particle surface. This leads to preferential deposition onto already covered positions of the core particle [16]. Clusters or islands may occur on the core particle surface in this case. In the Stranski–Krastanov mode, the growth takes place in an intermediate form [14,15].
The purpose of this work is to investigate the island growth during the coating of particles by means of aerosol. First, aerosol generation, experimental conditions and characterization methods after sampling are explained. Then, a Monte Carlo (MC) simulation method is presented and adapted with the goal of simulating aerosol coating. A comparison of experimental and simulation results for random droplet deposition proves the existence of island growth. We show that MC simulations which take the preferential deposition of aerosol droplets on already occupied positions of the particle surface into account agree well with experimental results and can, thus, explain the island growth.

2. Materials, Experimental Methods, Characterization

2.1. Aerosol Generation

There are many commercially available atomization devices, such as pressure nozzles, rotary atomizers, air-assisted atomizers, airblast atomizers, and ultrasonic and electrostatic atomizers [17]. Some drawbacks of these atomizers are high atomization energy requirements, use of electromagnetic fields, low droplet flow rate, big droplet size, and limited scalability and controllability. In this paper, for coating particles using aerosol, the aerosol generator by Mezhericher et al. [18,19] was used, because of its simplicity, robustness, and potential to produce very small droplets with eventually any liquid.
An elastic rubber tube is the main part of the atomizer. There are several perforations along the periphery of the elastic tube at several axial positions. This elastic tube is placed horizontally. The upper half part of it, which has two perforations, is subject to air, whereas the lower half part of the elastic tube, which also has two orifices at every axial position with perforations, is immersed in the coating solution in a vessel.
Compressed air is supplied to the elastic rubber tube inside the atomizer vessel and discharged through the perforations on the elastic tube. The compressed air that is discharged from the lower part of the elastic tube creates many small bubbles inside the coating solution. These small bubbles then ascend to the coating solution surface and are surrounded by thin liquid films near the upper part of the elastic tube. These liquid film envelopes collapse and break by the air coming from the upper part of the elastic tube. Aerosol droplets are generated as a result of these disintegrating liquid films on the upper part of the elastic tube. Coating solution from another vessel was provided to the aerosol generator by a peristaltic pump to keep the coating solution in the aerosol generator vessel on approximately the same level. For the experiments, the same aerosol generator as in Mezhericher et al. [9], which was developed based on this principle, was used.
The aerosol generator’s specific configuration was: Tube: polyvinyl chloride (PVC) hose, 8 mm inner diameter, 12 mm outer diameter, 220 mm length, bent to a circle; Perforations: by 6 mm needle, 4 in a cross-section (equidistant), 36 perforated cross-sections with 144 orifices in total; Liquid level: between the two top and the two bottom orifices (semi-batch operation with fixed atomizer hose and incremental liquid refill by pumping); Air: 1.5 bar gauge pressure, flow rate not measured; Basin: 170 mm inner diameter, 185 mm height; Flexible plumbing (around 40 mm inner diameter) to the side inlet (30 mm inner diameter) of the fluidization chamber, placed about 45 mm high from the air distributor plate; Droplet size: around 1 μ m volume-based droplet diameter (with many sub-micron droplets, the relative amount of which increases with increasing gauge atomization air pressure) [9].

2.2. Materials

2.2.1. Core Particles

Spherical glass particles (Cerablast GmbH, Löchgau, Germany) were used as core material in the coating experiments. The diameter range of the particles was between 500 μ m and 700 μ m. The particle size distribution was measured offline by CAMSIZER-XT (Retsch Technologies, Germany).
The mean diameter was 653 μ m (Figure 1), the sphericity of the core particles was 0.953 and the density of core particles was 2500 kg/m 3 .

2.2.2. Coating Solution

For coating the glass particles, aqueous sodium benzoate (NaB, C 7 H 5 NaO 2 , Trigon Chemie GmbH, Schlüchtern, Germany) solution, which has a mass fraction of 30% NaB, was used in these experiments. NaB is a common preservative in the food industry, but it is also used in academic research as a coating agent [1]. The density and viscosity of the solution at 20 °C are 1128 kg/m 3 and 0.0039 Pa·s, respectively.

2.3. Fluidized Bed Coating Process

The coating experiments were performed in a laboratory-scale fluidized bed from the Glatt company (GPCG 1.1, Glatt Ingenieurtechnik GmbH, Weimar, Germany). Some modifications were made to make the fluidization chamber cylindrical comparable to the original conical equipment. Only batch processes can be realized in this experimental plant. The cylindrical fluidized chamber has a diameter of 150 mm and 450 mm in height. The mean pore size of the gas distributor plate is 100 μ m and it is made of sintered metal to achieve uniform fluidization conditions [20].
In this study, large particle size and experimental conditions were suitable for avoiding undesirable agglomeration in the process, as Mezhericher et al. [9] showed. Additionally, to prevent big aerosol droplets (which may cause clogging and agglomeration in the system) from reaching the particles, a relatively long aerosol inlet tube was used; see Figure 2. Big droplets cannot reach the highest altitude in this tube, because of large gravitational force acting on them. Big droplets, therefore, fall back into the aerosol generator and only small droplets can pass and reach the fluidized particles. For this purpose, a 145 cm long flexible and serrated tube is used for the aerosol inlet to the fluidized bed for the coating experiments. This way, agglomeration can be suppressed completely. On the other hand, some droplets may be collected on the tube wall due to the tube’s serrated structure and accumulate during the process to form liquid films, which may lead to a reduction of the yield of the process.
Before starting the coating process, 1 kg of core particles were placed in the fluidized bed. After closing the process chamber, hot air was sent to the fluidized bed to make the particles fluidize. The mass flow rate of the hot fluidization air was 65 kg/h. After the set fluidization air inlet temperature had been stabilized, the coating solution was provided to the fluidized bed from the aerosol generator. The total operation time was 1 h and every 10 min an approximately 10 g sample was taken from the sample holder located on the front side of the fluidized bed. After 1 h, the experiment was finished. The operating parameters are summarized in Table 1. The experiment with the same operating parameters was repeated one more time. Therefore, two identical experiments were performed in total.

2.4. Characterization Methods

A CAMSIZER-XT (Retsch Technologies, Germany) was used to determine the particle size distribution and characterize the core particles. A scanning electron microscope (SEM, Phenom G2 Pro) was used for taking pictures of particles.
Because of the curvature of particles, there are blurred parts on the SEM pictures near the circular border of the particle. To prevent wrong coverage calculation, the outer 30% (based on diameter) of the particle pictures have been removed by MATLAB image processing, which means only the central part of the original images has been used, that is where the radius was 70% of the initial radius of particle. Furthermore, the curvature effect needs to be considered while calculating the coverage since, as can be seen in Figure 3; the pictures from the scanning electron microscope are planar but the particles are spherical. The correction from the projected area of particle ( A 2 D from the SEM picture) to the surface area of the 3D particle ( A 3 D ) has been made to eliminate this effect, using the curvature index
i c u r v = A 3 D A 2 D .
The central area of the picture (70% based on diameter) was divided into 10 equal areas (segments), the 3D areas were calculated with curvature effect for each of them and summed up to calculate the total 3D relative coverage of the particle in same way as in Zhang et al. [1],
C 3 D = 1 j ( A c o a t e d , 2 D , j i c u r v , j ) 1 j ( A t o t a l , 2 D , j i c u r v , j ) .
Here, j is segment number, A c o a t e d , 2 D , j is coated projected area of the segment j, A t o t a l , 2 D , j is total projected area of the segment j, and i c u r v , j is curvature index of the segment j.
For further quantification and better comparison with simulation results, the coating process yield needed to be calculated. For this purpose, one more experiment with the same operating parameters was performed, just to calculate the coating process yield as follows: five samples were taken from the product at the end of the process. To obtain the dry mass of coated particles, each of them was put in a normal oven and dried for 12 h. Then, they were soaked in water for 24 h to remove the NaB coating completely. The samples were dried in the oven again for 24 h to measure the core particles mass of each of them. The coating process yield can be calculated as the ratio of the mass of coating on the particles after the process to the mass of coating provided by the aerosol (from the mass of liquid fed to the atomization vessel during the experiment). All the values are summarized in Section 4.3.

2.5. Sampling and Post-Processing

After taking samples from the fluidized bed throughout the two identical coating processes, sample particles were sputtered with gold before their SEM pictures were taken. Three particle images were chosen randomly from each sample (in total, six particle images from the two experiments at identical conditions for each time step). Figure 3 shows SEM pictures of a core glass particle and one of the patchy coated particles. The scale bar of SEM was 200 μ m for all particles. The contrast and the light have been set individually for every particle to detect coated parts as well as possible. Each picture had a resolution of 1024 × 1024 pixels.
After acquiring the SEM images, MATLAB was used to determine the coating coverage percentage as explained in Section 2.4.

3. Monte Carlo Simulation

3.1. Adaption of Rieck’s Monte Carlo Model for Use with Aerosol

Monte Carlo (MC) simulations will be used to obtain a better understanding of the coating process by means of aerosol. The starting point is a Monte Carlo model presented by Rieck et al. [7] for coating with conventional spray in SFBs. This model was already used for AFB coating by Mezhericher et al. [9], but in a way that needs to be improved. In Mezhericher et al. [9], simulations were run with 1 μ m aerosol droplets at 100% yield. Computational time was overwhelmingly long (around 16 h [9]), though just one particle was in the simulation box, since the number of positions on one particle was huge because of the small aerosol droplet diameter. Therefore, it was not possible to obtain any results on interparticle uniformity by simulation for several particles of the population by this MC model. In the present study, the existing MC model according to Rieck et al. [7] was modified to enable intraparticle as well as interparticle evaluation of aerosol coating, and to reduce the computational time.
In the model by Rieck et al. [7], the Monte Carlo simulation took into account the drying time of droplets after deposition on particles for each time step. The length of the time step was calculated from the frequency of the event, which is droplet deposition. The frequency was directly proportional to the number flow rate of droplets, and the length of the time step was inversely proportional to the frequency. Therefore, in Rieck’s model, the time step was very small, due to the huge number flow rate of aerosol droplets. Moreover, the model was checking the state of deposited droplets (whether dry or wet) in every time step, which also has a computational cost. The simulation finished when the process time had been reached after enough time steps. To reduce the computational time and cost, the new Monte Carlo simulation model was designed based on the number of aerosol droplets used in a given process time, by considering a particle scaling factor, but also the process yield and a surface scaling factor. In this new model, the drying time of the droplets is not taken into account, and it is assumed that droplets are completely dried just after deposition on particles. Consideration of the time period in which a deposited droplet has not yet dried out makes sense when possible agglomeration on such wet spots is an issue. Otherwise, same results are obtained (see Section 4.4, later on). The simulation finishes when the number of droplets has been reached. Figure 4 shows the MC algorithm of the present model.
The calculation steps of the algorithm which is based on the number of used aerosol droplets are as follows: 1. Calculation of the total number of aerosol droplets produced in the real system using the number flow rate of aerosol droplets and given process time; 2. Calculation of the total number of the effective droplets in the real system using the process yield; 3. Calculation of the total number of the effective droplets in MC simulation using particle scaling factor; 4. Calculation of the total number of the effective droplets in MC simulation by surface down-scaling. By surface down-scaling, the number of positions on the particle is reduced to a minimum that can represent the whole particle surface, which leads to a reduction of computational cost and time. To conduct step 3 and step 4 above, particle scaling factor has been defined as the ratio of the number of particles in the MC box ( N p , M C ) to the number of particles in the real process ( N p , r e a l ),
S p a r t i c l e = N p , M C N p , r e a l .
Surface scaling factor is defined as the ratio of the number of positions on one particle in the MC box ( N p o s , M C ) to the number of positions on one particle in the real process ( N p o s , r e a l ),
S s u r f a c e = N p o s , M C N p o s , r e a l .
Apart from computation time, another aspect touched by the number of positions is the definition of full coverage time ( t 100 % ). According to Rieck et al. [7], this is the time when the last empty position on the particle has been filled by a droplet. This obviously depends on the number of positions, as the results of Figure 5a show. The coefficient of variance (CoV) of the full coverage time is 30%; this means that full coverage time strongly depends on the number of positions on the particle. This dependence has, expectedly, an increasing trend. A relative definition of full coverage time that does not depend on numerical resolution of the surface would be desirable, especially since the number of positions simulated has been reduced in this study to save computational time and cost. Therefore, the full coverage time has been newly defined as the time needed to cover 99.8% of the particle surface. With 500 positions on one particle in the simulation, this corresponds to 499 occupied positions. With this relative definition, the dependence between full coverage time and the number of positions disappears, as shown in Figure 5b. With the new definition, the coefficient of variance (CoV) of full coverage time has been reduced to 3.8%. In this way, a definition of full coverage time, which does not depend on the simulated positions on particle, has been obtained.
Regarding the number of particles in the simulation box, to ensure reasonable computational time and accuracy, Terrazas-Velarde et al. [21] suggest that it should lie between 1000 and 2000. Furthermore, Zhao et al. [22] recommend a sample size in the order of 1000 particles. Here, test runs with 1000 and 2000 particles in the MC box were conducted, resulting in practically identical evaluations with time. However, the simulation time for 2000 particles was around 3.6 times more than the simulation time for 1000 particles. Therefore, 1000 has been selected as the number of particles in the MC box for the further analysis.
One of the properties which are distributed in the population of particles is full coverage time, depending on its definition. Respective probability distributions are illustrated in Figure 6. The mean value of the full coverage time for 1000 particles is shifted to the left with the new definition, as expected. CoVs were 18.4% and 13.9% for Rieck’s and the new definition, respectively. So with the new full coverage time definition, a narrower distribution is obtained.
A summary of the simulation parameters is shown in Table 2, and these parameters have been used for aerosol coating simulations.

3.2. Model Extension for Preferential Deposition of Droplets on the Already Occupied Positions

Droplet deposition on surface positions was random in the previous Monte Carlo model [7], which means without any preference for already occupied or still empty positions. In this study, an extension of the model was made to enable MC simulations for the preferential deposition of droplets. It will be explained by starting with a simple analytical derivation for random deposition and then going to preferential deposition and its implementation in MC simulations.
The change in coverage area, A, with time, t, for random deposition can be expressed as:
d A d t = ( 1 A ) A ˙ ,
where A ˙ is the coverage area growing rate that would correspond to the droplet deposition rate. The solution of Equation (5) is obtained as:
A = 1 e A ˙ t .
The notion behind Equation (5) is that when N d droplets deposit on the particle surface, A N d of them will deposit on already covered positions and ( 1 A ) N d will deposit on empty positions, corresponding to
A N d + ( 1 A ) N d = N d .
Former droplets do not contribute to the increase in surface coverage, which is only due to latter droplets. Consequently, the slope of the coverage area growth can be expected to decrease when droplets prefer to be deposited on already occupied positions rather than on empty ones. Therefore, to obtain an analytical solution for preferential deposition, Equation (5) was divided by ( x + 1 ) with x 0 , to reduce the slope:
d A d t = 1 A x + 1 A ˙ .
The solution of Equation (8) is:
A = 1 e ( A ˙ t ) / ( x + 1 ) .
Here, x is a preference for deposition on already existing deposits. At any time t, x = 0 means that droplets randomly deposit on the particle surface (as in Equation (5)). When preference x tends to infinity, the covered area change tends to zero ( d A / d t = 0), since droplets always deposit on already occupied positions, and this does not change the coverage.
In an analogy to Equation (7), the following split of the same pool of in total N d droplets applies in case of preferential deposition on the already occupied part of the particle surface:
x + A ( x + 1 ) A A N d + 1 x + A ( x + 1 ) A A N d = N d .
The square brackets term in Equation (10) simplifies to the multiplier of A ˙ in Equation (8). Therefore, to account for preferential deposition in MC simulation, x + A ( x + 1 ) A A N d of coming droplets must be made to deposit on already covered positions and 1 x + A ( x + 1 ) A A N d of coming droplets must be let deposit on empty positions on particle surface. Therefore, the same number of droplets is deposited on the surface as before (as in random deposition) for every time step, but the deposited droplets are not randomly distributed on the particle surface.
The preference x is, thus, an input parameter in MC simulation. After calculating the split of droplet deposition between already occupied and empty positions on the surface (based on Equation (10)) for each time step, random numbers have been used to select the specific particle and the specific positions (from the pool of occupied and empty positions separately) on which droplets will be deposited.
It needs to be noted that all of the coming droplets deposit on empty positions on particles in the first time step, since in the beginning (t = 0) there are no occupied positions and the coverage area A is also zero. The coming droplets are more likely to choose to deposit on occupied positions if the preference x is increased.

4. Results and Discussion

4.1. Preliminary Remarks

In this study, experimental results have been obtained with the parameters shown in 
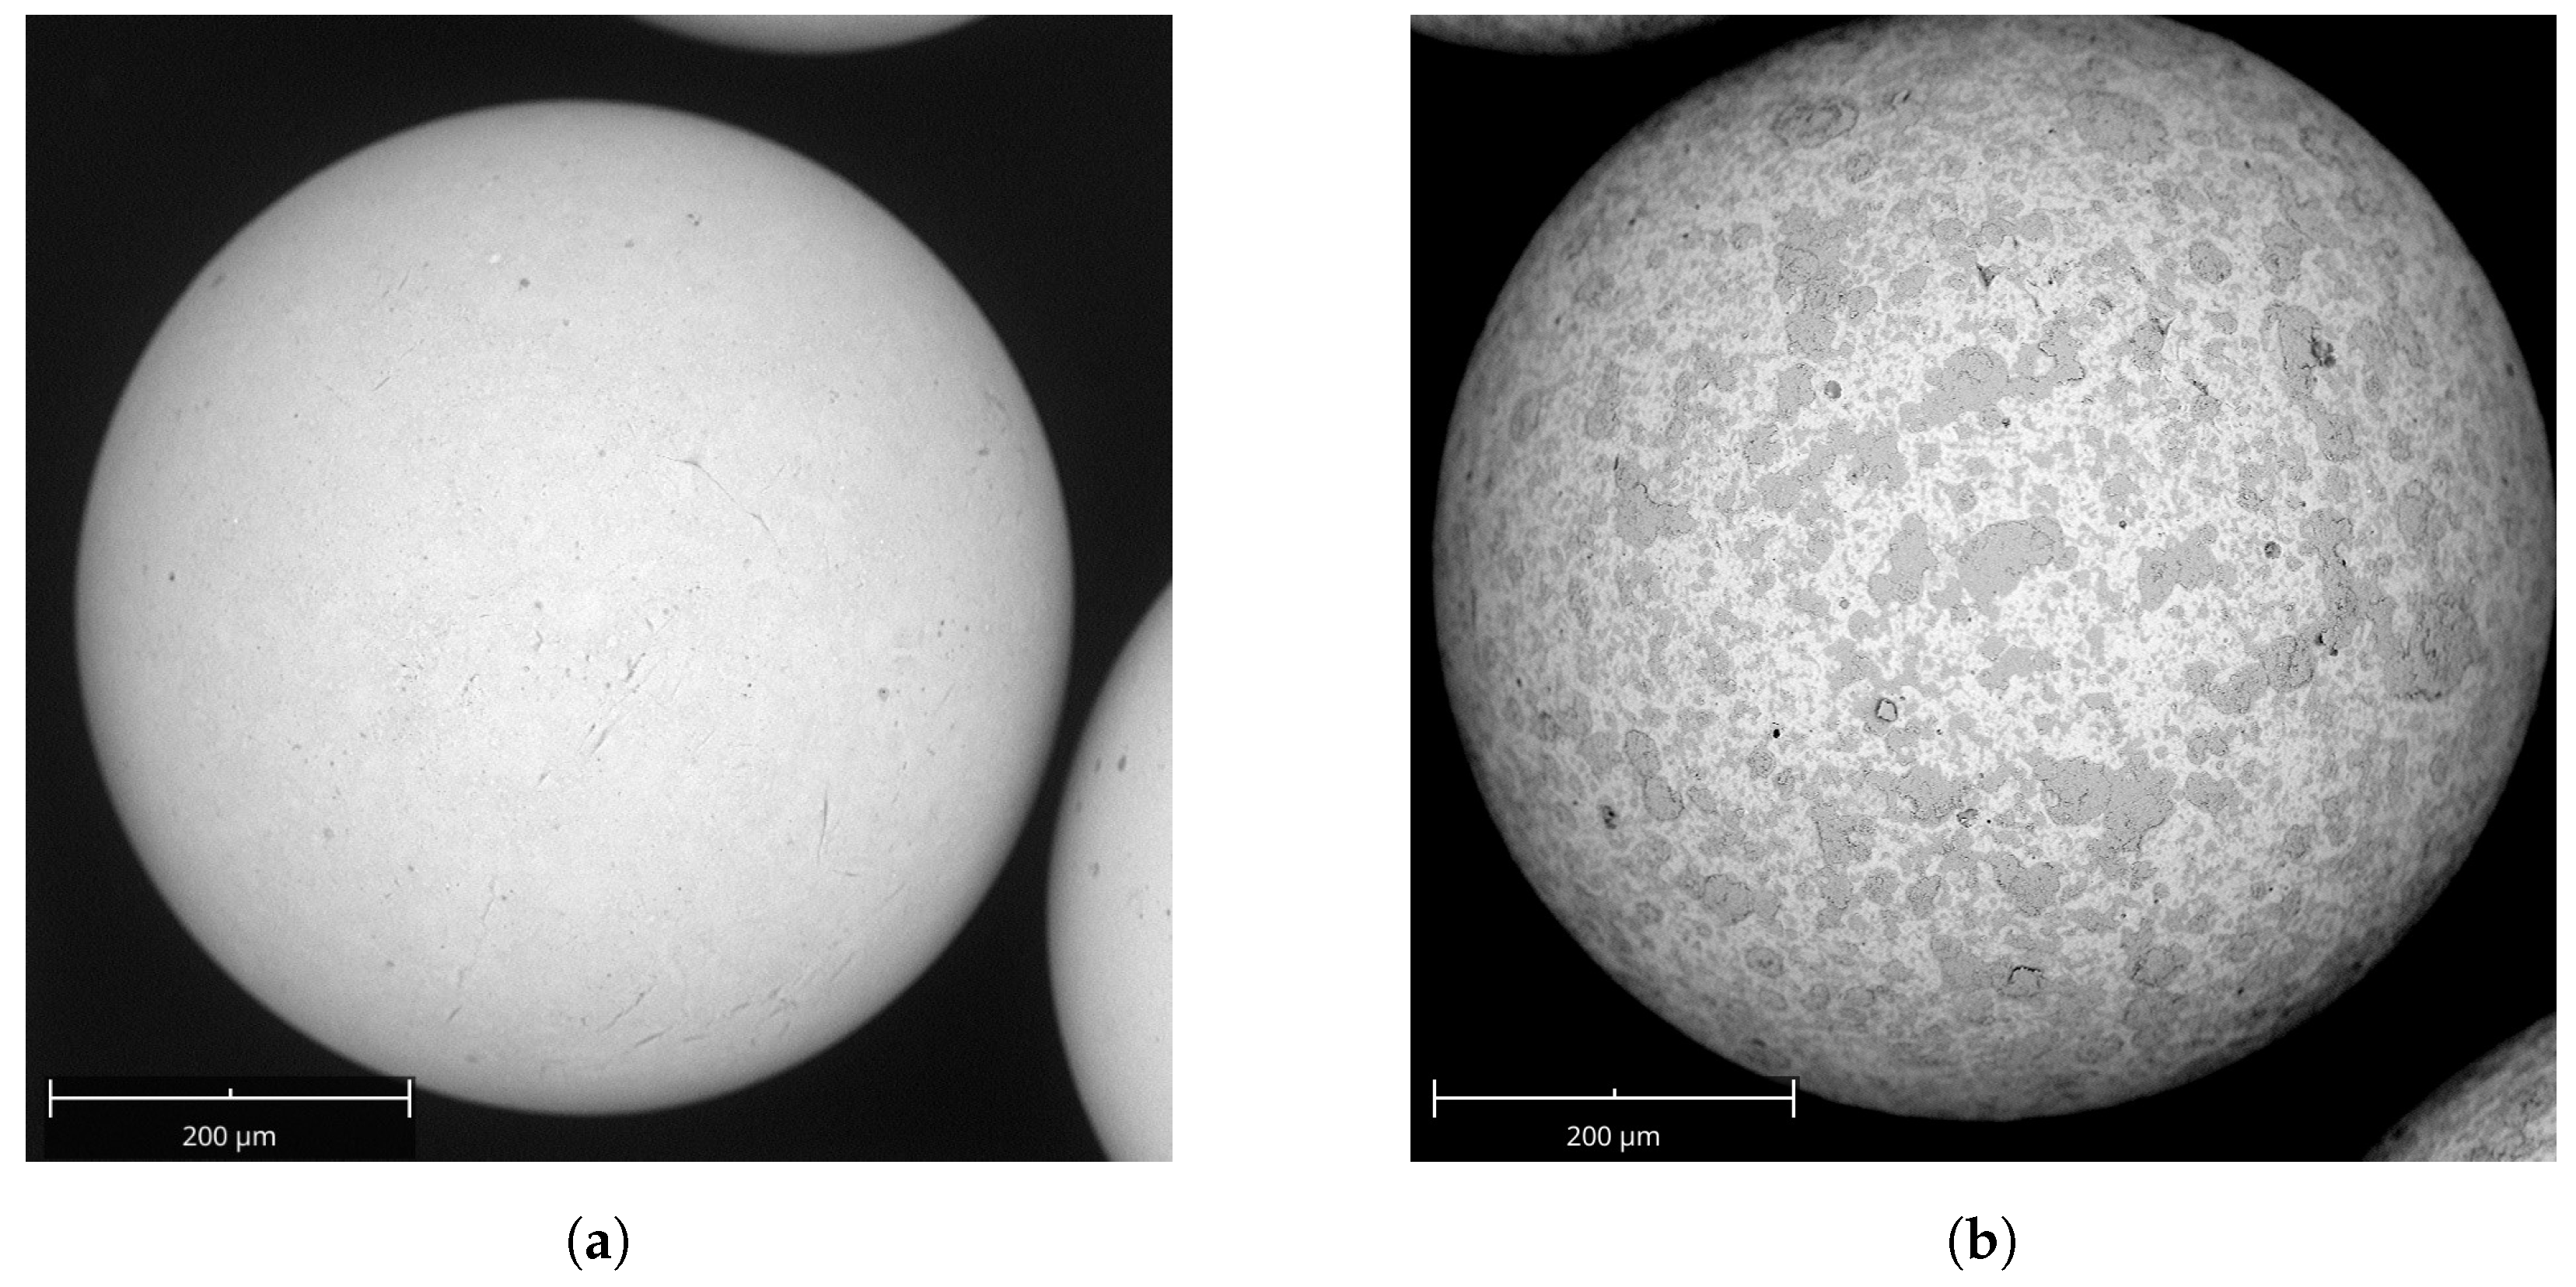
Table 1. Some SEM pictures of particles are exemplarily shown in Figure 7. Each picture represents one of the particles from collected samples, the coverage of which has been determined by the MATLAB image processing program. The SEM pictures of particles indicate island growth, i.e., preferential deposition on already covered parts of the particles. As a result of this, it was expected to obtain less coverage from the image analysis of real particles than the coverage results from the MC simulation with the old model, since the old model was based on random deposition of droplets on the particle surface positions and had no means for the consideration of island growth on the particles.

4.2. Curvature Effect

To investigate the curvature effect on coverage results from SEM pictures, image processing was conducted both with and without considering this effect, and results are shown in Table 3. These are the average coverage results from all 6 particles (from two identical experiments) chosen for each time step (explained in Section 2.5).
There is approximately 1% difference between the average coverage results with and without taking into account the curvature effect for particles from each process time. Therefore, the curvature effect on acquiring particle coating coverage from planary SEM pictures is small. Nevertheless, it has been considered in this study, so that 3D coverage values are used for further investigations and comparisons.

4.3. Process Yield

The process yield has been calculated as explained in Section 2.4 and is tabulated in Table 4.
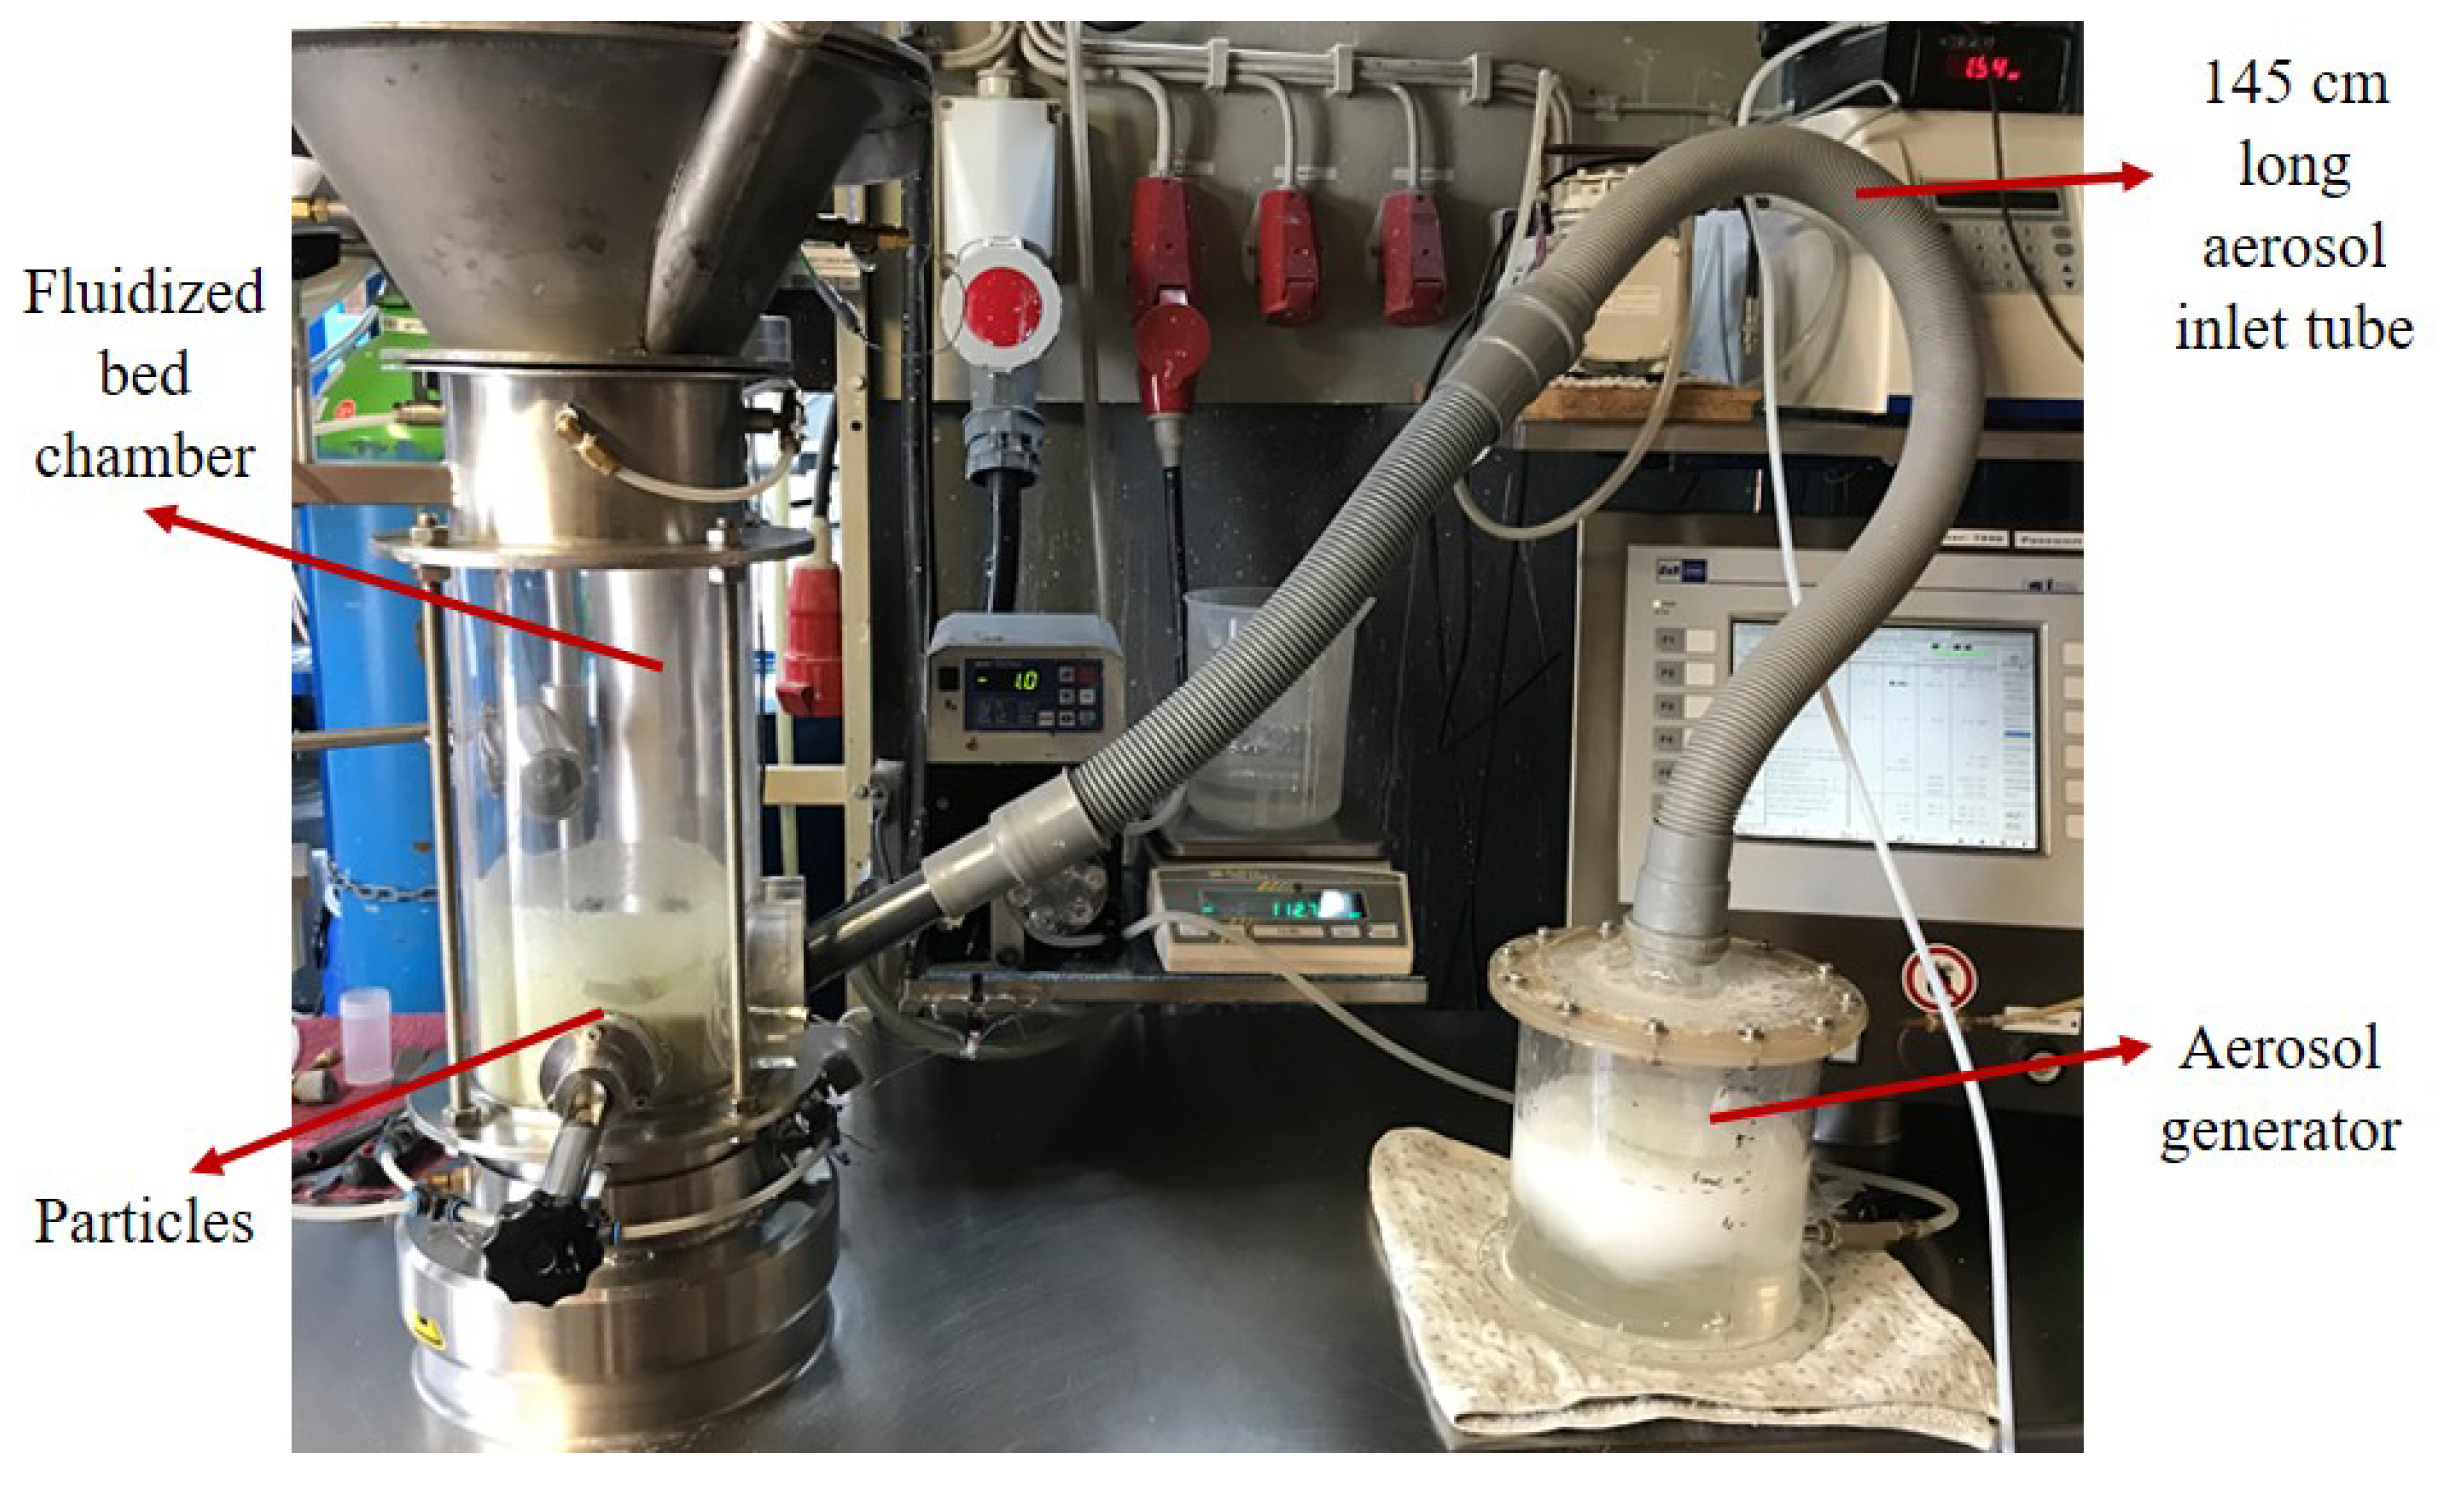
The arithmetic mean of the yield is 11.61% among the 5 samples. The mean yield of the coating process with aerosol was 28.3% in Mezhericher et al. [9] with the same operating parameters, except the type of the core particles and the length of aerosol inlet tube. In Mezhericher et al. [9], the aerosol inlet tube was short and γ -Al 2 O 3 core particles have been used. It was explained that the main cause of coating material loss seems to be entrained dust, since there were no wall deposits in the process. It should be noted that in the present study, the aerosol inlet tube was serrated and relatively long to eliminate big droplets coming from the aerosol generator that might cause agglomeration as explained before. While preventing these big droplets from reaching the aerosol generator, some of the droplets were accumulating on the tube wall (mostly because of the serrated structure of the tube) and making the tube wall wet, that might cause the reduction of yield. Furthermore, glass particles were used in this study. The density of glass particles (2500 kg/m 3 ) is much higher than the density of γ -Al 2 O 3 particles (1280 kg/m 3 ). Therefore, this means less bed height (fluidized bed heights in Mezhericher et al. [9]: 8 cm stagnant, 11 cm expanded; in present study: 4 cm stagnant, 6 cm expanded) for the same core particle mass (1 kg both in Mezhericher et al. [9] and in this study) in the bed, which can lead to smaller collision probability, and to less droplet deposition and coating yield, since the feeding height was 4.5 cm from the distributor plate of the bed.
Further parameters that can affect the yield are the surface roughness and the chemical surface properties of the core particles. The adhesion probability of droplets on glass particles and on γ -Al 2 O 3 particles might differ since they have different surface roughness and chemical surface properties, which might have contributed to the reduction of process yield. Besides, γ -Al 2 O 3 particles have a prominent porosity whereas glass particles are dense, which might also make a contribution to the adhesion probability and the process yields a reduction.

4.4. Monte Carlo Model

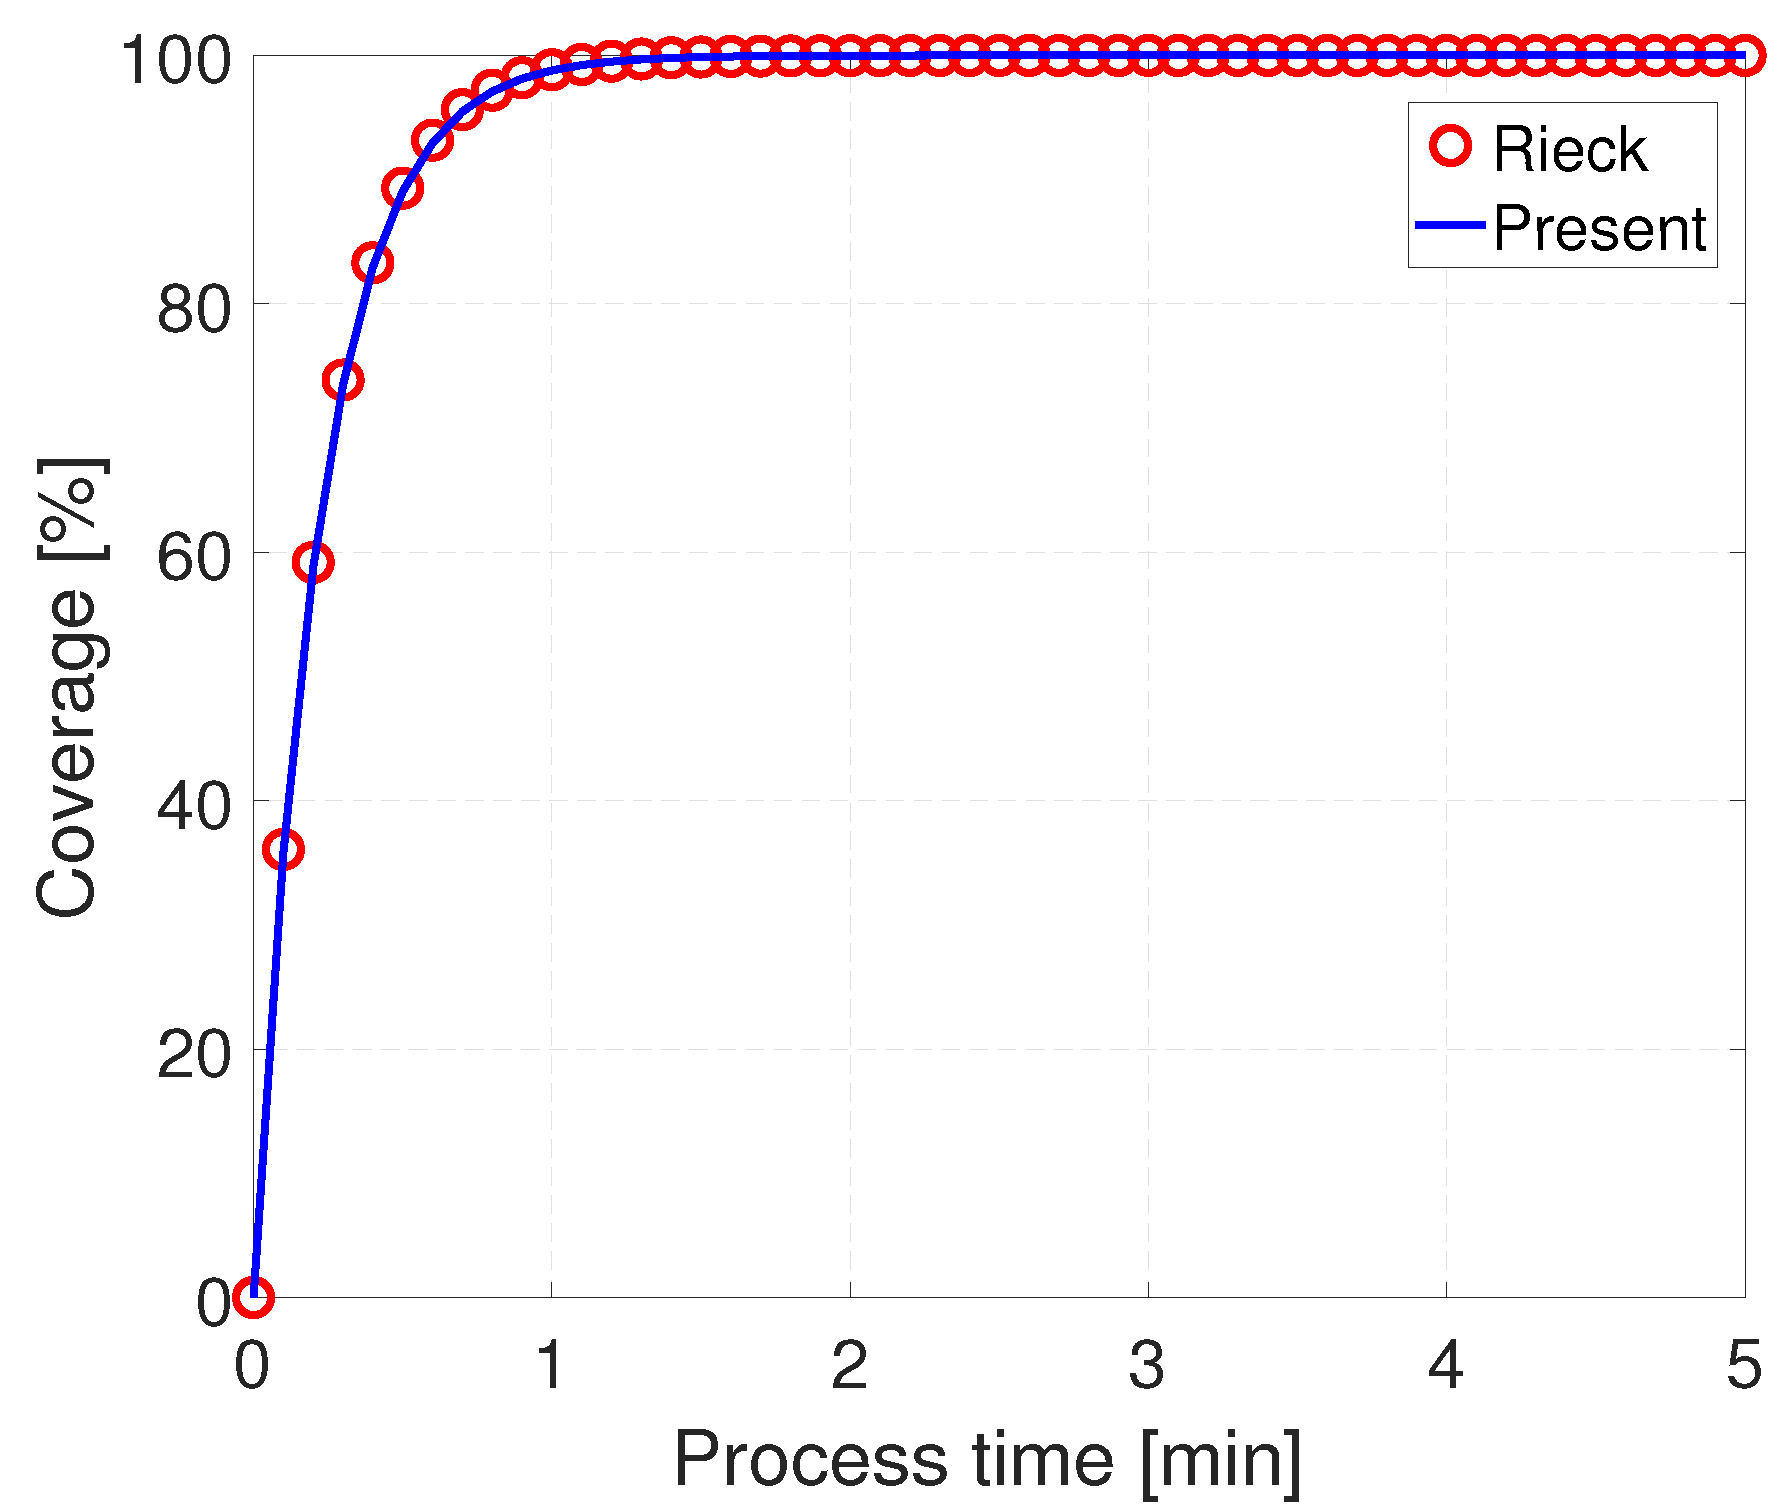
The modified MC model was first checked against the original algorithm by Rieck for just one particle in the MC simulation box and surface scaling factor equal to unity ( S s u r f a c e = 1). This means that the whole particle surface was considered in both models without any surface down-scaling. All the input quantities of MC simulation with both models are summarized in Table 5.
The same droplet size that the aerosol generator provides in the experiment (1 μ m, Section 2.1) was used as input parameter for all MC simulations.
Figure 8 shows identical results for the development of coverage on the particle with process time for both models, Rieck’s model [7] and the present model. A desktop PC (Intel Core i9-10900K CPU) was used to obtain the MC simulation results. The simulation time was around 10 h for both models used to simulate just one particle in the MC box. However, the main reason for the long computational time was not the computation of drying, but the huge number of positions on the particle (because of the small aerosol droplet size) in the simulation. Therefore, a major modification has been to determine the number of positions in the simulation which can represent the whole particle. The simulation has been run several times with different number of positions on one particle and the root mean square percentage error (RMSPE) for each simulation has been calculated to determine the number of positions on one particle that can be representative for the whole particle in the simulation. RMSPE is defined as:
R M S P E = 1 n i = 1 n A a c t u a l , i A p r e d i c t e d , i A a c t u a l , i 2 · 100 ,
where n is number of time steps in MC simulation, A a c t u a l , i is the coverage value with the present model when the surface scaling factor is unity, A p r e d i c t e d , i is the coverage value with the present model for the different investigated surface scaling factors.
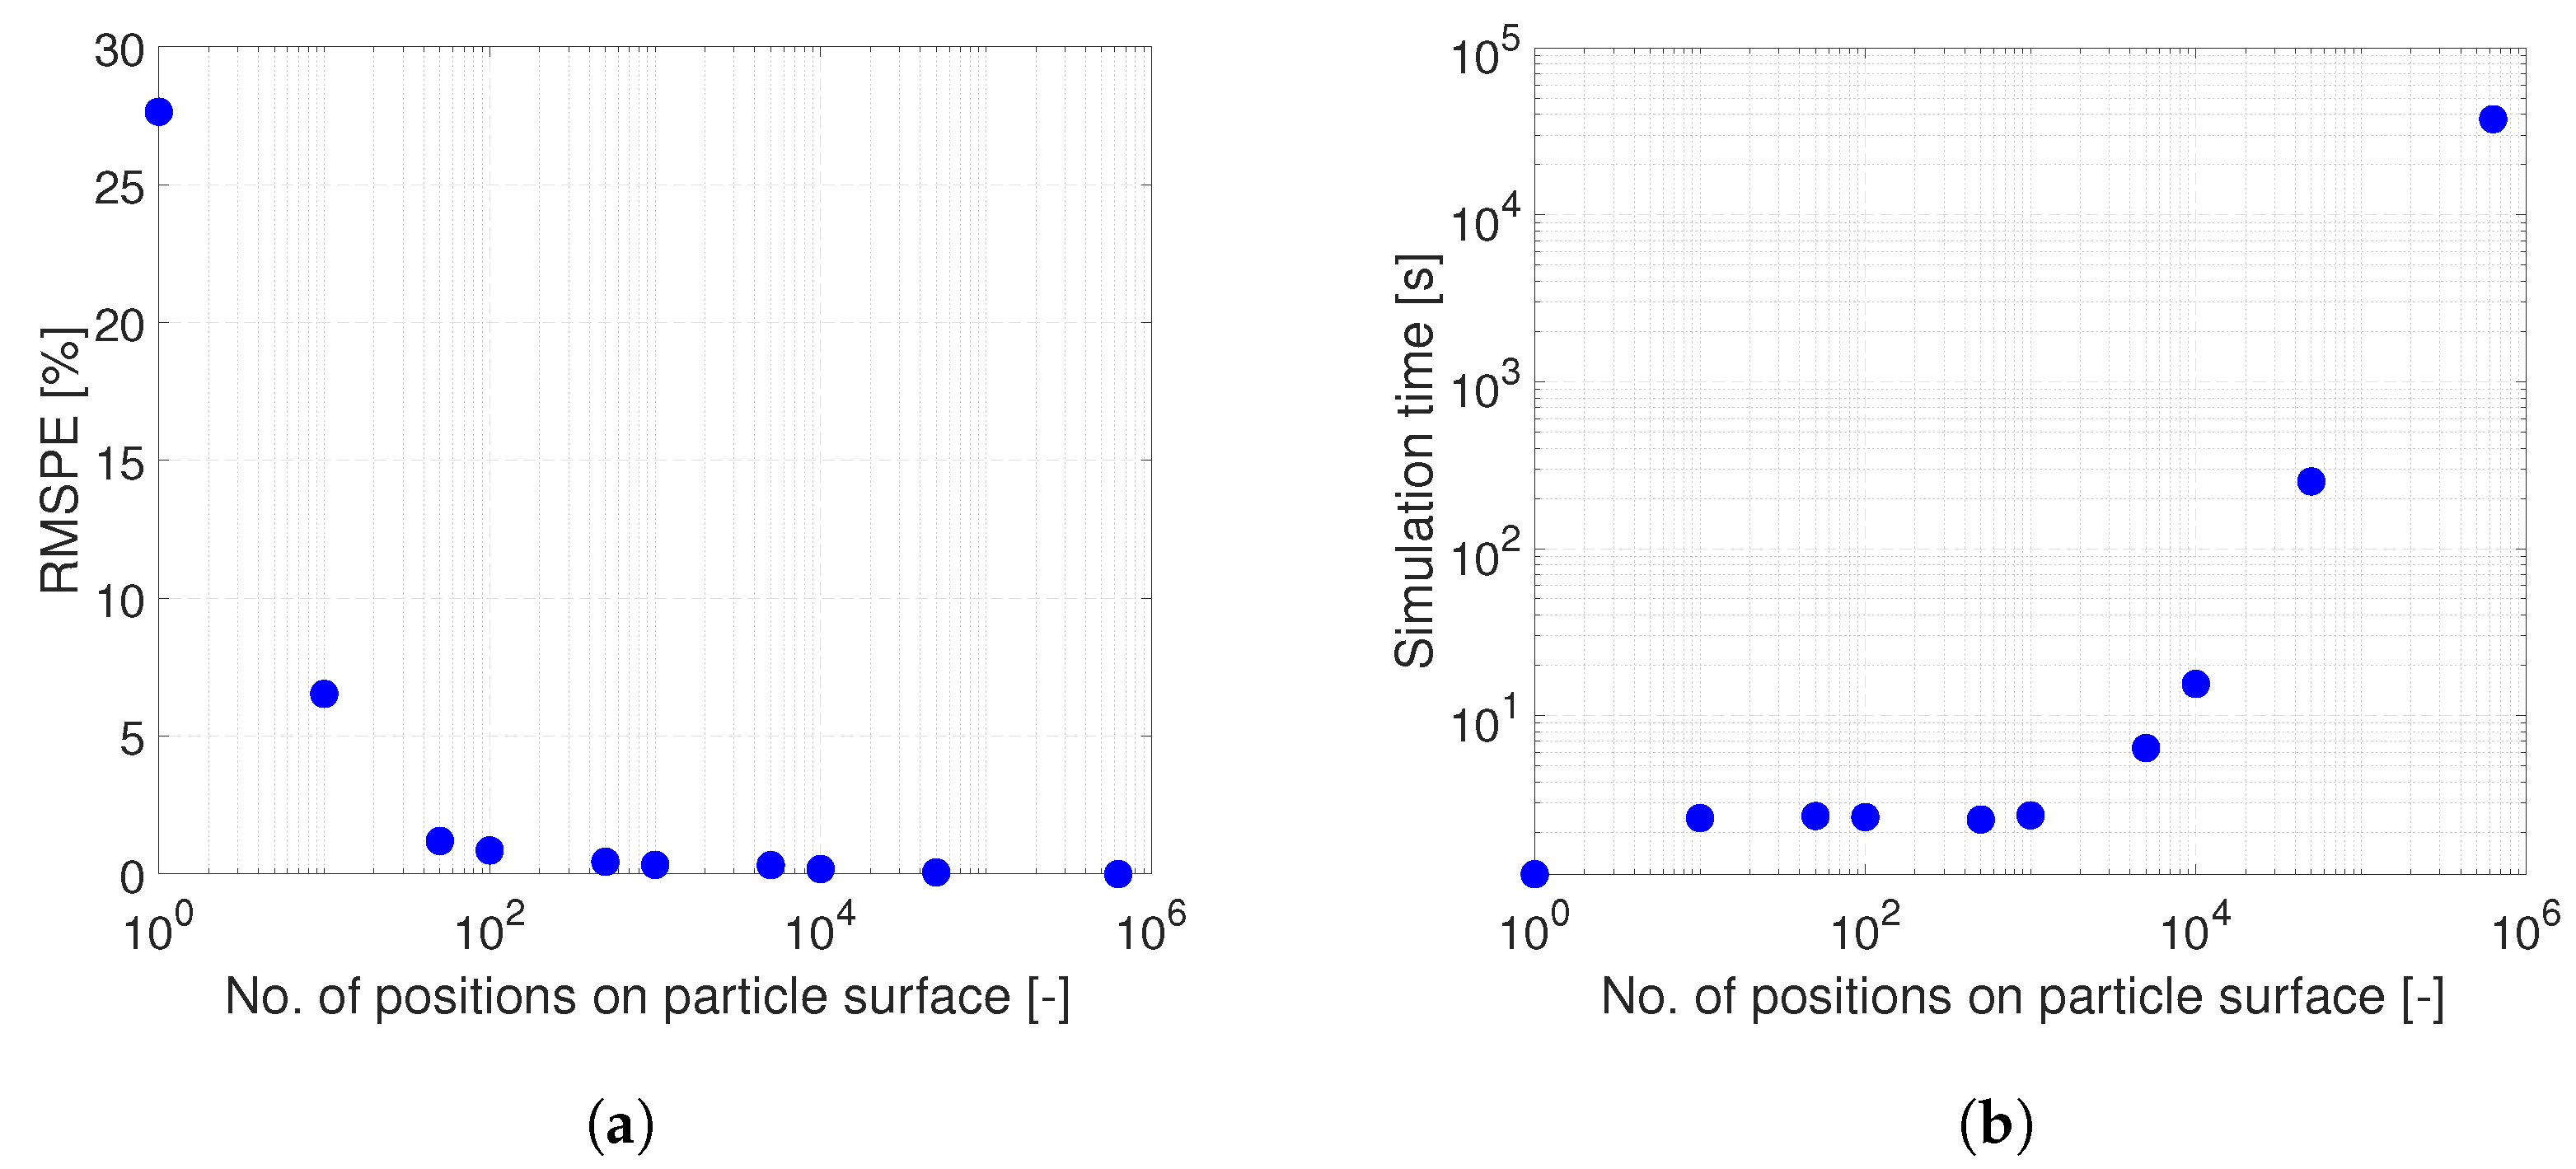
As it can be seen in Figure 9, the RMSPE is decreasing, on the contrary the simulation time is increasing with increasing number of positions considered on particle surface. Therefore, the number of positions should be high enough as to represent the whole particle, but not too high, since more positions mean more simulation time and cost.
Five hundred has been selected as the number of positions that can appropriately represent the whole particle, since the RMSPE is then sufficiently low, less than 0.5% (see Table 6). Moreover, the simulation time increases seriously when the position number becomes higher than 500. The simulation time was 2.4 h for 1000 particles (500 positions on each particle) in the MC box. This is significantly less than computational time with Rieck’s model for just one particle, underlying the progress achieved in our ability to describe the AFB process by MC simulations.
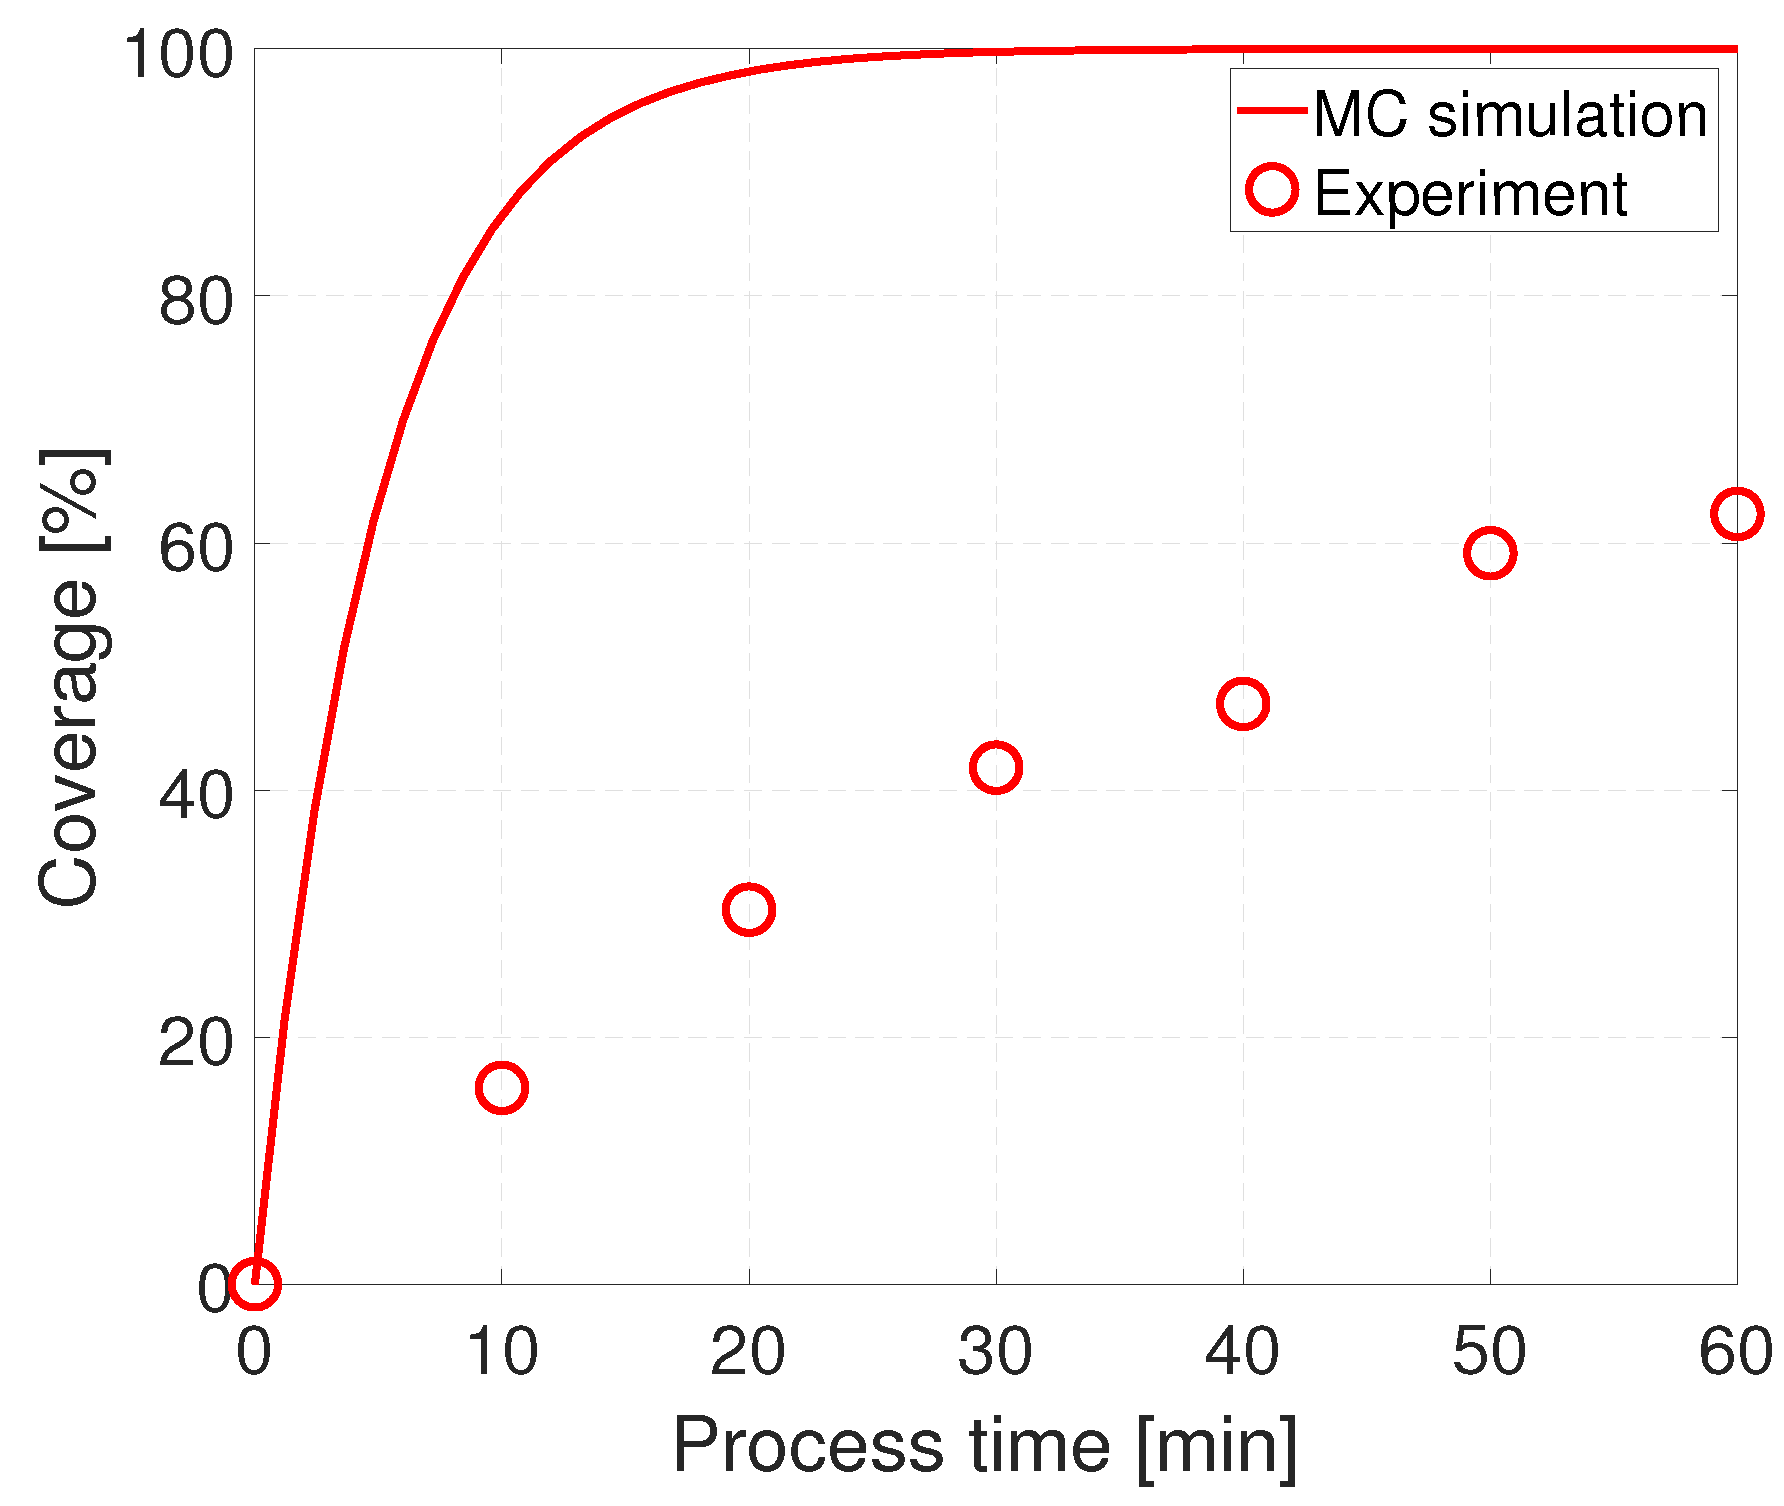
Monte Carlo simulations with random droplet deposition were conducted with the same parameters and yield (11.61%) as in the experiment. Coverage results from the MC simulation and the experiment are compared in Figure 10. For the experimental results in the graph, the average coverage value of sample particles (with consideration of the curvature effect) was taken (see Table 3). Simulation results represent the average coverage value of 1000 particles in the MC box.
A huge difference between the coverage results from the simulation and the experiment has been obtained, see Figure 10. This difference is evidence for island growth, which can be explained by preferential deposition, as it will be shown in the next section.

4.5. Effect of Preferential Deposition of Droplets on Already Occupied Positions

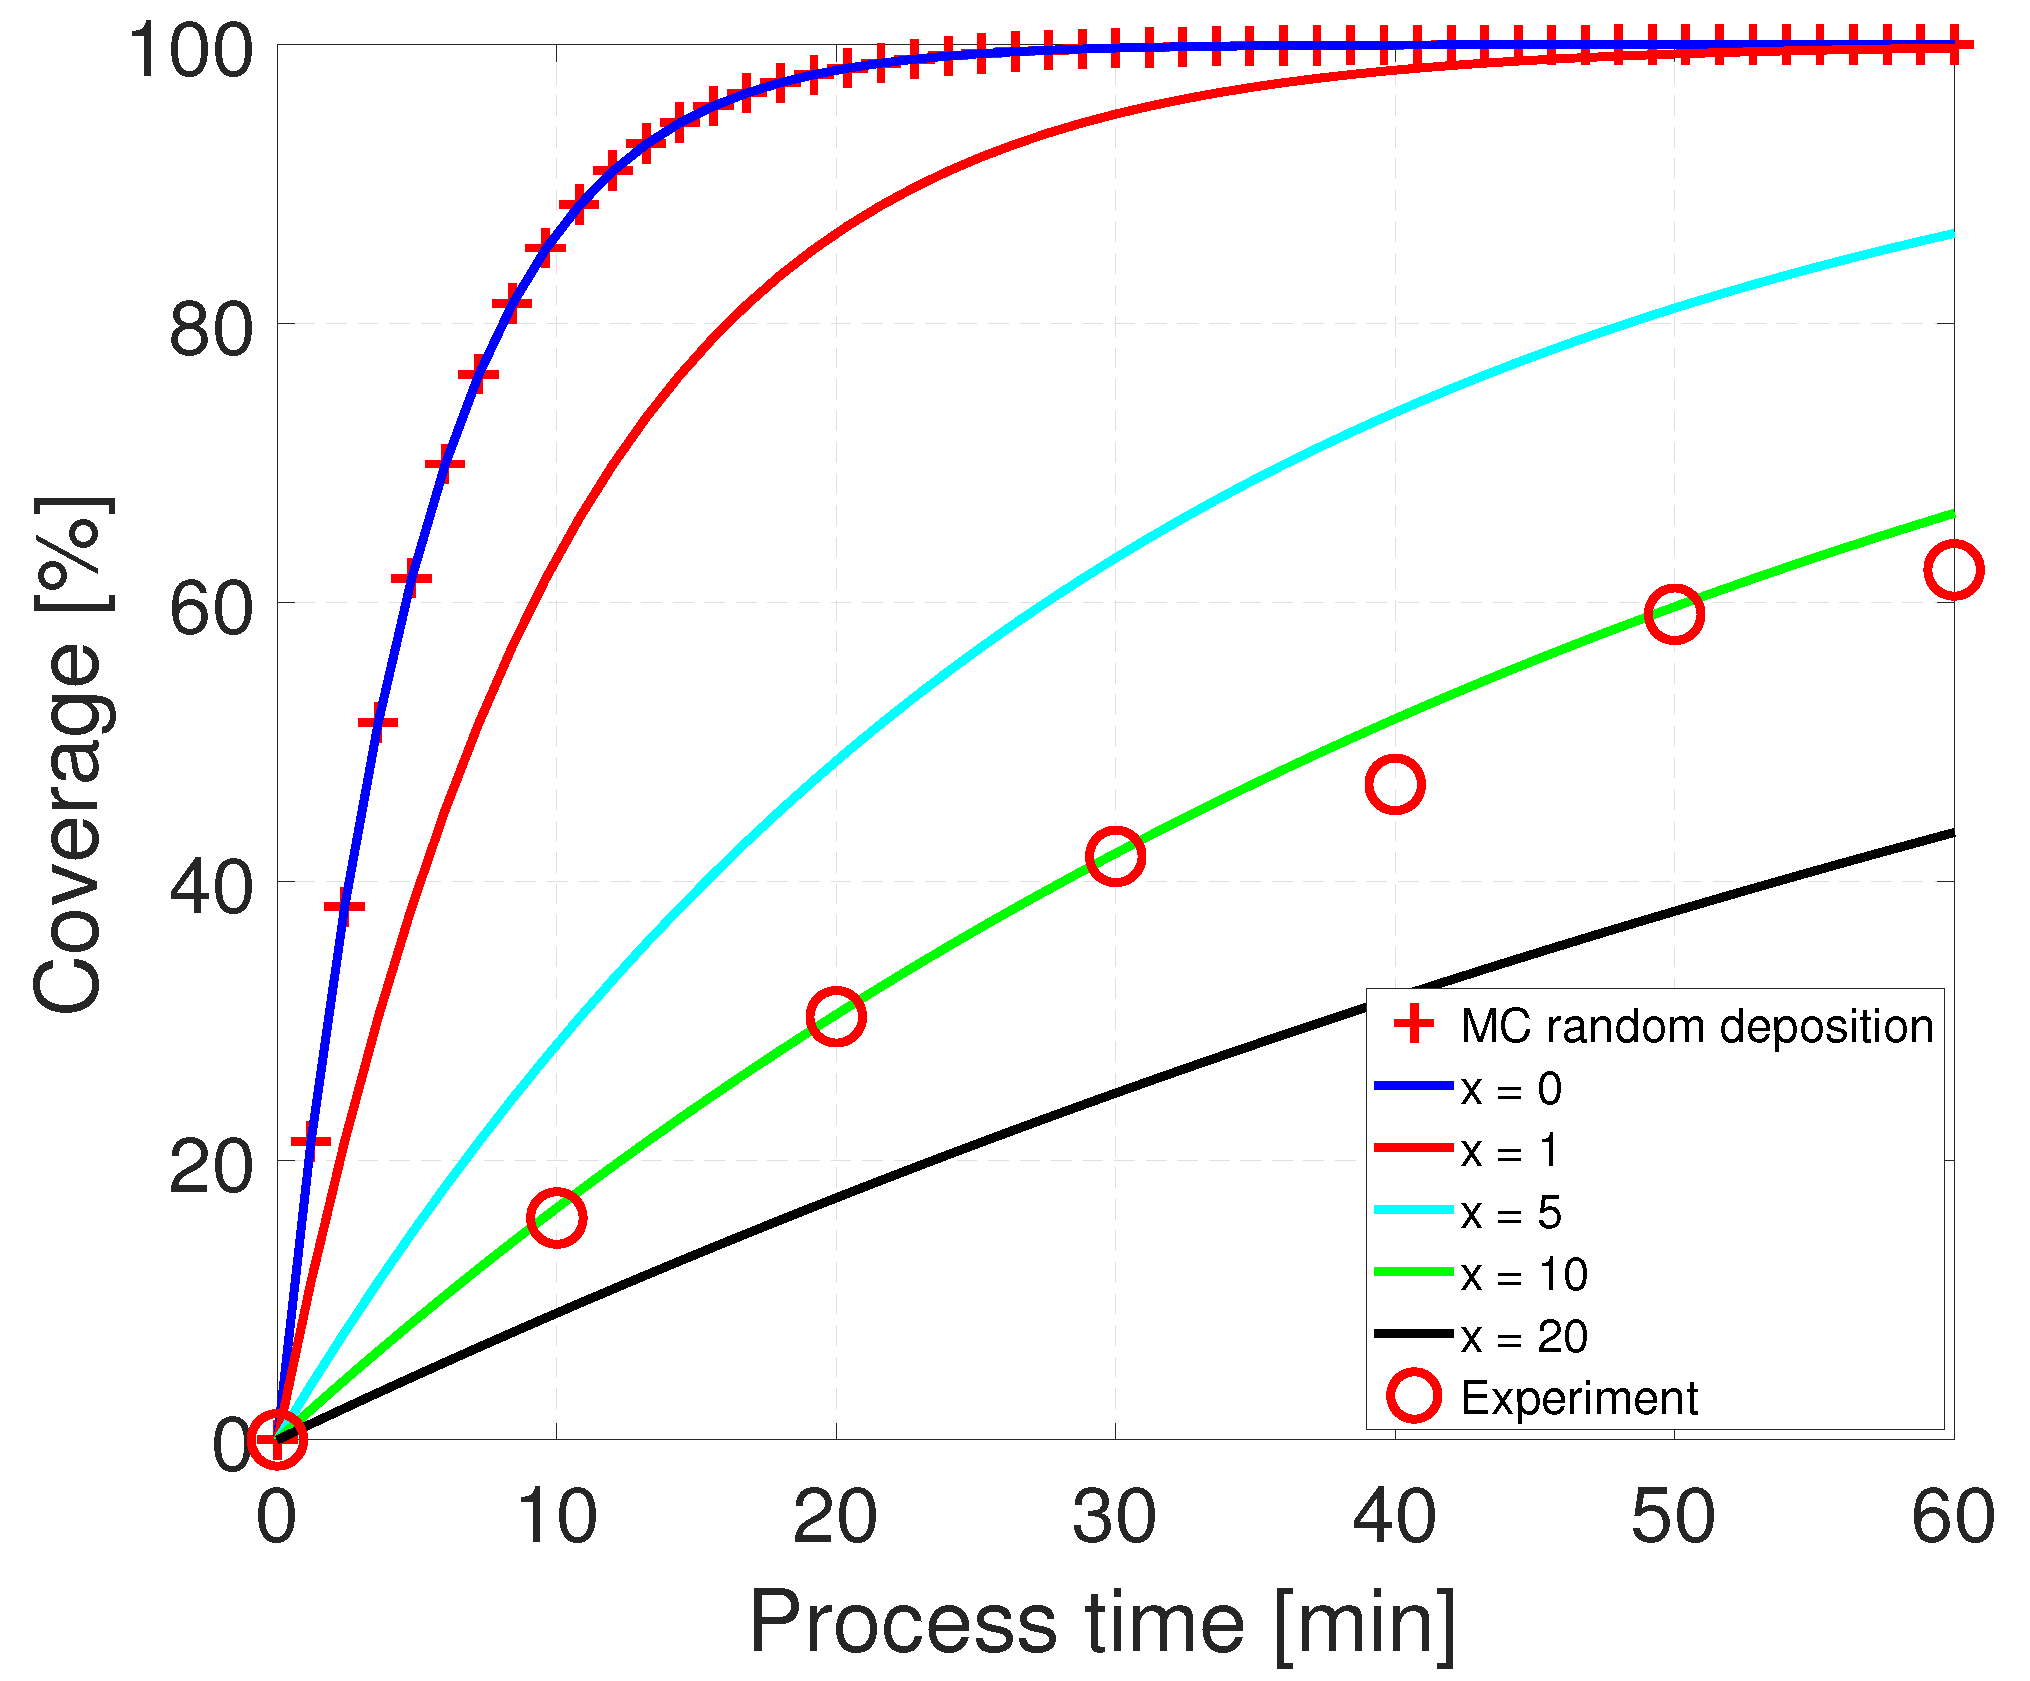
To demonstrate the effect of preference x analytically, the transient growth in coverage was drawn with respect to Equation (9) with different preference x values (see Figure 11).
The analytical coverage results are represented by the dark blue curve in Figure 11 when the preference is zero (x = 0), which completely matches the coverage results from MC random deposition, as expected. The slope of the coverage curve decreases with increasing preference of deposition on already occupied positions and results converge to the experimental coverage results. The experimental coverage results match with analytical coverage results when the preference is ten (x = 10).
After applying simulational arrangements on preferential deposition on occupied positions based on Equation (10), the MC simulation has also been run with different preference values. The average coverage percentage results (of 1000 particles in the MC box) are shown in Figure 12.
The dark blue coverage evolution curve represents the results when the preference is zero (x = 0) in the simulation, which means the droplets do not prefer the occupied positions and deposit with equal probability on any position on the particle. These coverage results match the coverage results with random deposition provided by the simulation before arrangements for preferential deposition. As the preference of already occupied positions for droplet deposition increases, the slope of the coverage curve decreases, and simulation coverage results converge to the experimental coverage results, such as with the analytical solutions. This fact again shows that the more droplets prefer to deposit on already occupied positions, the less coverage (the more island growth) will be obtained on the surface. As with the analytical results, when x = 10 the simulated coverage results match well with the experimental coverage results. Both analytical and MC simulational results show that the preferential deposition of droplets on occupied positions is an effective reason for island growth.
Although with analytical solutions it is possible to obtain similar average coverage results as with MC simulations, it should be noted that only with MC simulations is it possible to obtain intraparticle and interparticle distributions of coverage. Discussing such distributions, coating height distributions, droplet numbers on each position, and local and integral porosity are outside of present paper’s scope. Notably, however, such effects can be computed just with MC simulations, not with analytical solutions.
As to the preferential deposition factor x, it is expected to depend on the adhesion probability of droplets on either the fresh substrate or on previous deposits. Core particle material and surface structure, as well as coating material and deposit structure, are here the underlying parameters, which might be quantified by surface energy measurements and correlated to the factor x.

5. Conclusions

The main purpose of this study was to investigate island growth on particles coated by means of aerosol droplets. Therefore, a coating experiment was conducted in an aerosol fluidized bed (AFB) and MC simulations have been used to simulate the process.
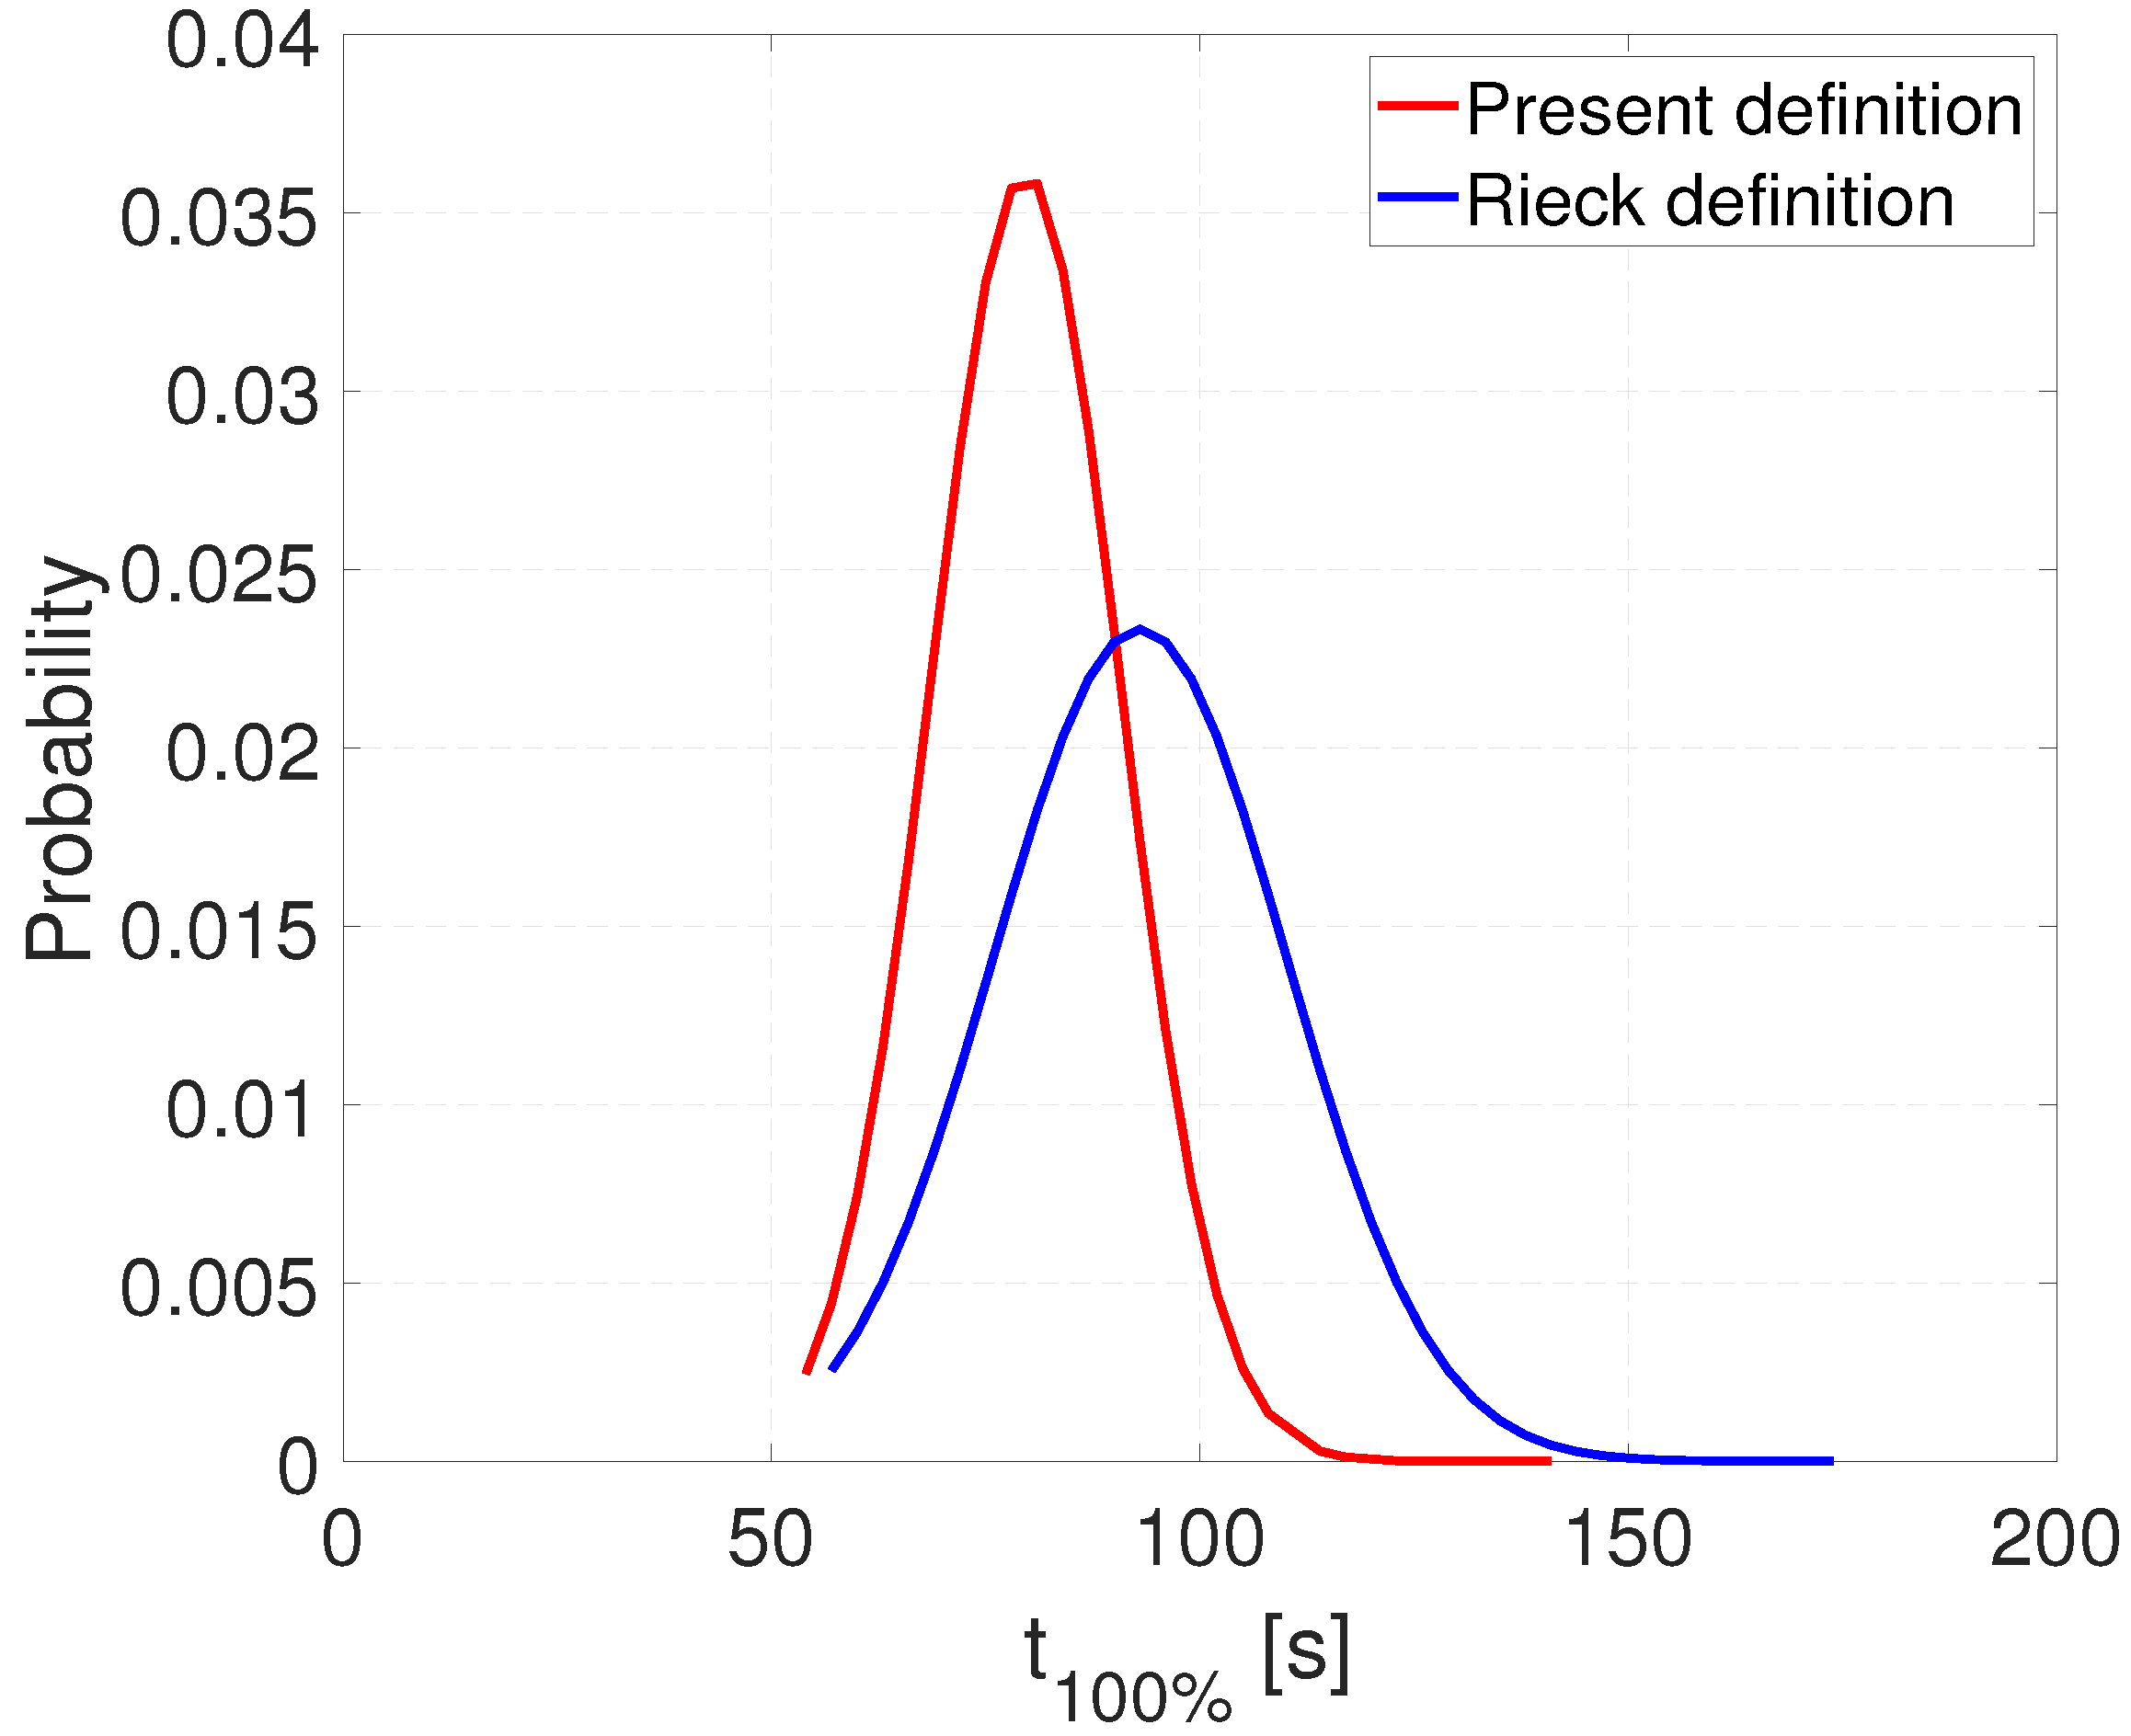
The simulation time is huge with complete tessellation of the particle surface, because of the small footprint area of aerosol droplets. Therefore, just 500 positions have been considered as representative of the whole particle surface. This could cut the computational time dramatically, even with 1000 particles in the MC box. Moreover, a new relative full coverage time definition has been introduced, which does not depend on the numerical resolution on the particle surface.
Coverage results from the MC simulation were compared with experimental coverage results obtained by evaluation of SEM pictures. A big difference was observed because of island growth on the real particles. Island growth can be explained by preferential deposition of droplets on already occupied positions on the particle surface. When a respective preference factor reaches a certain value (x = 10), the simulated coverage results match well with the experimental findings. Analytical solutions can also capture this effect, but they cannot provide interparticle or intraparticle coverage distributions. Although not in the focus of this study, the latter are accessible by MC simulations.
The present investigation can be continued and deepened in several directions. For example, by optimizing the aerosol feeding system, simulating the separation of aerosol droplets in the aerosol inlet duct, measuring the aerosol gas flow rate and understanding its influence, and investigating the penetration of aerosol air and droplets in the fluidized bed. Moreover, by replacing the present single inlet, which may lead to heterogeneity because of asymmetric aerosol flow, by multiple aerosol inlets. Increasing the height of the fluidized bed above the aerosol inlet, the yield of the process can be improved. At this end, a filtration-like model for droplet deposition is needed, including a collision probability and an adhesion probability. Notably, the adhesion probability will depend on the surface properties of the fresh or covered core particles, which is expected to correlate with the previously mentioned preferential deposition factor that steers the island growth. Furthermore, experiments need to be performed after the attainment of full coverage on the surface (with more process time and perhaps with different core particles). The evaluation of such experiments should include coating porosity, alongside with interparticle and intraparticle coating thickness homogeneity. In this frame, the MC simulation may be extended for the consideration of local and global coating porosity.

Author Contributions

Experimental work, S.A. with supervision of T.H.; software, S.A. and K.C.; validation, E.T.; formal analysis, S.A. and E.T.; writing and original draft preparation, S.A.; review and editing, E.T. and F.S.; supervision, T.H. and E.T.; project administration, E.T. All authors have read and agreed to the published version of the manuscript.

Funding

The authors gratefully acknowledge the financial support of this work by Deutsche Forschungsgemeinschaft (DFG, German Research Foundation)—Project number: 452247553.

Institutional Review Board Statement

Not applicable.

Informed Consent Statement

Not applicable.

Data Availability Statement

Not applicable.

Acknowledgments

We thank Jinchi Zhang for his contribution to this project as a student research assistant (HiWi).

Conflicts of Interest

The authors declare no conflict of interest.

Abbreviations

The following abbreviations are used in this manuscript:
AFBaerosol fluidized bed
FBfluidized bed
MCMonte Carlo
NaBsodium benzoate
PSDparticle size distribution
PVCpolyvinyl chloride
SEMscanning electron microscope
SFBspray fluidized bed

References

  1. Zhang, R.; Hoffmann, T.; Tsotsas, E. Novel technique for coating of fine particles using fluidized bed and aerosol atomizer. Processes 2020, 8, 1525. [Google Scholar] [CrossRef]
  2. Wan, L.S.; Lai, W. Factors affecting drug release from drug-coated granules prepared by fluidized-bed coating. Int. J. Pharm. 1991, 72, 163–174. [Google Scholar] [CrossRef]
  3. Capece, M.; Dave, R. Application of fluidized bed film coating for membrane encapsulation of catalysts. Powder Technol. 2011, 211, 199–206. [Google Scholar] [CrossRef]
  4. Sondej, F.; Bück, A.; Tsotsas, E. Comparative analysis of the coating thickness on single particles using X-ray micro-computed tomography and confocal laser-scanning microscopy. Powder Technol. 2016, 287, 330–340. [Google Scholar] [CrossRef]
  5. Kieckhefen, P.; Lichtenegger, T.; Pietsch, S.; Pirker, S.; Heinrich, S. Simulation of spray coating in a spouted bed using recurrence CFD. Particuology 2019, 42, 92–103. [Google Scholar] [CrossRef]
  6. Pietsch, S.; Peter, A.; Wahl, P.; Khinast, J.; Heinrich, S. Measurement of granule layer thickness in a spouted bed coating process via optical coherence tomography. Powder Technol. 2019, 356, 139–147. [Google Scholar] [CrossRef]
  7. Rieck, C.; Bück, A.; Tsotsas, E. Monte Carlo modeling of fluidized bed coating and layering processes. AIChE J. 2016, 62, 2670–2680. [Google Scholar] [CrossRef]
  8. Tsotsas, E. Influence of drying kinetics on particle formation: A personal perspective. Dry. Technol. 2012, 30, 1167–1175. [Google Scholar] [CrossRef]
  9. Mezhericher, M.; Rieck, C.; Razorenov, N.; Tsotsas, E. Ultrathin coating of particles in fluidized bed using submicron droplet aerosol. Particuology 2020, 53, 23–29. [Google Scholar] [CrossRef]
  10. Rieck, C.; Bück, A.; Tsotsas, E. Estimation of the dominant size enlargement mechanism in spray fluidized bed processes. AIChE J. 2020, 66, e16920. [Google Scholar] [CrossRef]
  11. Thimsen, E. Single-Step aerosol synthesis and deposition of Au nanoparticles with controlled size and separation distributions. Chem. Mater. 2011, 23, 4612–4617. [Google Scholar] [CrossRef]
  12. Goulas, A.; Ruud van Ommen, J. Atomic layer deposition of platinum clusters on titania nanoparticles at atmospheric pressure. J. Mater. Chem. A 2013, 1, 4647–4650. [Google Scholar] [CrossRef] [Green Version]
  13. Cao, K.; Cai, J.; Liu, X.; Chen, R. Review Article: Catalysts design and synthesis via selective atomic layer deposition. J. Vac. Sci. Technol. A 2018, 36, 010801. [Google Scholar] [CrossRef] [Green Version]
  14. Forgerini, F.; Marchiori, R. A brief review of mathematical models of thin film growth and surfaces: A possible route to avoid defects in stents. Biomatter 2014, 4, e28871. [Google Scholar] [CrossRef] [PubMed] [Green Version]
  15. Fornari, C.; Fornari, G.; Rappl, P.; Abramof, E.; Travelho, J. Monte Carlo Simulation of Epitaxial Growth; in Epitaxy; IntechOpen: London, UK, 2018. [Google Scholar] [CrossRef] [Green Version]
  16. Richey, N.E.; de Paula, C.; Bent, S.F. Understanding chemical and physical mechanisms in atomic layer deposition. J. Chem. Phys. 2020, 152, 040902. [Google Scholar] [CrossRef] [PubMed]
  17. Lefebvre, A.H.; McDonell, V.G. Atomization and Sprays; CRC Press: Boca Raton, FL, USA, 2017. [Google Scholar] [CrossRef]
  18. Mezhericher, M.; Ladizhensky, I.; Etlin, I. Atomization of liquids by disintegrating thin liquid films using gas jets. Int. J. Multiph. Flow 2017, 88, 99–115. [Google Scholar] [CrossRef]
  19. Mezhericher, M.; Nunes, J.K.; Guzowski, J.J.; Stone, H.A. Aerosol-assisted synthesis of submicron particles at room temperature using ultra-fine liquid atomization. Chem. Eng. J. 2018, 346, 606–620. [Google Scholar] [CrossRef]
  20. Rieck, C.; Hoffmann, T.; Bück, A.; Peglow, M.; Tsotsas, E. Influence of drying conditions on layer porosity in fluidized bed spray granulation. Powder Technol. 2015, 272, 120–131. [Google Scholar] [CrossRef]
  21. Terrazas-Velarde, K.; Peglow, M.; Tsotsas, E. Stochastic simulation of agglomerate formation in fluidized bed spray drying: A micro-scale approach. Chem. Eng. Sci. 2009, 64, 2631–2643. [Google Scholar] [CrossRef]
  22. Zhao, H.; Maisels, A.; Matsoukas, T.; Zheng, C. Analysis of four Monte Carlo methods for the solution of population balances in dispersed systems. Powder Technol. 2007, 173, 38–50. [Google Scholar] [CrossRef]
Figure 1. Particle size distribution of core particles.
Processes 11 00165 g001
Figure 2. Experimental setup with 145 cm long aerosol inlet tube from the side of the fluidized bed.
Processes 11 00165 g002
Figure 3. SEM picture of (a) core glass particle, (b) one of the patchy coated particles after 40 min process time. Scale bars: 200 μ m.
Processes 11 00165 g003
Figure 4. Monte Carlo algorithm of the present model.
Processes 11 00165 g004
Figure 5. The change of full coverage time with the number of positions on a particle (a) with Rieck’s definition, (b) with present definition.
Processes 11 00165 g005
Figure 6. Probability distribution of the full coverage time of 1000 particles in MC box.
Processes 11 00165 g006
Figure 7. SEM pictures of particles from the coating experiment. (a) After 10 min; (b) After 20 min; (c) After 30min; (d) After 40 min; (e) After 50 min; (f) After 60 min. Scale bars: 200 μ m.
Processes 11 00165 g007
Figure 8. Development of coverage on particle with process time for both models.
Processes 11 00165 g008
Figure 9. (a) Root mean square percentage error and (b) simulation time for different number of positions on one particle in simulation.
Processes 11 00165 g009
Figure 10. Comparison of the coverage percentage results from MC simulation and experiment.
Processes 11 00165 g010
Figure 11. Analytical solutions (full lines) for preferable deposition with different preferences x.
Processes 11 00165 g011
Figure 12. Effect of preferential deposition of droplets on already occupied positions according to the MC simulation.
Processes 11 00165 g012
Table 1. Parameters of aerosol particle coating experiments.
Operating ParameterValue
Mass flow rate of fluidization air65 kg/h
Fluidization air velocity0.947 m/s
Minimum fluidization velocity0.310 m/s
Inlet temperature of fluidization air50 °C
Length of aerosol inlet tube (from the generator outlet to fluidized bed inlet)145 cm
Structure of the aerosol inlet tubeflexible, serrated
Pressure of atomizing air1.5 bar (gauge)
Mass flow rate of aerosol solution0.0785 kg/h
Process time1 h
Time interval of sampling10 min
Table 2. Monte Carlo simulation parameters.
Simulation ParameterValue
No. of positions on one particle500
No. of particles in MC box1000
Full coverage timewhen coverage is 99.8%
Table 3. Experimental average 2D (without considering curvature effect) and 3D (with considering curvature effect) coverage results and standard deviations.
Process Time [min]Average 2D Coverage [%]Average 3D Coverage [%]
1015.69 ± 3.6515.90 ± 3.66
2029.95 ± 6.6930.32 ± 6.83
3041.50 ± 6.7541.82 ± 6.78
4046.54 ± 5.4346.98 ± 5.51
5058.41 ± 4.6559.17 ± 4.38
6061.63 ± 3.1162.35 ± 3.11
Table 4. Aerosol coating process yield (total mass of solid fed with the aerosol: 23.55 g; maximum theoretical coating-to-core mass ratio at 100% yield: 0.02355 g/g).
Particle Sample #Mass of Cores [g]Coating Mass [g]Coating-to-Core Mass Ratio [g/g]Yield [%]
119.3950.06940.0035815.19
214.1070.03070.002189.24
312.6900.05030.0039616.83
49.6790.01650.001707.24
519.4760.04370.002249.53
Mean15.0700.04210.0027311.61
Table 5. Input parameters of MC simulation for both models.
Input ParameterValue
Aerosol droplet diameter1 μ m
No. of particles in MC box1
S s u r f a c e 1
Yield100%
Experimental input parametersSame as in Mezhericher et al. [9]
Table 6. Table of RMSPE with respect to the number of positions on one particle in simulation.
No. of Positions S surface RMSPE [%]
629,7771.00
50,0008.0 × 10 2 0.06
10,0001.6 × 10 2 0.18
50008.0 × 10 3 0.32
10001.6 × 10 3 0.33
5008.0 × 10 4 0.45
1001.6 × 10 4 0.86
501.0 × 10 4 1.2
102.0 × 10 5 6.53
12.0 × 10 6 27.65
Disclaimer/Publisher’s Note: The statements, opinions and data contained in all publications are solely those of the individual author(s) and contributor(s) and not of MDPI and/or the editor(s). MDPI and/or the editor(s) disclaim responsibility for any injury to people or property resulting from any ideas, methods, instructions or products referred to in the content.

