Article

Sustainability Assessment of the Utilization of CO2 in a Dielectric Barrier Discharge Reactor Powered by Photovoltaic Energy

by
Josep O. Pou
1,*,
Eduard Estopañán
1,
Javier Fernandez-Garcia
1,2 and
Rafael Gonzalez-Olmos
1
1
IQS School of Engineering, Universitat Ramon Llull, Via Augusta 390, 08017 Barcelona, Spain
2
Department of Chemical Engineering, University College London (UCL), Torrington Place, London WC1E 7JE, UK
*
Author to whom correspondence should be addressed.
Processes 2022, 10(9), 1851; https://doi.org/10.3390/pr10091851
Submission received: 28 July 2022 / Revised: 2 September 2022 / Accepted: 6 September 2022 / Published: 14 September 2022
(This article belongs to the Special Issue Trends in Carbon Capture, Storage and Utilisation)

Abstract

:
The direct activation of diluted CO2 in argon was studied in a co-axial dielectric barrier discharge (DBD) reactor powered by photovoltaic energy. The influence of the initial CO2 and argon concentration on the CO2 decomposition to form CO was investigated using a copper-based catalyst in the discharge zone. It was observed that the CO2 conversion was higher at lower CO2 concentrations. The presence of the diluent gas (argon) was also studied and it was observed how it has a high influence on the decomposition of CO2, improving the conversion at high argon concentrations. At the highest observed energy efficiency (1.7%), the CO2 conversion obtained was 40.2%. It was observed that a way to enhance the sustainability of the process was to use photovoltaic energy. Taking into account a life cycle assessment approach (LCA), it was estimated that within the best-case scenario, it would be feasible to counterbalance 97% of the CO2 emissions related to the process.

1. Introduction

Nowadays, it is a priority to find and develop technologies to deal with CO2 emissions in order to mitigate global warming [1]. New alternatives for carbon capture technologies have been studied and assessed [2,3,4,5,6], but the problem of which is the best alternative for CO2 as a feedstock is still under study [7,8,9,10]. That is why CO2 conversion to valuable products appears to be a great possibility; this leads to the reduction in fossil fuel dependence and global warming too.
The direct use of CO2 has a great variety of applications, such as its relevance within soft drinks, to the scope of supercritical CO2 as a solvent, and in other industrial areas, for instance, welding and refrigeration [7]. Direct dissociation of CO2 and conversion into other value-added fuels and chemicals provides a potential route for efficient reduction in CO2 emissions. Variable progress has been made to convert CO2 into other value-added chemicals, such as CO2 hydrogenation for the synthesis of methane, methanol, formaldehyde, etc. [8,9,10].
CO2 conversion, decomposition, or activation into valuable products have been widely studied through thermo-chemical [11], photocatalysis [12,13,14,15,16,17], biological [18] or electrochemical [19,20] pathways, although these routes are not efficient from an energy perspective. Alternatively, non-thermal plasma (NTP) can operate under ambient conditions, so it can offer high energetic electrons which are able to initiate a highly endothermic chemical reaction under ambient temperature [21]. Different NTP approaches have been broadly studied such as corona discharge [22,23], gliding arc [24,25], microwave discharge [26,27], and dielectric barrier discharge (DBD) [28,29,30]. The latter has drawn more attention for the wide range of applications and its operability. Among several applications for the DBD approach, it has been successfully applied for volatile organic compounds treatment [31], wastewater treatment [32,33], reforming reaction [34], and methanol production [10,11,19,35].
NTP can operate at room temperature and atmospheric pressure while generating highly active electrons, with mean electron energy between 1 and 10 eV. This electron energy is the optimum range in order to activate molecular and atomic species and break chemical bonds [36]. NTP technologies are advantageous over thermal processes as reaction rates are higher and a steady state is achieved much faster [22]. On the other hand, the DBD reactor has the capacity to produce highly energetic electrons and uniform distribution discharges and is efficient in initiating chemical reactions under room conditions [37,38,39]. The combination of NTP with the main advantages of DBD reactors enables this system to be an ideal candidate for CO2 utilization.
Therefore, NTP has high potential as an efficient CO2 utilization process, as it can overcome the stability of CO2 without the need for the high temperatures required in thermal catalytic processes. This facilitates quick start-up and shut-down, a promising feature that enables plasma technology powered by renewable energy to act as an efficient chemical energy storage [40].
In this work, the study of the conversion of CO2 into CO through a DBD plasma reactor was developed by a sensitivity analysis for the CO2 flowrate and the concentration of Ar that was used as a diluent; then, a sustainability assessment was considered for the suitability of using photovoltaic energy as an energy source to power the DBD plasma reactor.

2. Materials and Methods

2.1. Materials

The following reactants were used: Argon (Ar) (Carburos Metálicos; 99.9997%), Carbon dioxide (CO2) (Carburos Metálicos; 99.999%) and the copper/zinc-based catalyst (Alfa Aesar; copper-based catalyst (pellets, 5.4 mm × 3.6 mm)) with a composition of Al2O3 10%, CuO 64%, MgO 2% and ZnO 24%.

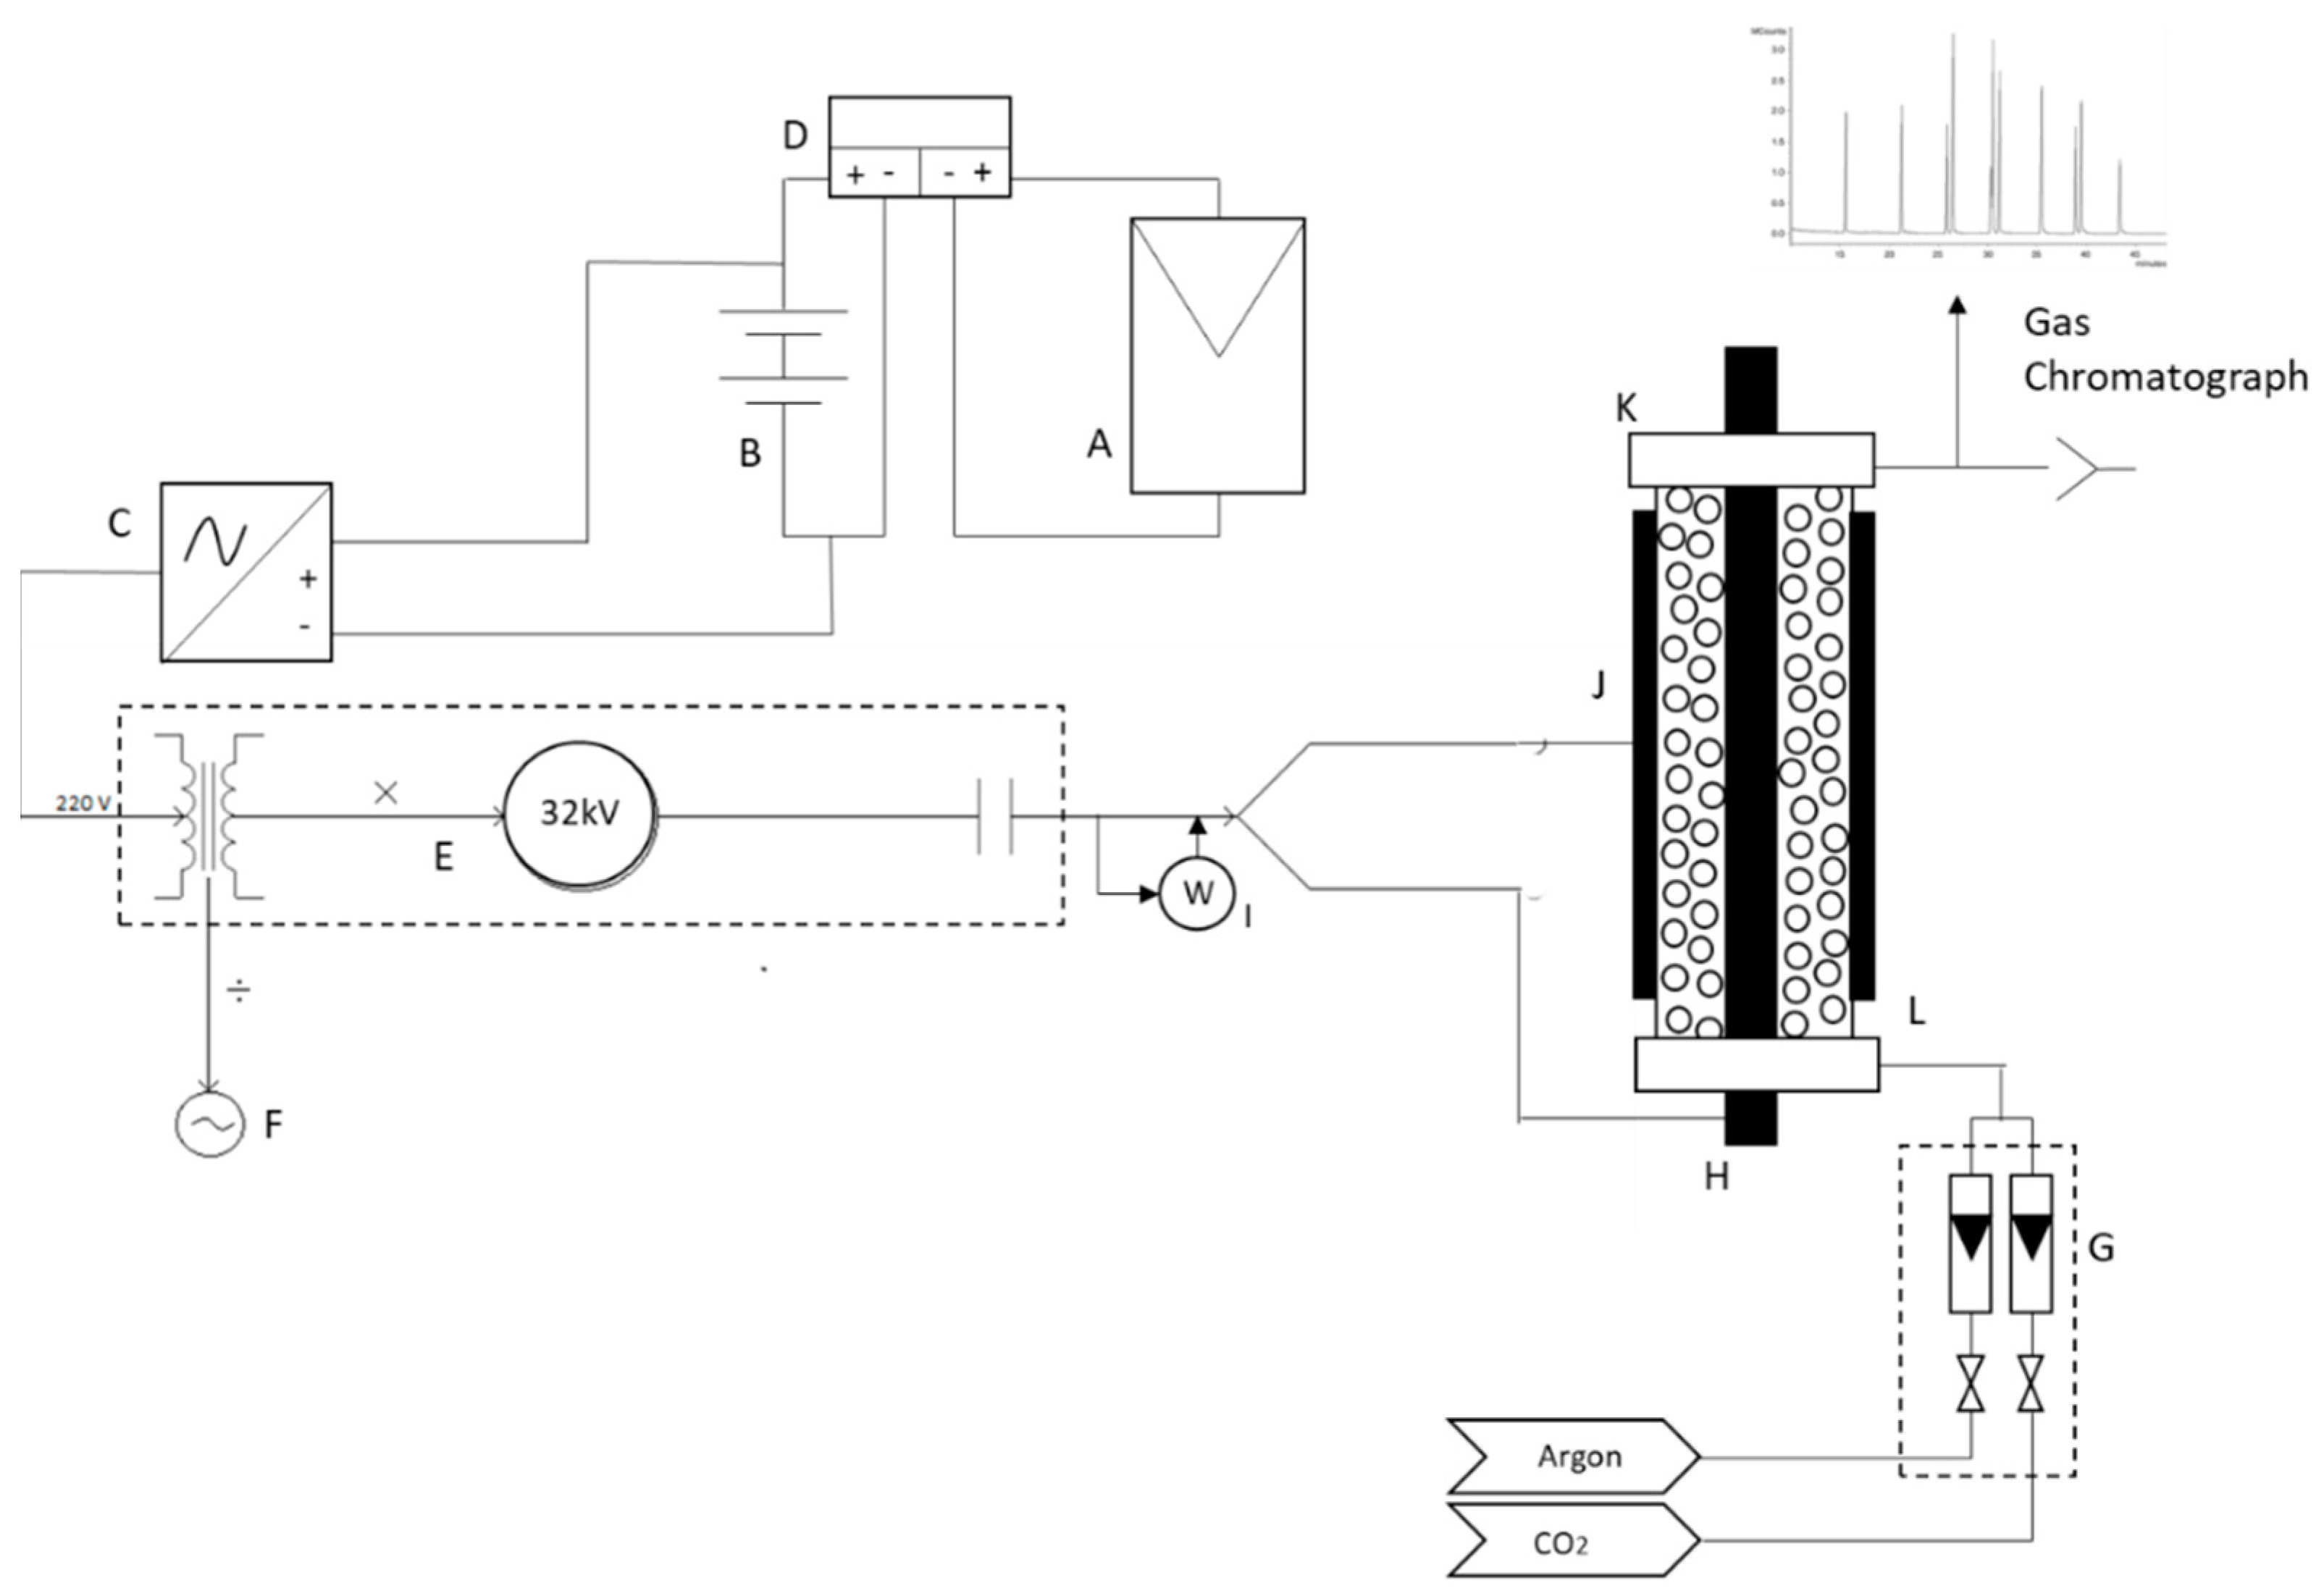
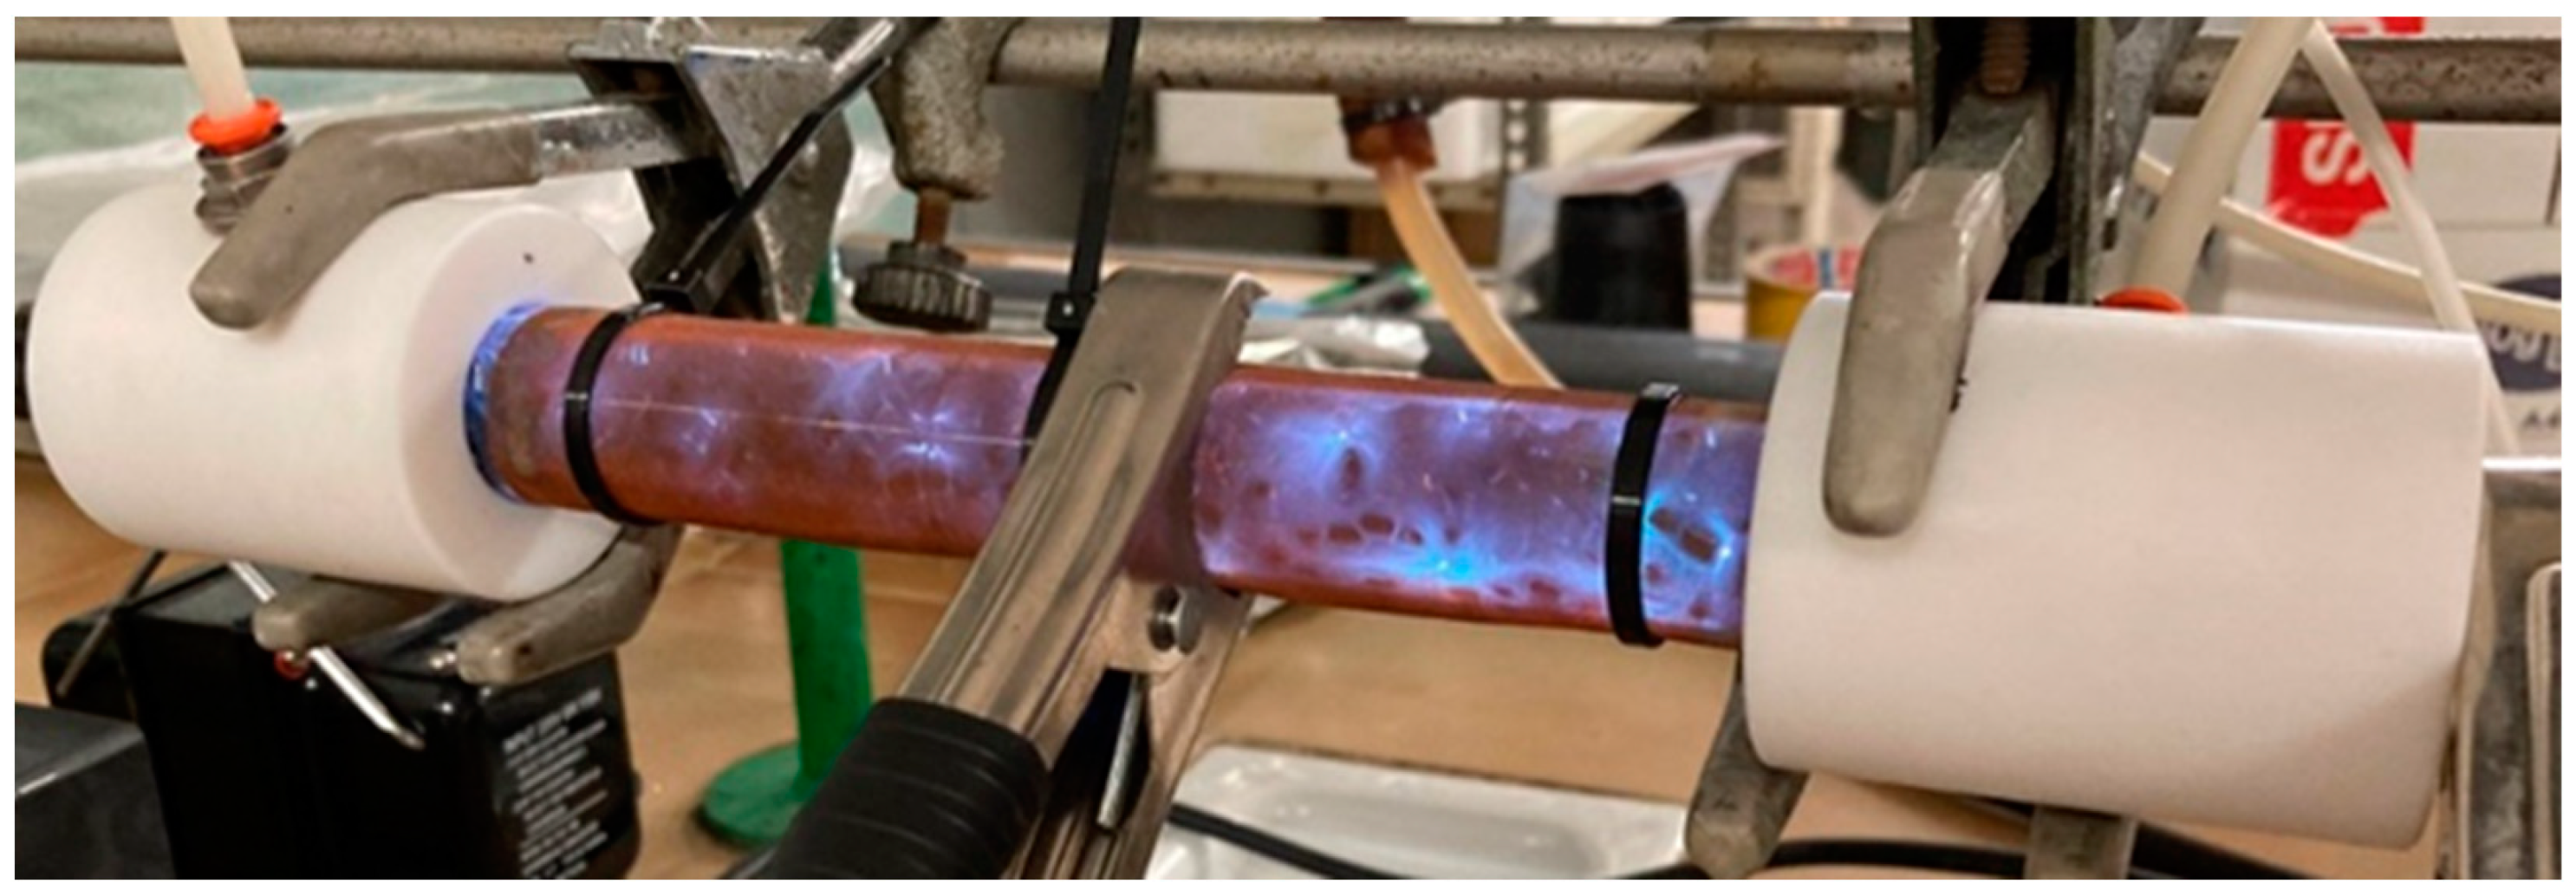
2.2. Experimental Setup

Figure 1 shows the experimental setup used in this work. Briefly, a cylindrical quartz tube, length: 250 mm; outer diameter: 25 mm; inner diameter: 24 mm, (Vidrasa, Ripollet, Barcelona, Spain) was used to generate the plasma discharge. A copper rod (Broncesval, Ripollet, Barelona, Spain) with an outer diameter of 5 mm was used as the internal electrode (anode) and the outer electrode (cathode) was a copper mesh of 160 mm, which was wrapped around the quartz tube, as shown in Figure 1. The resulting discharge gap was 10 mm. An amount of 40 g catalyst sandwiched between quartz wool was placed in the discharge area zone. NTP was generated by an AC high voltage power supply with a frequency, duty cycle, and voltage controller: Plasma Drive PVM500/DIDRIVE10 (Amazing1, Mont Vernon, NH, USA). The AC high-voltage power supply was connected to a photovoltaic (PV) system in order to provide the electricity needed to carry out the experimental tests. The PV system, which consisted of one solar panel Tecnosun 150 W, was placed outside to receive sunlight, using two batteries Rolls 6 V and 480 Ah and CC/AC inverter model Victron Energy Phoenix 12/1200. All the CC system worked at 12 V and was controlled by a regulator STECA PR 2020 regulator. In this work, the necessary energy to run the tests was provided directly from the PV panels. The energy consumption was continuously determined with a wattmeter. A multi-channel oscilloscope Promax 0D-610 100 MHz (Promax, L’Hospitalet de Llobregat, Barcelona, Spain) was used to monitor the voltage, frequency and current intensity during the experiences. The amount of CO2 and Ar in the reactor was controlled with 2 flowmeters EL-FLOW® (Bronkhorst, Nijverheidsstraat, Ruurlo, The Netherlands).

2.3. CO2 Conversion into CO Experiments

All the experiments were performed at maximum voltage (32 kV), minimum frequency (20 kHz) and minimum duty changing flowrates of CO2 and Ar. All the volumetric flowrates used in this study are given under normal conditions. The power used in all experiments was around 50 W. The total time for each experiment was 30 s once the steady state was reached. Samples were collected in Tedlar bags for further analysis. The samples were analyzed with a gas chromatograph (Agilent 7020A, Santa Clara, CA, USA) equipped with an Agilent HP-PLOT Molesieve 19095P-MS0 column and a thermal conductivity detector (TCD). The injection, oven, and detector temperatures were 100 °C, 60 °C, and 250 °C, respectively. All the experiments were carried out in triplicate and the average values are shown in the figures with the standard deviation as error bars.

2.4. Environmental Sustainability Assessment

The environmental sustainability of the process using PV energy was studied by calculating the carbon footprint. The carbon footprint was assessed with the software SimaPro 9.0 (Amersfoort, The Netherlands) using a Life Cycle Assessment (LCA) approach. For the LCA, the Ecoinvent v3.6 database and the ILCD 2011 Midpoint methodology were used considering two different scenarios. The first scenario considers the supply of electricity from the electrical network and the second scenario considers the electricity provided by a PV system.
To determine the percentage of the CO2 emissions compensated ( EC co 2 ), Equation (1) was used.
EC co 2   ( % ) = Con CO 2 +   P CO E electricity × 100
where Con CO 2 (g CO2-eq/h) was the CO2 converted into CO in the DBD reactor and P CO (kg CO2-eq/h) was the CO2 emission that is related to the industrial production of the generated CO with a conventional process such hydrocarbon reforming. Finally, E electricity is the emission of CO2 (g CO2-eq/h) produced by the electrical consumption, which was measured with a wattmeter. The emission factors to produce electricity (from the electrical network or PV systems) and for the industrial production of CO were extracted from Ecoinvent.

3. Results and Discussion

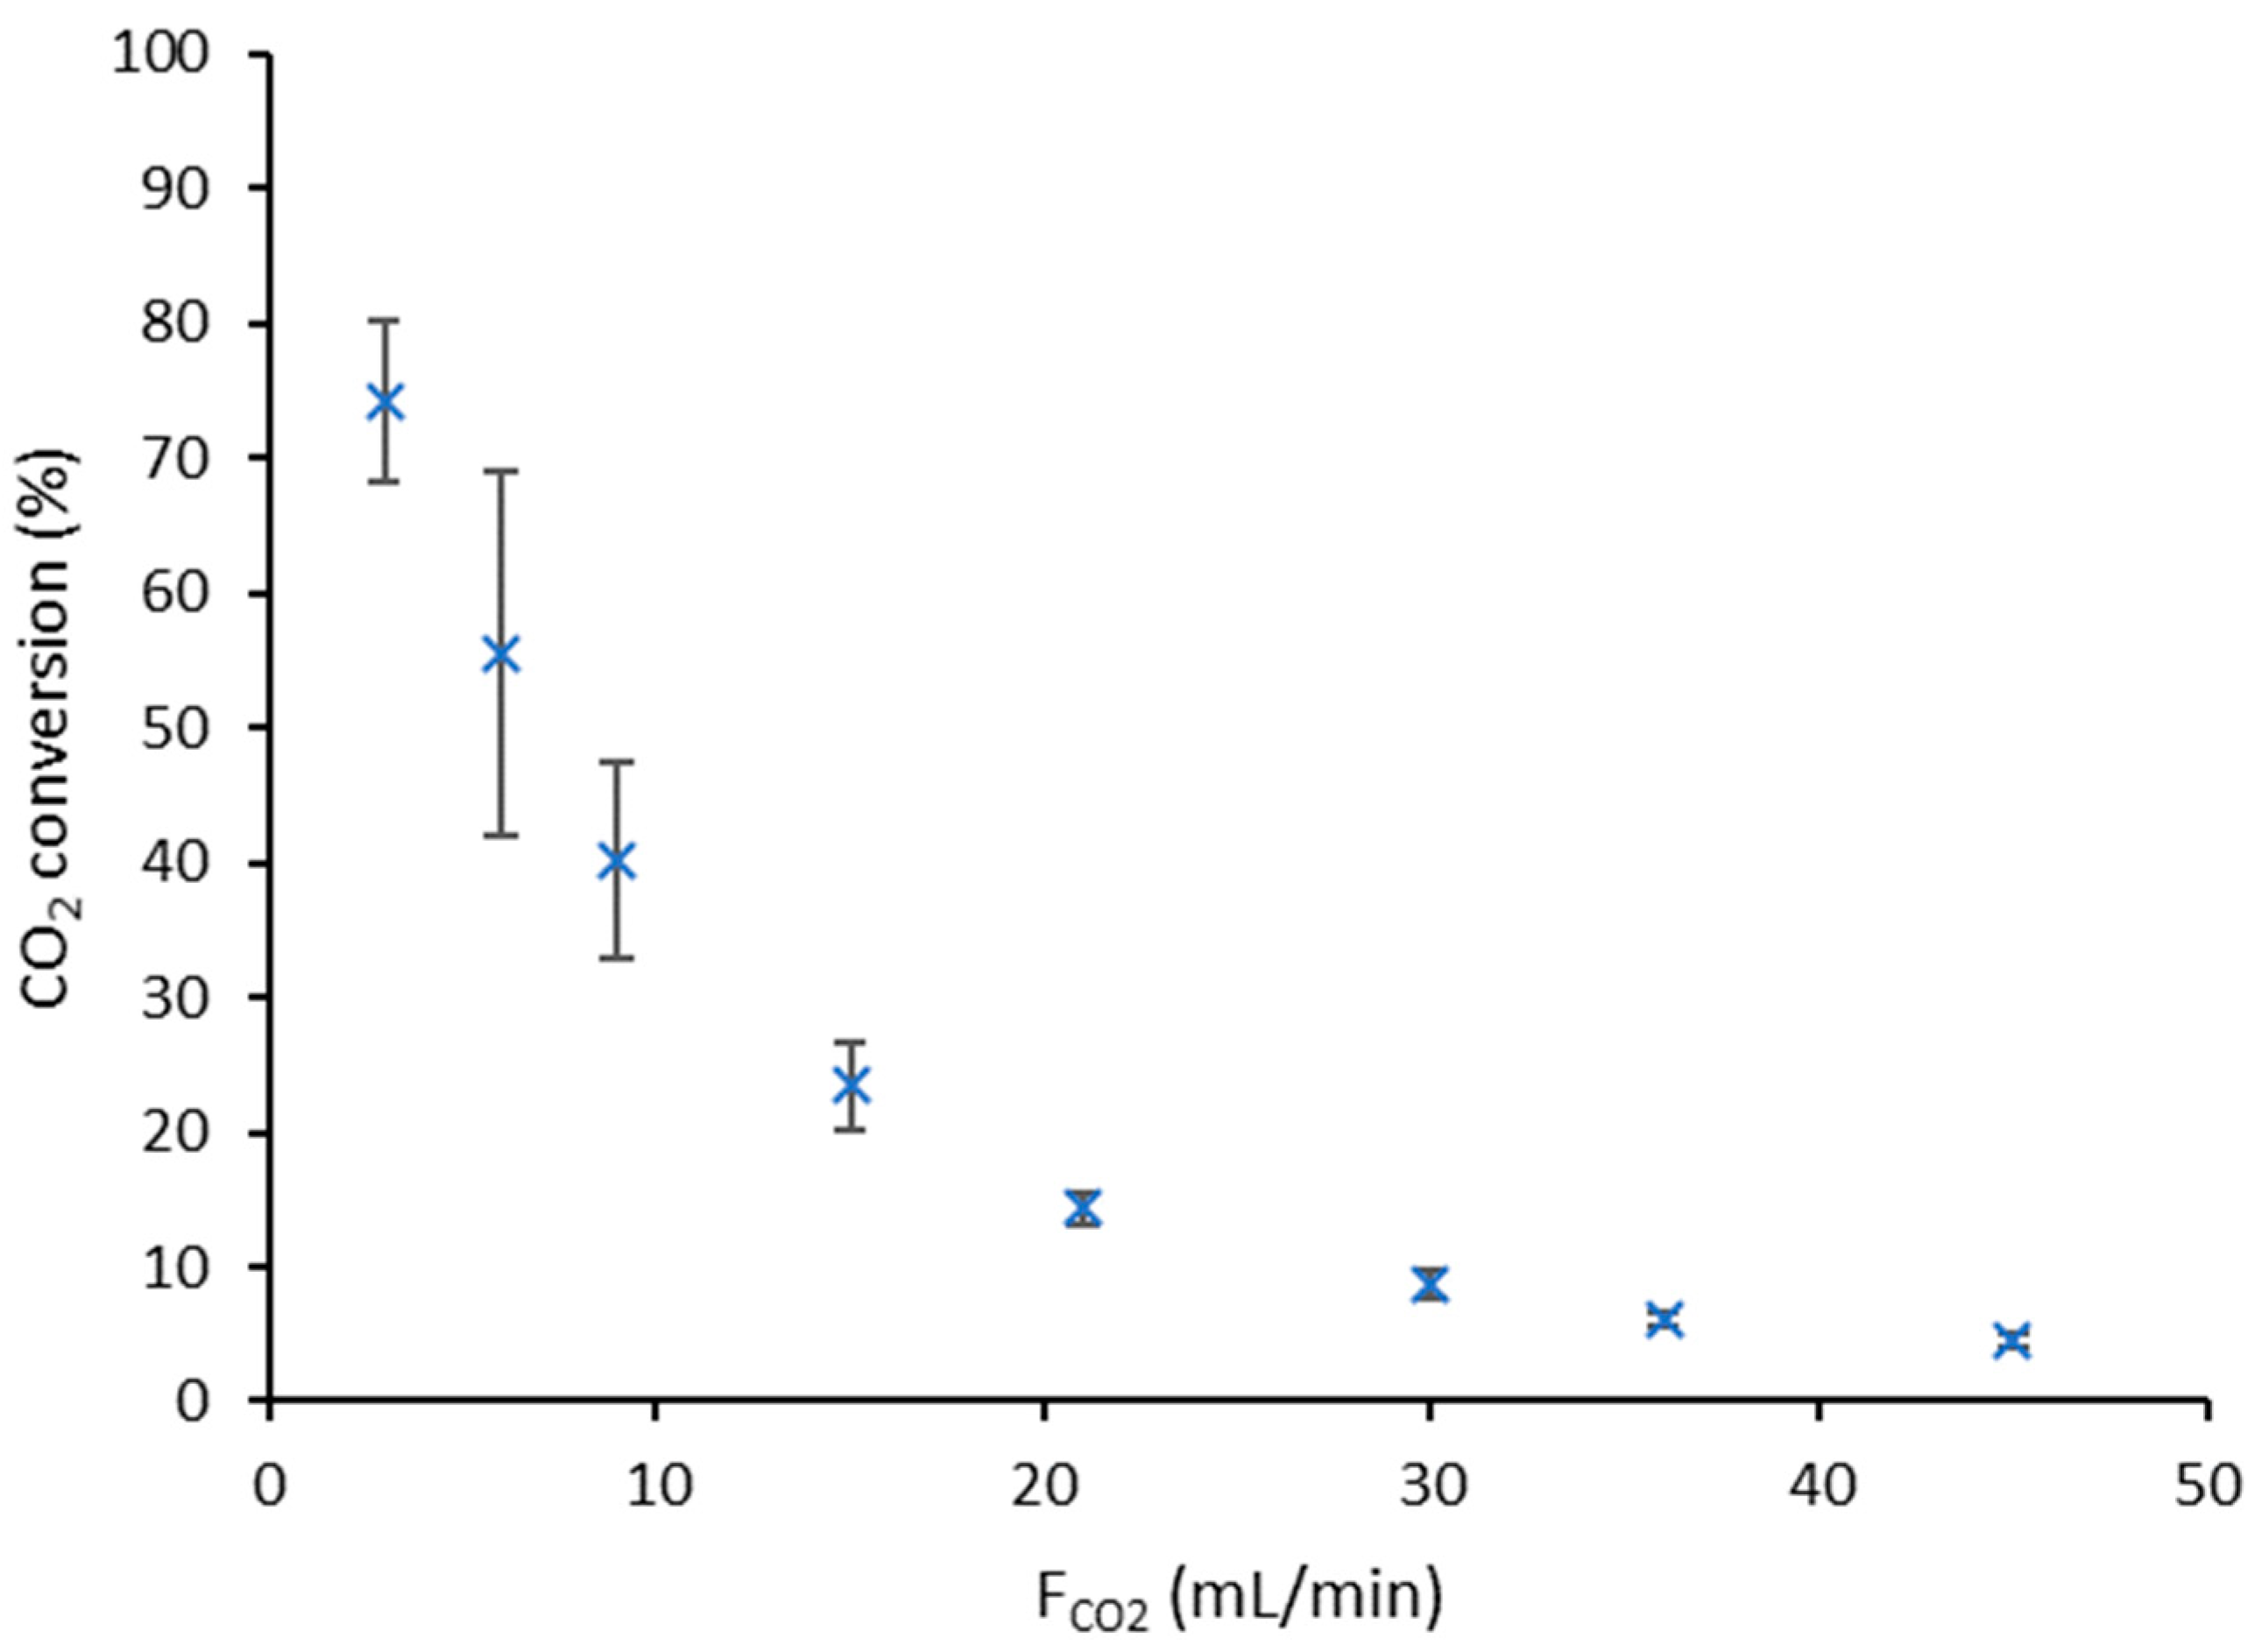
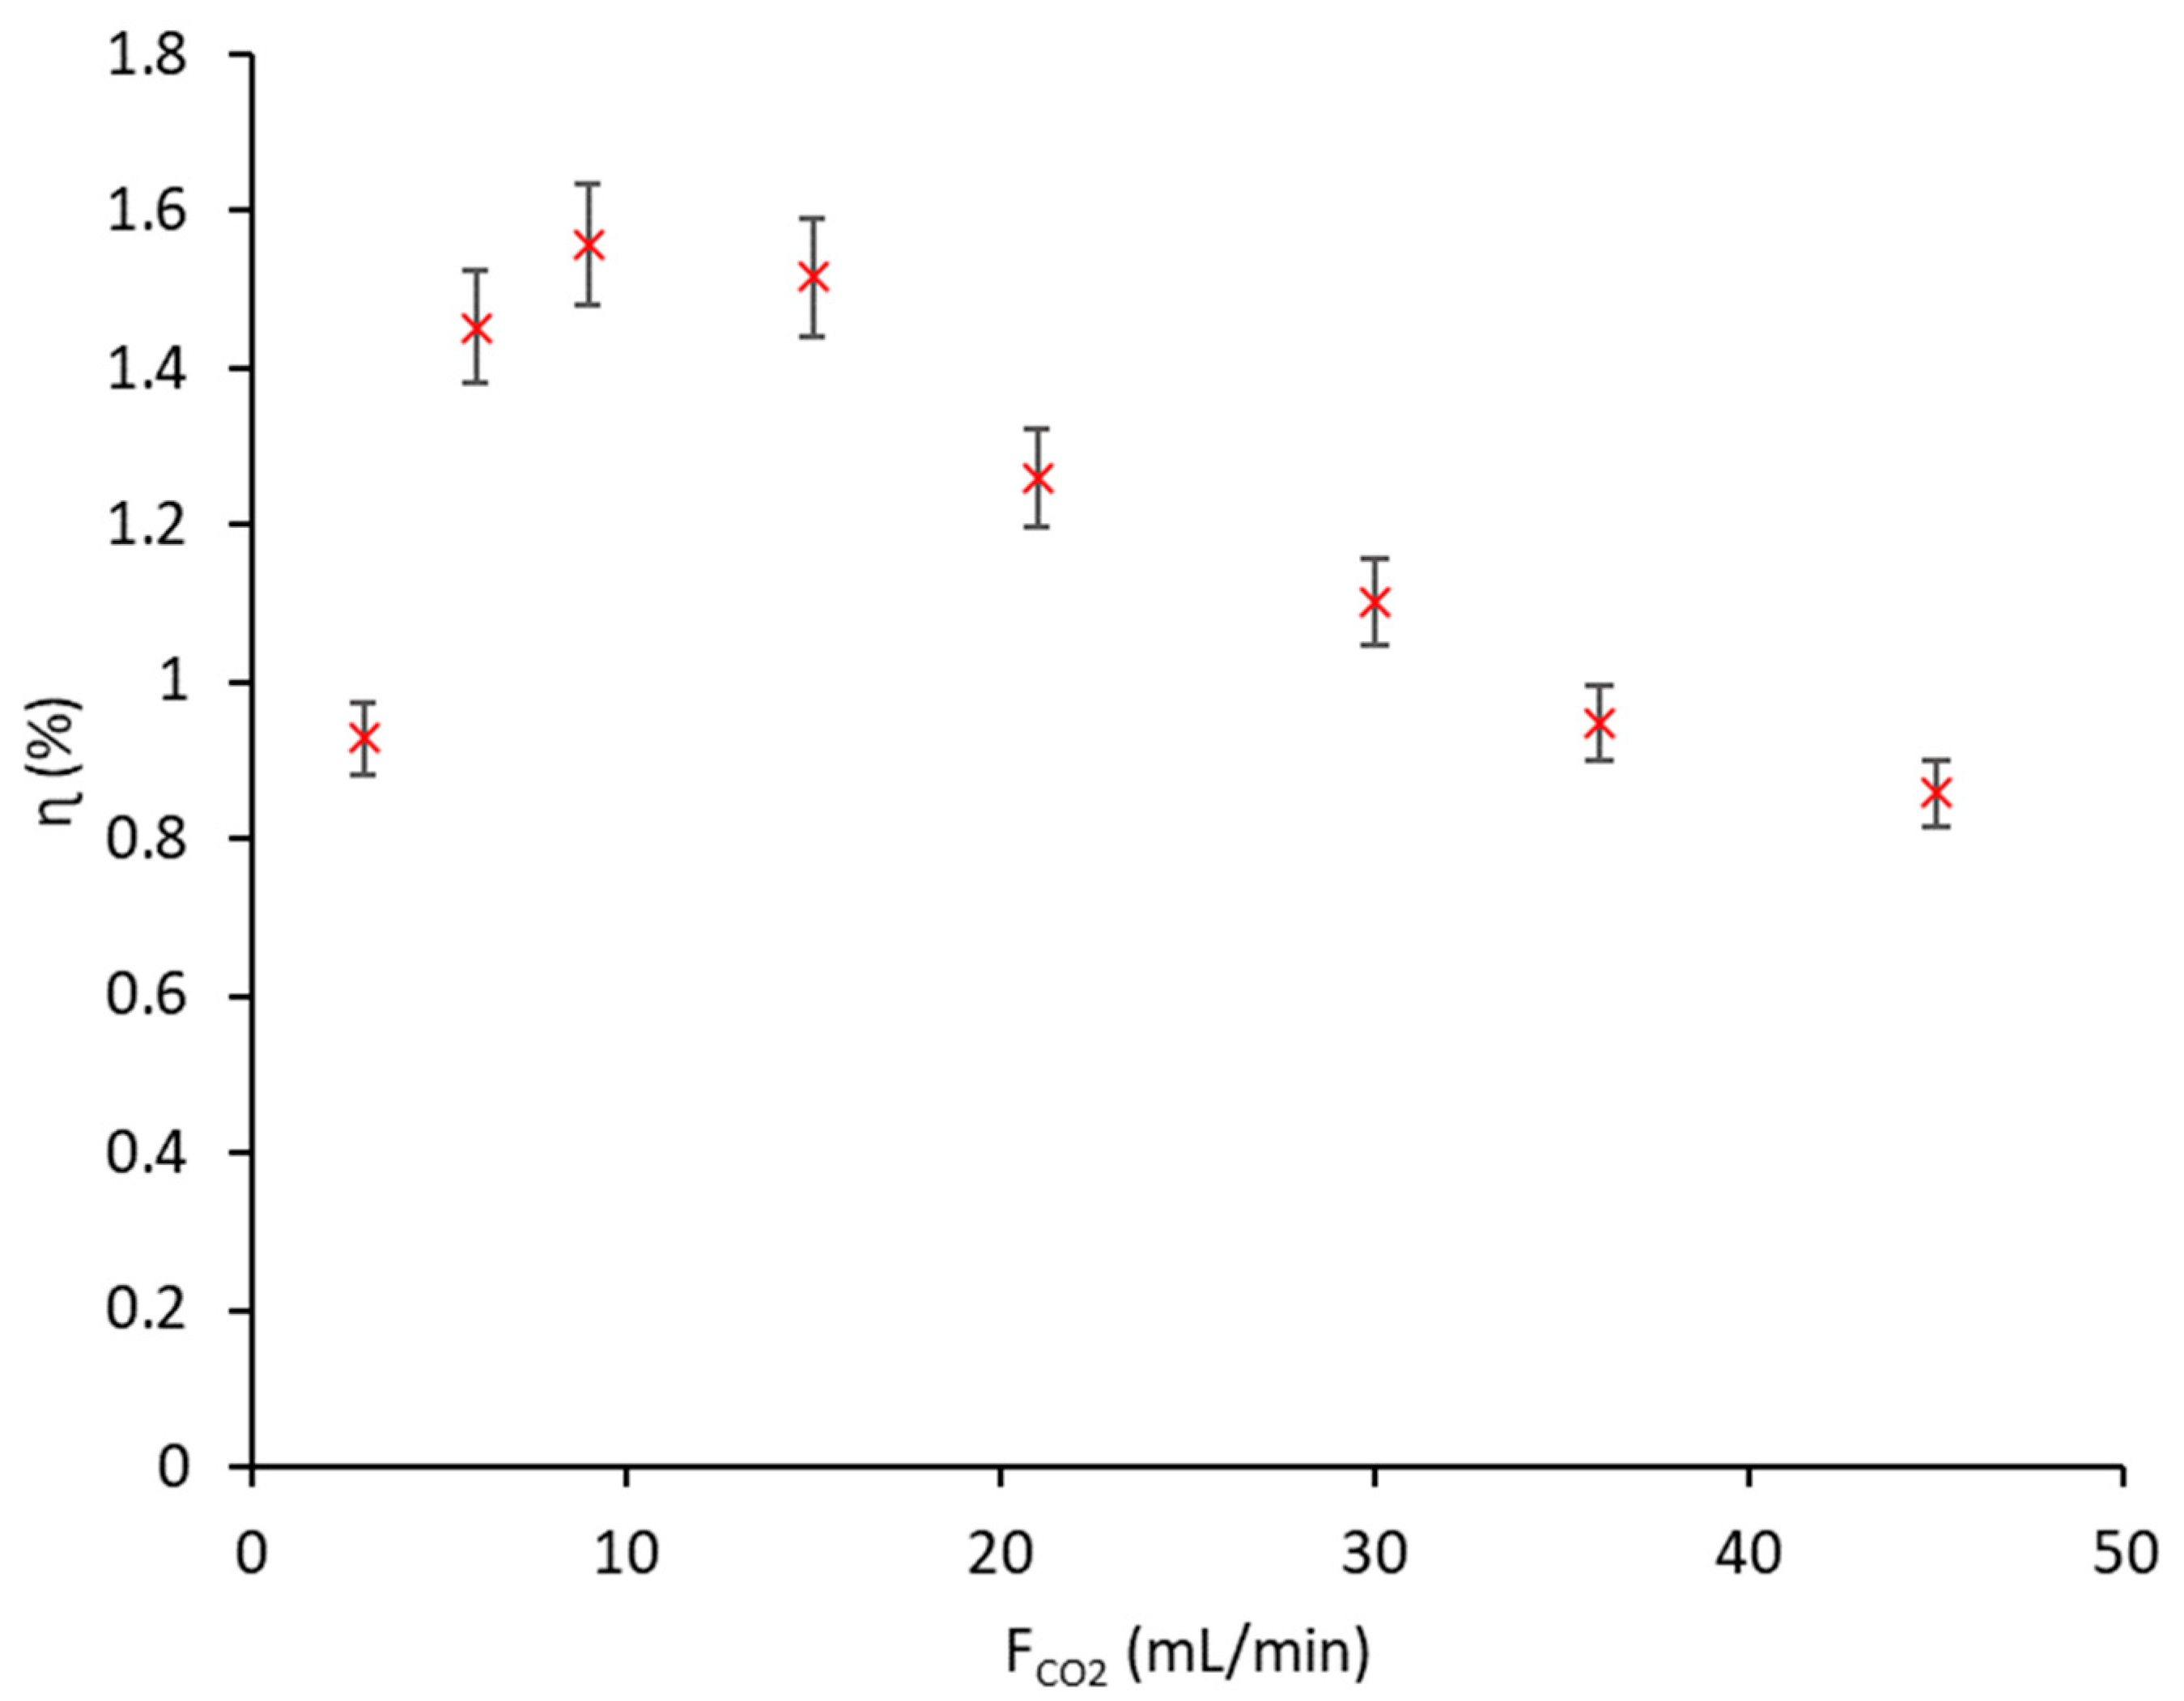
3.1. Influence of CO2 Flowrate

Low CO2 rates of decomposition have been found in the literature using pure CO2, whereas the use of Ar has been reported to be a good option due to the use of a diluent gas (gas to be ionized) increases CO2 conversion. When Ar is used, the main reaction pathway in the NTP zone involves Ar excitation and charge/energy transfer from excited Ar atoms to CO2 molecules [41]. Mei et al. [28] reported that Ar dilution is beneficial over other gases such as N2 and He. They observed that CO2 conversion increases with increasing Ar concentrations. The reason is that by decreasing the dielectric strength of the gas mixture, more energy is available for CO2 molecules in the discharge. In addition, the available electrons may excite CO2 molecules contributing to reaching higher conversions due to the lower number of CO2 molecules with respect to the Ar atoms. Mei et al. [28] also reported selectivities for CO2 conversion into CO in high Ar concentrations between 90–98% that increased at increasing Ar concentration. For that reason, Ar was used as diluent gas in this work. At the studied conditions, when voltage was applied between the two electrodes in the DBD reactor, NTP discharges were produced within the plasma reactor, as Figure 2 shows. It was observed randomized discharge points within the DBD plasma reactor that continuously changed. The NTP was fast generated or stopped by switching on or off the AC high voltage power supply, quickly reaching the steady state as suggested by Pou et al. [40].
Two important outcomes to check the performance of the reaction are the CO2 conversion and the energy efficiency (ɳ). The CO2 conversion (%) was determined with the following equation:
CO 2   Conversion   ( % ) = C CO 2 , in C CO 2 , out C CO 2 , in × 100
where C CO 2 , out is the molar concentration (%) of CO2 in the outlet stream and C CO 2 , in is the molar concentration (%) of CO2 in the inlet stream of the DBD reactor. From the chromatography analysis, it was found that a selectivity of almost 100% for CO was reached for all the tests (no other peaks different from CO or CO2 were observed). From these results, it was considered that CO was the major product and the stoichiometric conversion of CO2 into CO was achieved. So, the conversion and yield obtained were almost the same. This point has also been reported in previous works [28,40] where selectivities to CO higher than 95% were observed. Carbon deposition over the catalyst was not detected after CO2 decomposition with NTP. It must be highlighted that the CO selectivity did not present any dependence on other parameters studied in this work, such as CO2 or Ar flowrates. Other works shown in Table 1 reported selectivities ranging from 48 to 96%. Therefore, the influence of plasma operational parameters on the NTP process will only be discussed in terms of CO2 conversion and energy efficiency. The energy efficiency of the NTP process was calculated using the following equation:
ɳ ( % ) = F CO 2 · CO 2 Conversion · Δ H CO 60 × 22.4 · P E × 100
where F CO 2 is the volumetric flowrate of CO2 in the inlet stream (mL/min), Δ H CO is the reaction enthalpy of pure CO2 decomposition into CO (283.1 kJ/mol [42]) and P E is the electric power used to carry out the reaction (W).
The effect of the CO2 flowrate on the CO2 conversion and energy efficiency was evaluated. In Figure 3, it can be observed how the CO2 conversion decreased by increasing the CO2 flowrate in the inlet. According to previous research [40], it has been proved that the generated NTP is more uniform at high Ar concentrations. In addition, at lower CO2 flowrates, the residence time in the reactor was higher and this would increase the probability that a NTP discharge could affect a CO2 molecule. This behavior has also been described using a fluidized bed NTP reactor with Cu/γ-Al2O3 powder-based catalyst [40]. The maximum CO2 conversion in this work was 74.2% and it was obtained at the lowest CO2 flowrate. This conversion was much higher than the one obtained by Ray et al. (maximum conversion of 15.7%) utilizing a packed DBD plasma reactor with Ni and Cu oxide supported γ-Al2O3 as catalyst [43]. Other works (Table 1) reported conversions ranging between 12–38.3%. In addition, the maximum conversion obtained in this work is much higher than the previous results obtained by our research group with a fluidized bed reactor and a Cu/γ-Al2O3 catalyst (a maximum conversion of 40% was reached) [40].
The CO2 flowrate shows an effect on the energy efficiency of the process, as can be observed in Figure 4. The maximum CO2 energy efficiency obtained in this study was 1.55%, using an Ar flowrate of 1 L/min and a CO2 flowrate of 9 mL/min. This value was similar to the results obtained with a fluidized bed reactor (1.3–2.0%) [40]; however, still less efficient than other works published in the literature working with DBD reactors that obtained energy efficiencies ranging from 7 to 45.2% (Table 1). The main reason to explain these differences in energy efficiency is caused by the different operational conditions (use of diluent gas, CO2 flowrate, catalyst, and power discharge). Probably, the amount of energy applied (power discharge) related to the CO2 flowrate used is too high compared with the literature. When the CO2 flowrate increased too much, the energy efficiency was affected by a lower CO2 conversion, as observed previously in Figure 3.
The formation of active species in the DBD reactor is entirely dependent on the initial concentration of reactants and the specific input energy ( SIE ). The SIE (kJ/L) was calculated with the following equation:
SIE = P E · 60 F CO 2
With a catalyst, not only the concentration of the reactants but also the reduced electric field enhances inside the plasma zone, which in turn generates more chemically reactive species and significantly contributes to the activation of CO2. The conversion rate of CO2 was determined from Equation (5) [16].
ln ( C CO 2 ,   in C CO 2 ,   out ) = SIE · k + c
The conversion rate is expressed by k, and c stands for the intercept. Figure 5 reports the lineal increment of ln(CCO2,in/CCO2,out) as a function of SIE. The decomposition rate observed was of 0.0014 L/kJ. This value was lower than the value obtained by Ray et al. [43], who obtained a maximum conversion rate of 0.02889 L/kJ using 15% CuO/Al2O3 catalyst and without Ar dilution. They worked with lower SIE values which can also affect the conversion rate. So, it is plausible that the difference between conversion rates is caused by differences in the operational conditions.

3.2. Influence of Argon Flowrate

In the previous section, it was revealed that at lower CO2 flowrates the residence time in the DBD plasma reactor was higher, thus, improving CO2 conversion. Another important variable of the process is the use of Ar as a diluent gas. For that reason, it was studied the influence of the Ar flowrate on the CO2 conversion into CO. This study was also carried out at different CO2 flowrates (so at different CO2 concentrations), and the results are shown in Figure 6.
Figure 6 shows how the conversion increases linearly with increasing Ar flowrates as reported in other works [39,40]. During the experiments, it was observed that at higher Ar flowrates, the NTP generated was more uniform and with a higher number of discharges inside of the reactor. This explains why at a high Ar flowrate the conversions obtained are higher.

3.3. Environmental Impact Using Photovoltaic Energy to Power the DBD Reactor

The assessment of the ECco2 was performed considering two different scenarios. The first scenario uses the electricity mix of Spain to run the DBD reactor, whereas the second scenario considers the current configuration of this work, supplying energy with a PV system. In Figure 7, it can be seen how the first scenario represents a lower compensation of CO2 emissions (between 7–13%). It can be noticed that it shows a similar tendency to the energy efficiency plot (Figure 4), as they are correlated; therefore, with this first scenario, the emissions derived from the electricity mix are much higher than those which can be counterbalanced by the CO2 captured and the CO produced during the DBD reaction. According to the Ecoinvent database, the emission factors related to the consumption of 1 kWh with the electricity mix of Spain and the production of 1 kg of industrial CO would be estimated as 0.131 kg of CO2-eq and 1.51 kg of CO2-eq, respectively.
The optimal experiment (highest energy efficiency) was at a CO2 flowrate of 9 mL/min. In this experiment, the CO2 converted to CO (CCO2) was 0.43 g CO2-eq/h, whereas the emission avoided by the production of CO (PCO) was 0.41 g CO2-eq/h. The energy consumption was 0.11 kWh per each gram of CO2 transformed into CO. The emission related to the electricity consumption (Eelectricity) considering the electricity mix of Spain was 6.42 g CO2-eq/h.
Taking into account the PV system scenario, the ECco2 rose up to 97% (Figure 7). This shows how the combination of the NTP process with PV systems significantly enhances the sustainability perspectives of the process. This increase would be justified by the lower emission factors related to the production of 1 kWh using PV panels (Ecoinvent database → 0.018 kg of CO2-eq). There is a difference of one order of magnitude lower than the emission factor of the electricity from the electrical grid. The emission related to the electricity consumption (Eelectricity) in the optimal experiment (9 mL/min of CO2) using the PV system was 0.86 g CO2-eq/h. That is why the obtained results clearly evidenced that the combination of the DBD reactor with renewable energy significantly enhances the life cycle assessment of the process, reaching almost a complete compensation of the CO2 emissions with a more sustainable perspective.

4. Conclusions

A cylindrical packed-bed DBD plasma reactor was used for the conversion of CO2 into CO using a copper and zinc-based catalyst, copper electrodes, Ar as a diluent gas, and photovoltaic energy as an electricity source. Parameters such as CO2 flowrate in the inlet gas stream and Ar flowrate were assessed. The main findings of this study are stated below:
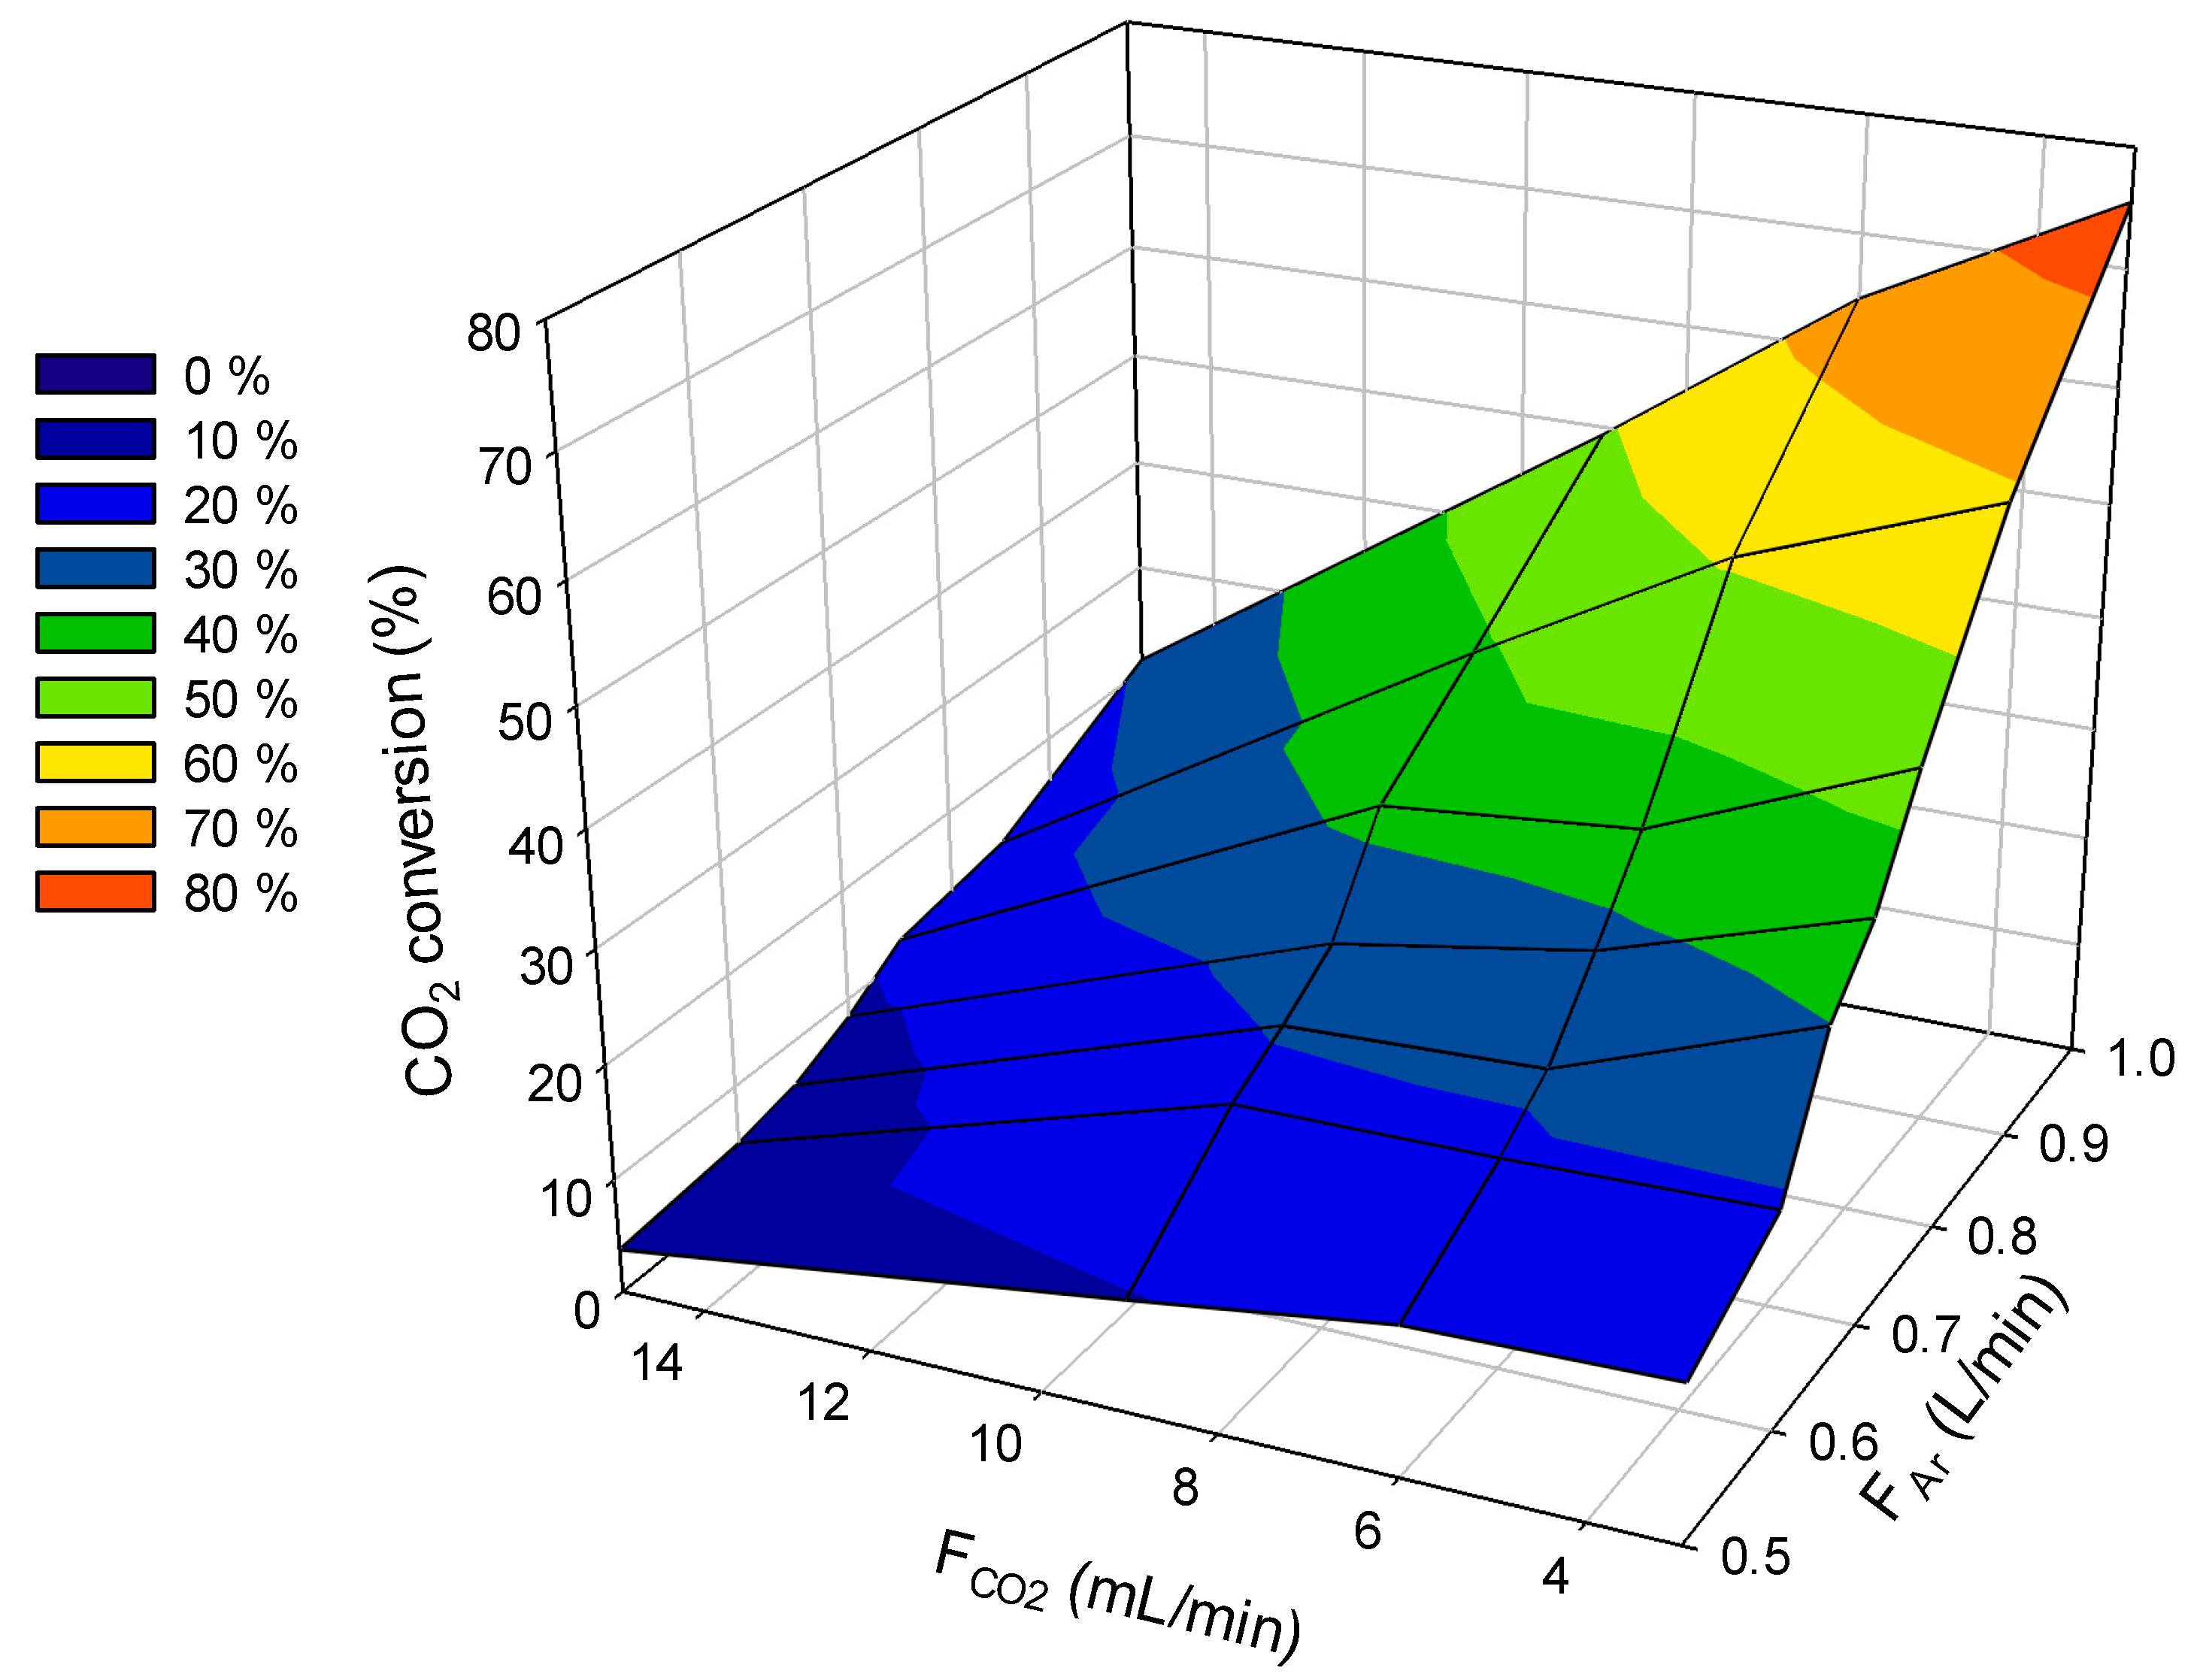
  • The concentration of CO2 in the inlet of the reactor is an important variable. The CO2 conversion is higher at lower CO2 concentrations. An increase in CO2 concentration causes a major decline in CO2 conversion.
  • The maximum CO2 conversion was 74.2%, using an Ar flowrate of 1 L/min and a CO2 flowrate of 3 mL/min, applying 50 W, a frequency of 20 kHz, and a minimum duty cycle.
  • The presence of the diluent gas (Ar) has a strong influence on the decomposition of CO2. It was observed that at higher Ar concentrations, the conversion improved.
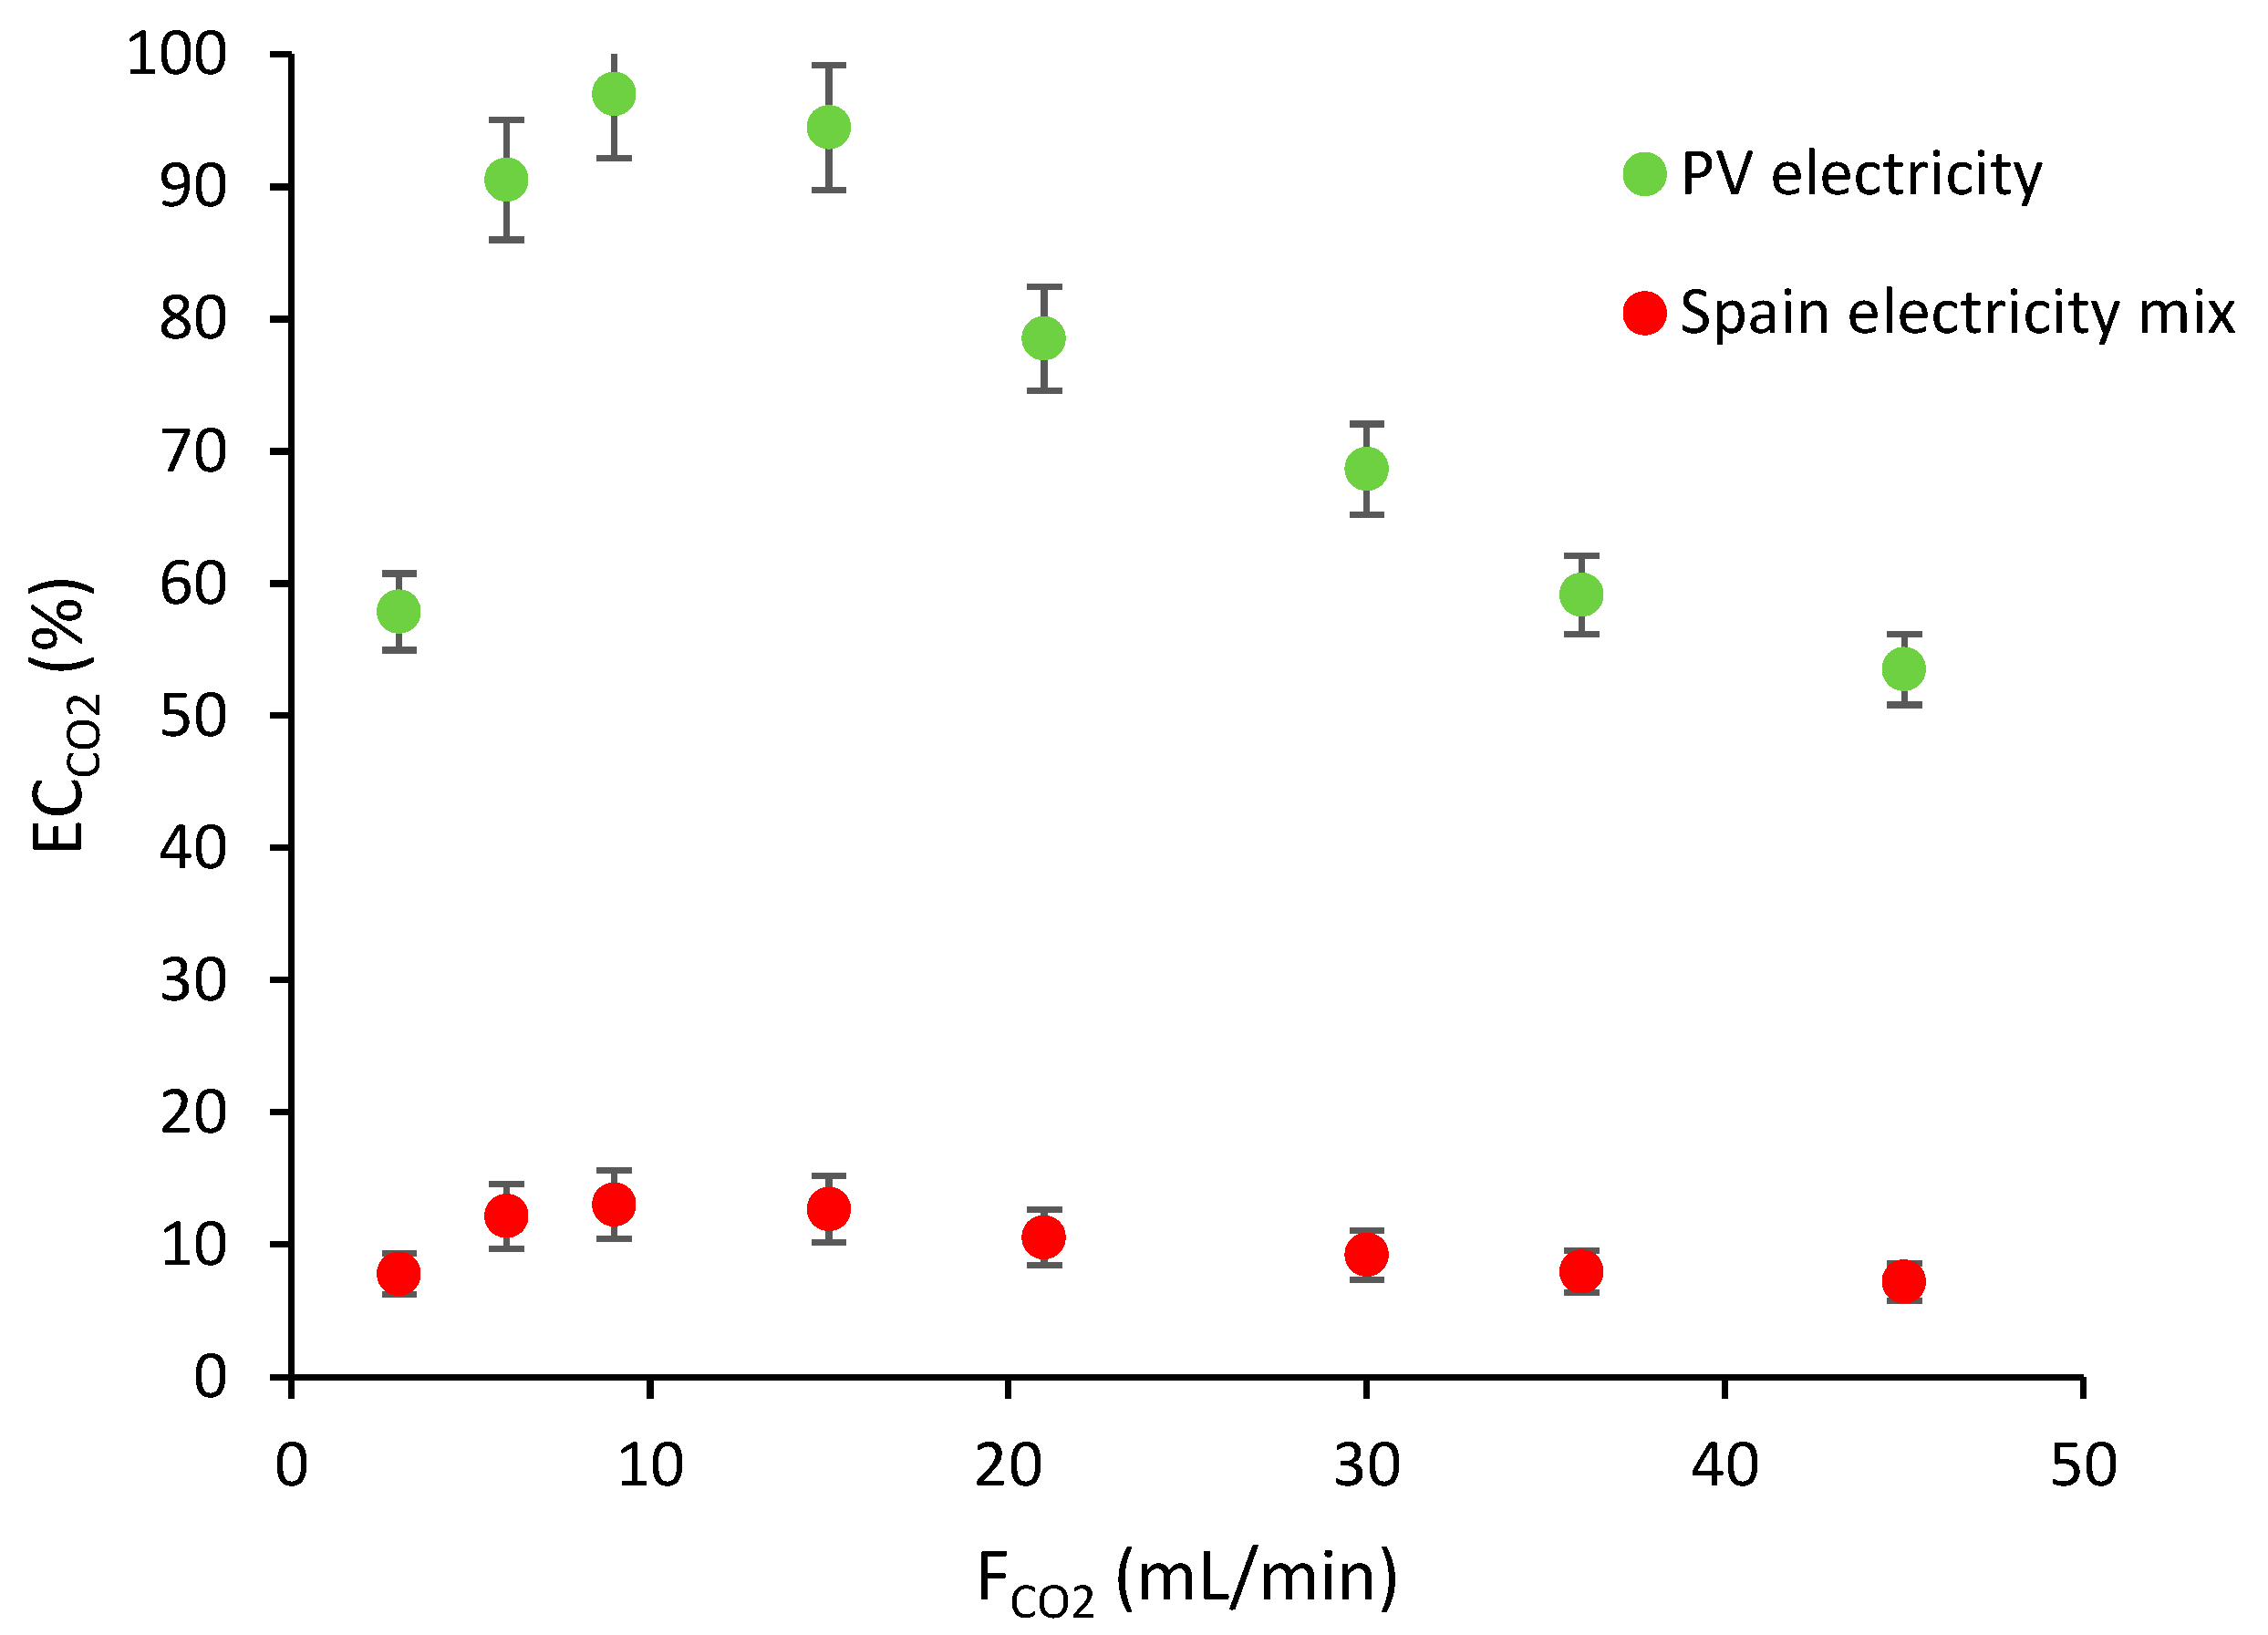
  • The use of photovoltaic energy increases the sustainability of the process. Using an LCA approach, it was estimated, for the decomposition reaction, that, with the best conditions obtained in this study, it would be possible to compensate 97% of the CO2 emissions related to the process.

Author Contributions

Conceptualization, J.O.P. and R.G.-O.; methodology, J.O.P.; investigation, E.E., J.O.P. and R.G.-O.; resources, J.O.P.; writing—original draft preparation, J.O.P., J.F.-G. and R.G.-O.; writing—review and editing, J.O.P., J.F.-G. and R.G.-O.; supervision, R.G.-O.; project administration, J.O.P. and J.F.-G.; funding acquisition, J.O.P. and J.F.-G. All authors have read and agreed to the published version of the manuscript.

Funding

This research was funded by La Caixa grant number (2018-LC-13) and AGAUR (2021 BP 0029).

Institutional Review Board Statement

Not applicable.

Informed Consent Statement

Not applicable.

Data Availability Statement

Not applicable.

Acknowledgments

GESPA group has been recognized as a Consolidated Research Group by the Catalan Government with code 2017-SGR-1016. The authors acknowledge La Caixa and AGAUR (Catalan Government) for the funding.

Conflicts of Interest

The authors declare that they have no known competing financial interests or personal relationships that could have appeared to influence the work reported in this paper.

References

  1. Huisingh, D.; Zhang, Z.; Moore, J.C.; Qiao, Q.; Li, Q. Recent advances in carbon emissions reduction: Policies, technologies, monitoring, assessment and modeling. J. Clean. Prod. 2015, 103, 1–12. [Google Scholar] [CrossRef]
  2. Fernandez, J.; Sotenko, M.; Derevschikov, V.; Lysikov, A.; Rebrov, E.V. A radiofrequency heated reactor system for post-combustion carbon capture. Chem. Eng. Process. Process Intensif. 2016, 108, 17–26. [Google Scholar] [CrossRef]
  3. Sotenko, M.; Fernández, J.; Hu, G.; Derevschikov, V.; Lysikov, A.; Parkhomchuk, E.; Semeykina, V.; Okunev, A.; Rebrov, E.V. Performance of novel CaO-based sorbents in high temperature CO 2 capture under RF heating. Chem. Eng. Process. Process Intensif. 2017, 122, 487–492. [Google Scholar] [CrossRef]
  4. Yu, C.-H.; Huang, C.-H.; Tan, C.-S. A Review of CO2 Capture by Absorption and Adsorption. Aerosol Air Qual. Res. 2012, 12, 745–769. [Google Scholar] [CrossRef]
  5. Zhang, Y.; Lu, X.; Ji, X. Carbon Dioxide Capture. In Deep Eutectic Solvents; John Wiley & Sons Ltd.: Hoboken, NJ, USA, 2019; pp. 297–319. [Google Scholar] [CrossRef]
  6. Gutierrez-Ortega, A.; Menacho, J.; Gonzalez-Olmos, R.; Nomen, R.; Sempere, J. Numerical simulation of fixed bed for CO2 capture in a fossil fuel emission points by Pressure Swing Adsorption system. In 27th European Symposium on Computer Aided Process Engineering; Espuña, A., Graells, M., Puigjaner, L., Eds.; Elsevier: Amsterdam, The Netherlands, 2017; pp. 415–420. [Google Scholar] [CrossRef]
  7. Williams, G. 9th carbon dioxide utilisation summit 2017. In Johnson Matthey Technology Review; Johnson Matthey Public Limited Company: Royston, UK, 2018; pp. 389–394. [Google Scholar] [CrossRef]
  8. Centi, G.; Quadrelli, E.A.; Perathoner, S. Catalysis for CO2 conversion: A key technology for rapid introduction of renewable energy in the value chain of chemical industries. Energy Environ. Sci. 2013, 6, 1711–1731. [Google Scholar] [CrossRef]
  9. Song, C. Global challenges and strategies for control, conversion and utilization of CO2 for sustainable development involving energy, catalysis, adsorption and chemical processing. Catal. Today 2006, 115, 2–32. [Google Scholar] [CrossRef]
  10. Olah, G.A.; Goeppert, A.; Prakash, G.K.S. Chemical Recycling of Carbon Dioxide to Methanol and Dimethyl Ether: From Greenhouse Gas to Renewable, Environmentally Carbon Neutral Fuels and Synthetic Hydrocarbons. J. Org. Chem. 2008, 74, 487–498. [Google Scholar] [CrossRef]
  11. Li, S.; Guo, L.; Ishihara, T. Hydrogenation of CO2 to methanol over Cu/AlCeO catalyst. Catal. Today 2020, 339, 352–361. [Google Scholar] [CrossRef]
  12. Yuan, L.; Lu, K.-Q.; Zhang, F.; Fu, X.; Xu, Y.-J. Unveiling the interplay between light-driven CO2 photocatalytic reduction and carbonaceous residues decomposition: A case study of Bi2WO6-TiO2 binanosheets. Appl. Catal. B Environ. 2018, 237, 424–431. [Google Scholar] [CrossRef]
  13. Zhou, A.; Chen, D.; Ma, C.; Yu, F.; Dai, B. DBD Plasma-ZrO2 Catalytic Decomposition of CO2 at Low Temperatures. Catalysts 2018, 8, 256. [Google Scholar] [CrossRef]
  14. Jwa, E.; Moks, Y.; Lee, S. Conversion of carbon oxides into methane in a nonthermal plasma-catalytic reactor. Eur. Phys. J. Appl. Phys. 2011, 56, 24025. [Google Scholar] [CrossRef]
  15. Wu, P.; Li, X.; Ullah, N.; Li, Z. Synergistic effect of catalyst and plasma on CO2 decomposition in a dielectric barrier discharge plasma reactor. Mol. Catal. 2020, 499, 111304. [Google Scholar] [CrossRef]
  16. Ray, D.; Chawdhury, P.; Subrahmanyam, C. A facile method to decompose CO2 using a g-C3N4-assisted DBD plasma reactor. Environ. Res. 2020, 183, 109286. [Google Scholar] [CrossRef] [PubMed]
  17. Zhang, K.; Zhang, G.; Liu, X.; Phan, A.N.; Luo, K. A Study on CO2 Decomposition to CO and O2 by the Combination of Catalysis and Dielectric-Barrier Discharges at Low Temperatures and Ambient Pressure. Ind. Eng. Chem. Res. 2017, 56, 3204–3216. [Google Scholar] [CrossRef]
  18. Li, H.; Liao, J.C. Biological conversion of carbon dioxide to photosynthetic fuels and electrofuels. Energy Environ. Sci. 2013, 6, 2892–2899. [Google Scholar] [CrossRef]
  19. Wang, W.-H.; Himeda, Y.; Muckerman, J.T.; Manbeck, G.F.; Fujita, E. CO2 Hydrogenation to Formate and Methanol as an Alternative to Photo- and Electrochemical CO2 Reduction. Chem. Rev. 2015, 115, 12936–12973. [Google Scholar] [CrossRef]
  20. Lu, P.; Yang, Y.; Yao, J.; Wang, M.; Dipazir, S.; Yuan, M.; Zhang, J.; Wang, X.; Xie, Z.; Zhang, G. Facile synthesis of single-nickel-atomic dispersed N-doped carbon framework for efficient electrochemical CO2 reduction. Appl. Catal. B Environ. 2018, 241, 113–119. [Google Scholar] [CrossRef]
  21. Yap, D.; Tatibouët, J.-M.; Batiot-Dupeyrat, C. Carbon dioxide dissociation to carbon monoxide by non-thermal plasma. J. CO2 Util. 2015, 12, 54–61. [Google Scholar] [CrossRef]
  22. Wen, Y.; Jiang, X. Decomposition of CO2 Using Pulsed Corona Discharges Combined with Catalyst. Plasma Chem. Plasma Process. 2001, 21, 665–678. [Google Scholar] [CrossRef]
  23. Mikoviny, T.; Kočan, M.; Matejcik, S.; Mason, N.J.; Skalny, J.D. Experimental study of negative corona discharge in pure carbon dioxide and its mixtures with oxygen. J. Phys. D Appl. Phys. 2003, 37, 64–73. [Google Scholar] [CrossRef]
  24. Ramakers, M.; Trenchev, G.; Heijkers, S.; Wang, W.; Bogaerts, A. Gliding Arc Plasmatron: Providing an Alternative Method for Carbon Dioxide Conversion. ChemSusChem 2017, 10, 2642–2652. [Google Scholar] [CrossRef] [PubMed]
  25. Nagassou, D.; Mohsenian, S.; Nallar, M.; Yu, P.; Wong, H.-W.; Trelles, J.P. Decomposition of CO2 in a solar-gliding arc plasma reactor: Effects of water, nitrogen, methane, and process optimization. J. CO2 Util. 2020, 38, 39–48. [Google Scholar] [CrossRef]
  26. Kozák, T.; Bogaerts, A. Evaluation of the energy efficiency of CO2 conversion in microwave discharges using a reaction kinetics model. Plasma Sources Sci. Technol. 2014, 24, 015024. [Google Scholar] [CrossRef]
  27. Qin, Y.; Niu, G.; Wang, X.; Luo, D.; Duan, Y. Status of CO2 conversion using microwave plasma. J. CO2 Util. 2018, 28, 283–291. [Google Scholar] [CrossRef]
  28. Mei, D.; Tu, X. Conversion of CO2 in a cylindrical dielectric barrier discharge reactor: Effects of plasma processing parameters and reactor design. J. CO2 Util. 2017, 19, 68–78. [Google Scholar] [CrossRef]
  29. Alliati, M.; Mei, D.; Tu, X. Plasma activation of CO2 in a dielectric barrier discharge: A chemical kinetic model from the microdischarge to the reactor scales. J. CO2 Util. 2018, 27, 308–319. [Google Scholar] [CrossRef]
  30. Mei, D.; He, Y.-L.; Liu, S.; Yan, J.; Tu, X. Optimization of CO2 Conversion in a Cylindrical Dielectric Barrier Discharge Reactor Using Design of Experiments. Plasma Processes Polym. 2015, 13, 544–556. [Google Scholar] [CrossRef] [Green Version]
  31. Subrahmanyam, C.; Renken, A.; Kiwi-Minsker, L. Catalytic abatement of volatile organic compounds assisted by non-thermal plasma: Part II. Optimized catalytic electrode and operating conditions. Appl. Catal. B Environ. 2006, 65, 157–162. [Google Scholar] [CrossRef]
  32. Chandana, L.; Lakshminarayana, B.; Subrahmanyam, C. Influence of hydrogen peroxide on the simultaneous removal of Cr(VI) and methylene blue from aqueous medium under atmospheric pressure plasma jet. J. Environ. Chem. Eng. 2015, 3, 2760–2767. [Google Scholar] [CrossRef]
  33. Chandana, L.; Subrahmanyam, C. Degradation and mineralization of aqueous phenol by an atmospheric pressure catalytic plasma reactor. J. Environ. Chem. Eng. 2018, 6, 3780–3786. [Google Scholar] [CrossRef]
  34. Ray, D.; Reddy, P.M.K.; Challapalli, S. Glass Beads Packed DBD-Plasma Assisted Dry Reforming of Methane. Top. Catal. 2017, 60, 869–878. [Google Scholar] [CrossRef]
  35. Wang, Y.-F.; Tsai, C.-H.; Shih, M.; Hsieh, L.-T.; Chang, W. Direct Conversion of Methane into Methanol and Formaldehyde in an RF Plasma Environment II: Effects of Experimental Parameters. Aerosol Air Qual. Res. 2005, 5, 211–224. [Google Scholar] [CrossRef]
  36. Ashford, B.; Tu, X. Non-thermal plasma technology for the conversion of CO2. Curr. Opin. Green Sustain. Chem. 2017, 3, 45–49. [Google Scholar] [CrossRef]
  37. Li, J.; Zhu, S.; Lu, K.; Ma, C.; Yang, D.; Yu, F. CO2 conversion in a coaxial dielectric barrier discharge plasma reactor in the presence of mixed ZrO2-CeO2. J. Environ. Chem. Eng. 2020, 9, 104654. [Google Scholar] [CrossRef]
  38. Paulussen, S.; Verheyde, B.; Tu, X.; De Bie, C.; Martens, T.; Petrovic, D.; Bogaerts, A.; Sels, B. Conversion of carbon dioxide to value-added chemicals in atmospheric pressure dielectric barrier discharges. Plasma Sources Sci. Technol. 2010, 19, 034015. [Google Scholar] [CrossRef]
  39. Ray, D.; Saha, R.; Ch, S. DBD Plasma Assisted CO2 Decomposition: Influence of Diluent Gases. Catalysts 2017, 7, 244. [Google Scholar] [CrossRef]
  40. Pou, J.; Colominas, C.; Gonzalez-Olmos, R. CO2 reduction using non-thermal plasma generated with photovoltaic energy in a fluidized reactor. J. CO2 Util. 2018, 27, 528–535. [Google Scholar] [CrossRef]
  41. Matsumoto, H.; Tanabe, S.; Okitsu, K.; Hayashi, Y.; Suib, S.L. Profiles of Carbon Dioxide Decomposition in a Dielectric-Barrier Discharge-Plasma System. Bull. Chem. Soc. Jpn. 1999, 72, 2567–2571. [Google Scholar] [CrossRef]
  42. American Petroleum Institute Research. Selected Values of Physical and Thermodynamic Properties of Hydrocarbons and Related Compounds; Carnegie Press: Pittsburg, PA, USA, 1952. [Google Scholar]
  43. Ray, D.; Chawdhury, P.; Bhargavi, K.; Thatikonda, S.; Lingaiah, N.; Subrahmanyam, C. Ni and Cu oxide supported γ-Al2O3 packed DBD plasma reactor for CO2 activation. J. CO2 Util. 2020, 44, 101400. [Google Scholar] [CrossRef]
  44. Wang, T.; Liu, H.; Xiong, X.; Feng, X. Conversion of carbon dioxide to carbon monoxide by pulse dielectric barrier discharge plasma. IOP Conf. Ser. 2017, 52, 012100. [Google Scholar] [CrossRef]
  45. Mei, D.; Zhu, X.; Wu, C.; Ashford, B.; Williams, P.T.; Tu, X. Plasma-photocatalytic conversion of CO2 at low temperatures: Understanding the synergistic effect of plasma-catalysis. Appl. Catal. B Environ. 2016, 182, 525–532. [Google Scholar] [CrossRef]
  46. Mei, D.; Zhu, X.; He, Y.-L.; Yan, J.D.; Tu, X. Plasma-assisted conversion of CO2 in a dielectric barrier discharge reactor: Understanding the effect of packing materials. Plasma Sources Sci. Technol. 2014, 24, 015011. [Google Scholar] [CrossRef] [Green Version]
Figure 1. DBD system includes the photovoltaic power generation (solar panel (A), batteries (B), inverter (C), solar regulator (D)), electric signal amplifier (E), oscilloscope (F), volumetric flowmeters (G), copper rod inner electrode (H), wattmeter (I), copper mesh outer electrode (J) and PTFE reactor ends (K). The DBD reactor (L) is filled with catalyst pellets.
Processes 10 01851 g001
Figure 2. Picture of the NTP discharges across the DBD plasma reactor.
Processes 10 01851 g002
Figure 3. Effect of CO2 flowrate on the CO2 conversion. Conditions: 1 L/min of Ar, 50 W, 20 kHz and minimum duty cycle.
Processes 10 01851 g003
Figure 4. Effect of CO2 flowrate on the energy efficiency. Conditions: 1 L/min of Ar, 50 W, 20 kHz, and minimum duty cycle.
Processes 10 01851 g004
Figure 5. Rate of reaction as a function of SIE (linear fit).
Processes 10 01851 g005
Figure 6. Effect of Ar flowrate on the CO2 conversion. Conditions: 50 W, 20 kHz and minimum duty cycle. The experiments were performed at different CO2 flowrates.
Processes 10 01851 g006
Figure 7. Effect of CO2 flowrate and the type of electricity source on the carbon emissions compensated. Conditions: 1 L/min of Ar, 50 W, 20 kHz, and minimum duty cycle.
Processes 10 01851 g007
Table 1. Comparison of DBD plasma-assisted conversion of CO2.
Flowrate
(mL/min)
Diluent GasPower
(W)
Packed MaterialCO2 Conv. (%)CO
Select.
(%)
CO
Yield
(%)
η
(%)
Ref
30Ar2.4Glass beads19.58616.817.0[39]
150-55Molecular sieves 5A256315.8-[44]
60-28BaTiO338.3--17.0[45]
50-50BaTiO3289626.97.2[46]
30-2.45% ZnO + g-C3N412708.431.1[16]
30-2.215% CuO/Al2O315.7487.545.2[43]
30-2.215% CuO/CeAl13.5597.838.9[43]
9Ar50CuO/ZnO/Al2O340.2>9940.21.7This work
Publisher’s Note: MDPI stays neutral with regard to jurisdictional claims in published maps and institutional affiliations.

