
Carbon Capture from Post-Combustion Flue Gas Using a State-Of-The-Art, Anti-Sublimation, Solid–Vapor Separation Unit


Abstract
:
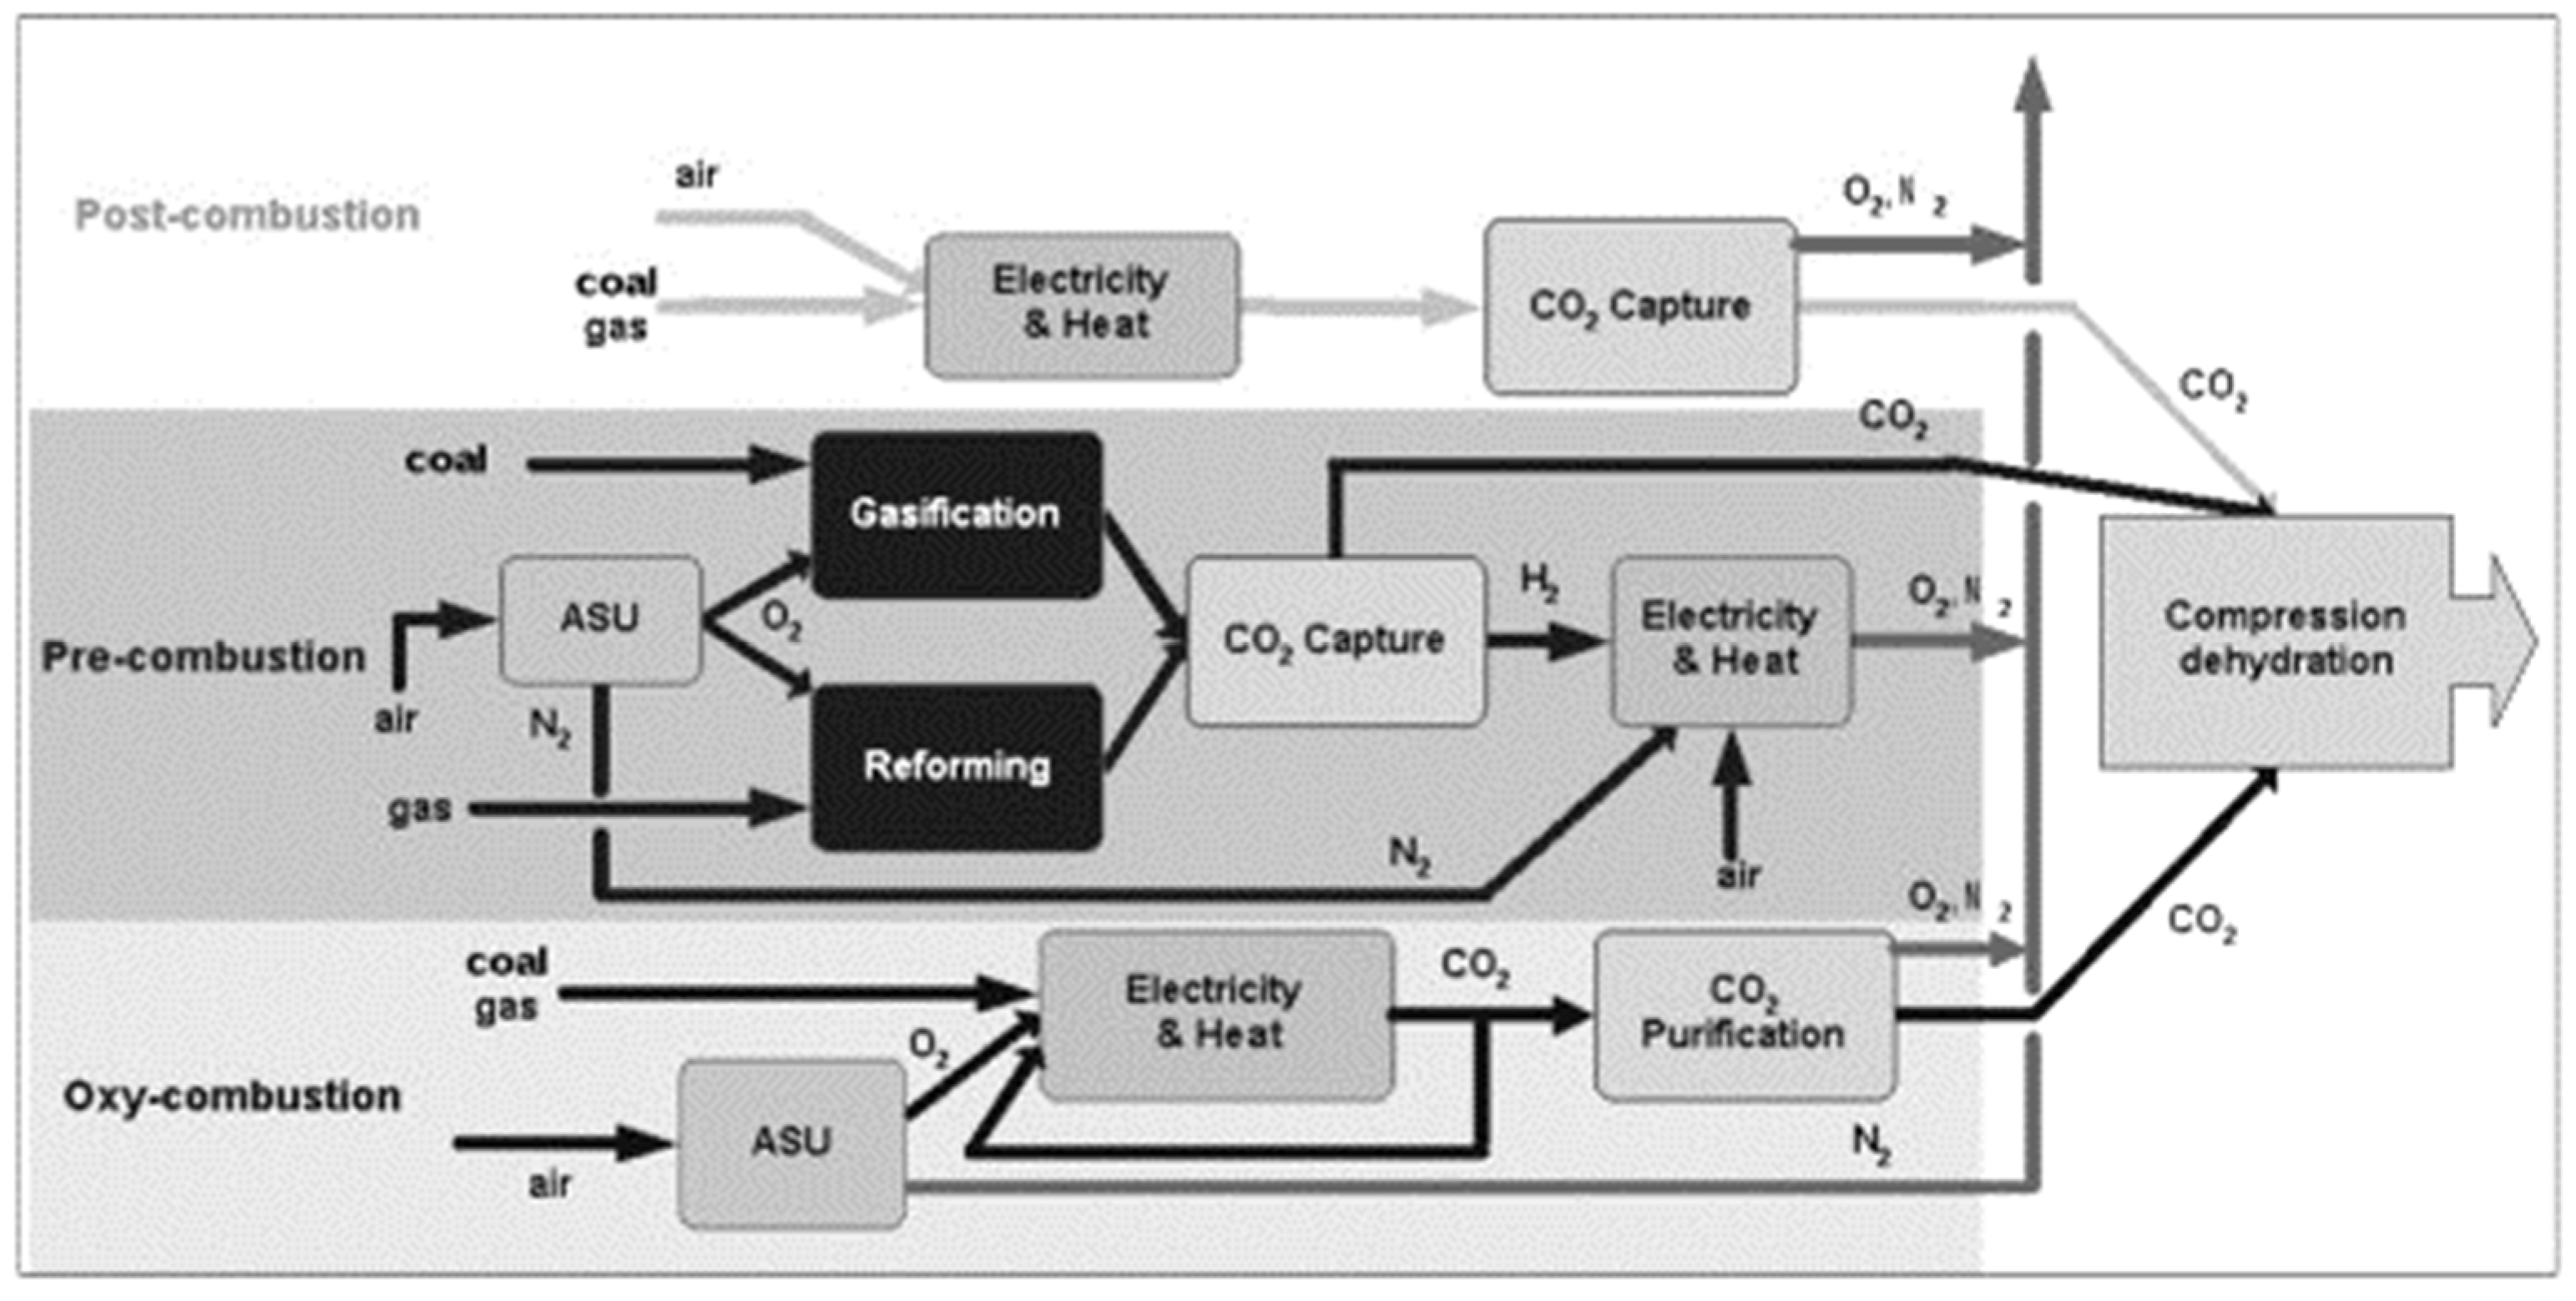
1. Introduction
2. Methodology
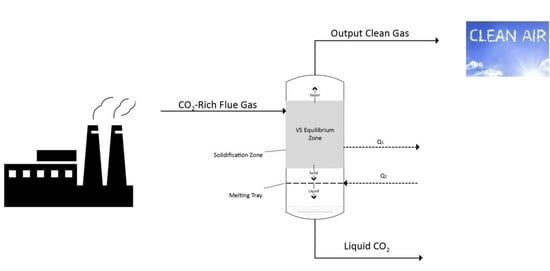
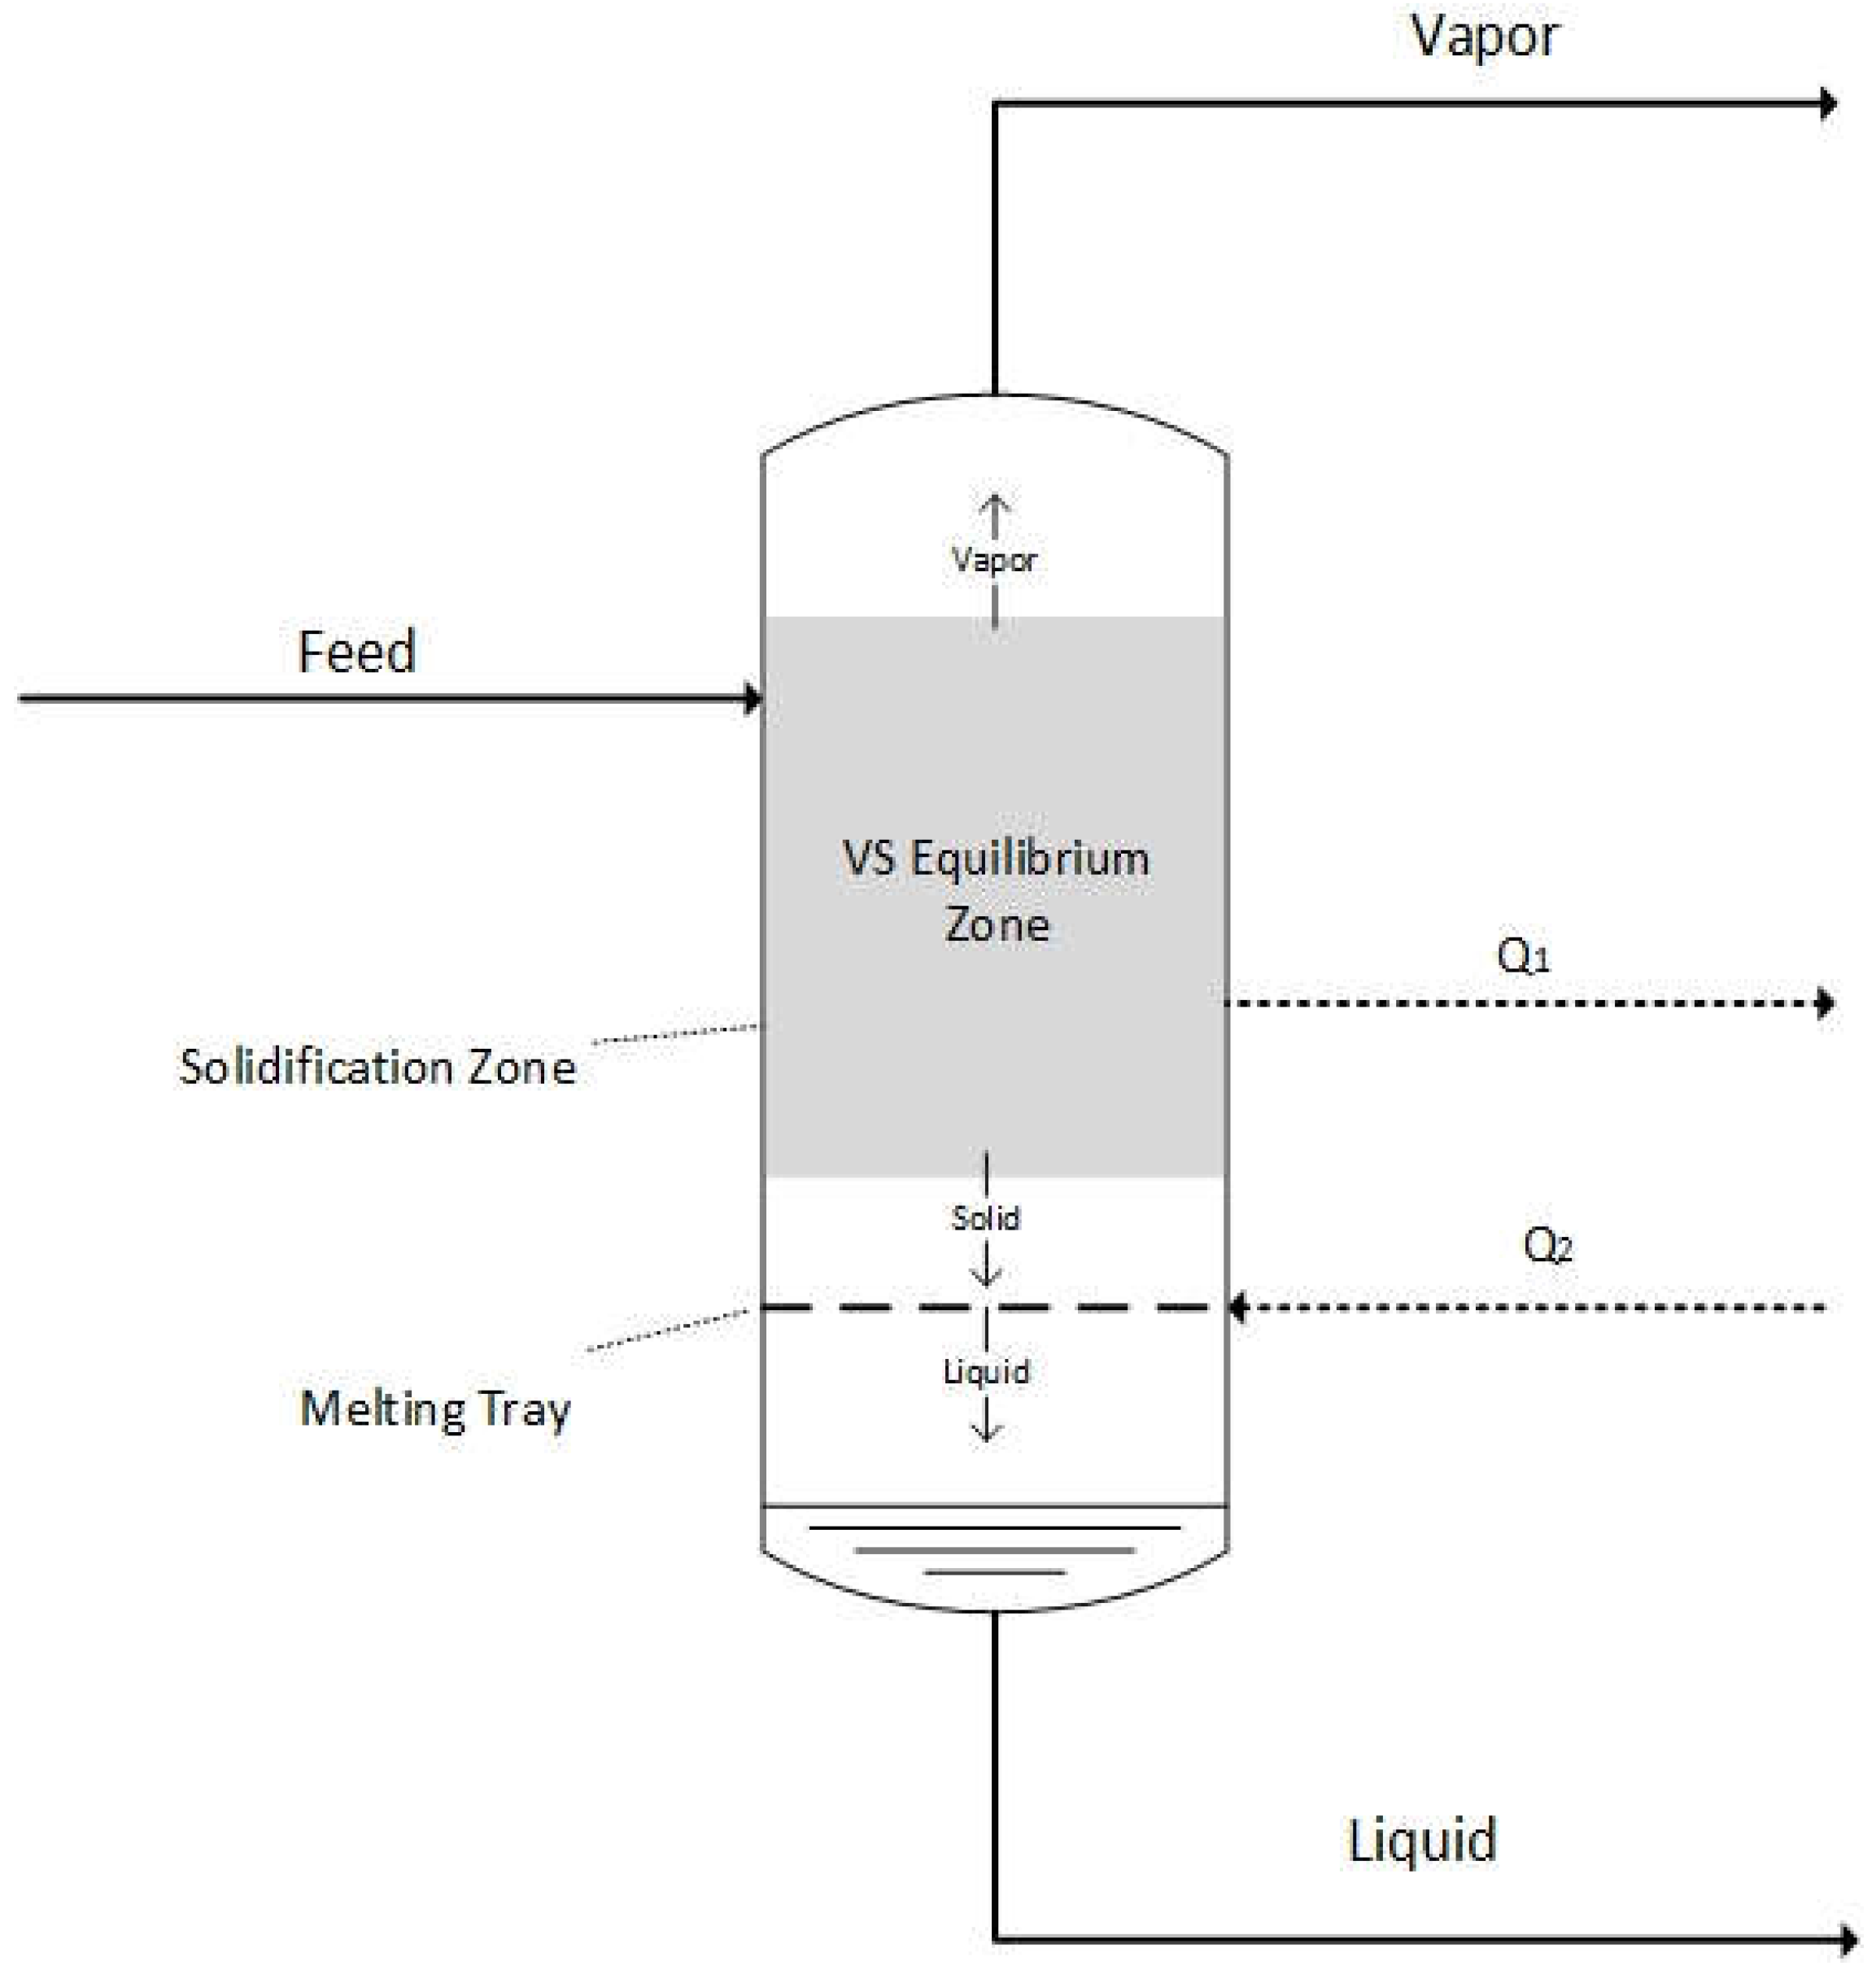
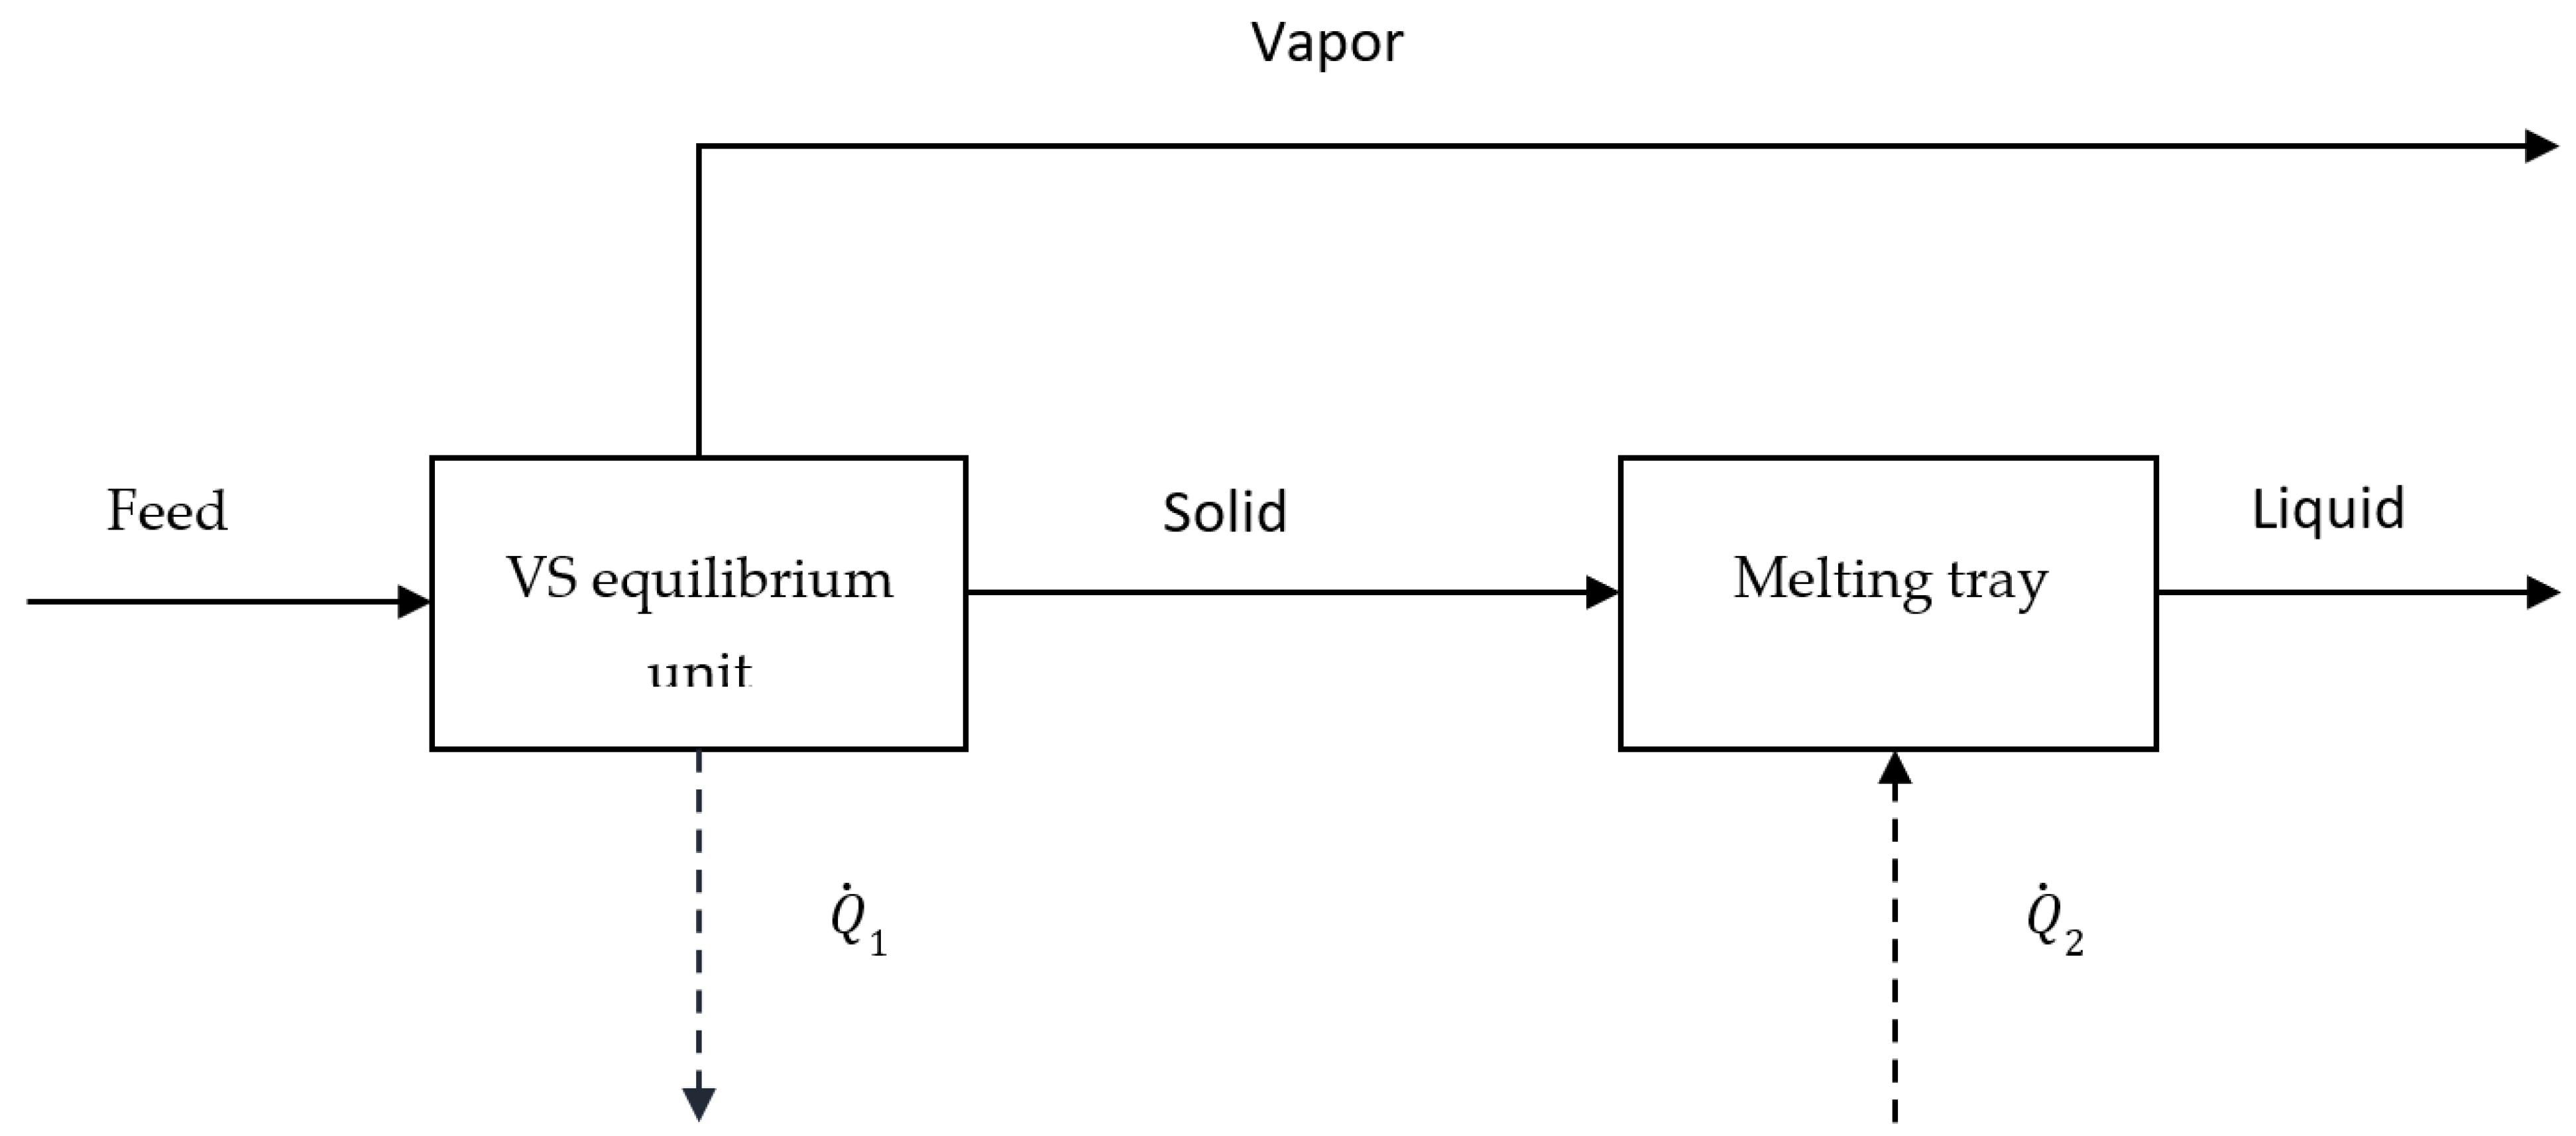
2.1. The Proposed Model
2.2. SLVE Modelling of the Binary System N2-CO2
2.3. SLVE Modelling of the Binary System O2-CO2
2.4. SLVE Modelling of the Binary System N2-O2
2.5. SLVE Modelling of the Ternary System N2-O2-CO2
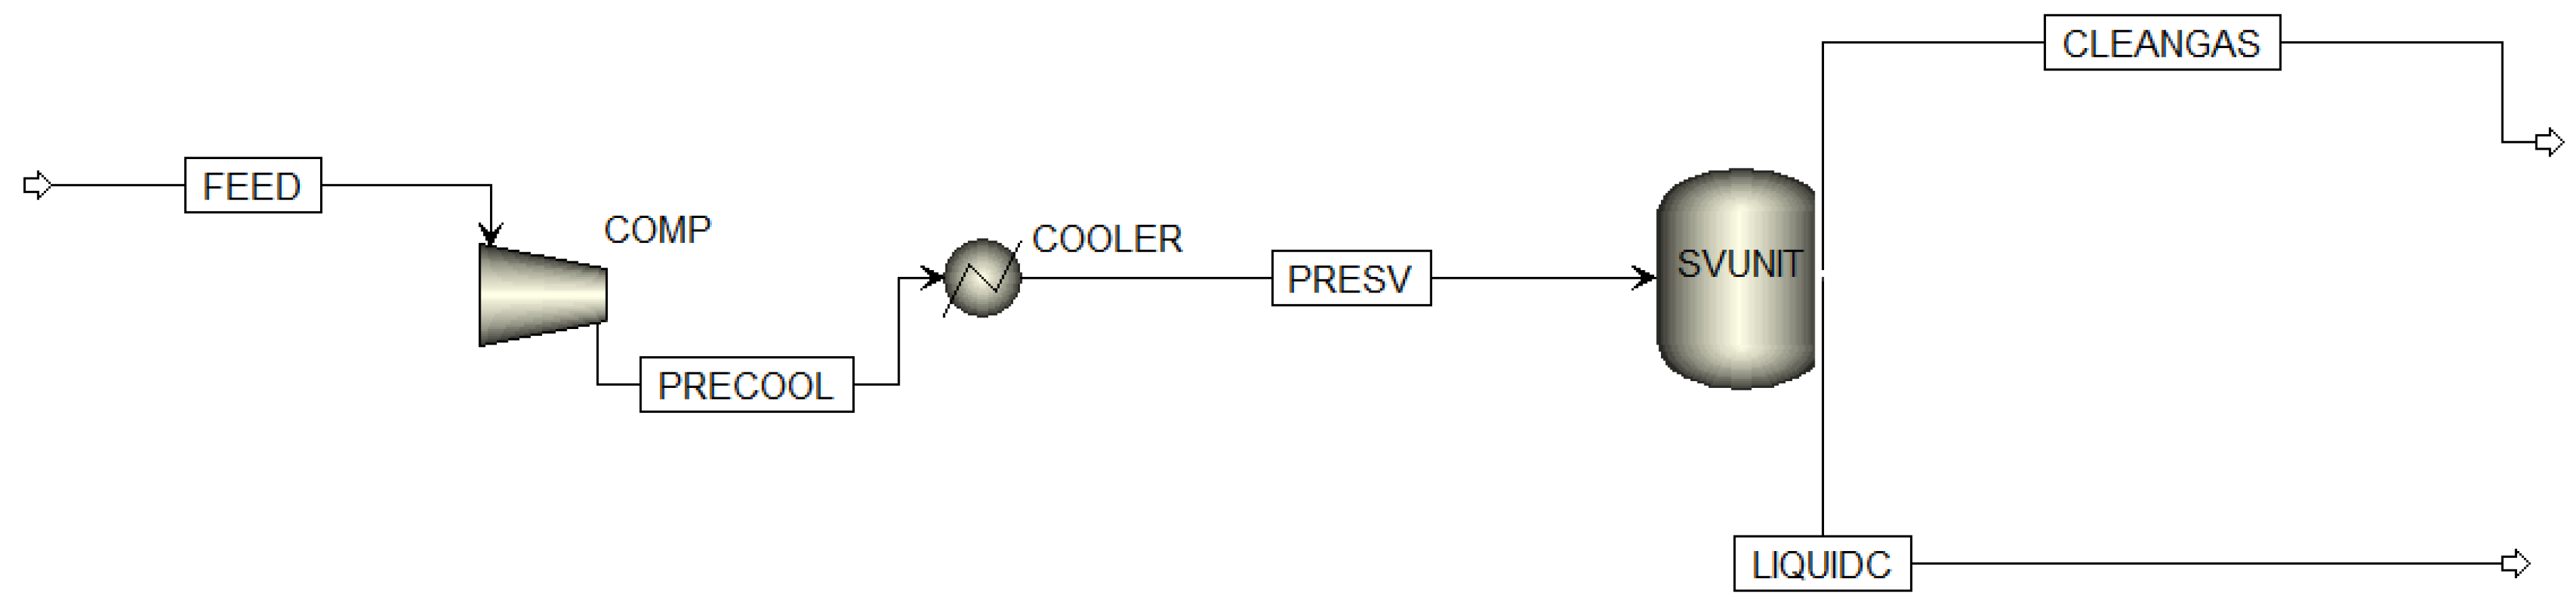
2.6. Modelling of the Solid-Vapour (SV) Separation Unit
3. Results and Discussion
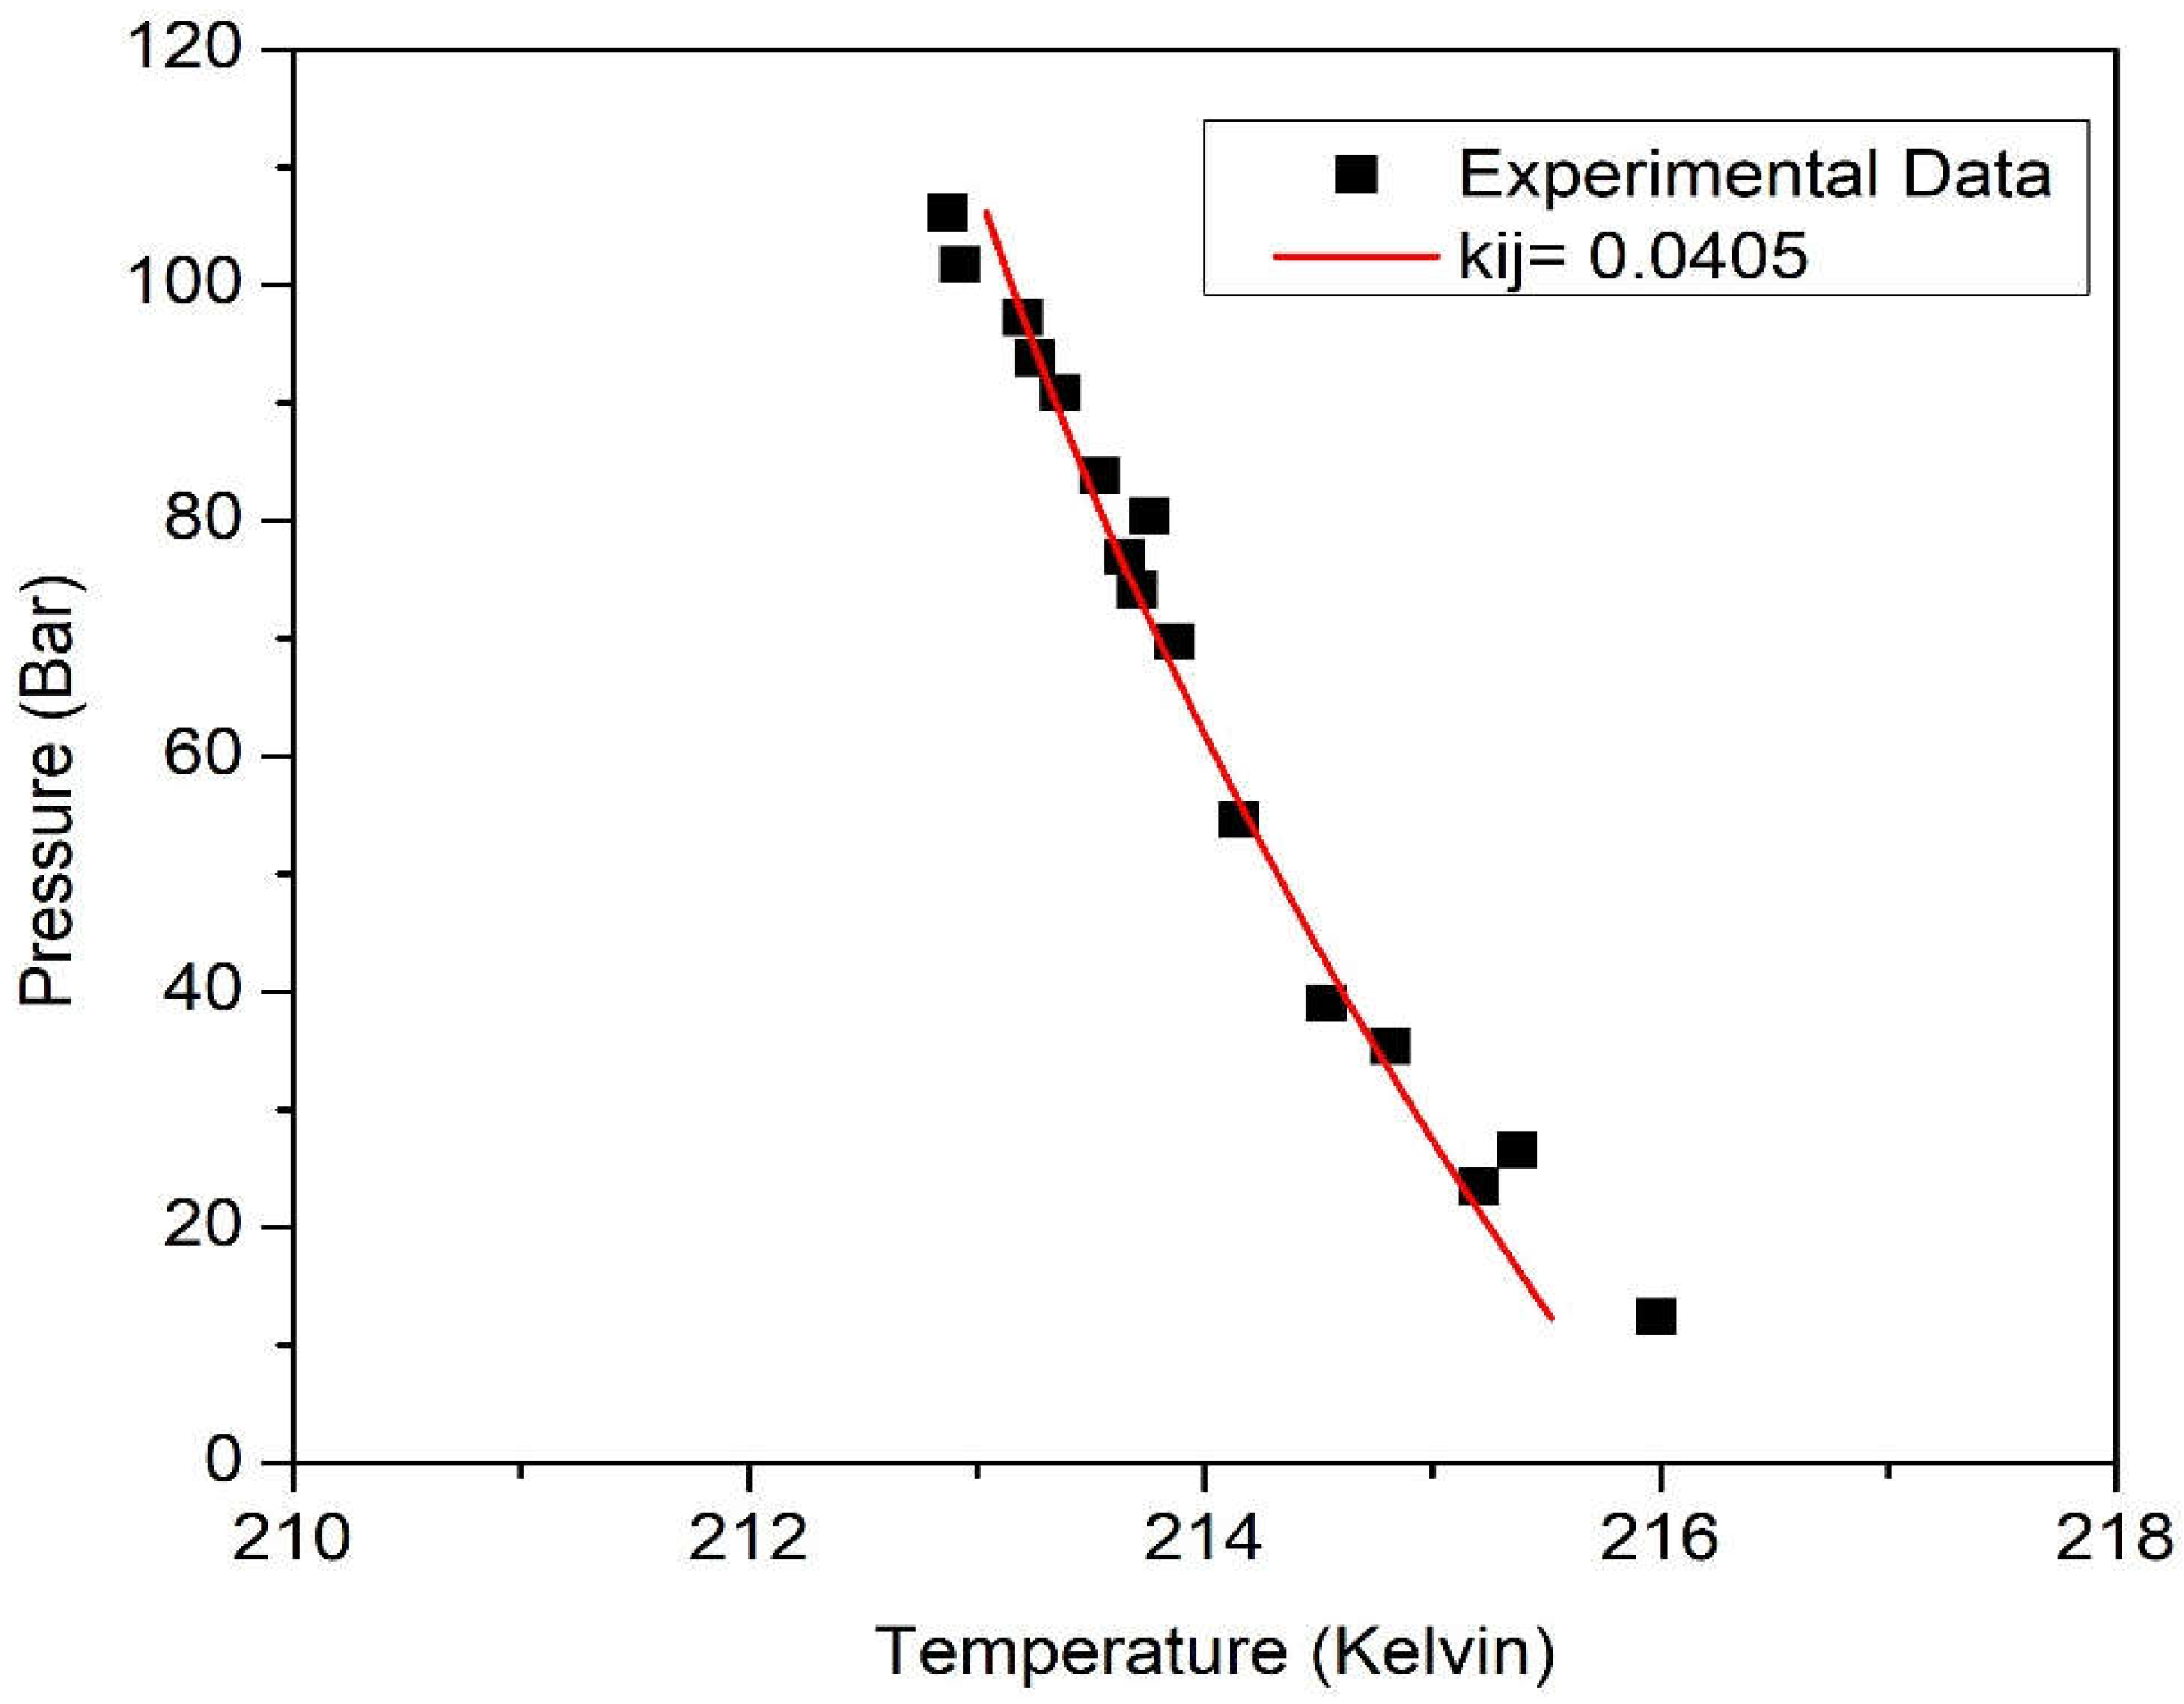
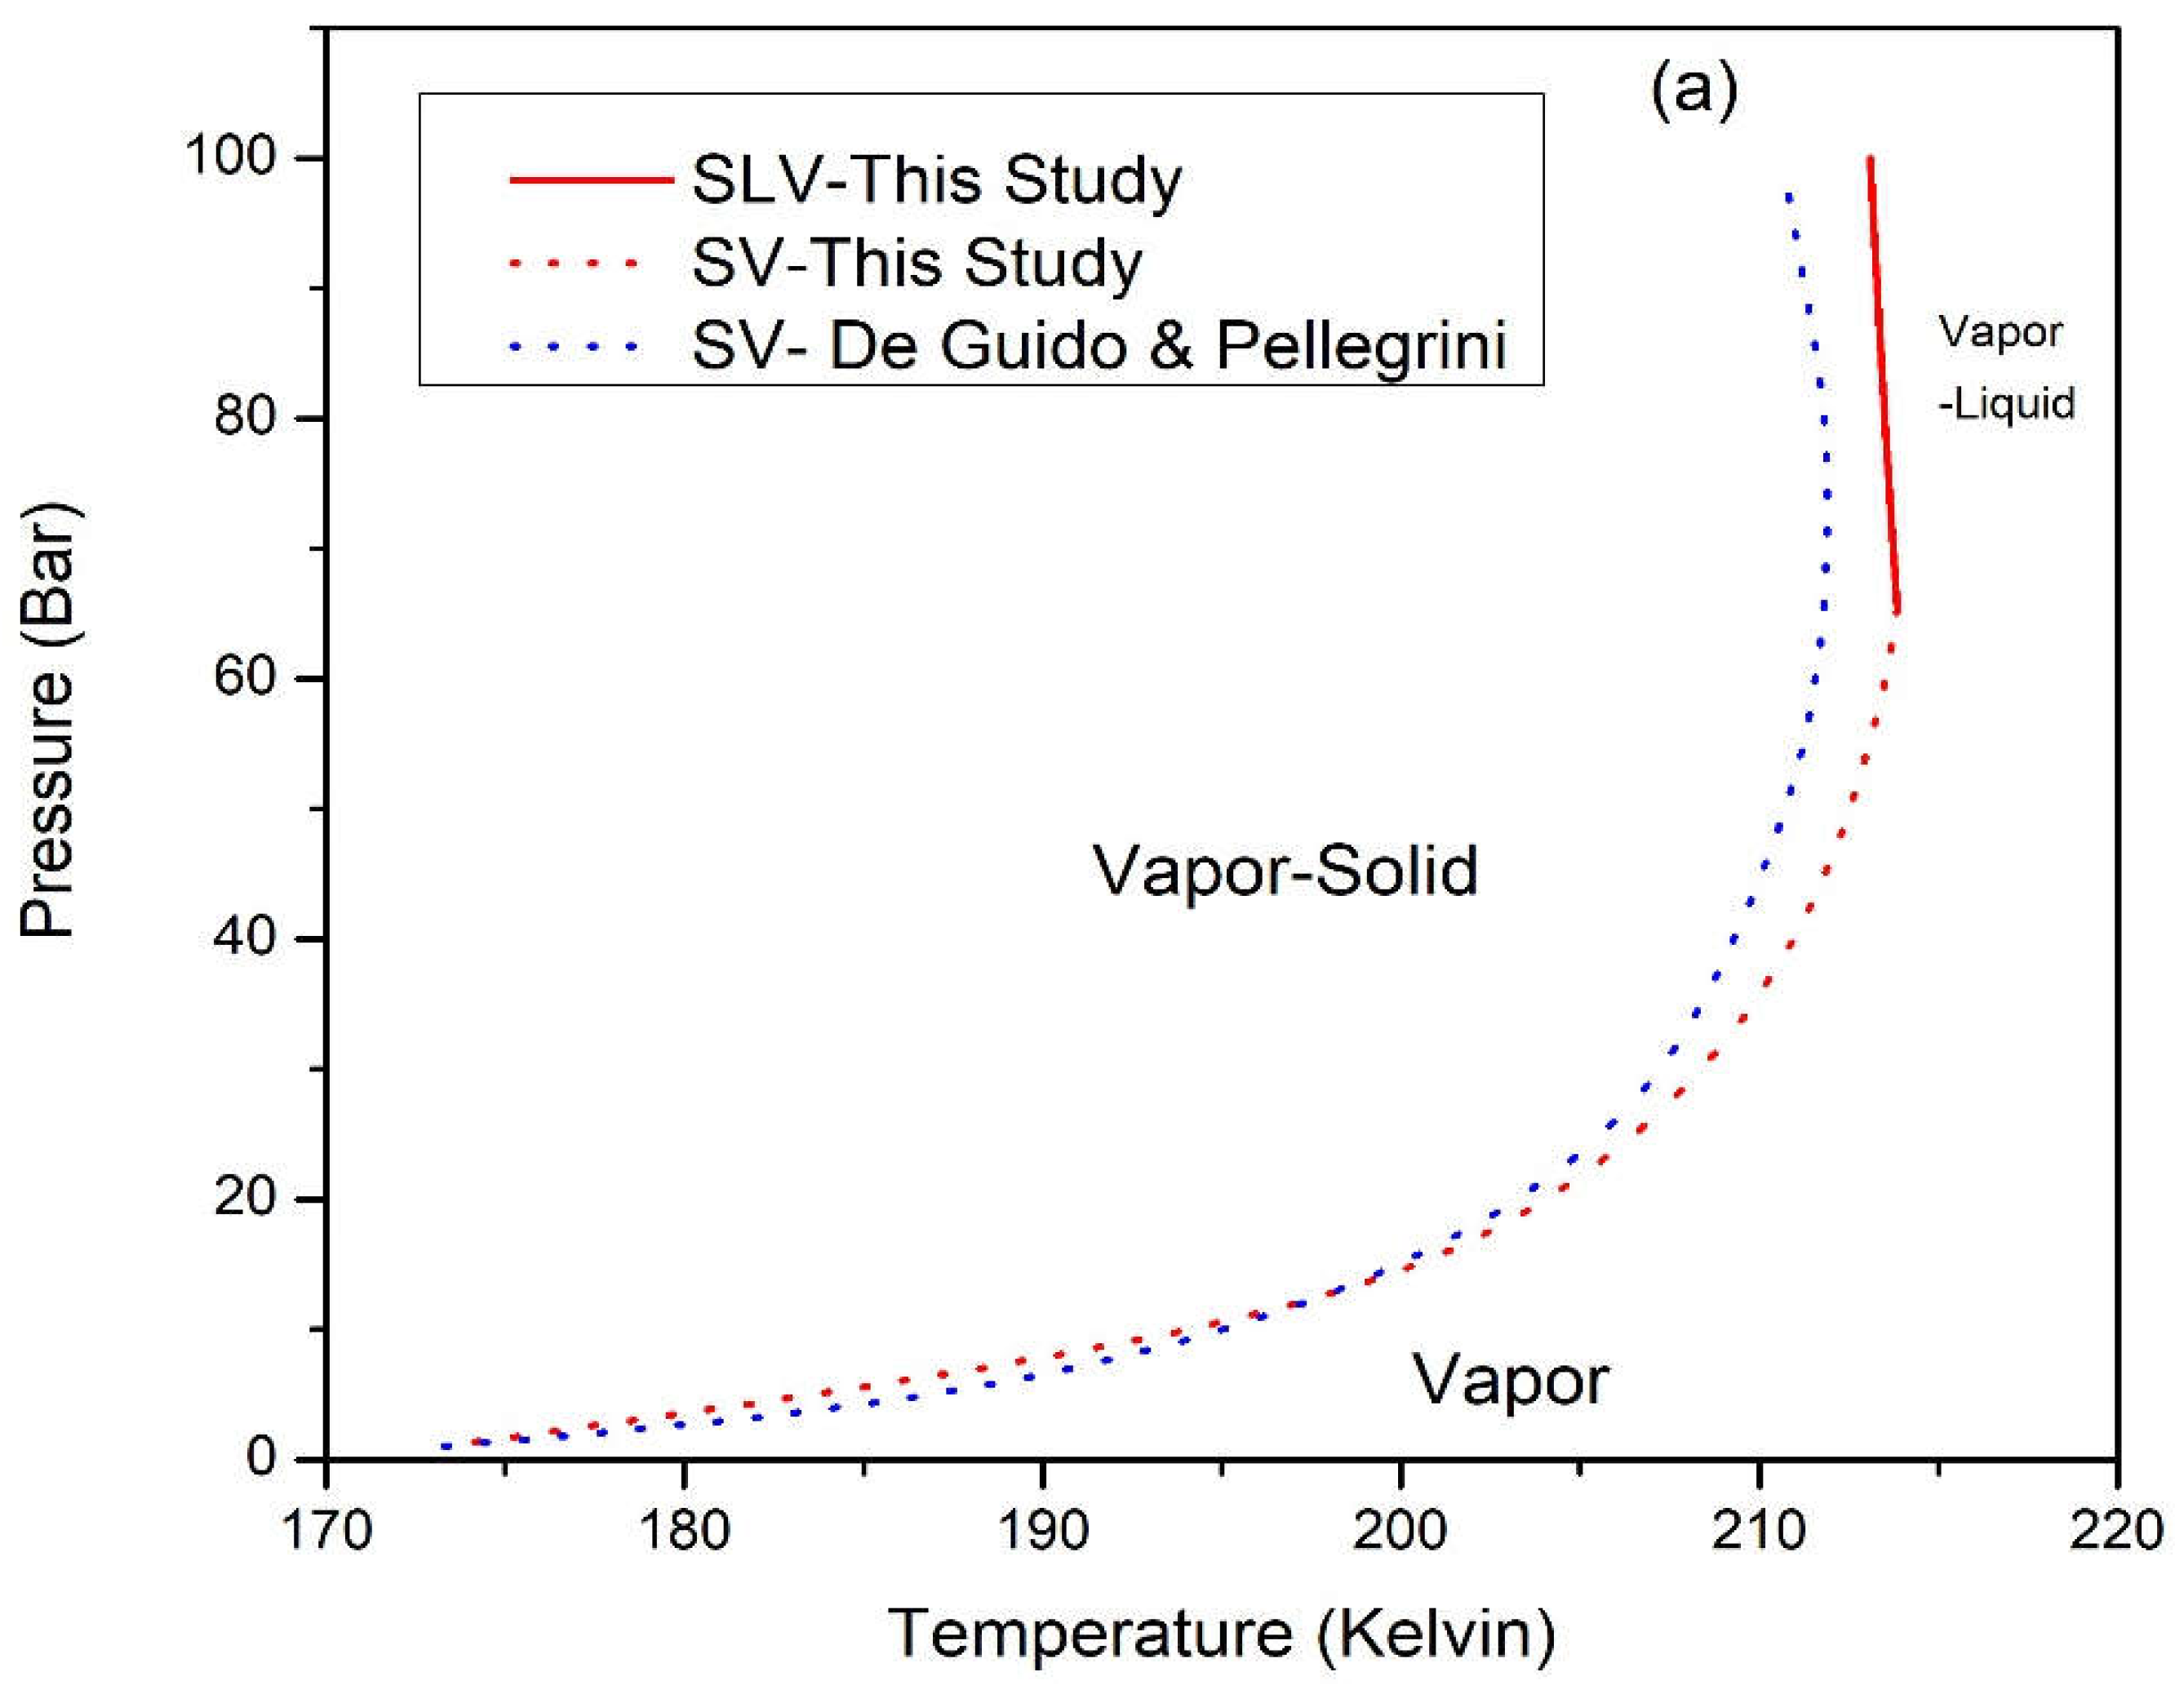
3.1. Correlation of the Binary System of N2-CO2
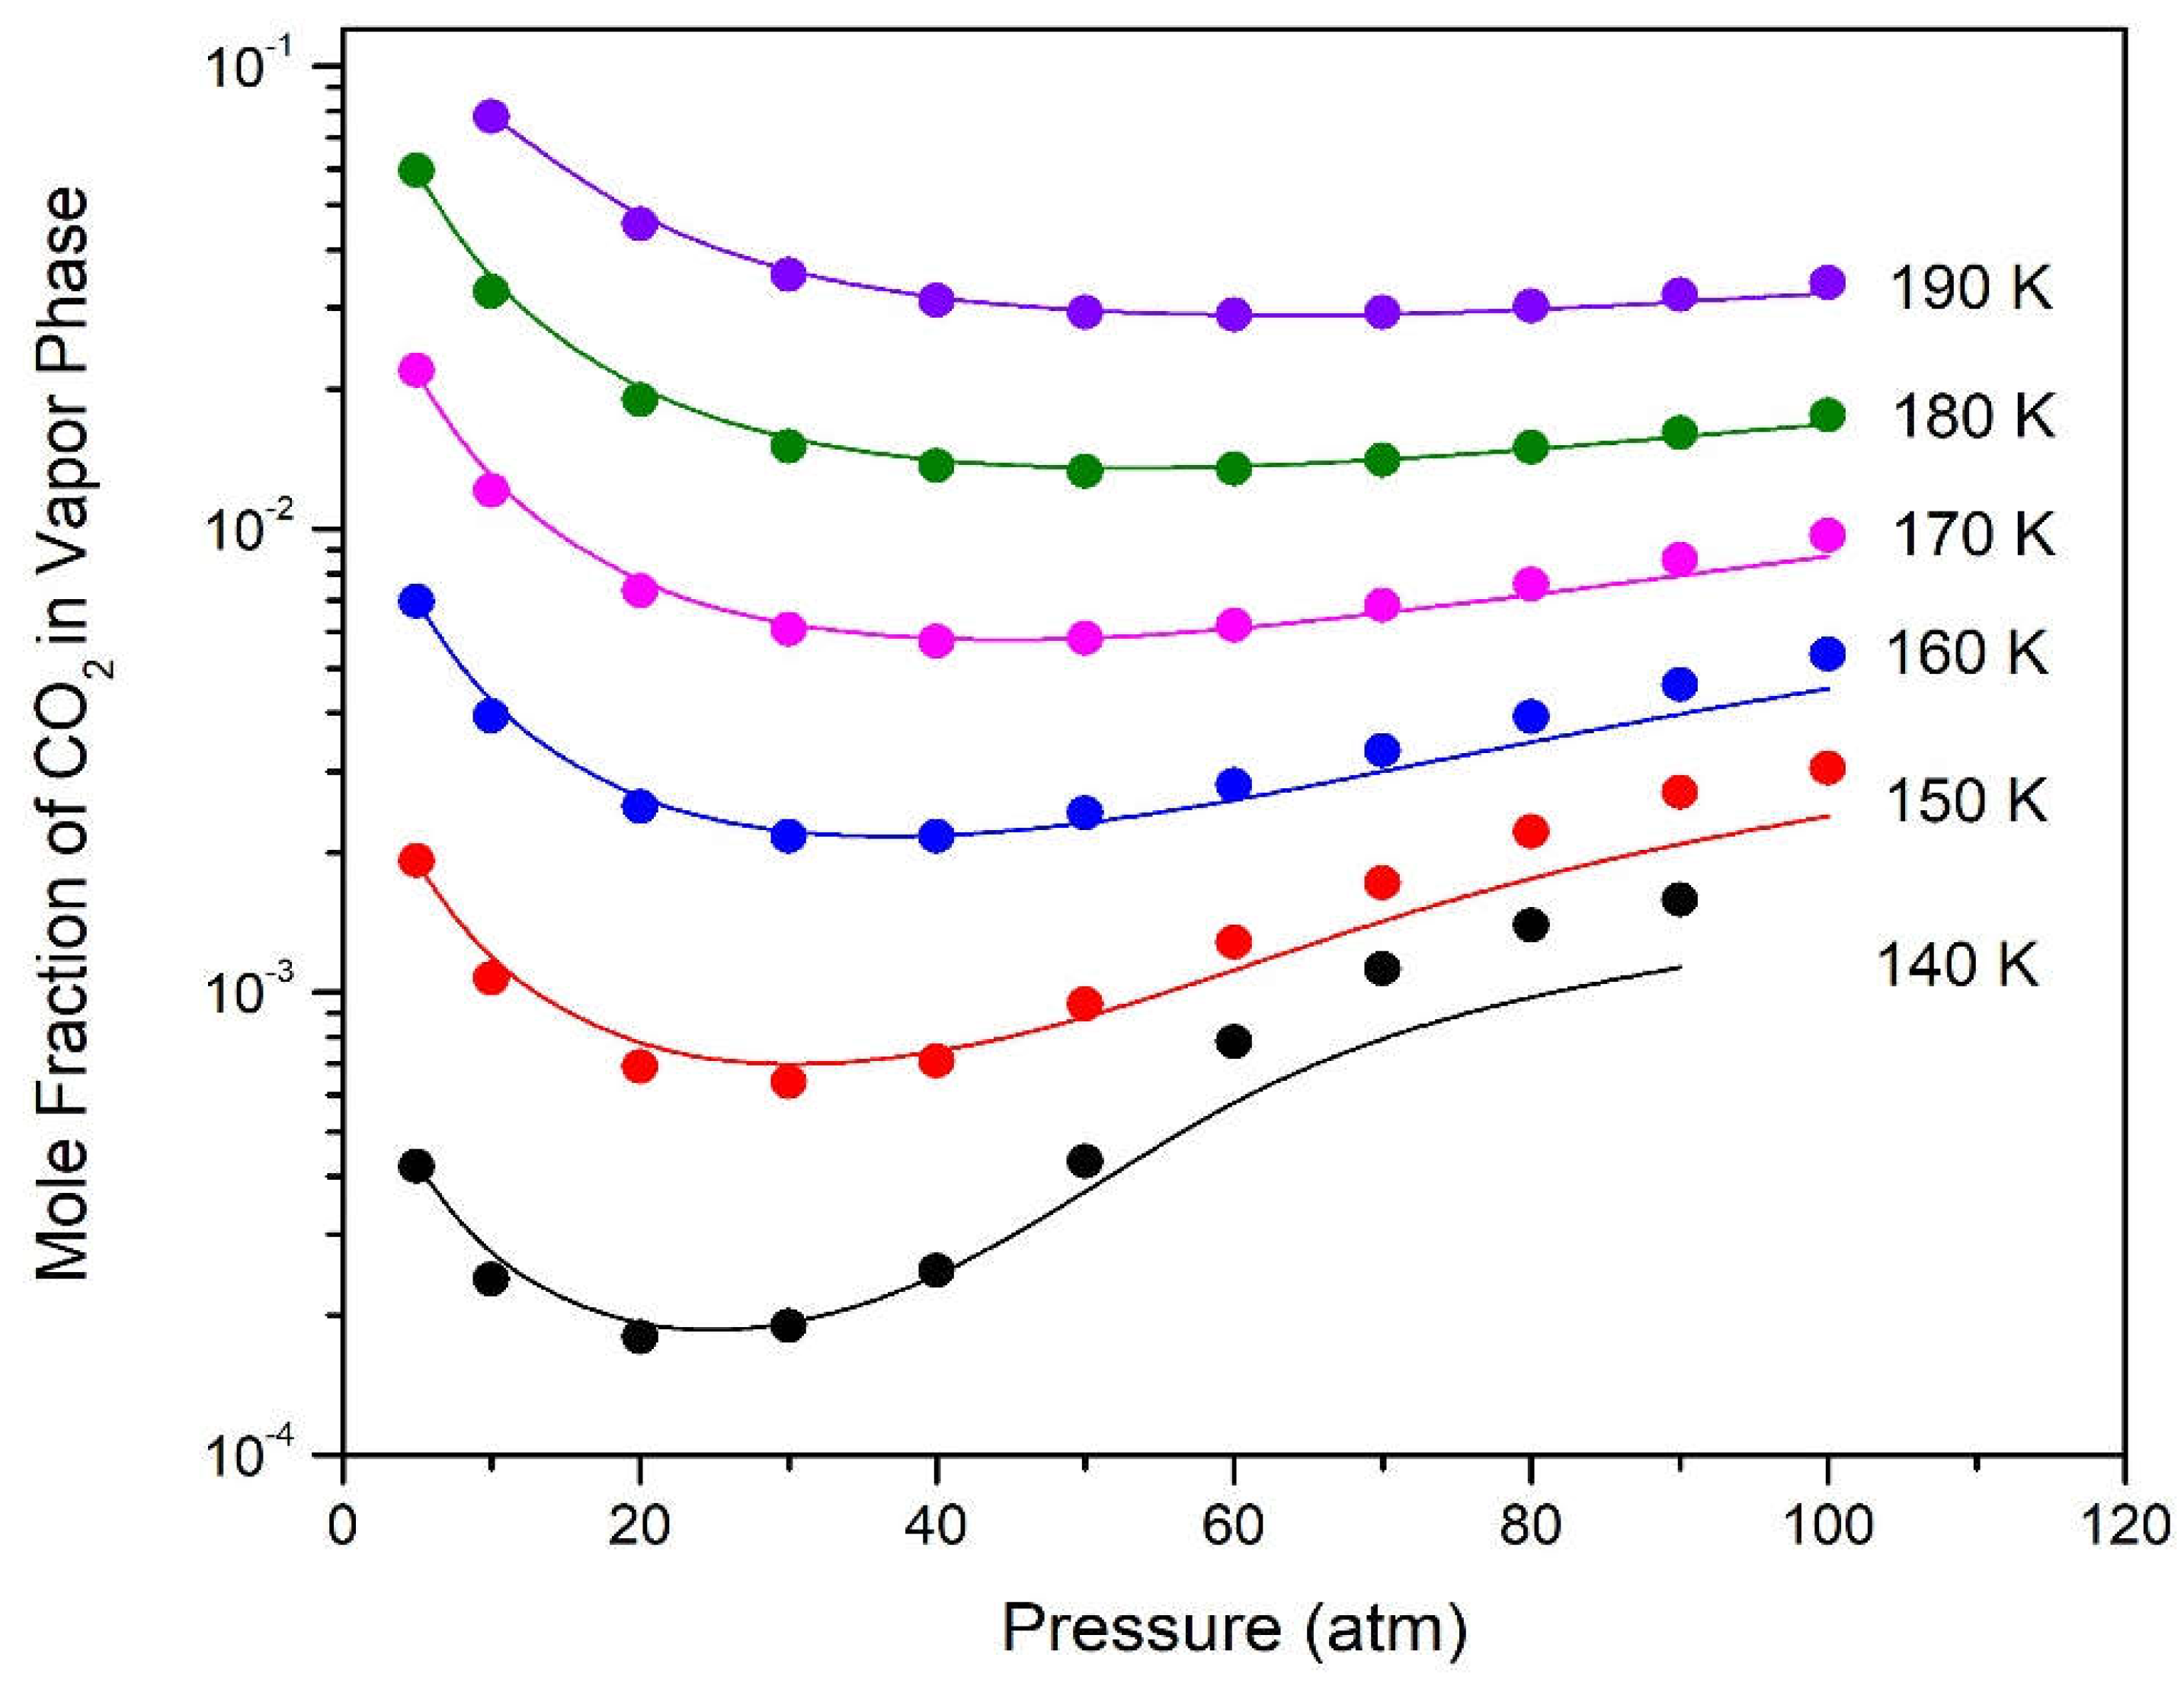
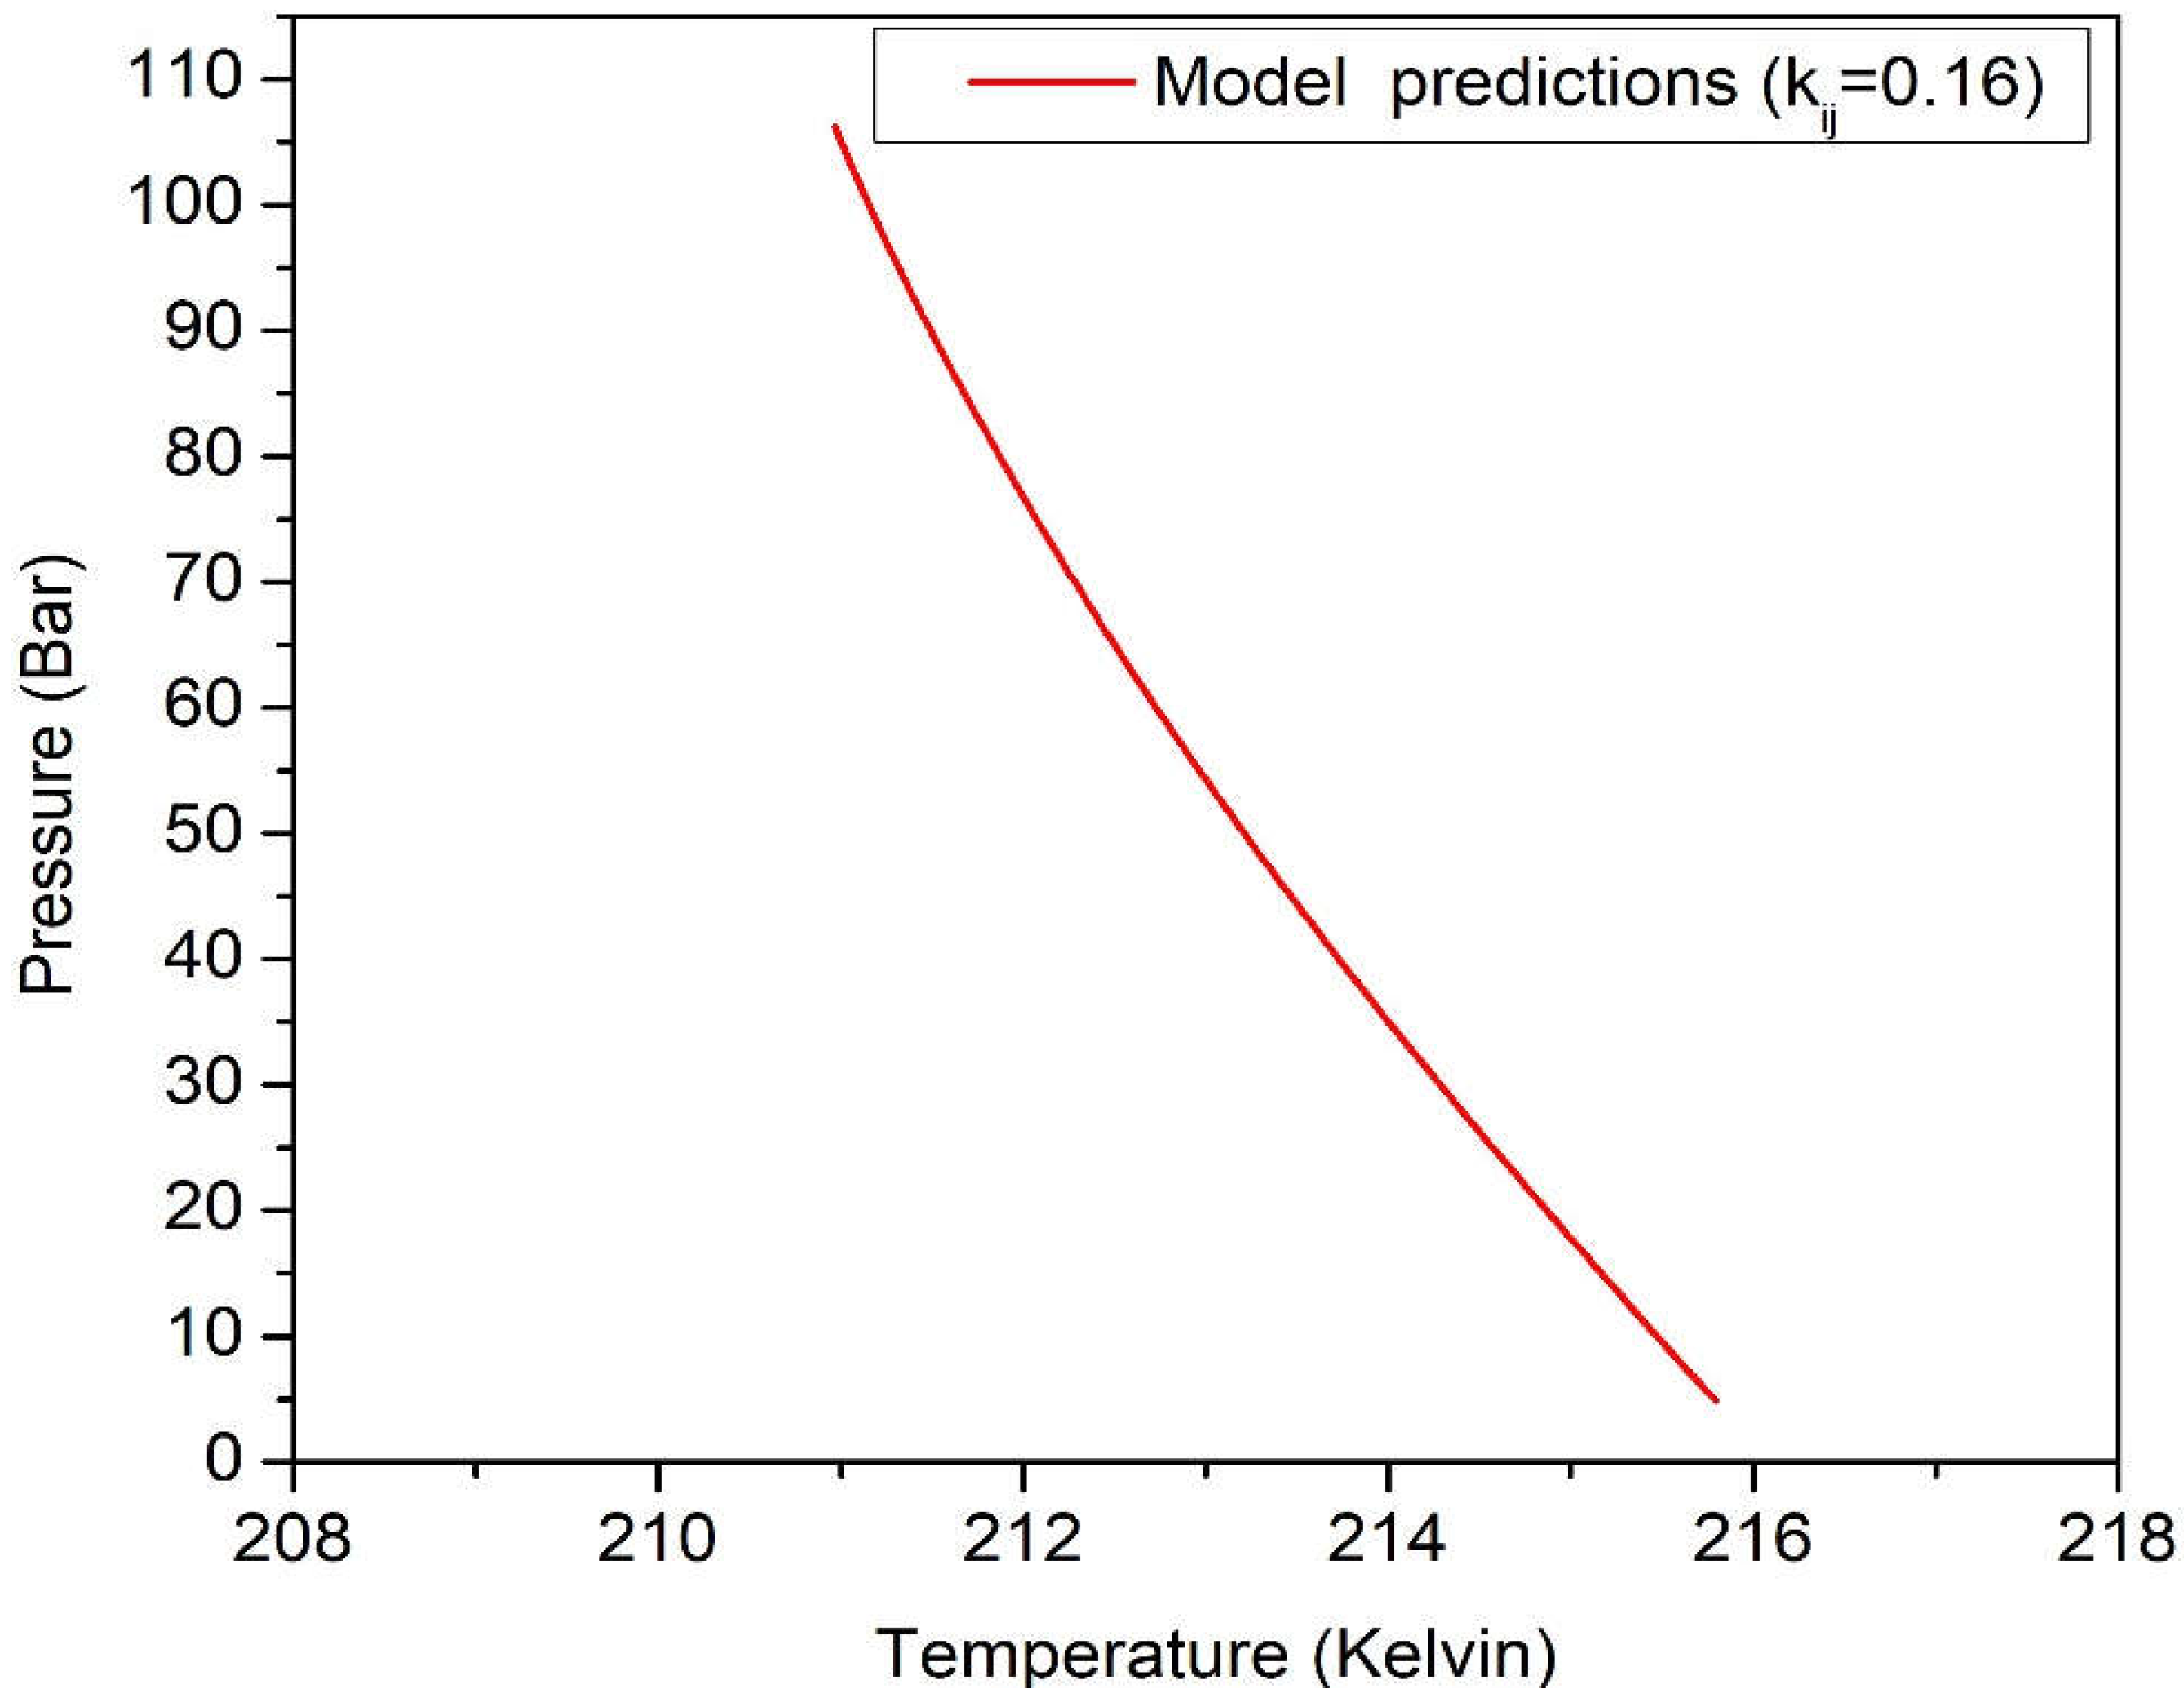
3.2. Correlation of the Binary System of O2-CO2
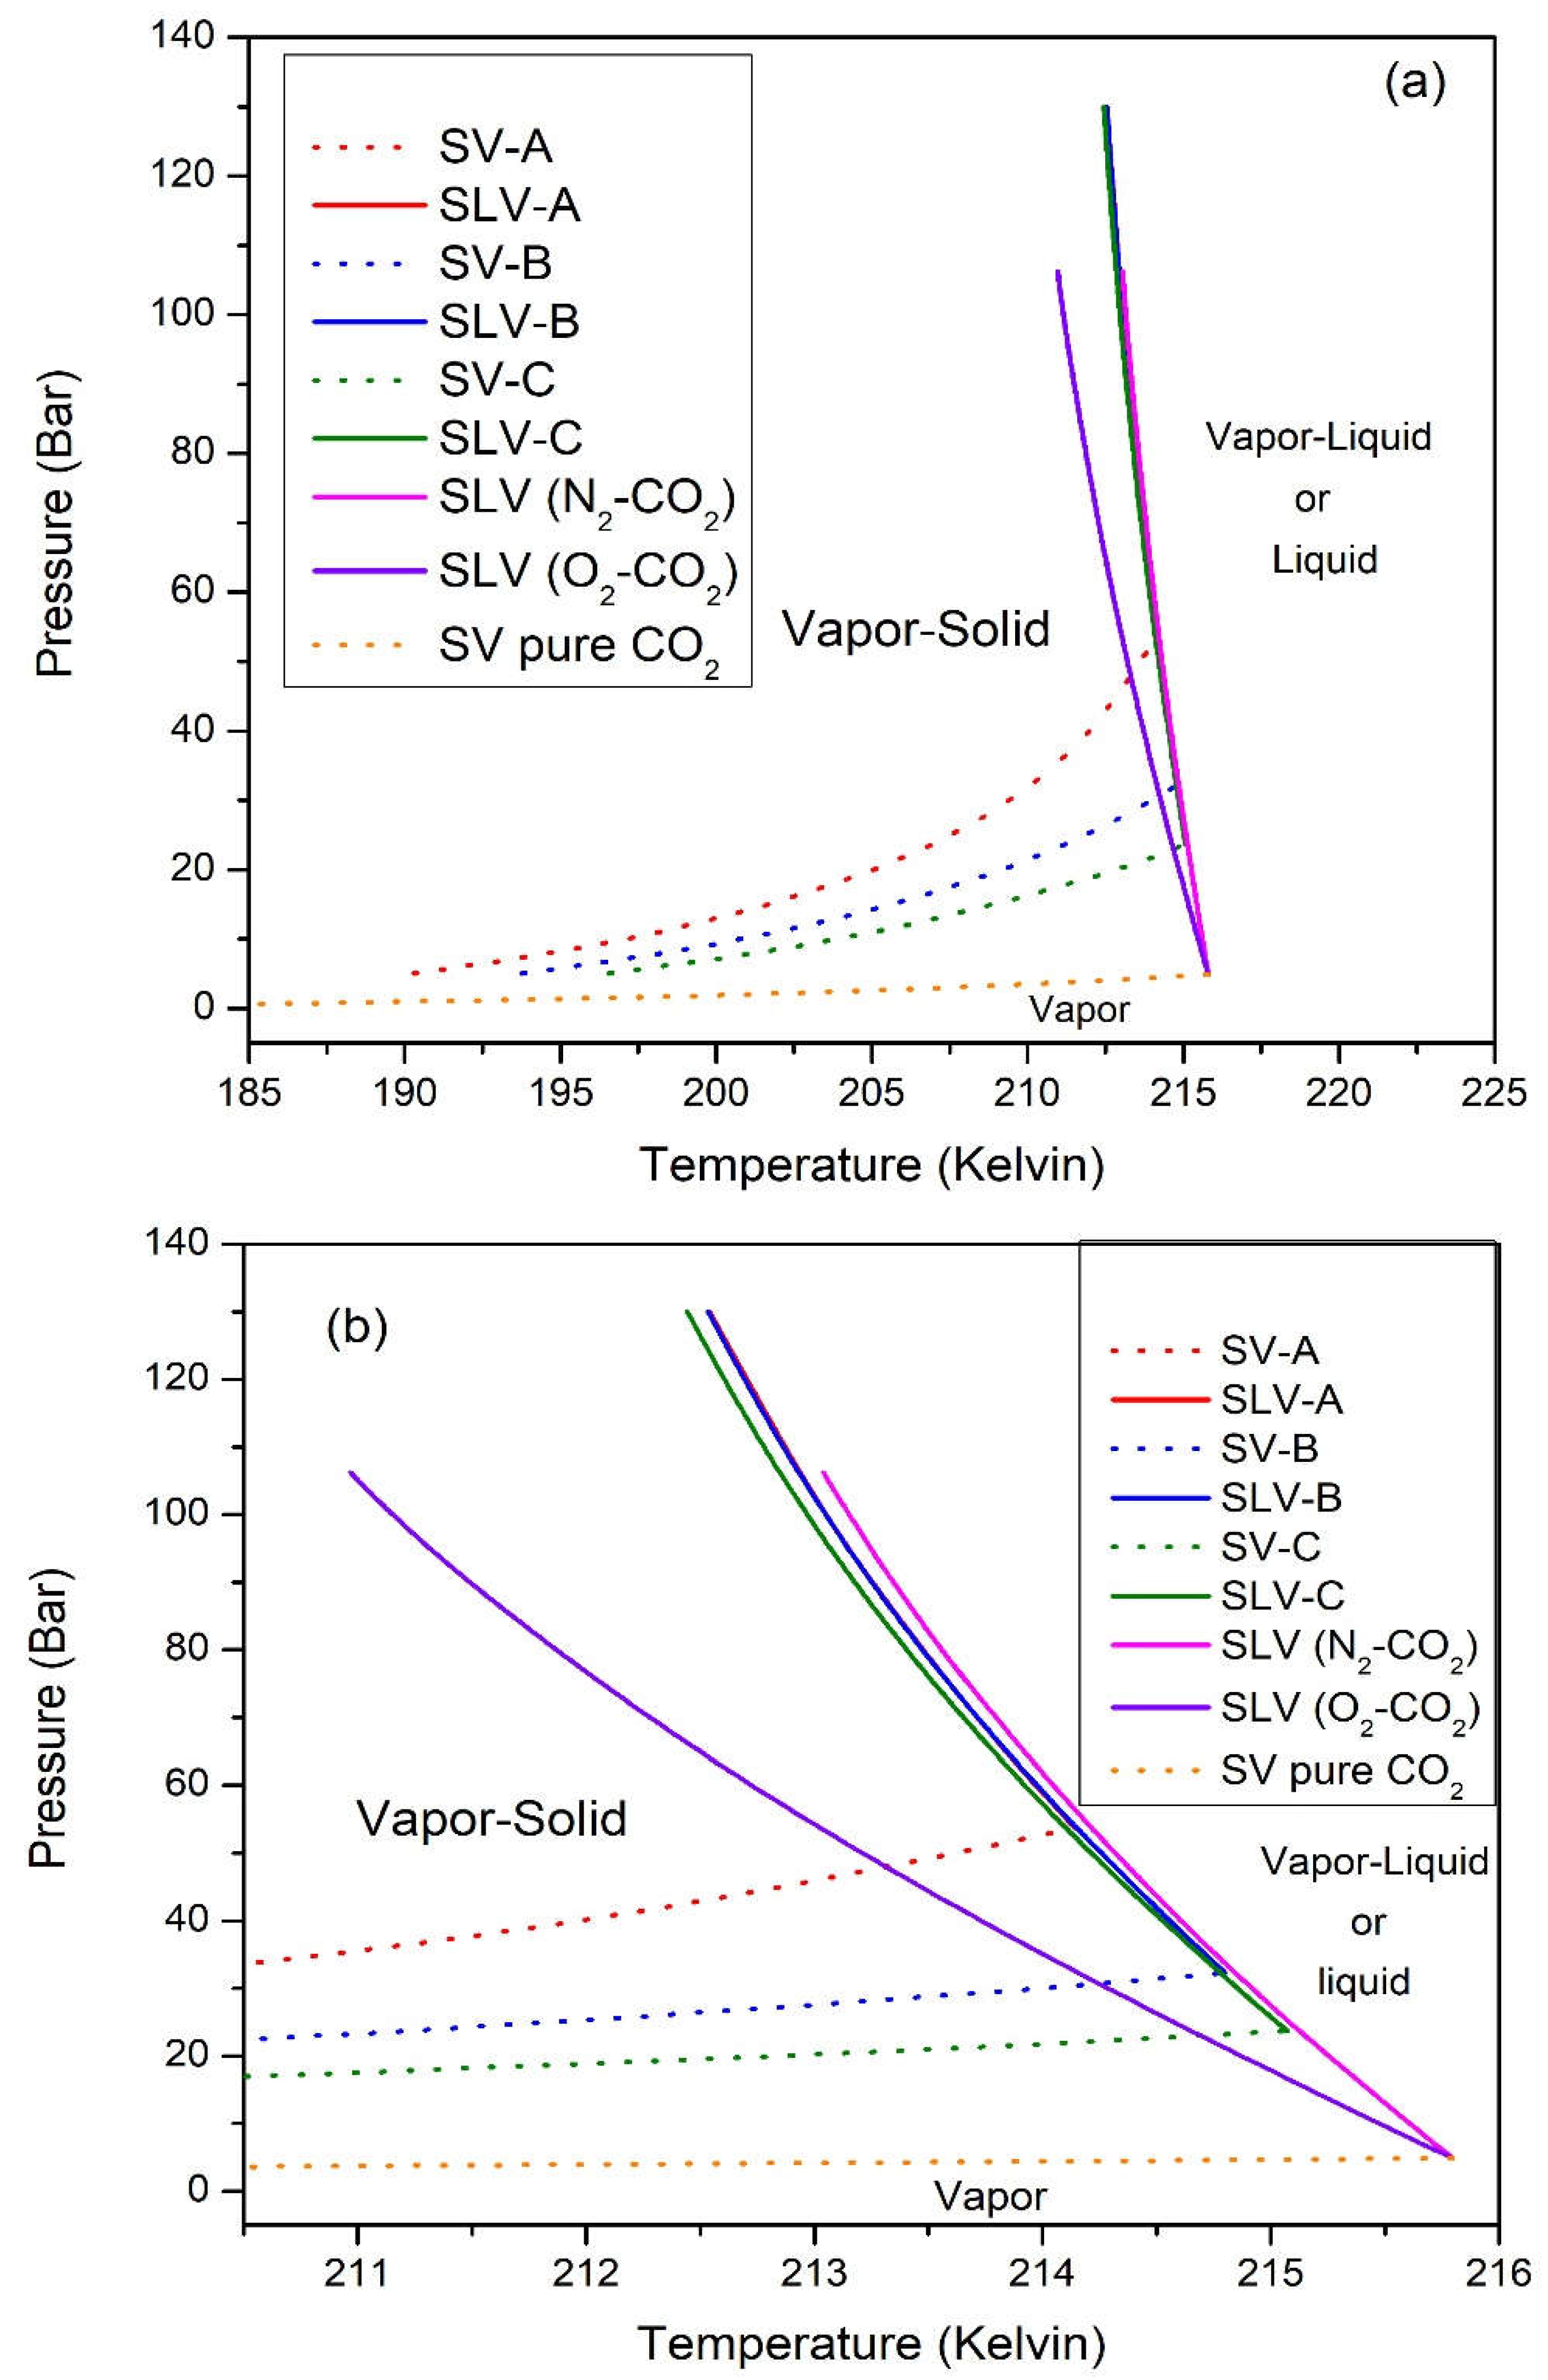
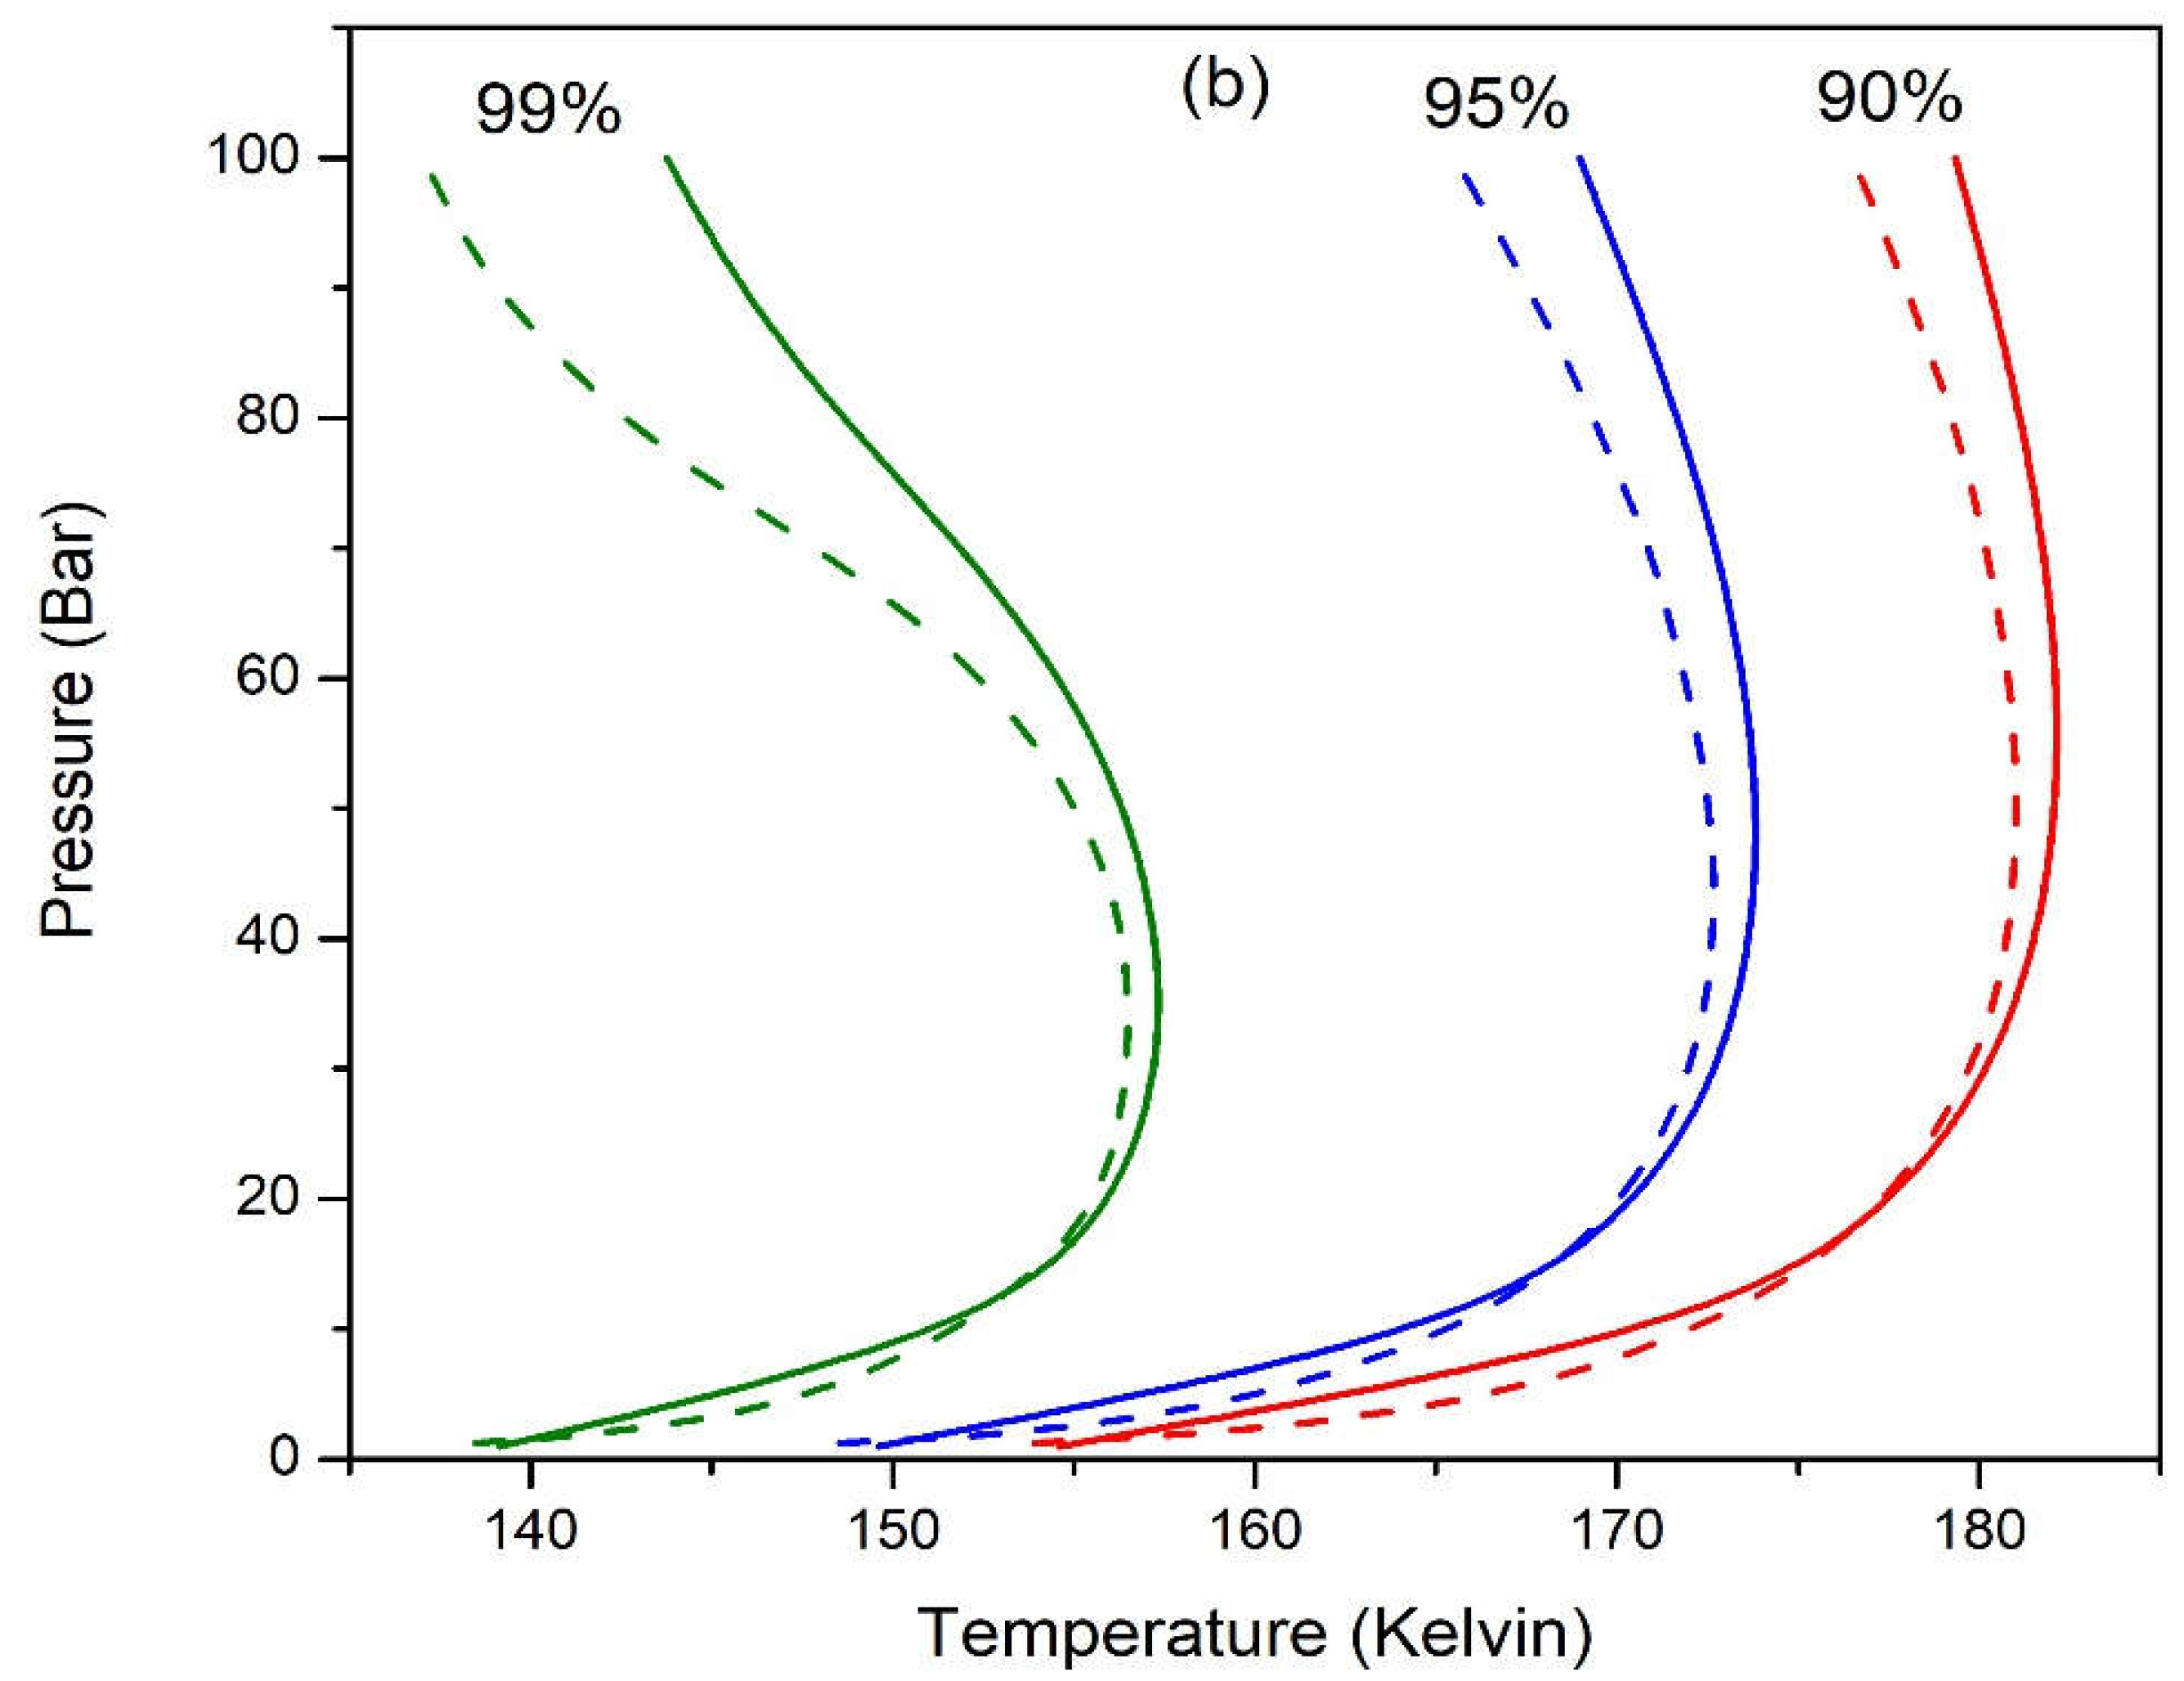
3.3. Predictions of the Ternary System N2-O2-CO2
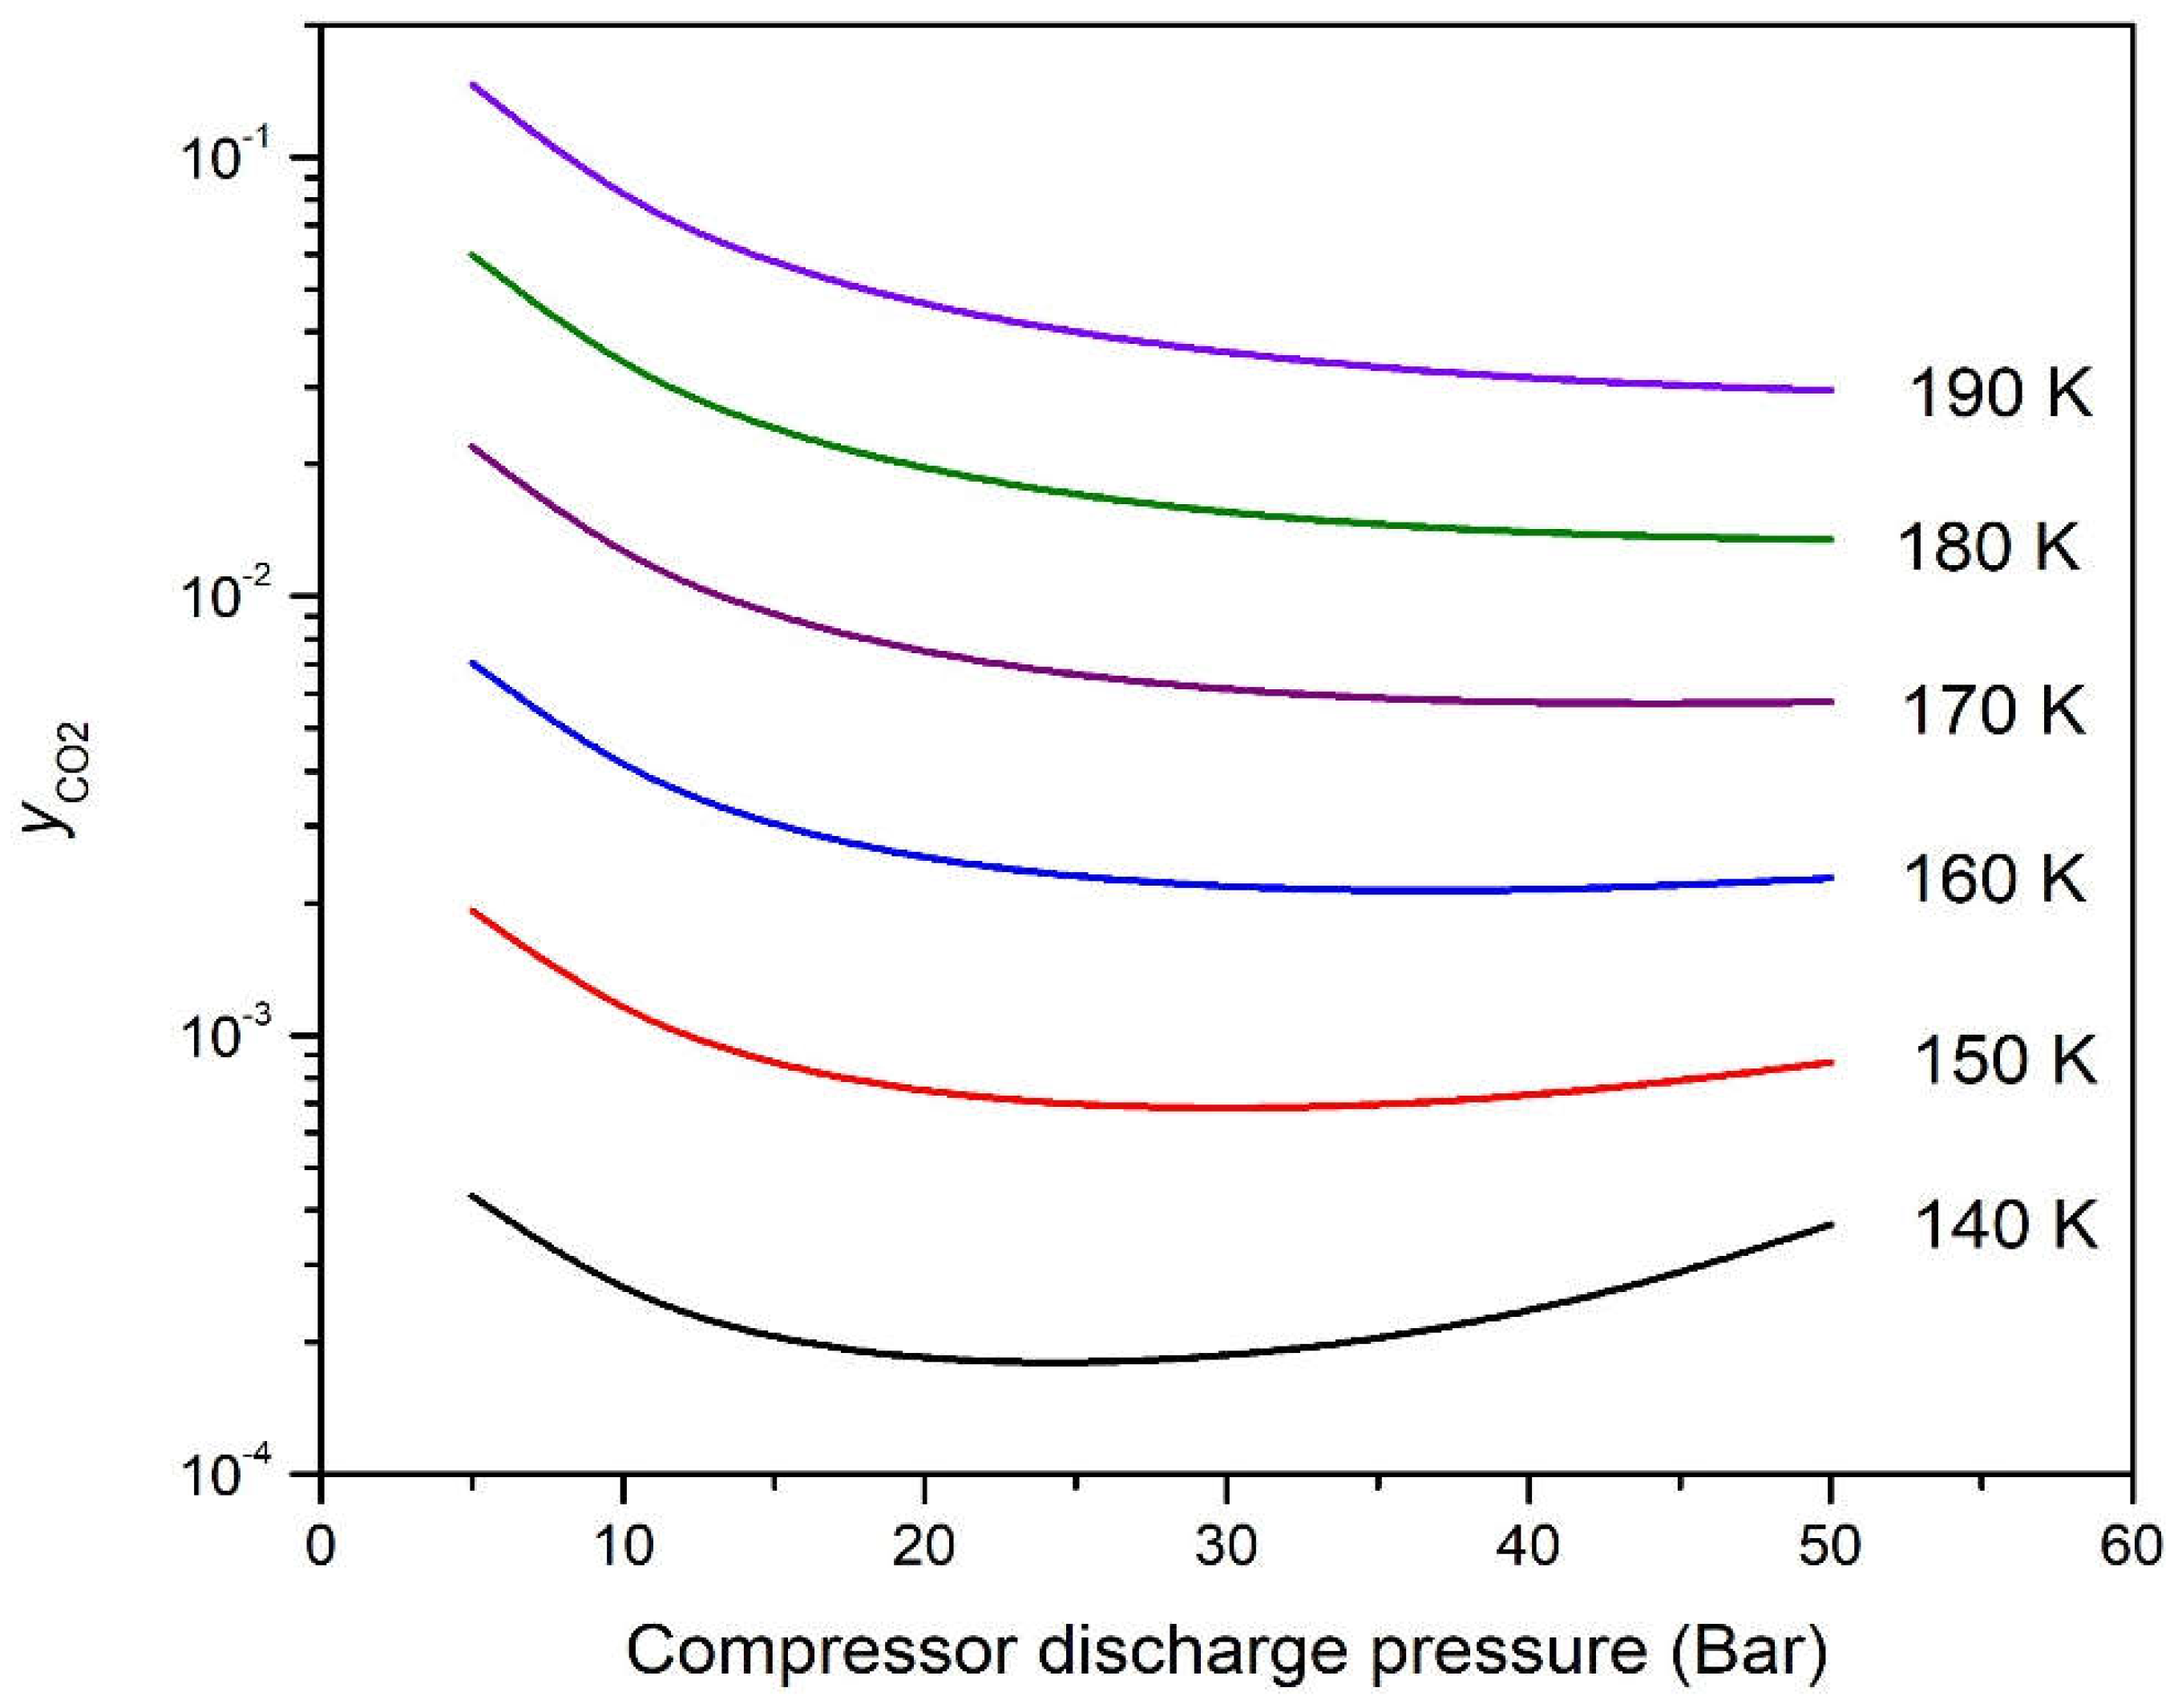
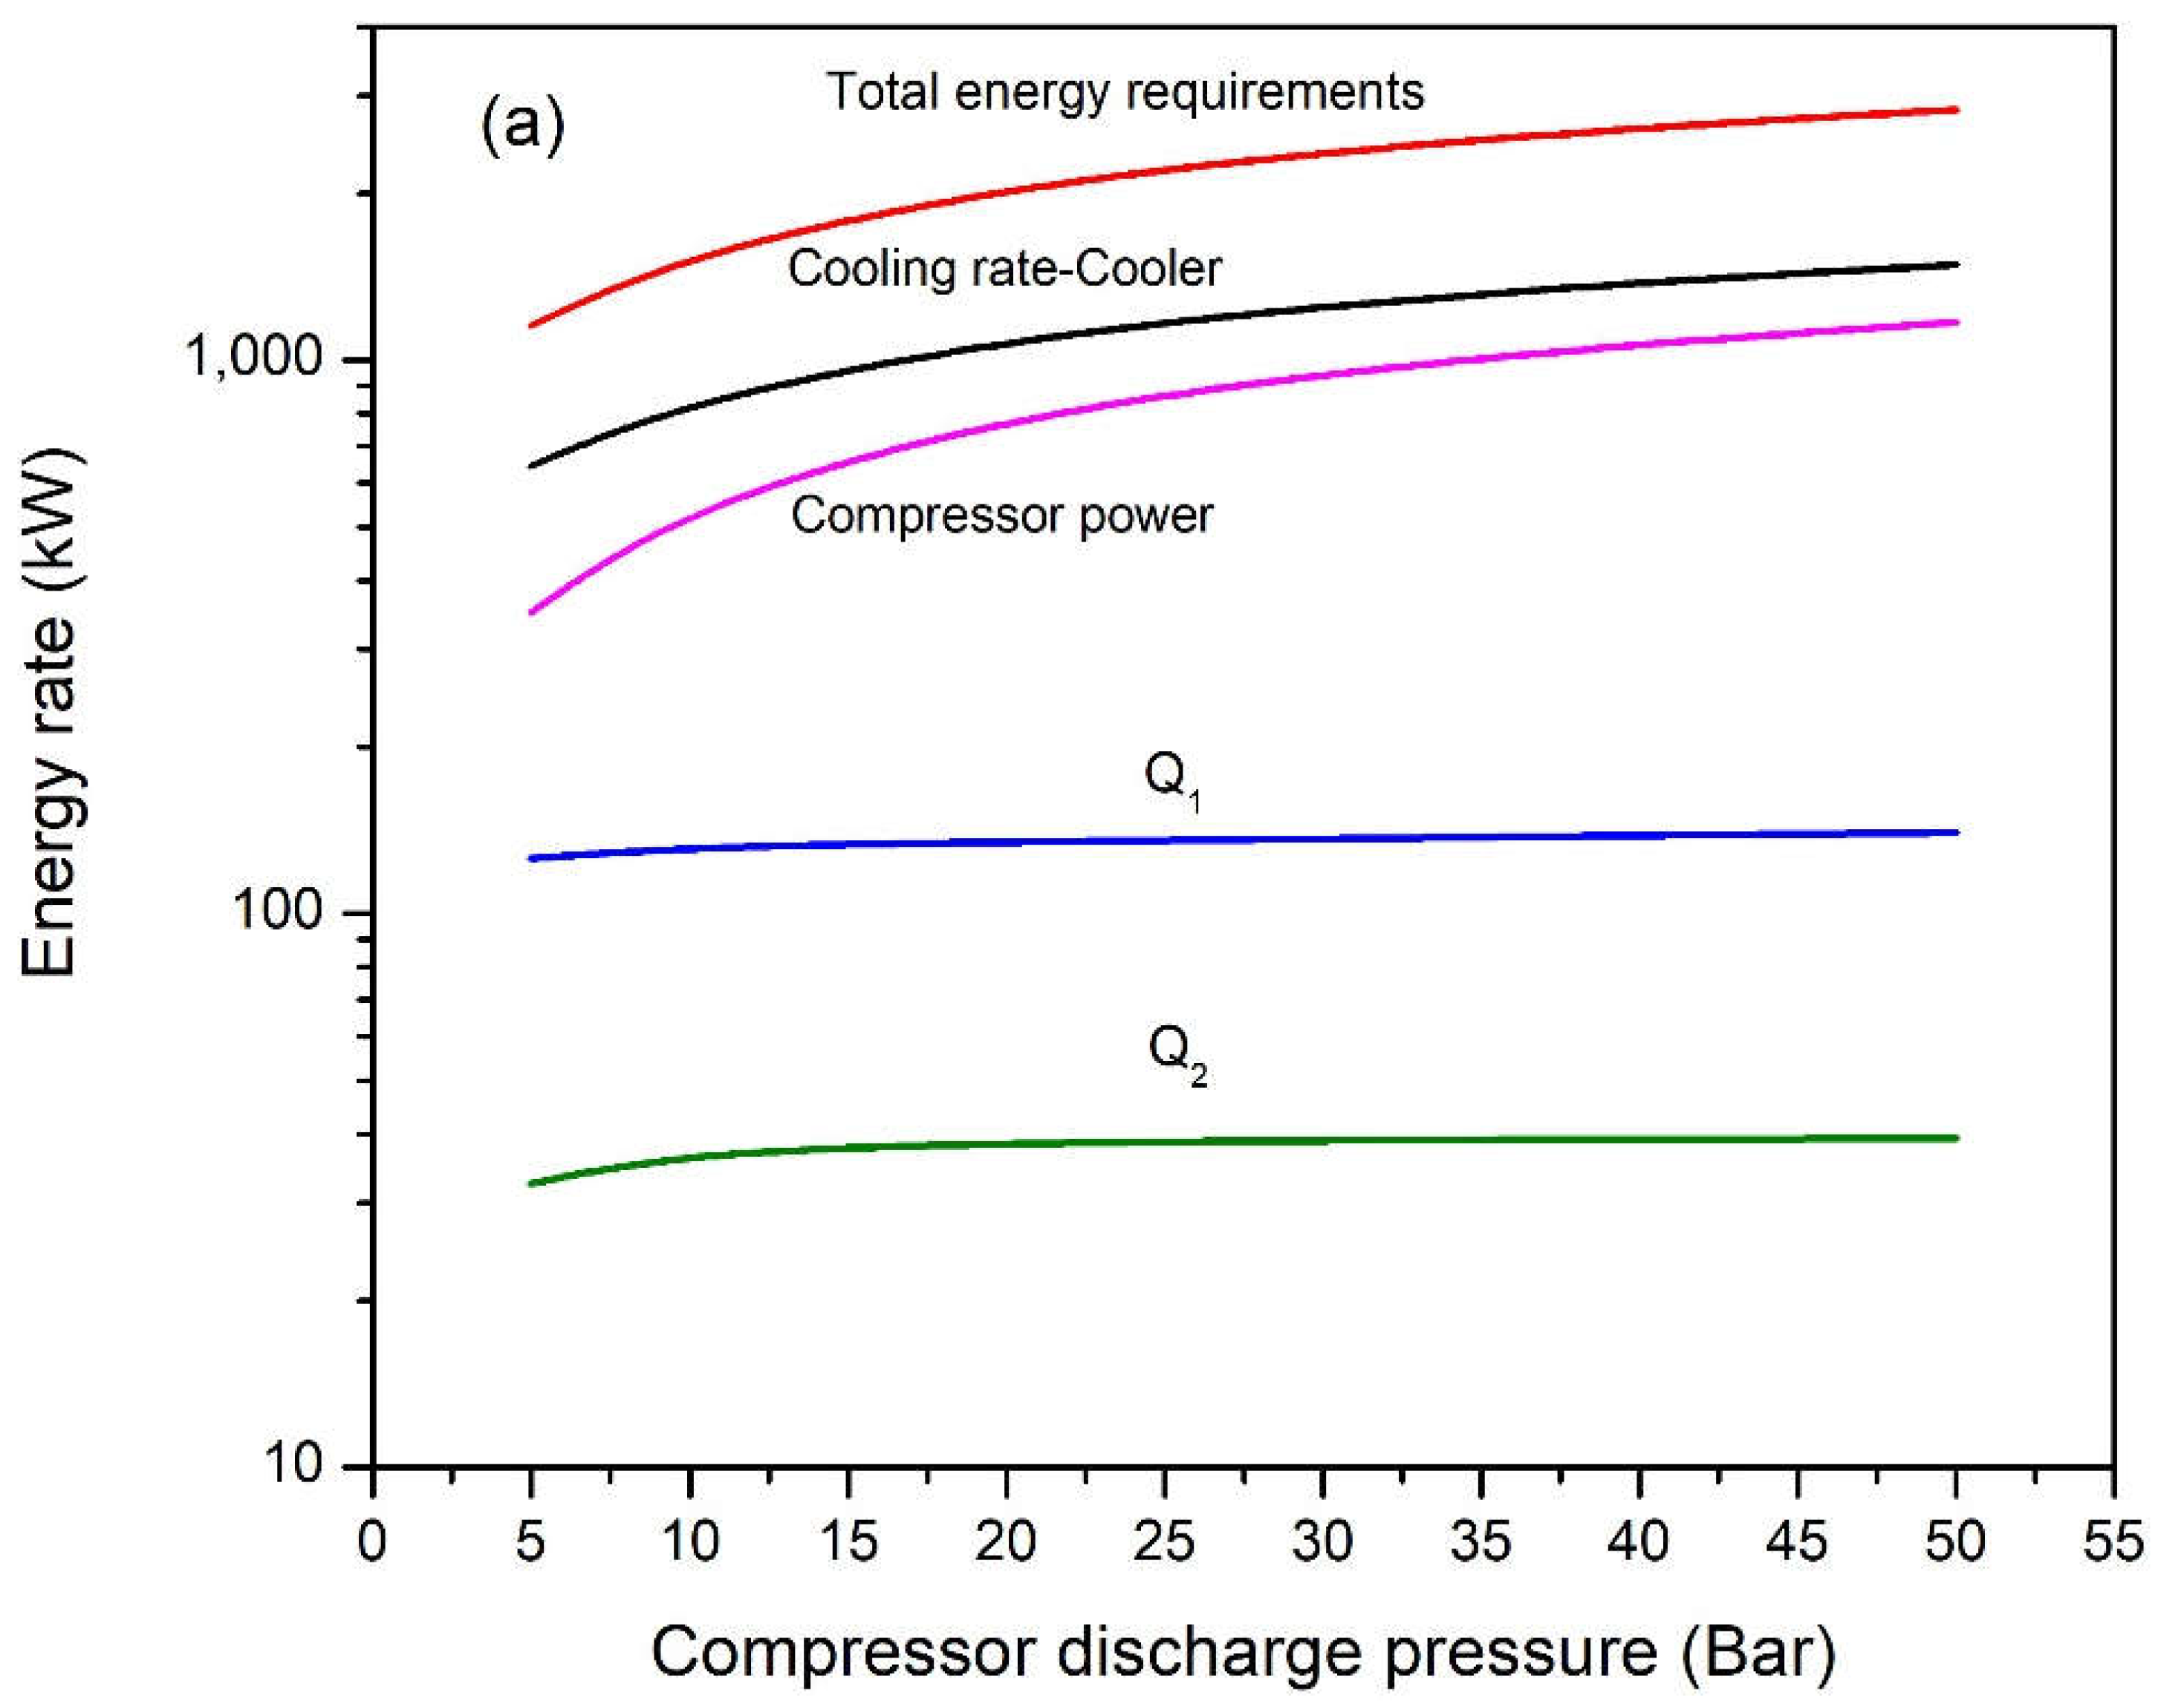
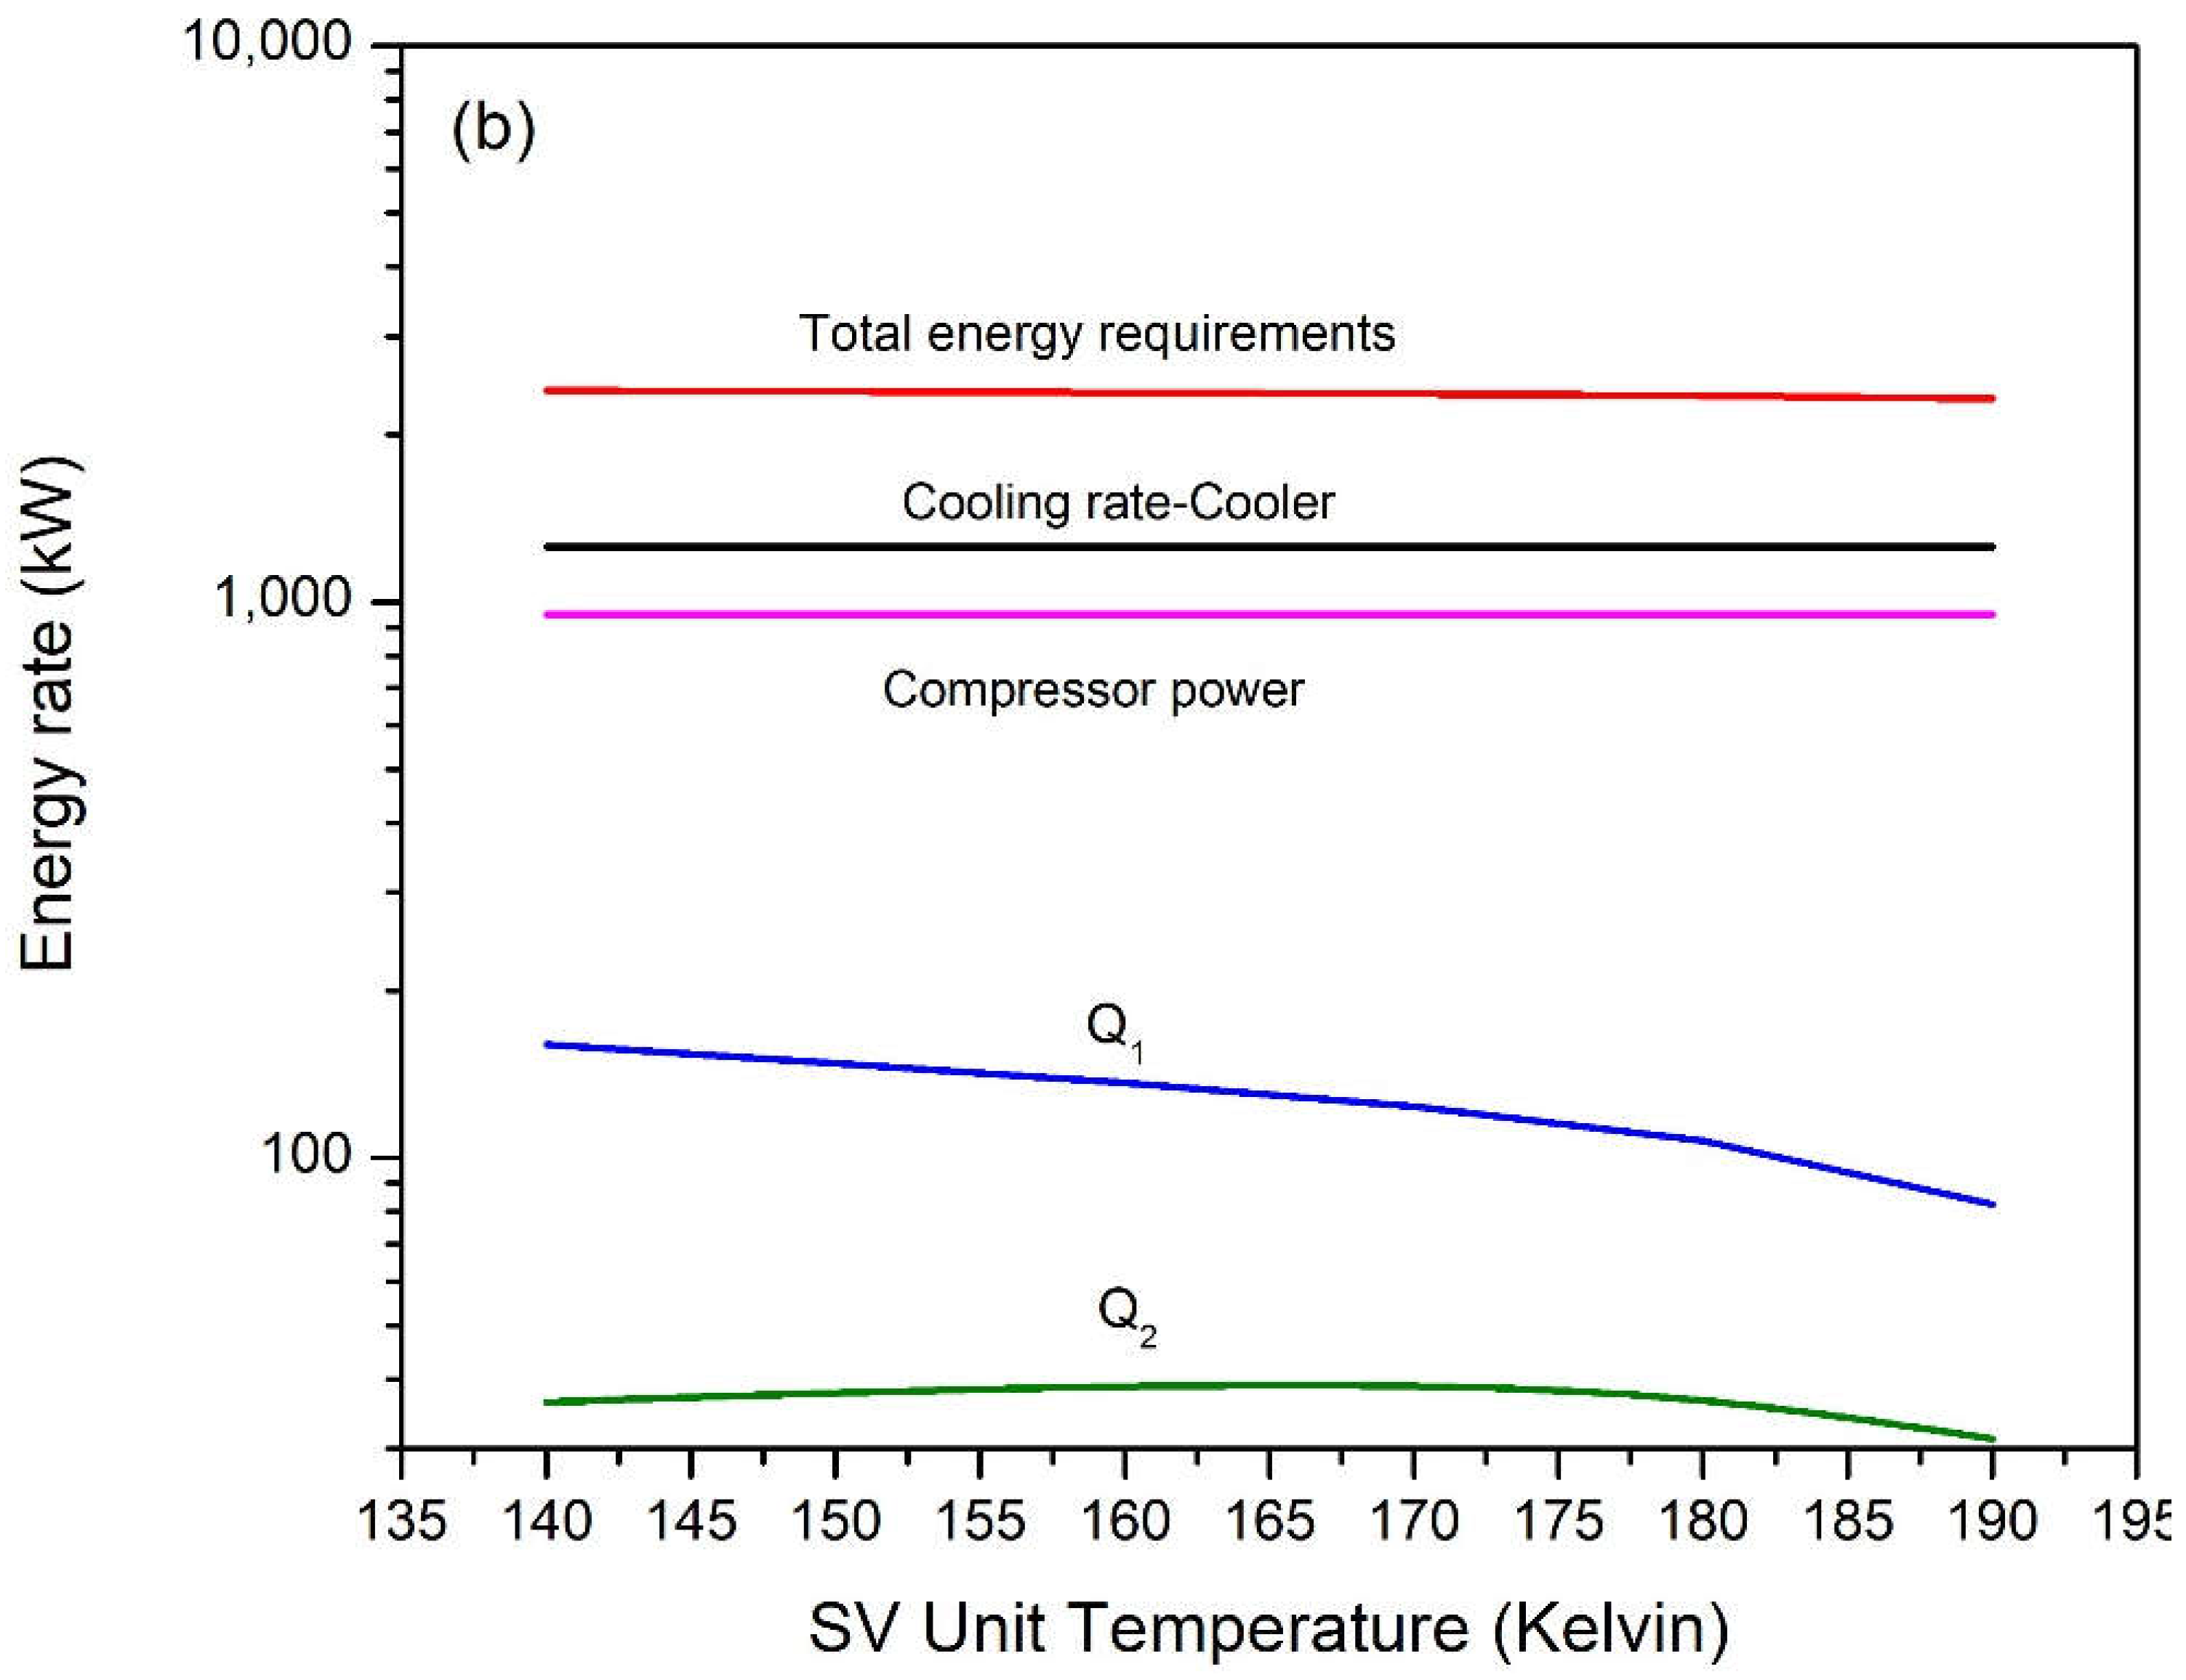
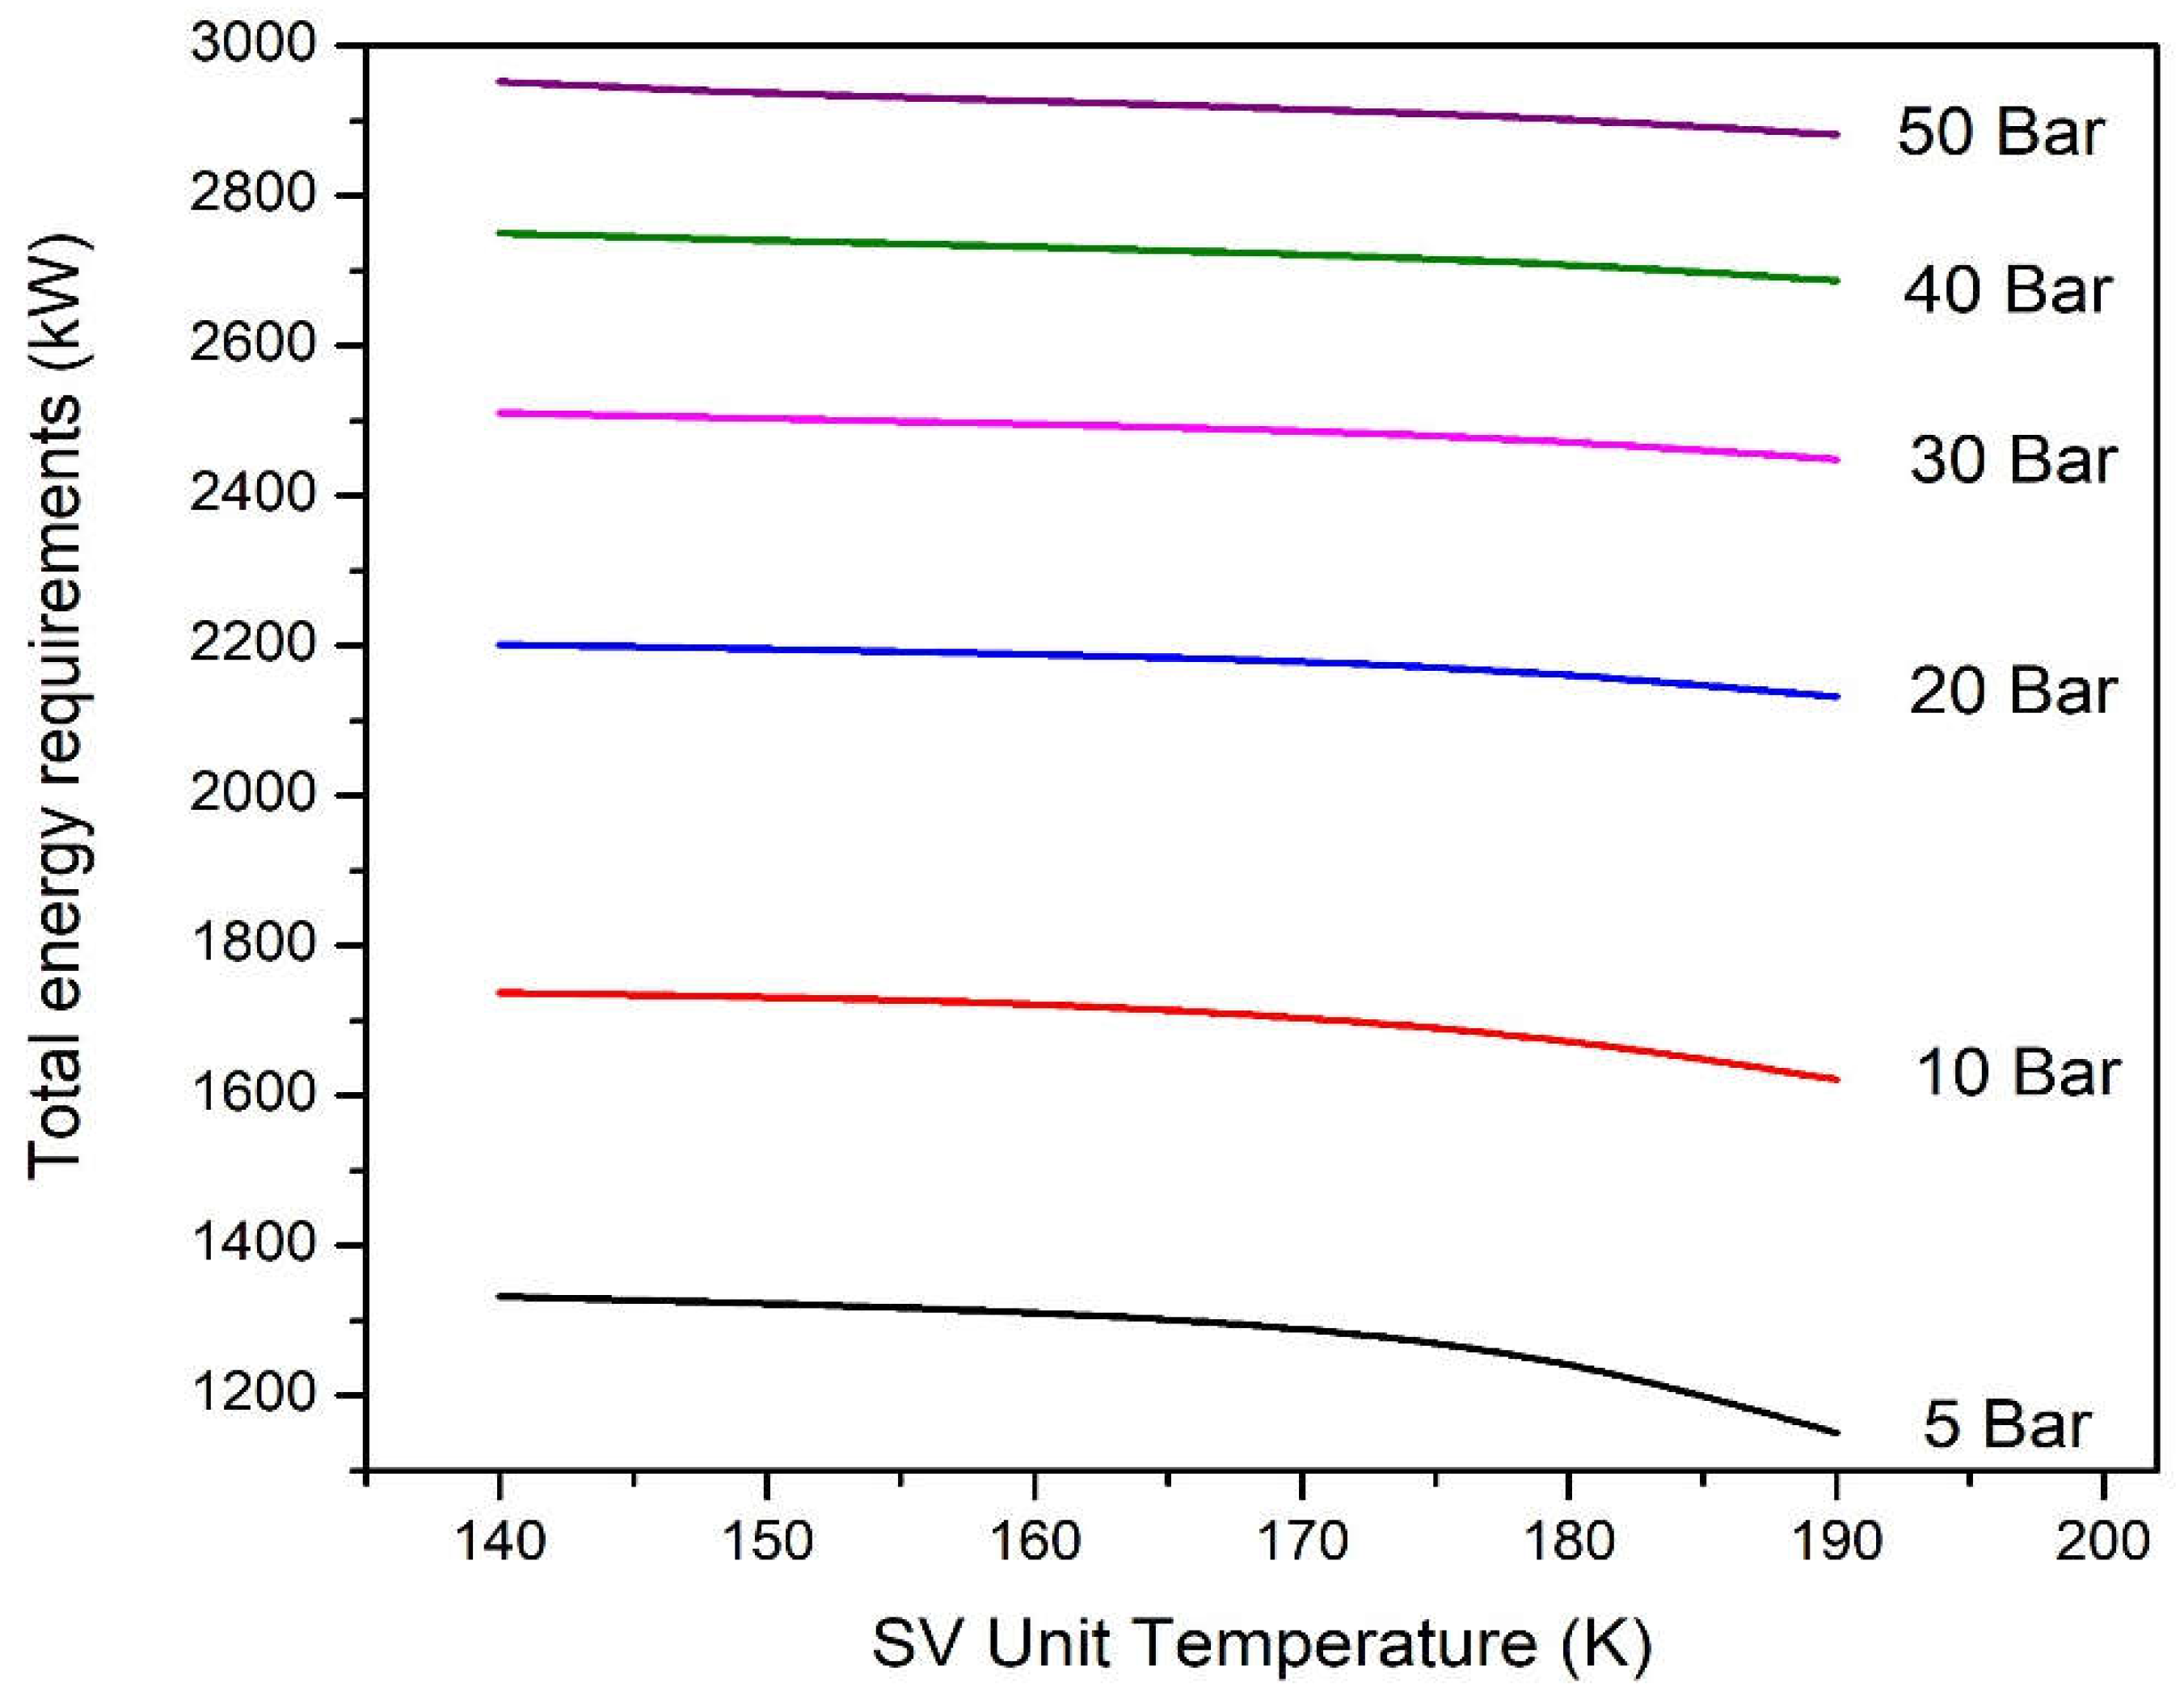
3.4. Simulation of SV Separation Unit and Sensitivity Analyses
- Case 1 (86.9% N2, 11.0% CO2, 2.1% O2)
- Case 2 (71.8% N2, 24.7% CO2, 3.5% O2)
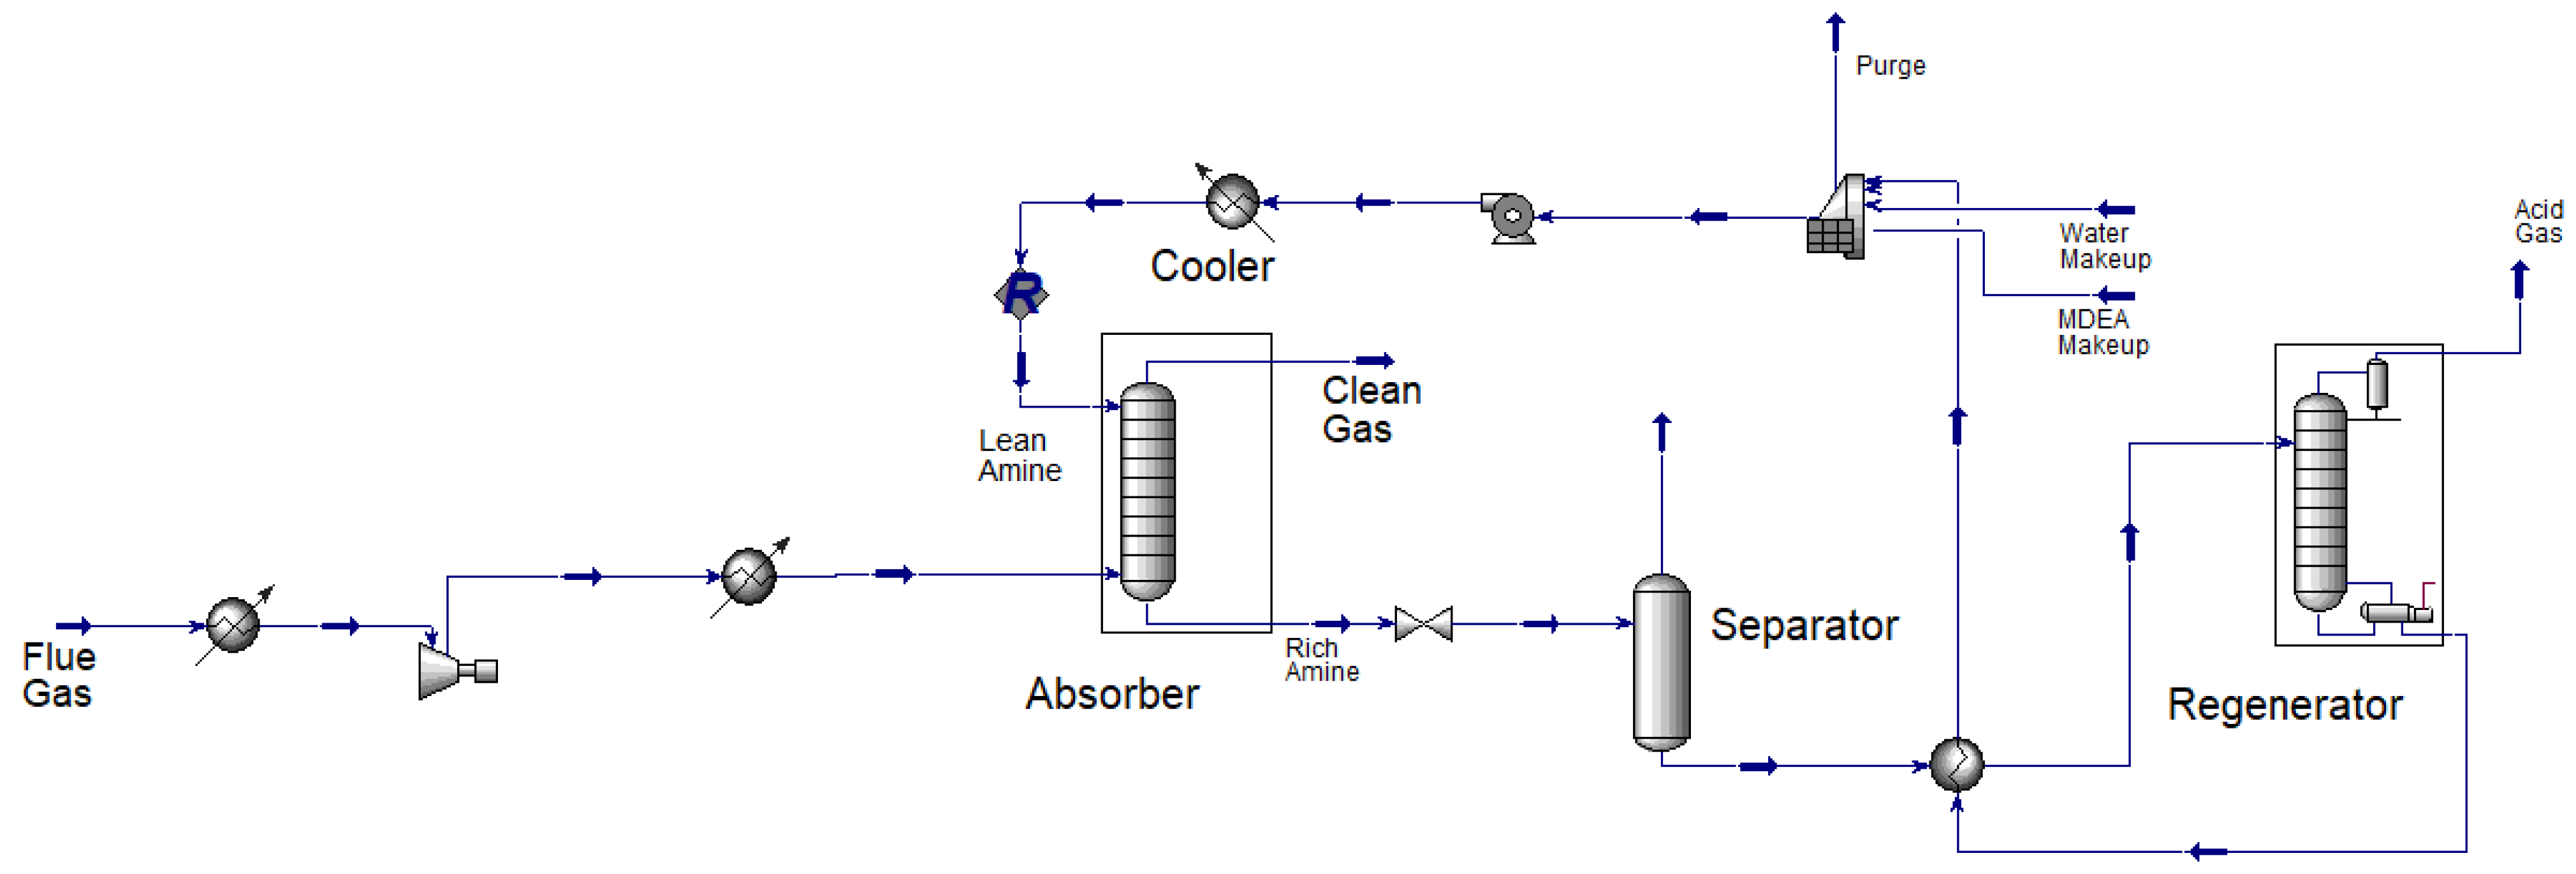
3.5. Comparison with Amine-Based CO2 Capture Unit
4. Conclusions
Author Contributions
Funding
Data Availability Statement
Acknowledgments
Conflicts of Interest
References
- Moazzem, S. A Review on Technologies for Reducing CO2 Emission from Coal Fired Power Plants; Rasul, M.G., Ed.; IntechOpen: Rijeka, Croatia, 2012; p. 11. [Google Scholar]
- Lettieri, P.; Yassin, L.; Simons, S.J.R. 7—Advanced thermal treatment of composite wastes for energy recovery. In Woodhead Publishing Series in Composites Science and Engineering; Recycling and Reuse of Waste Composites; Woodhead Publishing: Cambridge, UK, 2010; pp. 152–191. ISBN 978-1-84569-462-3. [Google Scholar]
- Song, C.; Pan, W.; Srimat, S.T.; Zheng, J.; Li, Y.; Wang, Y.-H.; Xu, B.-Q.; Zhu, Q.-M. Tri-reforming of Methane over Ni Catalysts for CO2 Conversion to Syngas With Desired H2/CO Ratios Using Flue Gas of Power Plants Without CO2 Separation. In Carbon Dioxide Utilization for Global Sustainability; Park, S.-E., Chang, J.-S., Lee, Eds.; Elsevier: Amsterdam, The Netherlands, 2004; Volume 153, pp. 315–322. ISBN 0167-2991. [Google Scholar]
- Alalwan, H.A.; Alminshid, A.H. Science of the Total Environment CO2 capturing methods: Chemical looping combustion (CLC) as a promising technique. Sci. Total Environ. 2021, 788, 147850. [Google Scholar] [CrossRef] [PubMed]
- Kanniche, M.; Gros-Bonnivard, R.; Jaud, P.; Valle-Marcos, J.; Amann, J.-M.; Bouallou, C. Pre-combustion, post-combustion and oxy-combustion in thermal power plant for CO2 capture. Appl. Therm. Eng. 2010, 30, 53–62. [Google Scholar] [CrossRef] [Green Version]
- Godin, J.; Liu, W.; Ren, S.; Xu, C.C. Advances in recovery and utilization of carbon dioxide: A brief review. J. Environ. Chem. Eng. 2021, 9, 105644. [Google Scholar] [CrossRef]
- Figueroa, J.D.; Fout, T.; Plasynski, S.I.; McIlvried, H.; Srivastava, R.D. Advances in CO2 Capture Technology—The U.S. Department of Energy’s Carbon Sequestration Program. Int. J. Greenh. Gas Control 2008, 2, 9–20. [Google Scholar] [CrossRef]
- Spigarelli, B.P.; Kawatra, S.K. Opportunities and challenges in carbon dioxide capture. J. CO2 Util. 2013, 1, 69–87. [Google Scholar] [CrossRef]
- Cuéllar-Franca, R.M.; Azapagic, A. Carbon capture, storage and utilisation technologies: A critical analysis and comparison of their life cycle environmental impacts. J. CO2 Util. 2015, 9, 82–102. [Google Scholar] [CrossRef]
- Wang, M.; Lawal, A.; Stephenson, P.; Sidders, J.; Ramshaw, C. Post-combustion CO2 capture with chemical absorption: A state-of-the-art review. Chem. Eng. Res. Des. 2011, 89, 1609–1624. [Google Scholar] [CrossRef] [Green Version]
- Shaw, R.; Mukherjee, S. The development of carbon capture and storage (CCS) in India: A critical review. Carbon Capture Sci. Technol. 2022, 2, 100036. [Google Scholar] [CrossRef]
- Dunstan, M.T.; Donat, F.; Bork, A.H.; Grey, C.P.; Müller, C.R. CO2 Capture at Medium to High Temperature Using Solid Oxide-Based Sorbents: Fundamental Aspects, Mechanistic Insights, and Recent Advances. Chem. Rev. 2021, 121, 12681–12745. [Google Scholar] [CrossRef]
- Xu, Y.; Luo, C.; Sang, H.; Lu, B.; Wu, F.; Li, X.; Zhang, L. Structure and surface insight into a temperature-sensitive CaO-based CO2 sorbent. Chem. Eng. J. 2022, 435, 134960. [Google Scholar] [CrossRef]
- Qiao, Y.; Wu, C. Nitrogen enriched biochar used as CO2 adsorbents: A brief review. Carbon Capture Sci. Technol. 2022, 2, 100018. [Google Scholar] [CrossRef]
- Demir, H.; Aksu, G.O.; Gulbalkan, H.C.; Keskin, S. MOF Membranes for CO2 Capture: Past, Present and Future. Carbon Capture Sci. Technol. 2022, 2, 100026. [Google Scholar] [CrossRef]
- Kiani, S.; Taghizade, A.; Ramezani, R.; di Felice, R.; Molelekwa, G.F.; Mazinani, S. Enhancement of CO2 removal by promoted MDEA solution in a hollow fiber membrane contactor: A numerical and experimental study. Carbon Capture Sci. Technol. 2022, 2, 100028. [Google Scholar] [CrossRef]
- Ababneh, H.; Al-Muhtaseb, S. An Empirical Correlation-Based Model to Predict Solid-Fluid Phase Equilibria and Phase Separation of the Ternary System CH4-CO2-H2S. J. Nat. Gas Sci. Eng. 2021, 94, 104120. [Google Scholar] [CrossRef]
- Ababneh, H.; Al-muhtaseb, S.A. A Review on the Solid-Liquid-Vapor Phase Equilibria of Acid Gases in Methane. Greenh. Gases Sci. Technol. 2022, 12, 566–579. [Google Scholar] [CrossRef]
- Font-Palma, C.; Cann, D.; Udemu, C. Review of Cryogenic Carbon Capture Innovations and Their Potential Applications. J. Carbon Res. 2021, 7, 58. [Google Scholar] [CrossRef]
- Maqsood, K.; Mullick, A.; Ali, A.; Kargupta, K.; Ganguly, S. Cryogenic carbon dioxide separation from natural gas: A review based on conventional and novel emerging technologies. Rev. Chem. Eng. 2014, 30, 453–477. [Google Scholar] [CrossRef]
- Valencia, J.A.; Denton, R.D.; Northrop, P.S.; Mart, C.J.; Smith, R.K. Controlled freeze zone technology for the commercialization of Australian high CO2 natural gas. In SPE Asia Pacific Oil & Gas Conference and Exhibition; OnePetro: Adelaide, Australia, 2014; Volume 2, pp. 951–961. [Google Scholar] [CrossRef]
- Sonntag, R.E.; Wylen, G.J. The Solid—Vapor Equilibrium of Carbon Dioxide—Nitrogen. Adv. Cryog. Eng. 1962, 7, 99–105. [Google Scholar] [CrossRef]
- Smith, G.E.; Sonntag, R.E.; Wylen, G.J. Solid-Vapor Equilibrium of the Carbon Dioxide-Nitrogen System at Pressures to 200 Atmospheres. Adv. Cryog. Eng. 1964, 9, 197–206. [Google Scholar] [CrossRef]
- Rest, A.J.; Scurlock, R.G.; Wu, M.F. The solubilities of nitrous oxide, carbon dioxide, Aliphatic ethers and alcohols, and water in cryogenic liquids. Chem. Eng. J. 1990, 43, 25–31. [Google Scholar] [CrossRef]
- Yakimenko, N.P.; Gluch, G.M.; Iomtev, M.B.; Abramova, R.I. Solubility of Solid Carbon-Dioxide in Liquid-Nitrogen. Zhurnal Fiz. Khimii 1975, 49, 209–210. [Google Scholar]
- Fedorova, M.F. The solubility of C2h2 and CO2 in liquid nitrogen and oxygen. Zhurnal Fiz. Khimii 1940, 14, 422–426. [Google Scholar]
- Schweitzer, O.R. Solid-Liquid-Vapor Phase Equilibria in the Binary Systems: Ethylene—Carbon-Dioxide, Propane—Carbon-Dioxide, Nitrogen—Carbon-Dioxide, and Helium—Carbon-Dioxide; Wayne State University: Detroit, MI, USA, 1962. [Google Scholar]
- Fandiño, O.; Trusler, J.P.M.; Vega-Maza, D. Phase behavior of (CO2+H2) and (CO2+N2) at temperatures between (218.15 and 303.15)K at pressures up to 15MPa. Int. J. Greenh. Gas Control 2015, 36, 78–92. [Google Scholar] [CrossRef] [Green Version]
- Amamchyan, R.G.; Bertsev, V.V.; Bulanin, M.O. Analysis of cryogenic solutions according to IR absorption spectra. Zavod. Lab 1973, 39, 432–434. [Google Scholar]
- De Stefani, V.; Baba-Ahmed, A.; Valtz, A.; Meneses, D.; Richon, D. Solubility measurements for carbon dioxide and nitrous oxide in liquid oxygen at temperatures down to 90 K. Fluid Phase Equilib. 2002, 200, 19–30. [Google Scholar] [CrossRef]
- De Guido, G.; Pellegrini, L.A. Calculation of solid-vapor equilibria for cryogenic carbon capture. Comput. Chem. Eng. 2022, 156, 107569. [Google Scholar] [CrossRef]
- Peng, D.-Y.; Robinson, D.B. A New Two-Constant Equation of State. Ind. Eng. Chem. Fundam. 1976, 15, 59–64. [Google Scholar] [CrossRef]
- Baxter, L.; Baxter, A.; Burt, S. Cryogenic CO2 Capture as a Cost-Effective CO2 Capture Process. In Proceedings of the 26th Annual International Pittsburgh Coal Conference 2009, Pittsburgh, PA, USA; 2009; Volume 1. [Google Scholar]
- Maqsood, K.; Ali, A.; Nasir, R.; Abdulrahman, A.; Bin Mahfouz, A.; Ahmed, A.; Shariff, A.B.M.; Ganguly, S.; Mubashir, M.; Show, P.L. Experimental and simulation study on high-pressure V-L-S cryogenic hybrid network for CO2 capture from highly sour natural gas. Process Saf. Environ. Prot. 2021, 150, 36–50. [Google Scholar] [CrossRef]
- Tuinier, M.J.; van Sint Annaland, M.; Kuipers, J.A.M. A novel process for cryogenic CO2 capture using dynamically operated packed beds—An experimental and numerical study. Int. J. Greenh. Gas Control 2011, 5, 694–701. [Google Scholar] [CrossRef]
- Tuinier, M.J.; van Sint Annaland, M. Biogas Purification Using Cryogenic Packed-Bed Technology. Ind. Eng. Chem. Res. 2012, 51, 5552–5558. [Google Scholar] [CrossRef]
- Seiler, M.; Groß, J.; Bungert, B.; Sadowski, G.; Arlt, W. Modeling of Solid/Fluid Phase Equilibria in Multicomponent Systems at High Pressure. Chem. Eng. Technol. 2001, 24, 607–612. [Google Scholar] [CrossRef]
- Jäger, A.; Span, R. Equation of state for solid carbon dioxide based on the Gibbs free energy. J. Chem. Eng. Data 2012, 57, 590–597. [Google Scholar] [CrossRef]
- Yokozeki, A. Analytical Equation of State for Solid-Liquid-Vapor Phases. Int. J. Thermophys. 2003, 24, 589–620. [Google Scholar] [CrossRef]
- Ababneh, H.; Al-muhtaseb, S.A. Prediction of solid-liquid-vapor phase equilibria of noble gases in nitrogen. Arab. J. Chem. 2022, 15, 103866. [Google Scholar] [CrossRef]
- Vera, J.H. Book Review: Molecular thermodynamics of fluid-phase equilibria by John M. Prausnitz, Rüdiger N. Lichtenthaler and Edmundo Comes de Azevedo, Third Edition, 1999. Can. J. Chem. Eng. 2000, 78, 429–430. [Google Scholar] [CrossRef]
- Nikolaidis, I.K.; Boulougouris, G.C.; Peristeras, L.D.; Economou, I.G. Equation-of-State Modeling of Solid-Liquid-Gas Equilibrium of CO2 Binary Mixtures. Ind. Eng. Chem. Res. 2016, 55, 6213–6226. [Google Scholar] [CrossRef]
- Sandler, S.I. Chemical, Biochemical, and Engineering Thermodynamics; Wiley: Hoboken, NJ, USA, 2006. [Google Scholar]
- Smith Van Ness, H.C.; Abbott Michael, M.J.M. Introduction to Chemical Engineering Thermodynamics; McGraw-Hill: Boston, MA, USA, 2005. [Google Scholar]
- Ababneh, H.; AlNouss, A.; Karimi, I.A.; Al-Muhtaseb, S.A. Natural Gas Sweetening Using an Energy-Efficient, State-of-the-Art, Solid and Vapor Separation Process. Energies 2022, 15, 5286. [Google Scholar] [CrossRef]
- Shakeel, H.; Wei, H.; Pomeroy, J.M. Measurements of enthalpy of sublimation of Ne, N2, O2, Ar, CO2, Kr, Xe, and H2O using a double paddle oscillator. J. Chem. Thermodyn. 2018, 118, 127–138. [Google Scholar] [CrossRef] [Green Version]
- Aspen Technology, Inc. Aspen Plus User Guide, Version 10.2, Aspen Plus®; Aspen Technology, Inc.: Cambridge, MA, USA, 2000. [Google Scholar]
- Riva, M. Biomethane Purification Processes: Thermodynamic Study of Solid-Liquid-Vapor Equilibria of Methane-Rich Mixtures; Université Paris Sciences et Lettres: Paris, France, 2016. [Google Scholar]
- Rodriguez-Reartes, S.B.; Cismondi, M.; Zabaloy, M.S. Computation of solid-fluid-fluid equilibria for binary asymmetric mixtures in wide ranges of conditions. J. Supercrit. Fluids 2011, 57, 9–24. [Google Scholar] [CrossRef]
- Riva, M.; Campestrini, M.; Toubassy, J.; Clodic, D.; Stringari, P. Solid-liquid-vapor equilibrium models for cryogenic biogas upgrading. Ind. Eng. Chem. Res. 2014, 53, 17506–17514. [Google Scholar] [CrossRef]
- Jacobsen, R.T.; Stewart, R.B.; Jahangiri, M. Thermodynamic Properties of Nitrogen from the Freezing Line to 2000 K at Pressures to 1000 MPa. J. Phys. Chem. Ref. Data 1986, 15, 735–909. [Google Scholar] [CrossRef]
- Von Henning, F.; Otto, J. Vapor-Pressure Curves and Triple Points in the Temperature Range from 14° to 90° Abs. Phys. Z. 1936, 37, 633. [Google Scholar]
- Benamor, A.; Nasser, M.; Al-Marri, M.J. Gas Processing Technology-Treatment and Utilization; Abraham, M., Ed.; Elsevier: Oxford, UK, 2017; pp. 359–387. ISBN 978-0-12-804792-7. [Google Scholar]
- Jenny Seagraves, R.H.; Weiland, I.O. Treating High CO2 Gases with MDEA. 2009. Available online: https://www.digitalrefining.com/article/1000573/treating-high-co2-gases-with-mdea#.Ysh8T3ZBw2x (accessed on 25 August 2022).


| Case | ZN2 | ZO2 | ZCO2 | ZCO2/ZN2 | ZCO2/ZO2 | ZO2/ZN2 |
|---|---|---|---|---|---|---|
| A | 0.80 | 0.05 | 0.15 | 0.1875 | 3.000 | 0.0625 |
| B | 0.75 | 0.05 | 0.20 | 0.2667 | 4.000 | 0.0667 |
| C | 0.67 | 0.08 | 0.25 | 0.3731 | 3.125 | 0.1194 |
| Feed | Case 1 | Case 2 | |
|---|---|---|---|
| Dry feed composition | N2 | 86.9% | 71.8% |
| O2 | 2.1% | 3.5% | |
| CO2 | 11.0% | 24.7% | |
| Feed flow rate | kg/h | 2986 | 3210 |
| kmol/h | 100 | ||
| Feed conditions | Temperature | 280 °C (553.15 K) | |
| Pressure | 1 atm (1.01325 bar) | ||
| Case 1 | Case 2 | ||
|---|---|---|---|
| Solvent | MDEA | ||
| Solvent flow rate | kg/h | 4168.5 | 9178.2 |
| kmol/h | 143.0 | 314.5 | |
| Output gas composition | N2 | 97.1% | 94.9% |
| O2 | 2.4% | 4.6% | |
| CO2 | 0.3% | 0.3% | |
| H2O | 0.2% | 0.2% | |
| CO2 recovery (ratio removed from the feed) | CO2 | 97% | 99.1% |
| Energy requirements (kW) | Flue gas Cooler 1 | 214.2 | 226.4 |
| Flue gas Compressor | 680.2 | 657.8 | |
| Flue gas Cooler 2 | 687.2 | 670.1 | |
| Reboiler | 259.2 | 369.4 | |
| Condenser | 137.0 | 109.2 | |
| Pump | 8.4 | 18.6 | |
| Amine cooler | 102.0 | 232.6 | |
| Total | 2088.1 | 2284.1 | |
| Output cleangas conditions | Temperature (K) | 316.93 | |
| Pressure (bar) | 56.17 | ||
| Case 1 | Case 2 | ||
|---|---|---|---|
| Output clean gas phase composition (mol%) | N2 | 97.3% | 95.1% |
| O2 | 2.4% | 4.6% | |
| CO2 | 0.3% | 0.3% | |
| CO2 recovery (ratio removed from feed) | CO2 | 97% | 99.1% |
| Energy requirements (kW) | Compressor | 350.7 | 345.3 |
| Cooler | 644.1 | 653.7 | |
| 134.4 | 245.8 | ||
| 33.1 | 75.3 | ||
| Total | 1162.1 | 1320.4 | |
| Output clean gas conditions | Temperature (K) | 153.4 | |
| Pressure (bar) | 5 | ||
Publisher’s Note: MDPI stays neutral with regard to jurisdictional claims in published maps and institutional affiliations. |
© 2022 by the authors. Licensee MDPI, Basel, Switzerland. This article is an open access article distributed under the terms and conditions of the Creative Commons Attribution (CC BY) license (https://creativecommons.org/licenses/by/4.0/).
Share and Cite
Ababneh, H.; AlNouss, A.; Al-Muhtaseb, S.A. Carbon Capture from Post-Combustion Flue Gas Using a State-Of-The-Art, Anti-Sublimation, Solid–Vapor Separation Unit. Processes 2022, 10, 2406. https://doi.org/10.3390/pr10112406
Ababneh H, AlNouss A, Al-Muhtaseb SA. Carbon Capture from Post-Combustion Flue Gas Using a State-Of-The-Art, Anti-Sublimation, Solid–Vapor Separation Unit. Processes. 2022; 10(11):2406. https://doi.org/10.3390/pr10112406
Chicago/Turabian StyleAbabneh, Hani, Ahmed AlNouss, and Shaheen A. Al-Muhtaseb. 2022. "Carbon Capture from Post-Combustion Flue Gas Using a State-Of-The-Art, Anti-Sublimation, Solid–Vapor Separation Unit" Processes 10, no. 11: 2406. https://doi.org/10.3390/pr10112406