
Process Automation and Control Strategy by Quality-by-Design in Total Continuous mRNA Manufacturing Platforms

 ,
, 
 and
and
Abstract
:1. Introduction
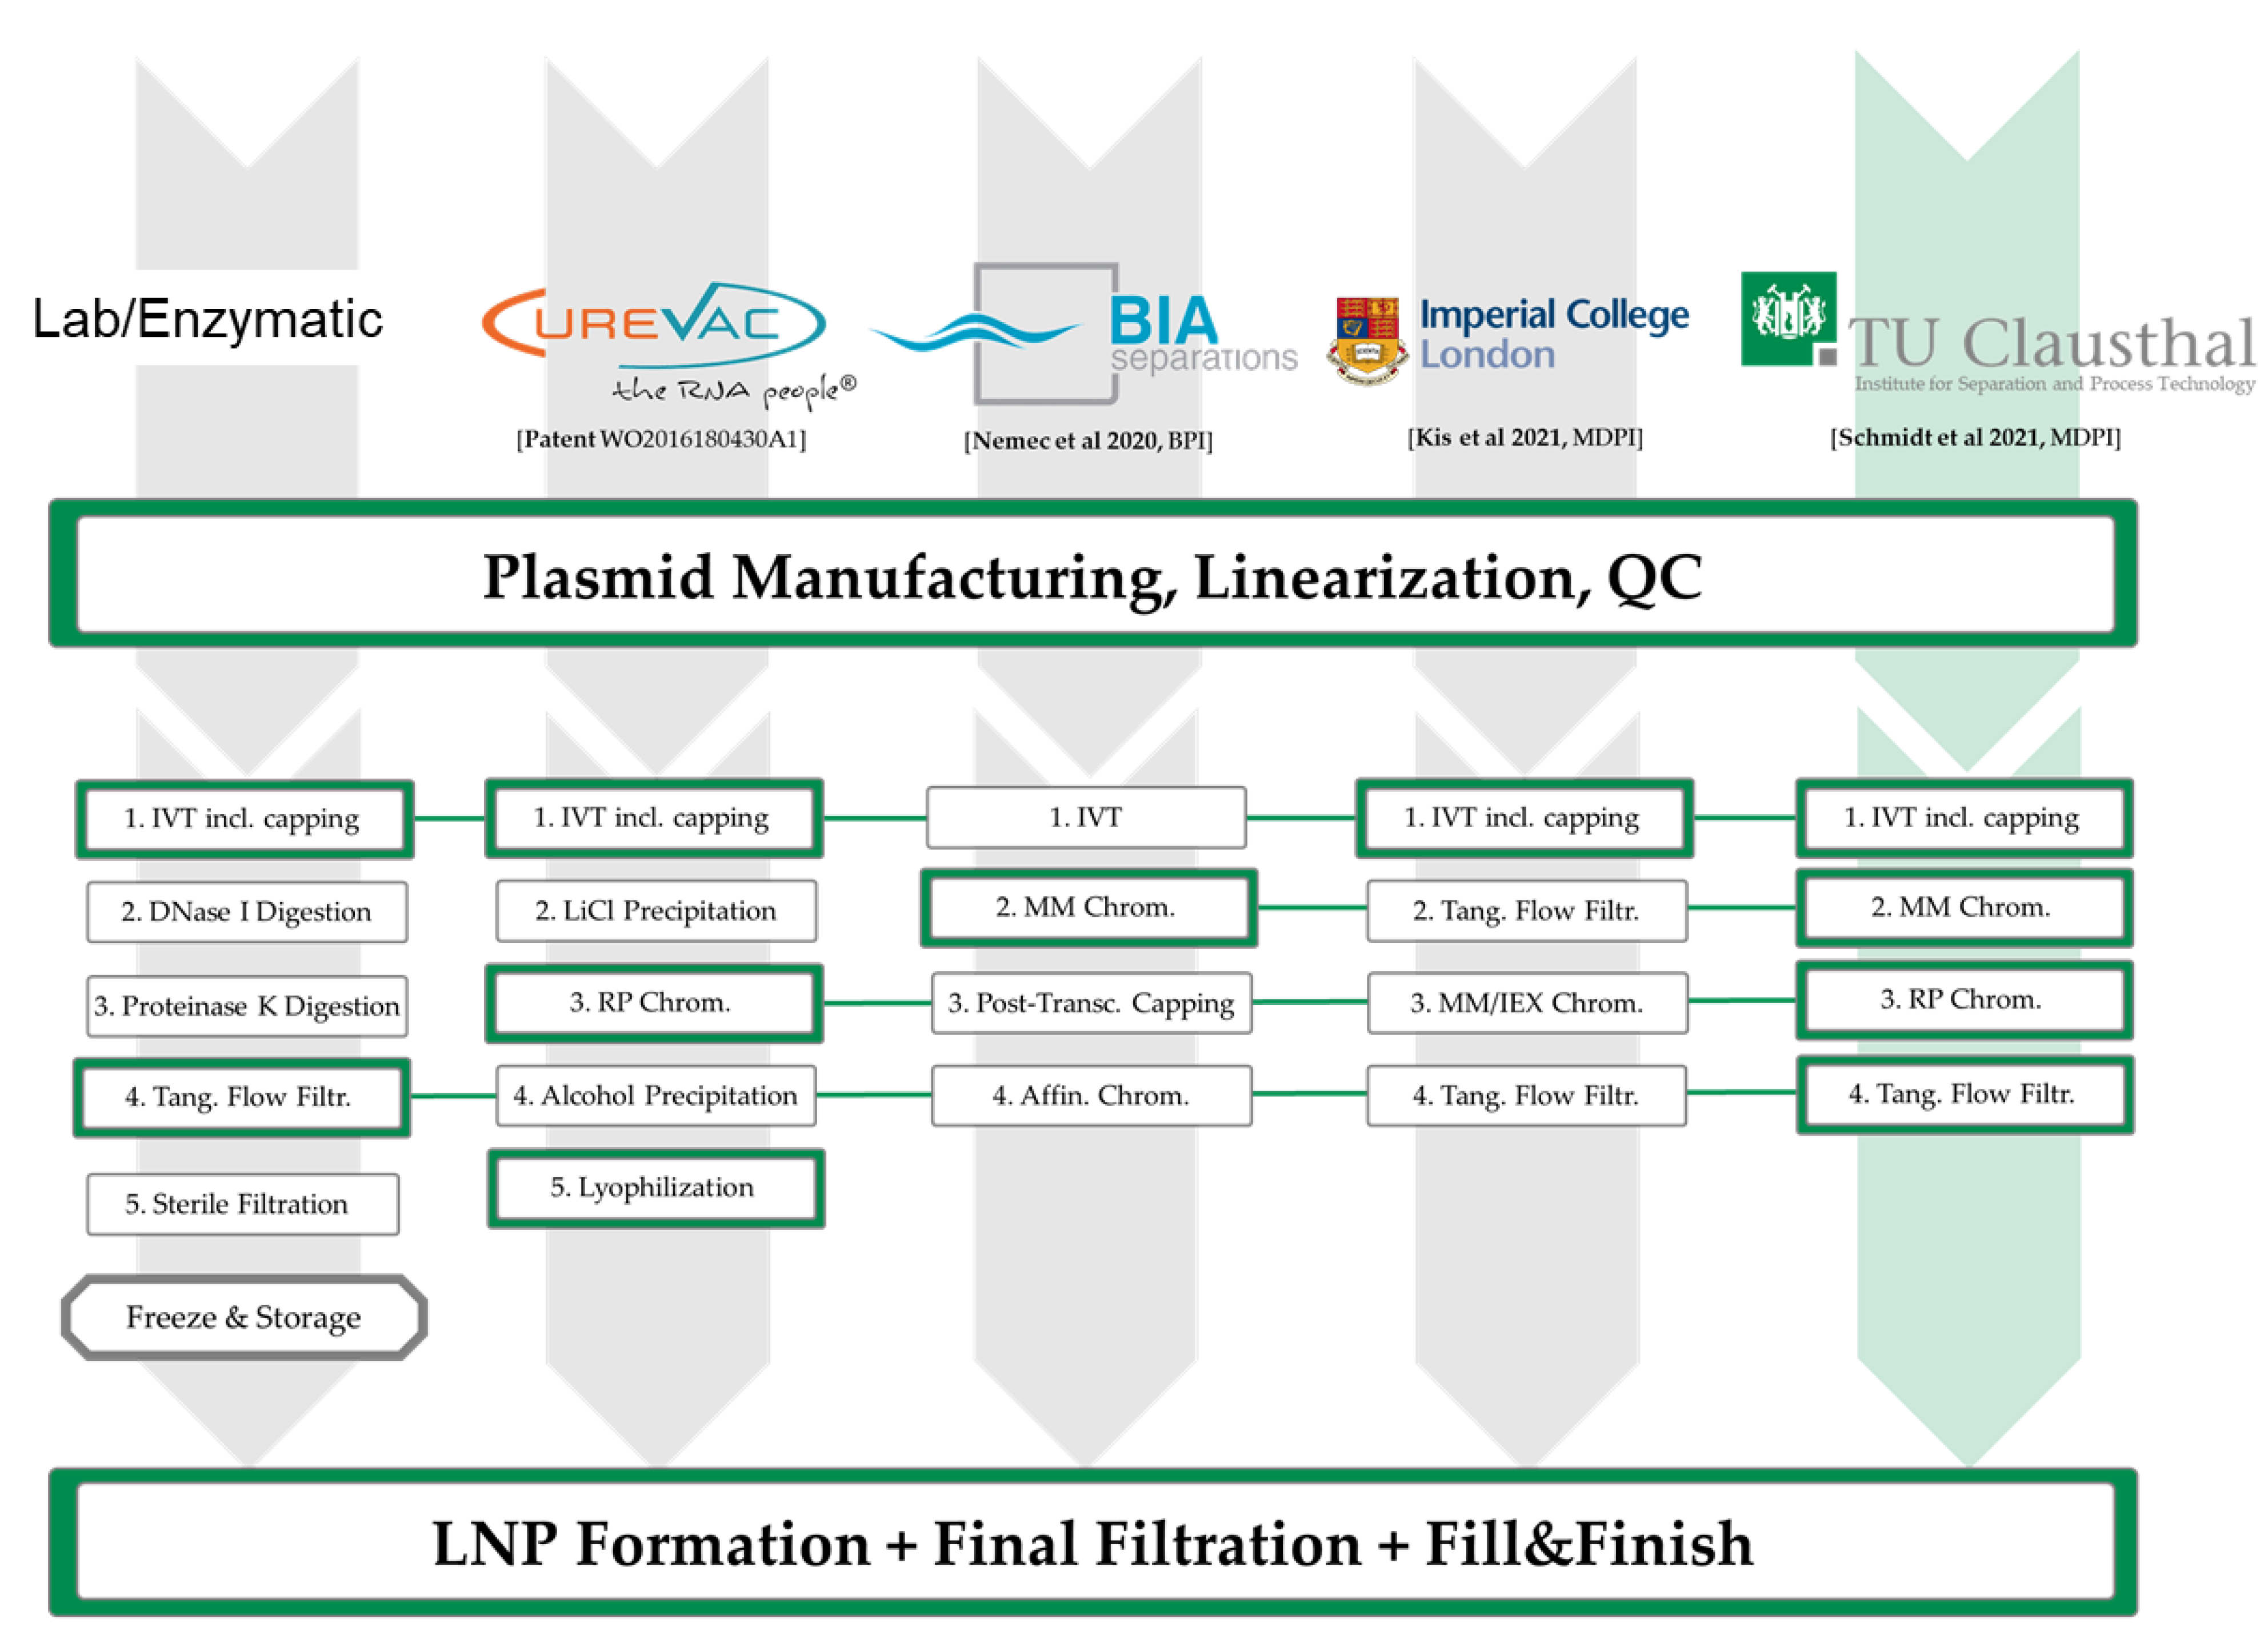
1.1. State-of-the-Art in mRNA Manufacturing
1.2. Quality Assurance, Quality Control and Quality-by-Design (QbD)
1.3. Process-Analytical-Technology (PAT) and Process Control Strategies
2. Materials and Methods
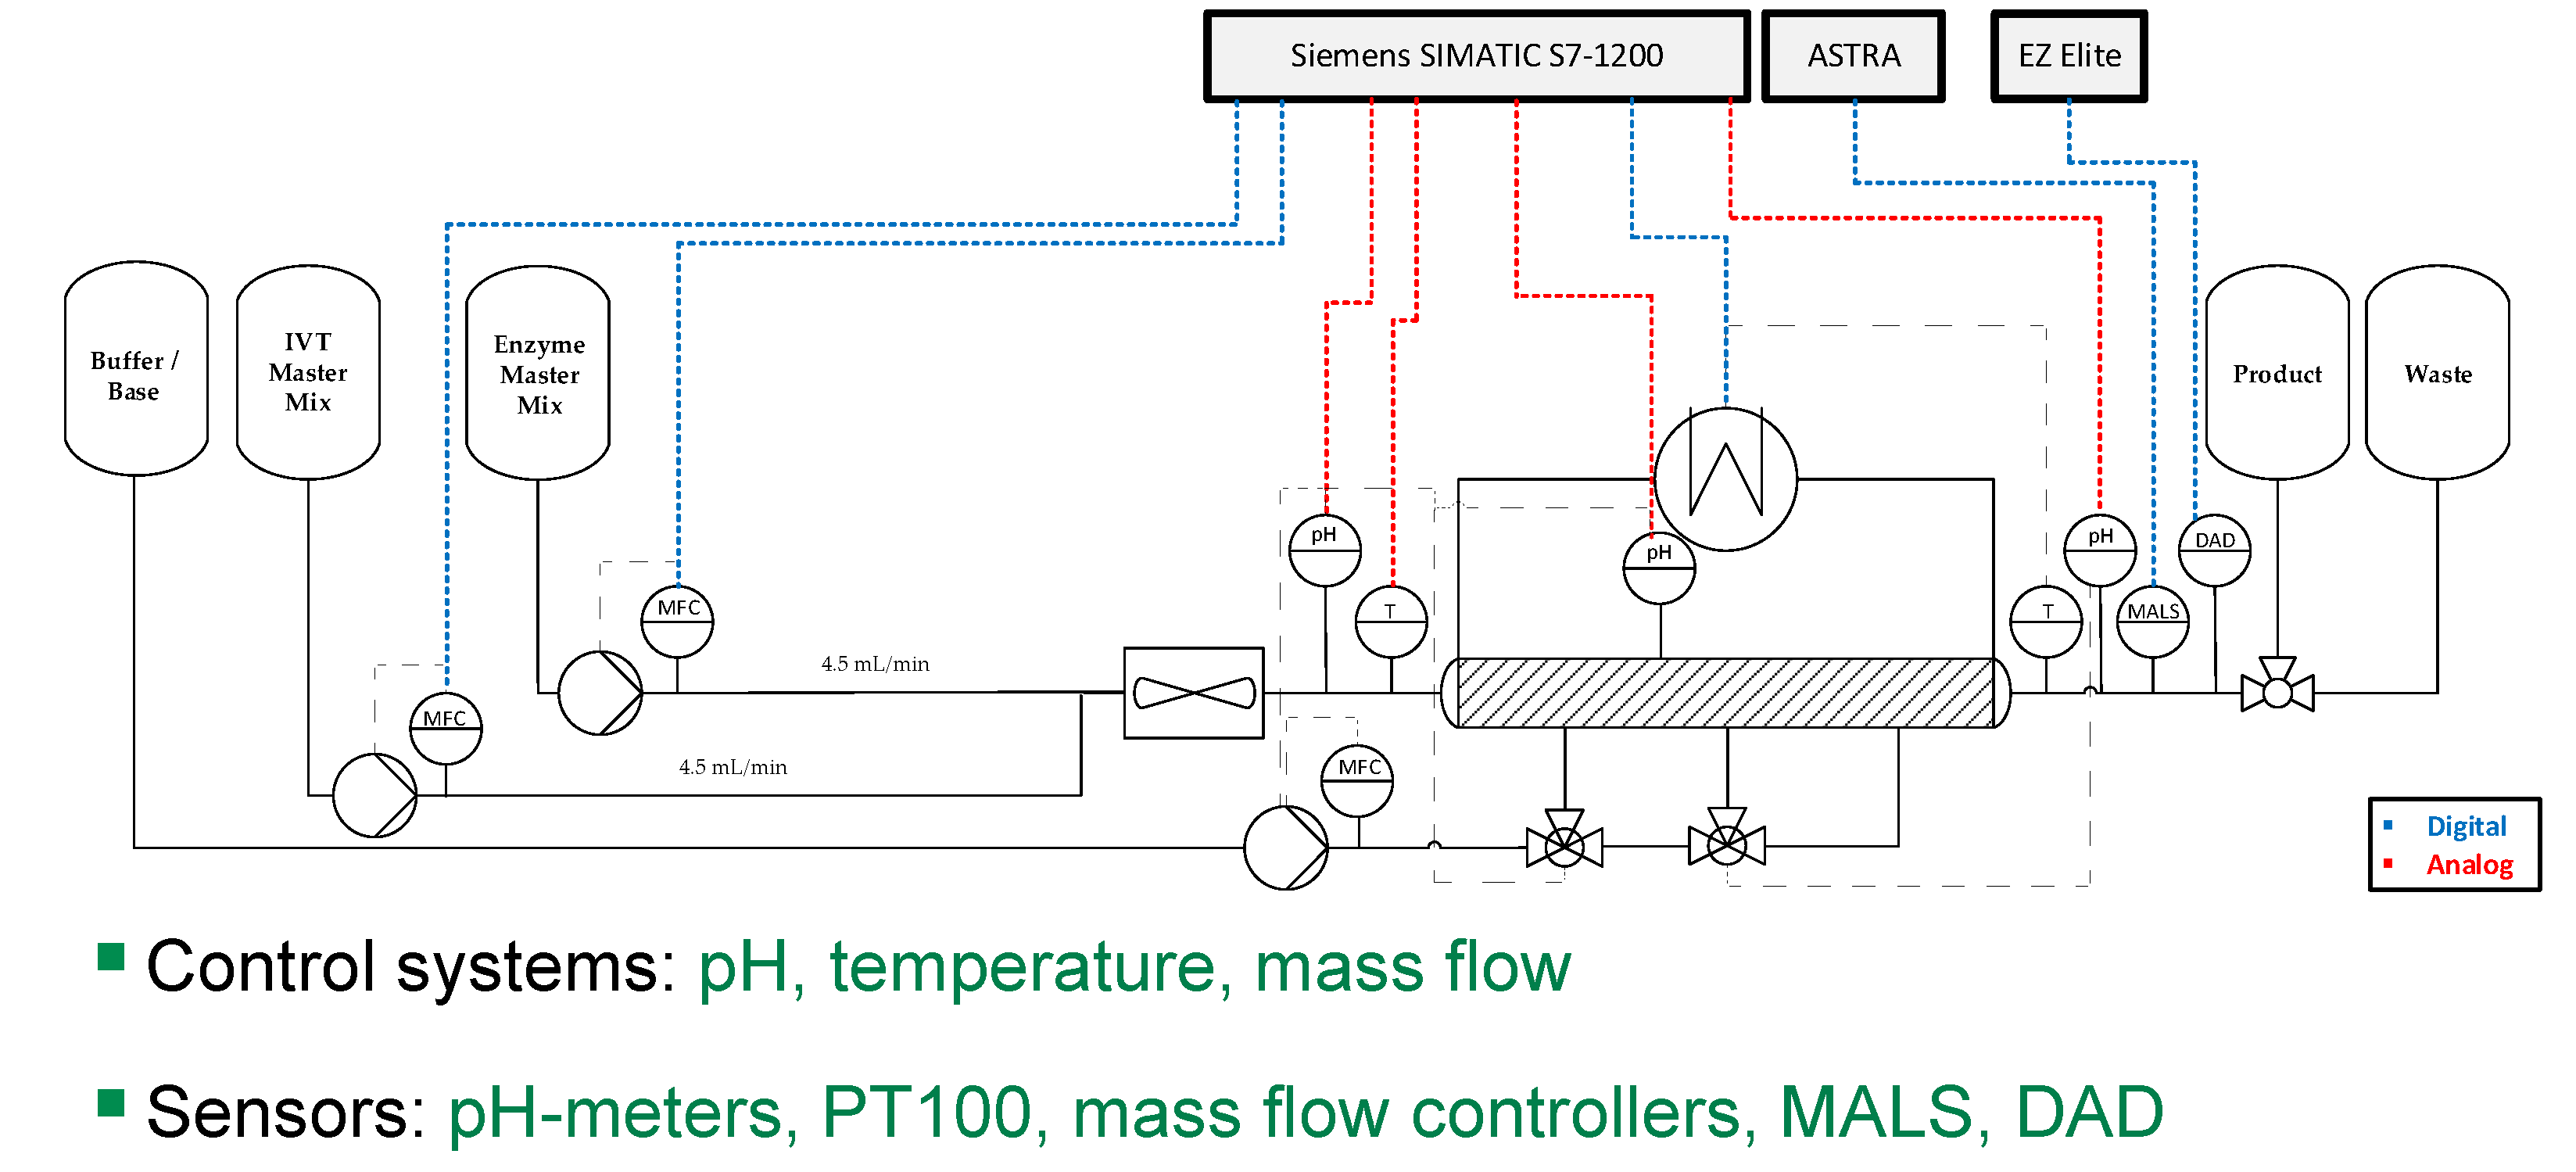
2.1. In Vitro Transcription
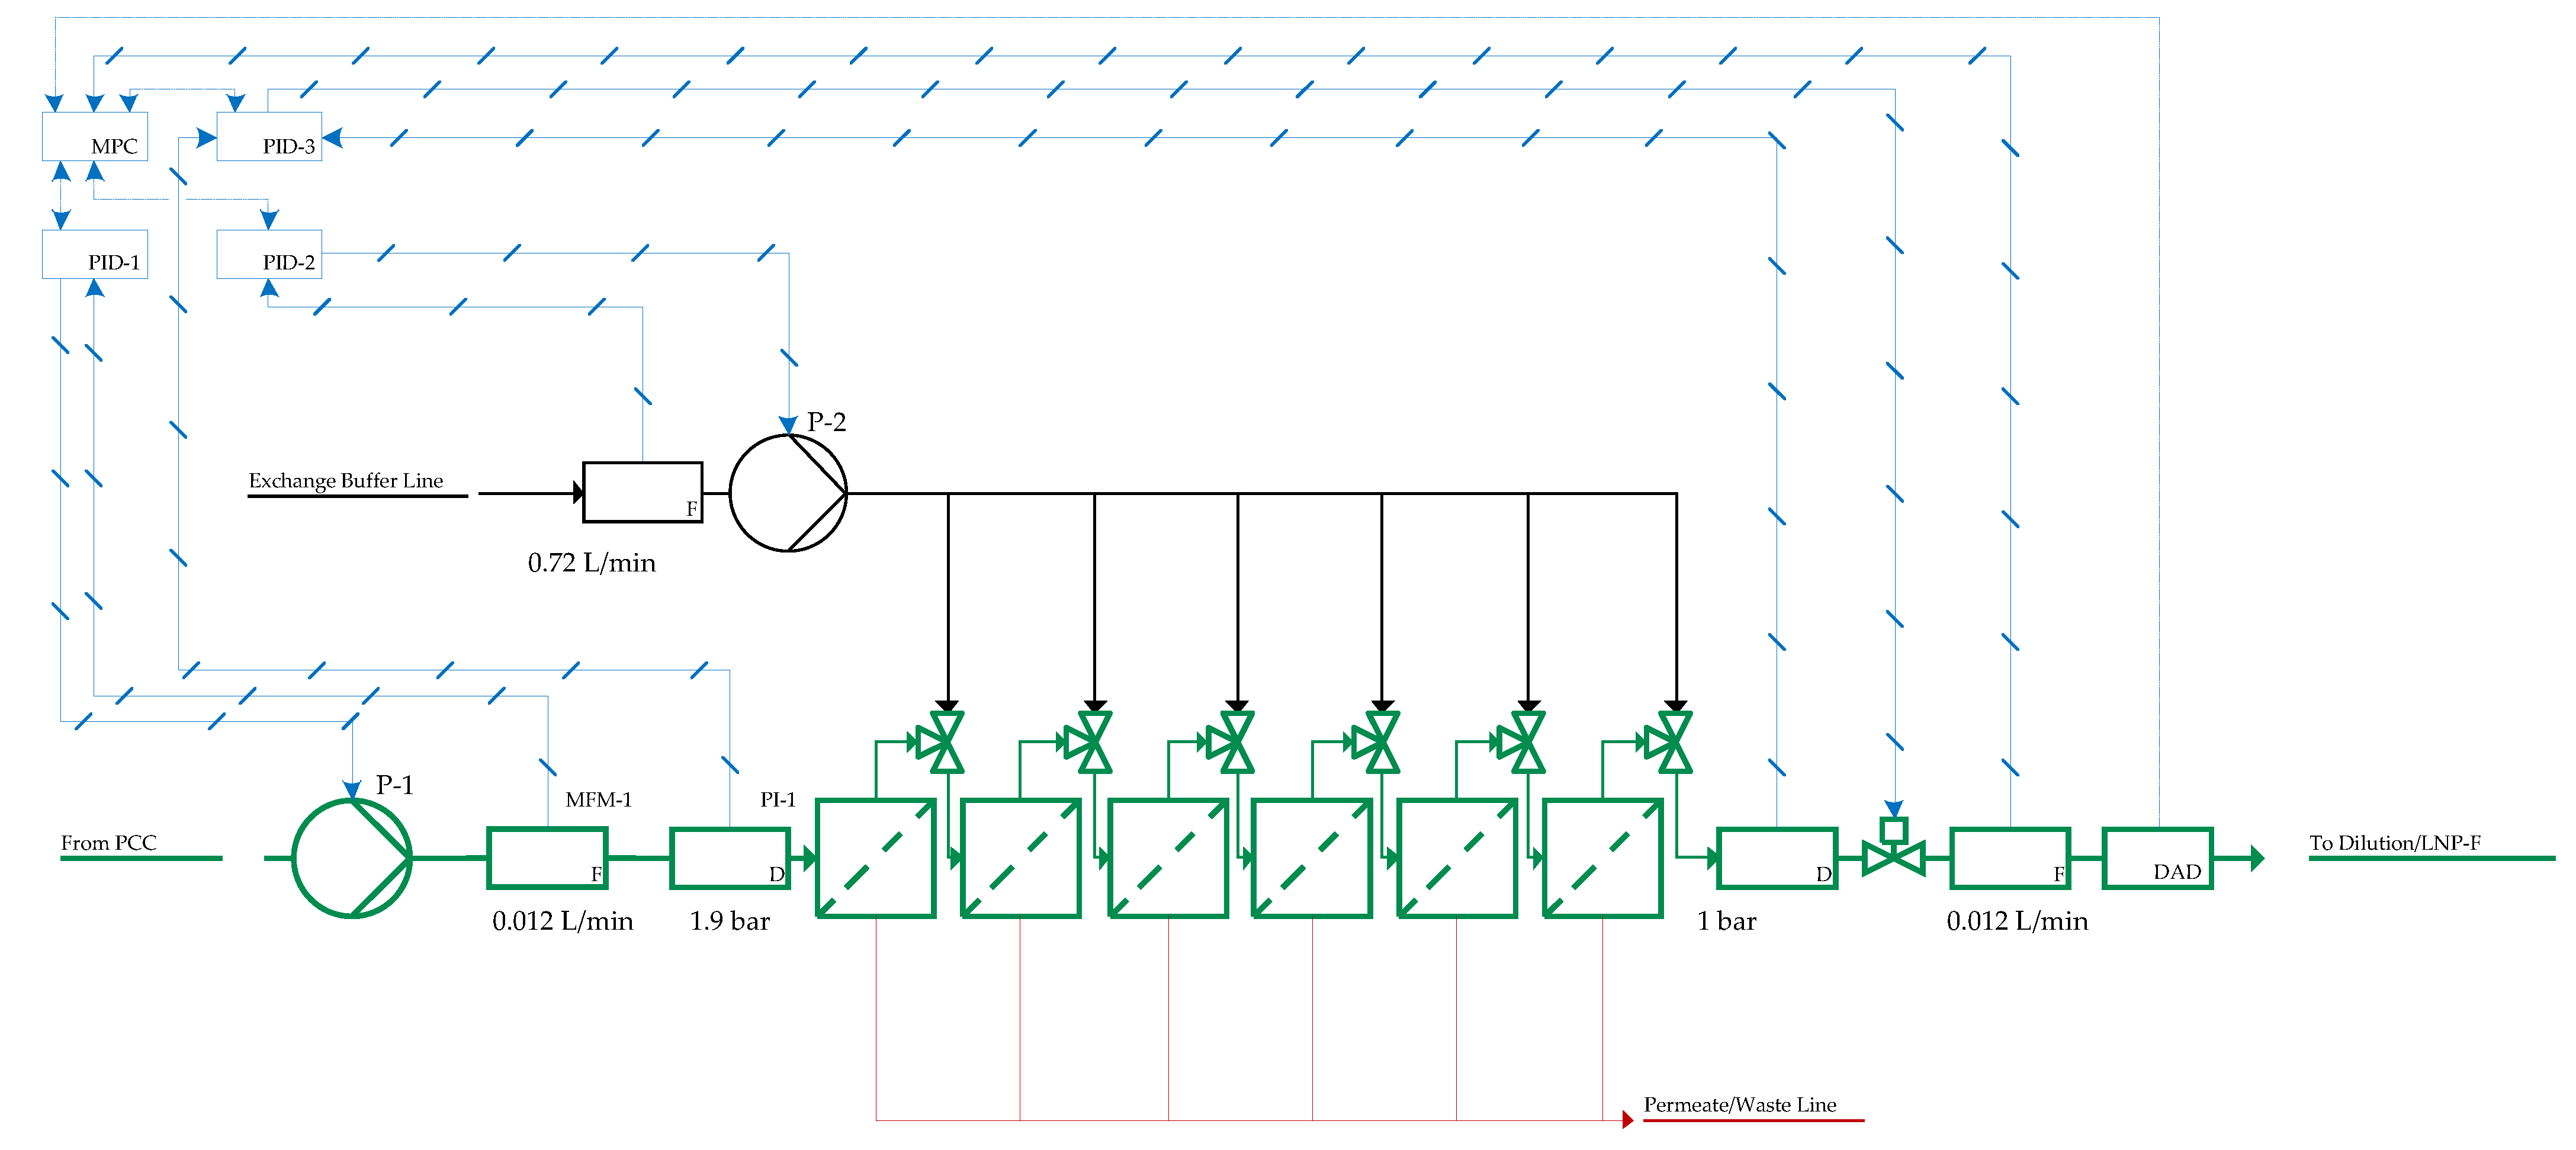
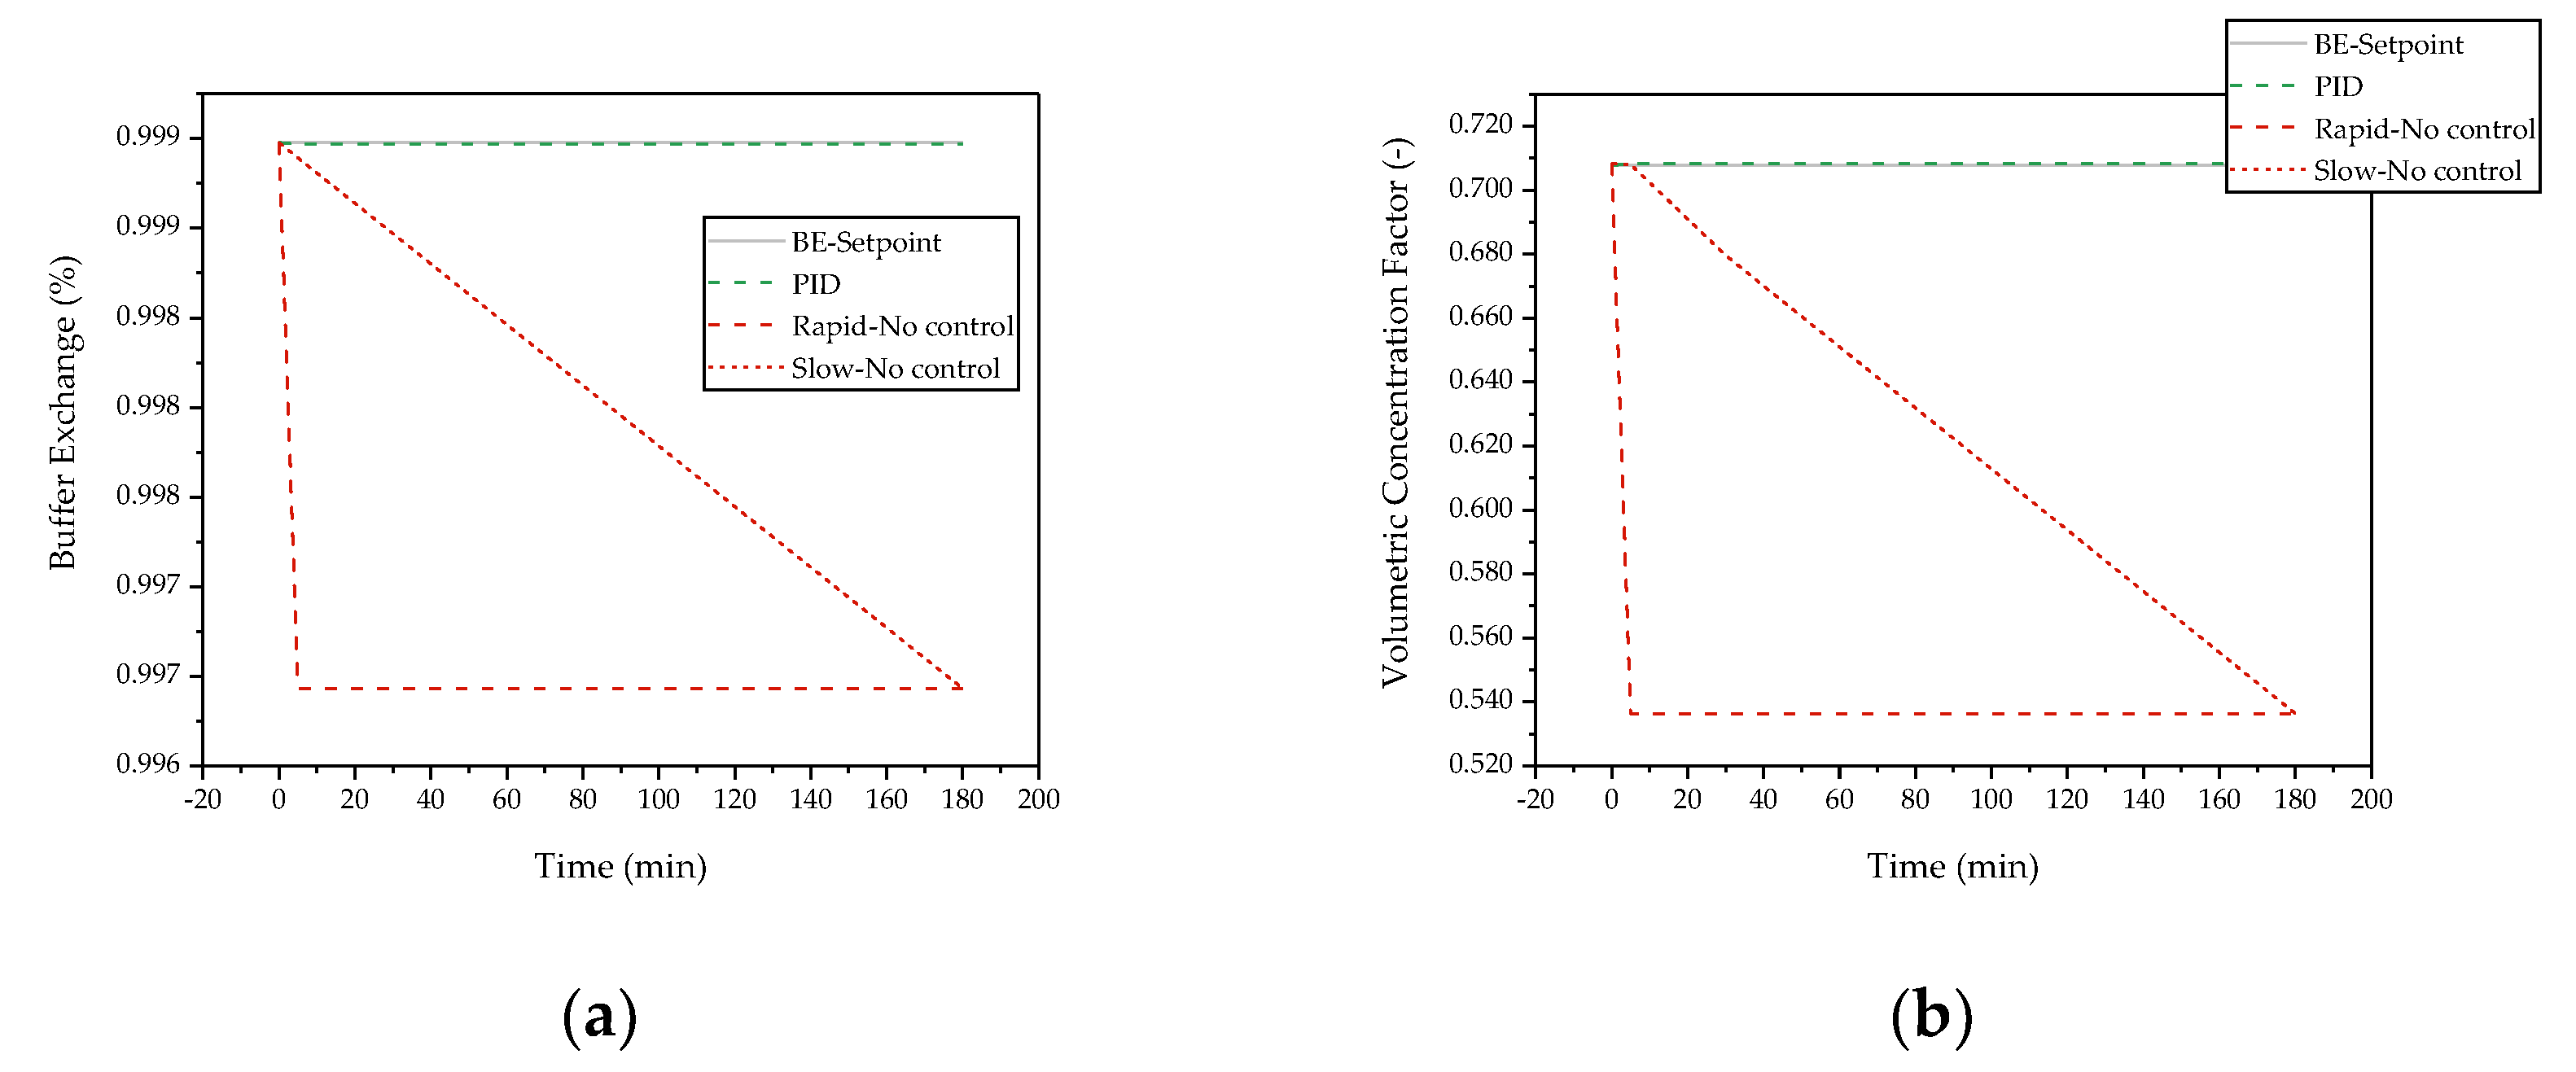
2.2. Single-Pass Tangential Flow Filtration
2.3. Lipid-Nanoparticle Formation
2.4. Impact Assessment and Statistical Analysis
- Identification of parameters for OFAT studies in Ishikawa analysis;
- Main effect ranking based on impact attributes after OFAT studies and assessment of possible impact of interaction;
- Calculation of severity scores and execution of derived statistical experimental designs;
- Analysis of study results to quantify parameter effect strength, identify CPP, KPP (key process parameter), and process optima as well as to define design space, control space, and PAR (proven acceptable range).
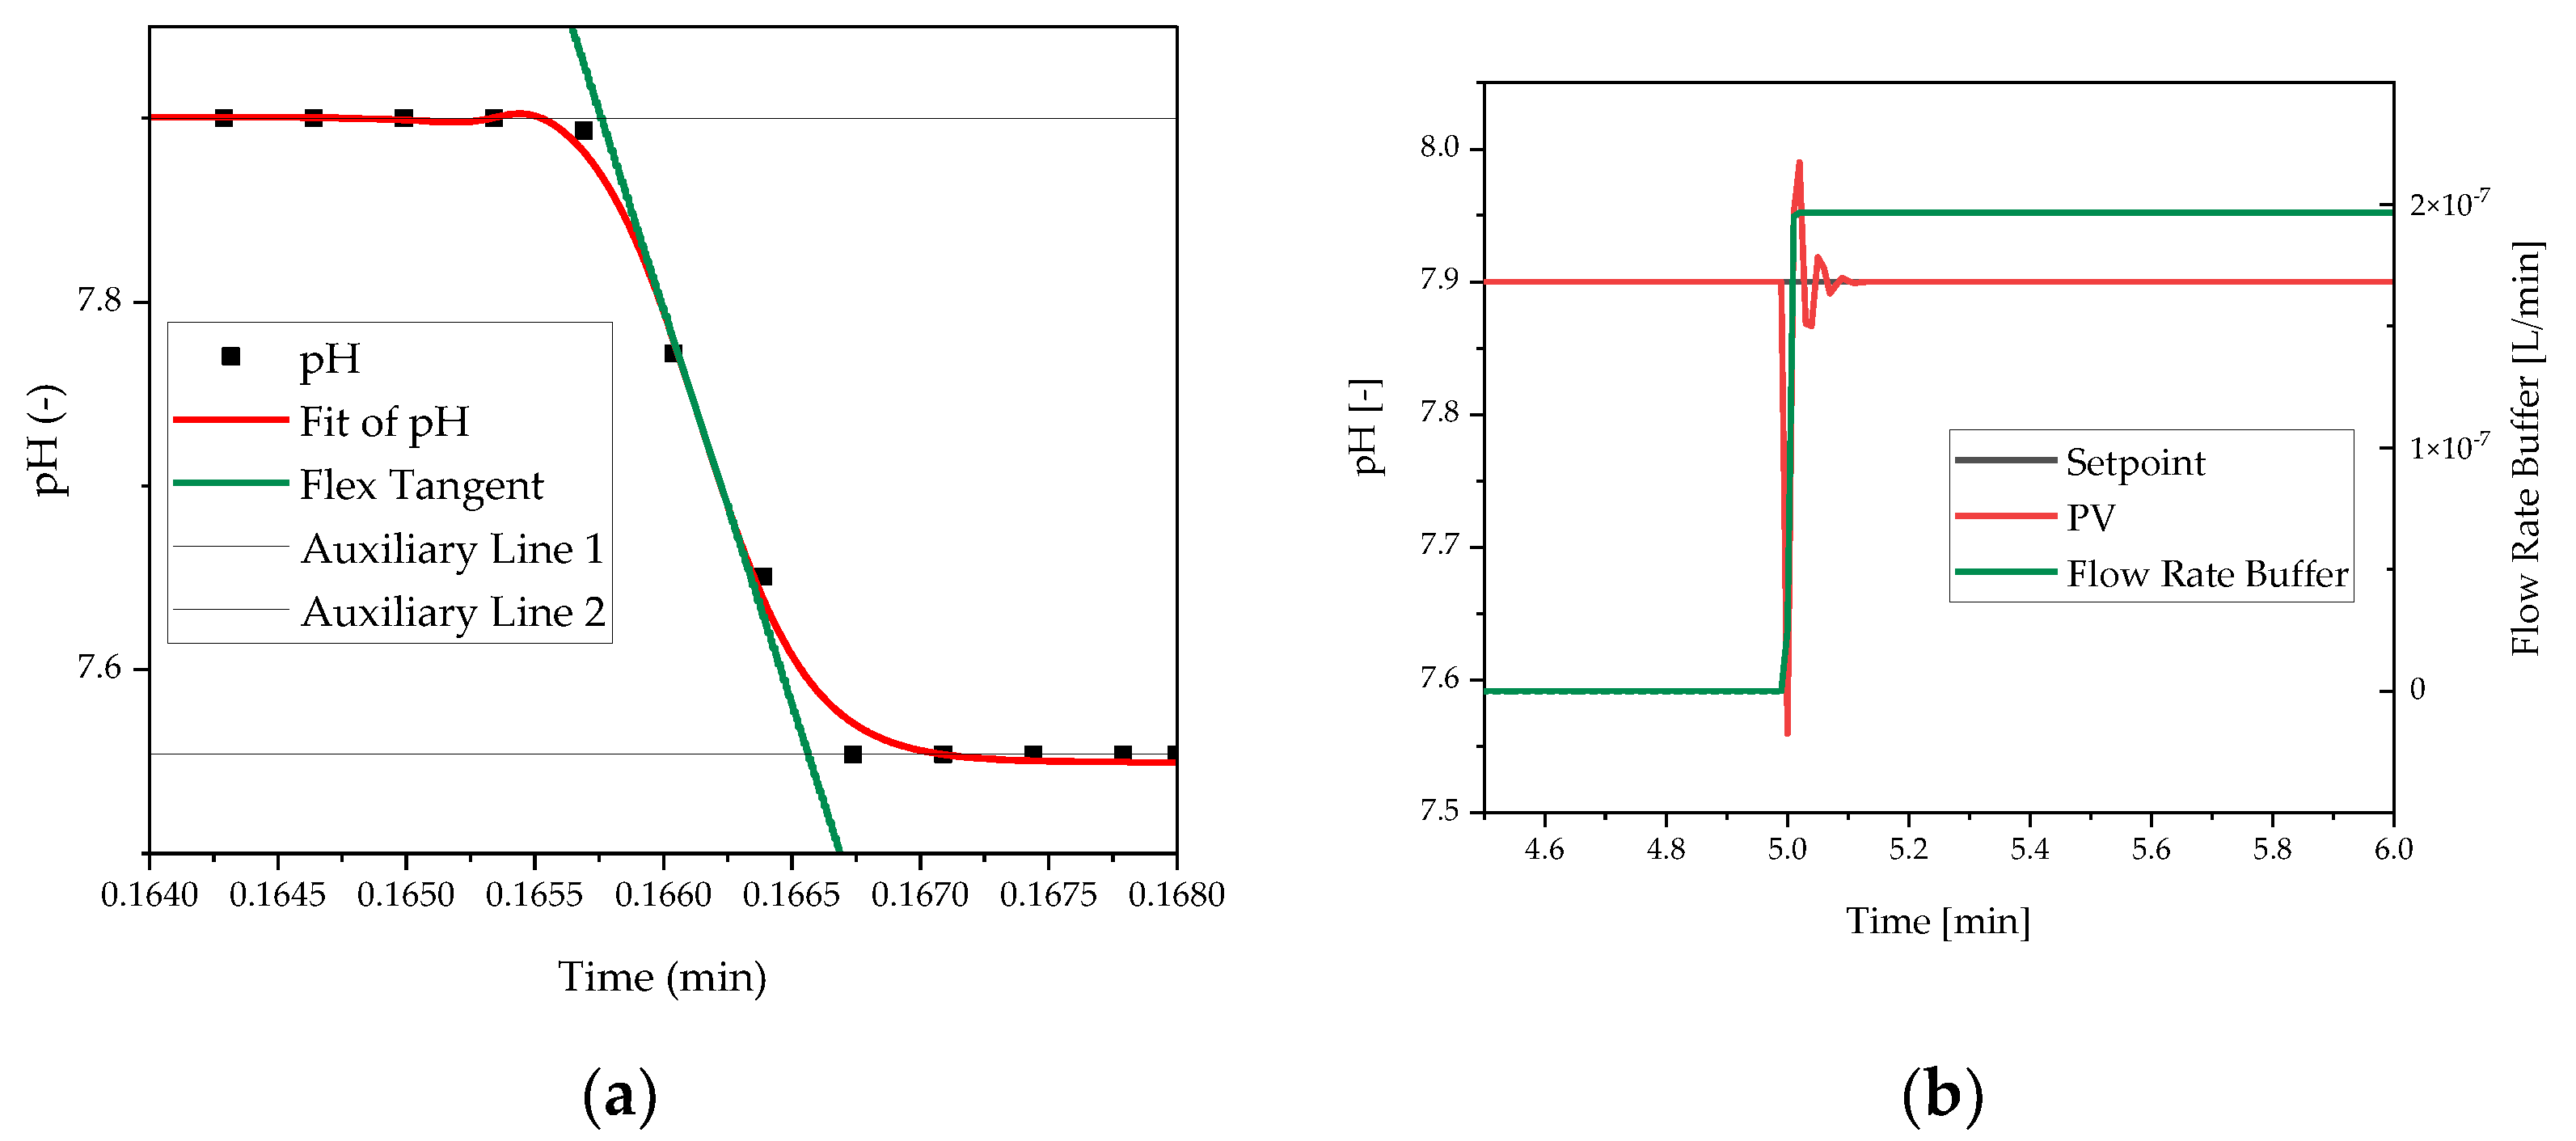
2.5. Process Control Parameter Determination
3. Results
3.1. Risk Assessment and Impact Ranking
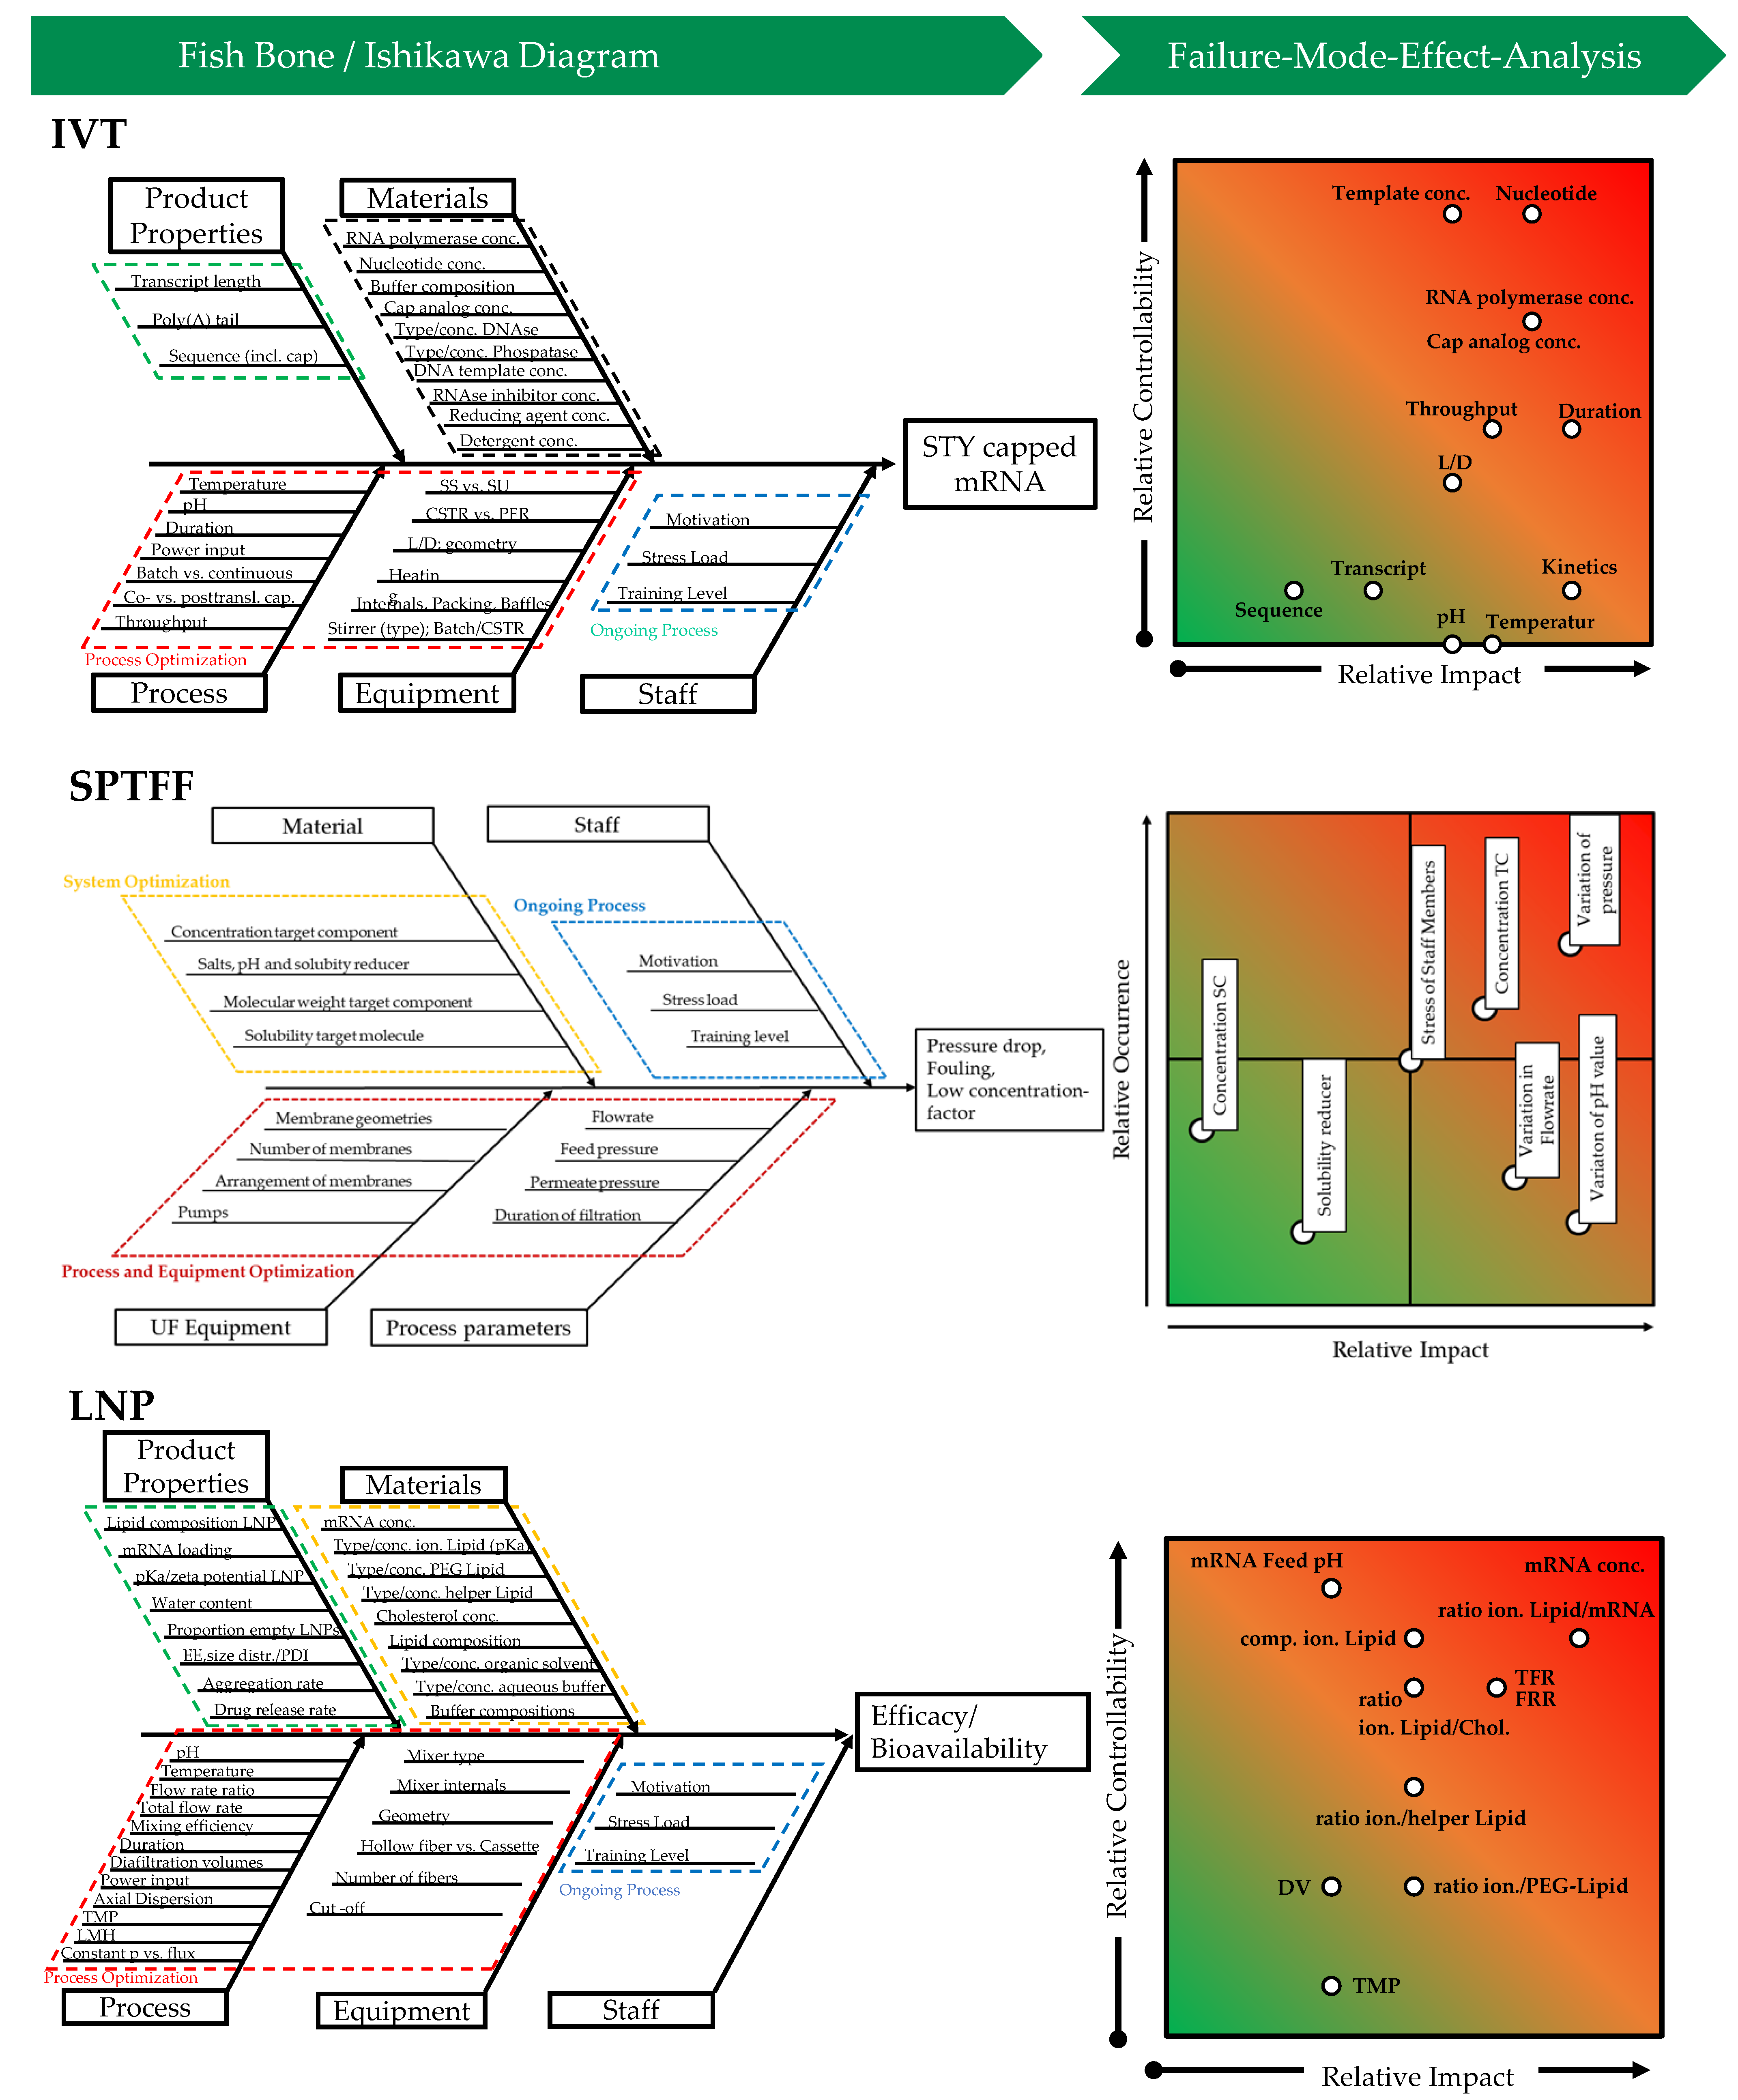
3.1.1. Ishikawa Analysis
- In Vitro Transcription
- Inline Diafiltration by SPTFF
- LNP Formation
3.1.2. One-Factor-A-Time Studies and Impact Ranking
- In Vitro Transcription
- Inline Diafiltration by SPTFF
- LNP Formation
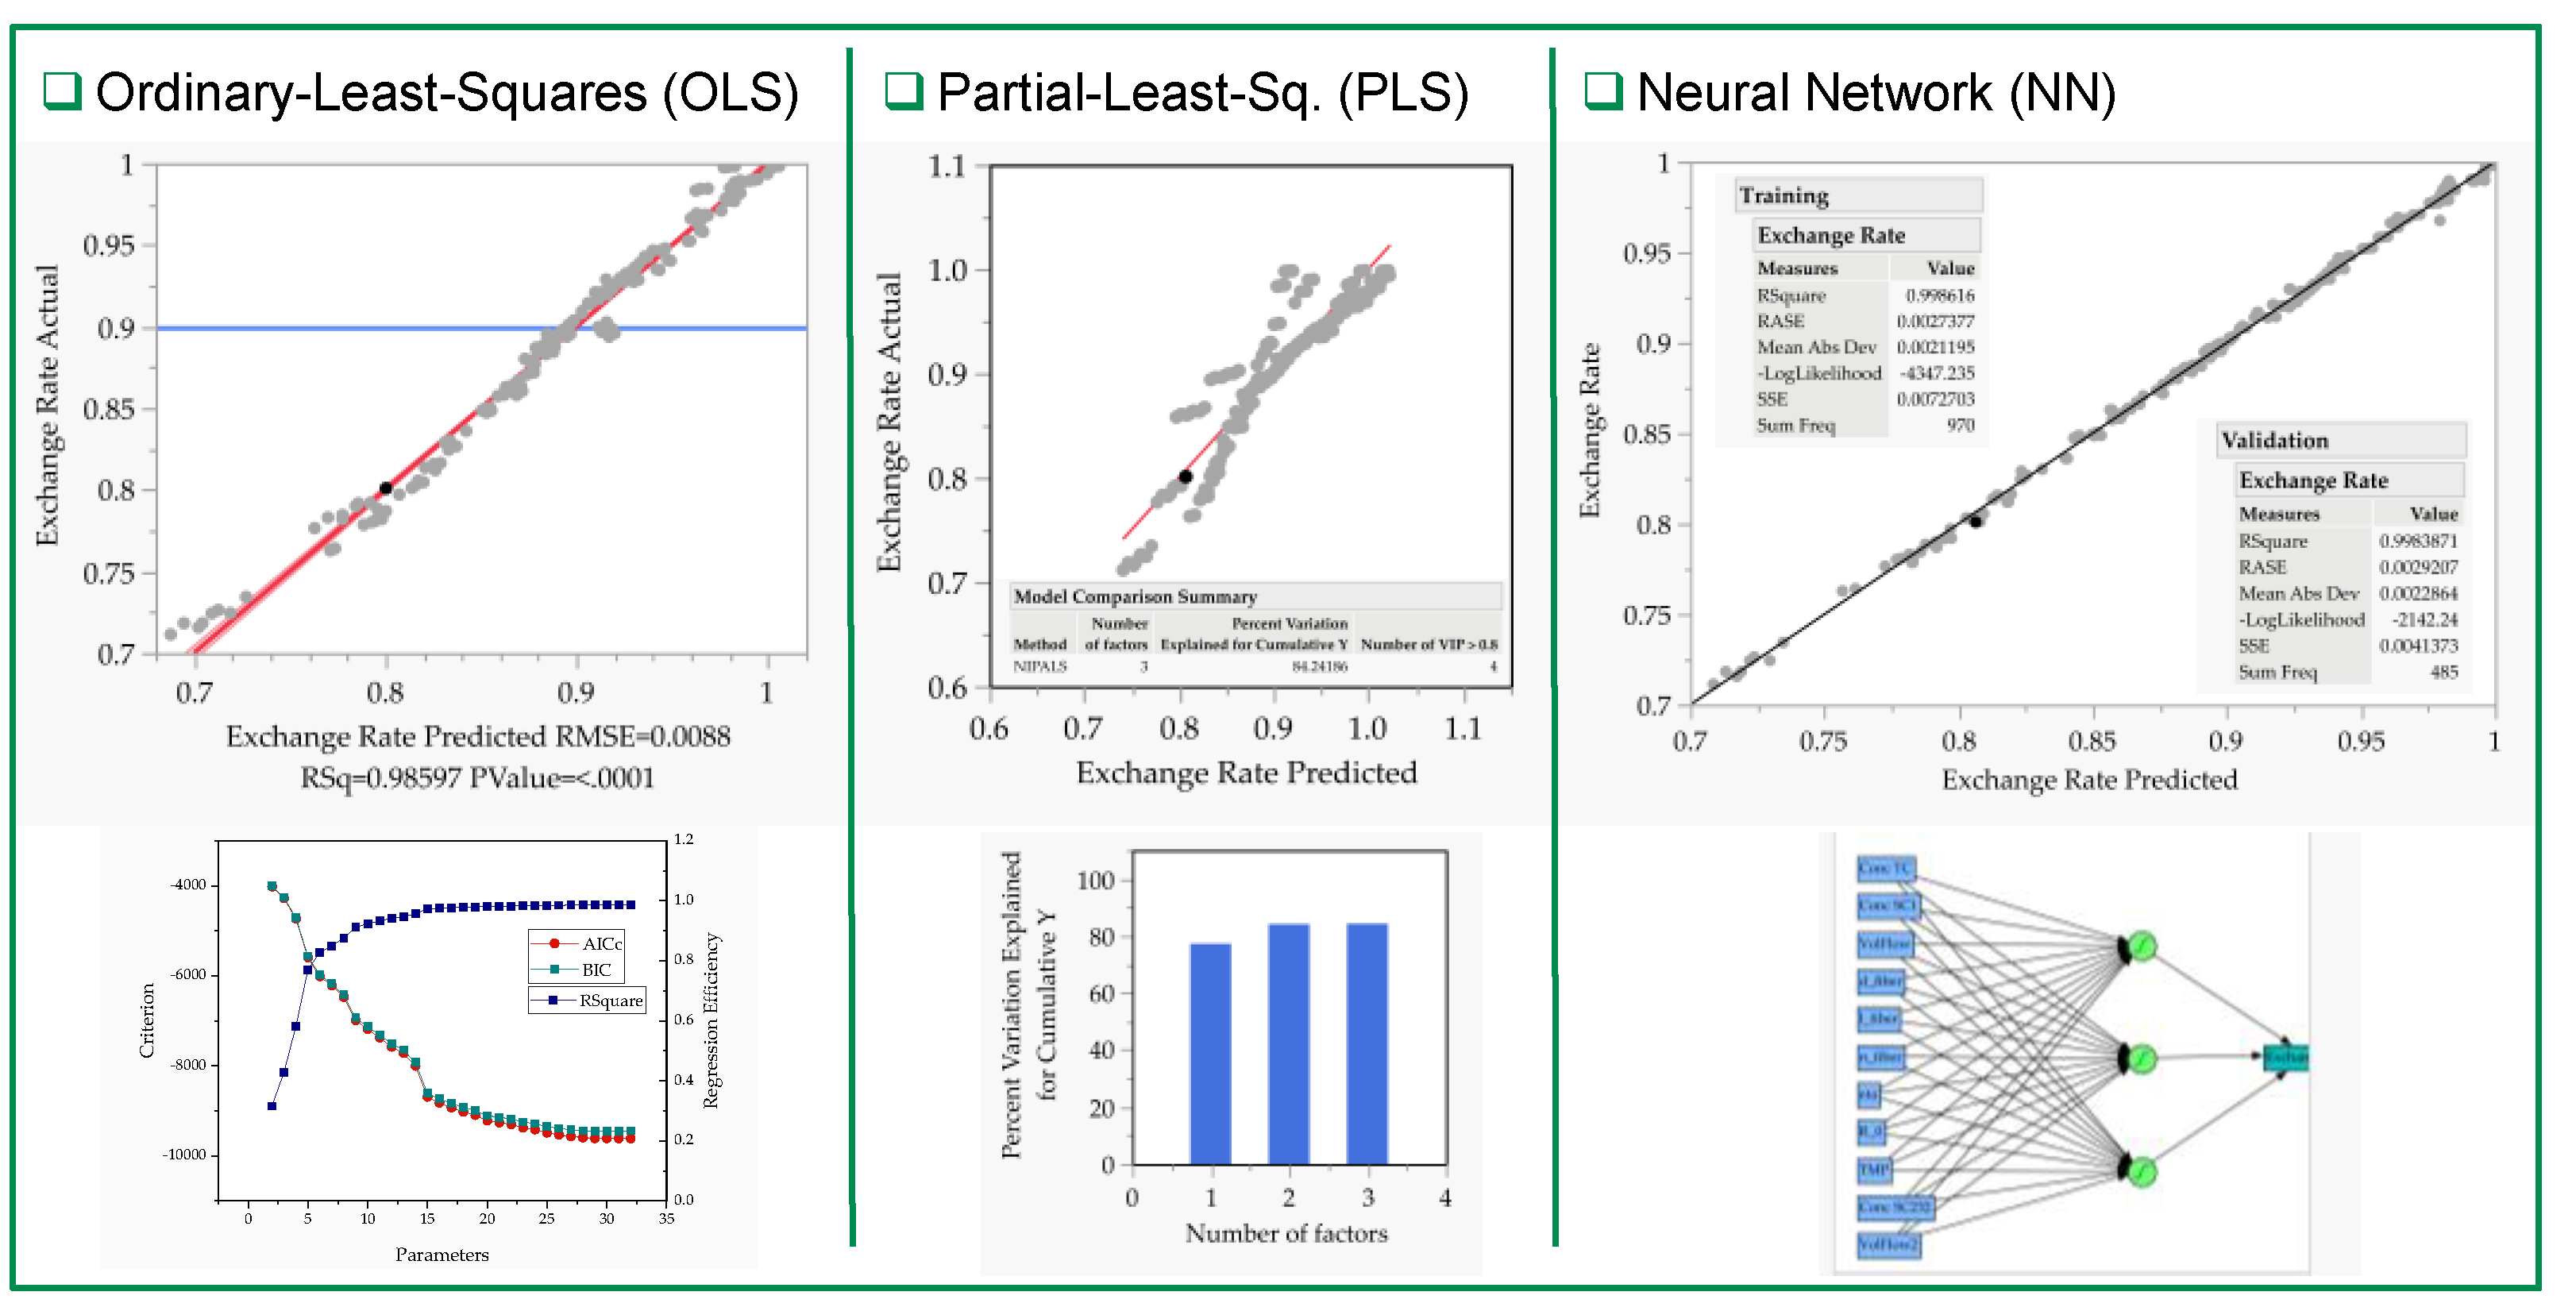
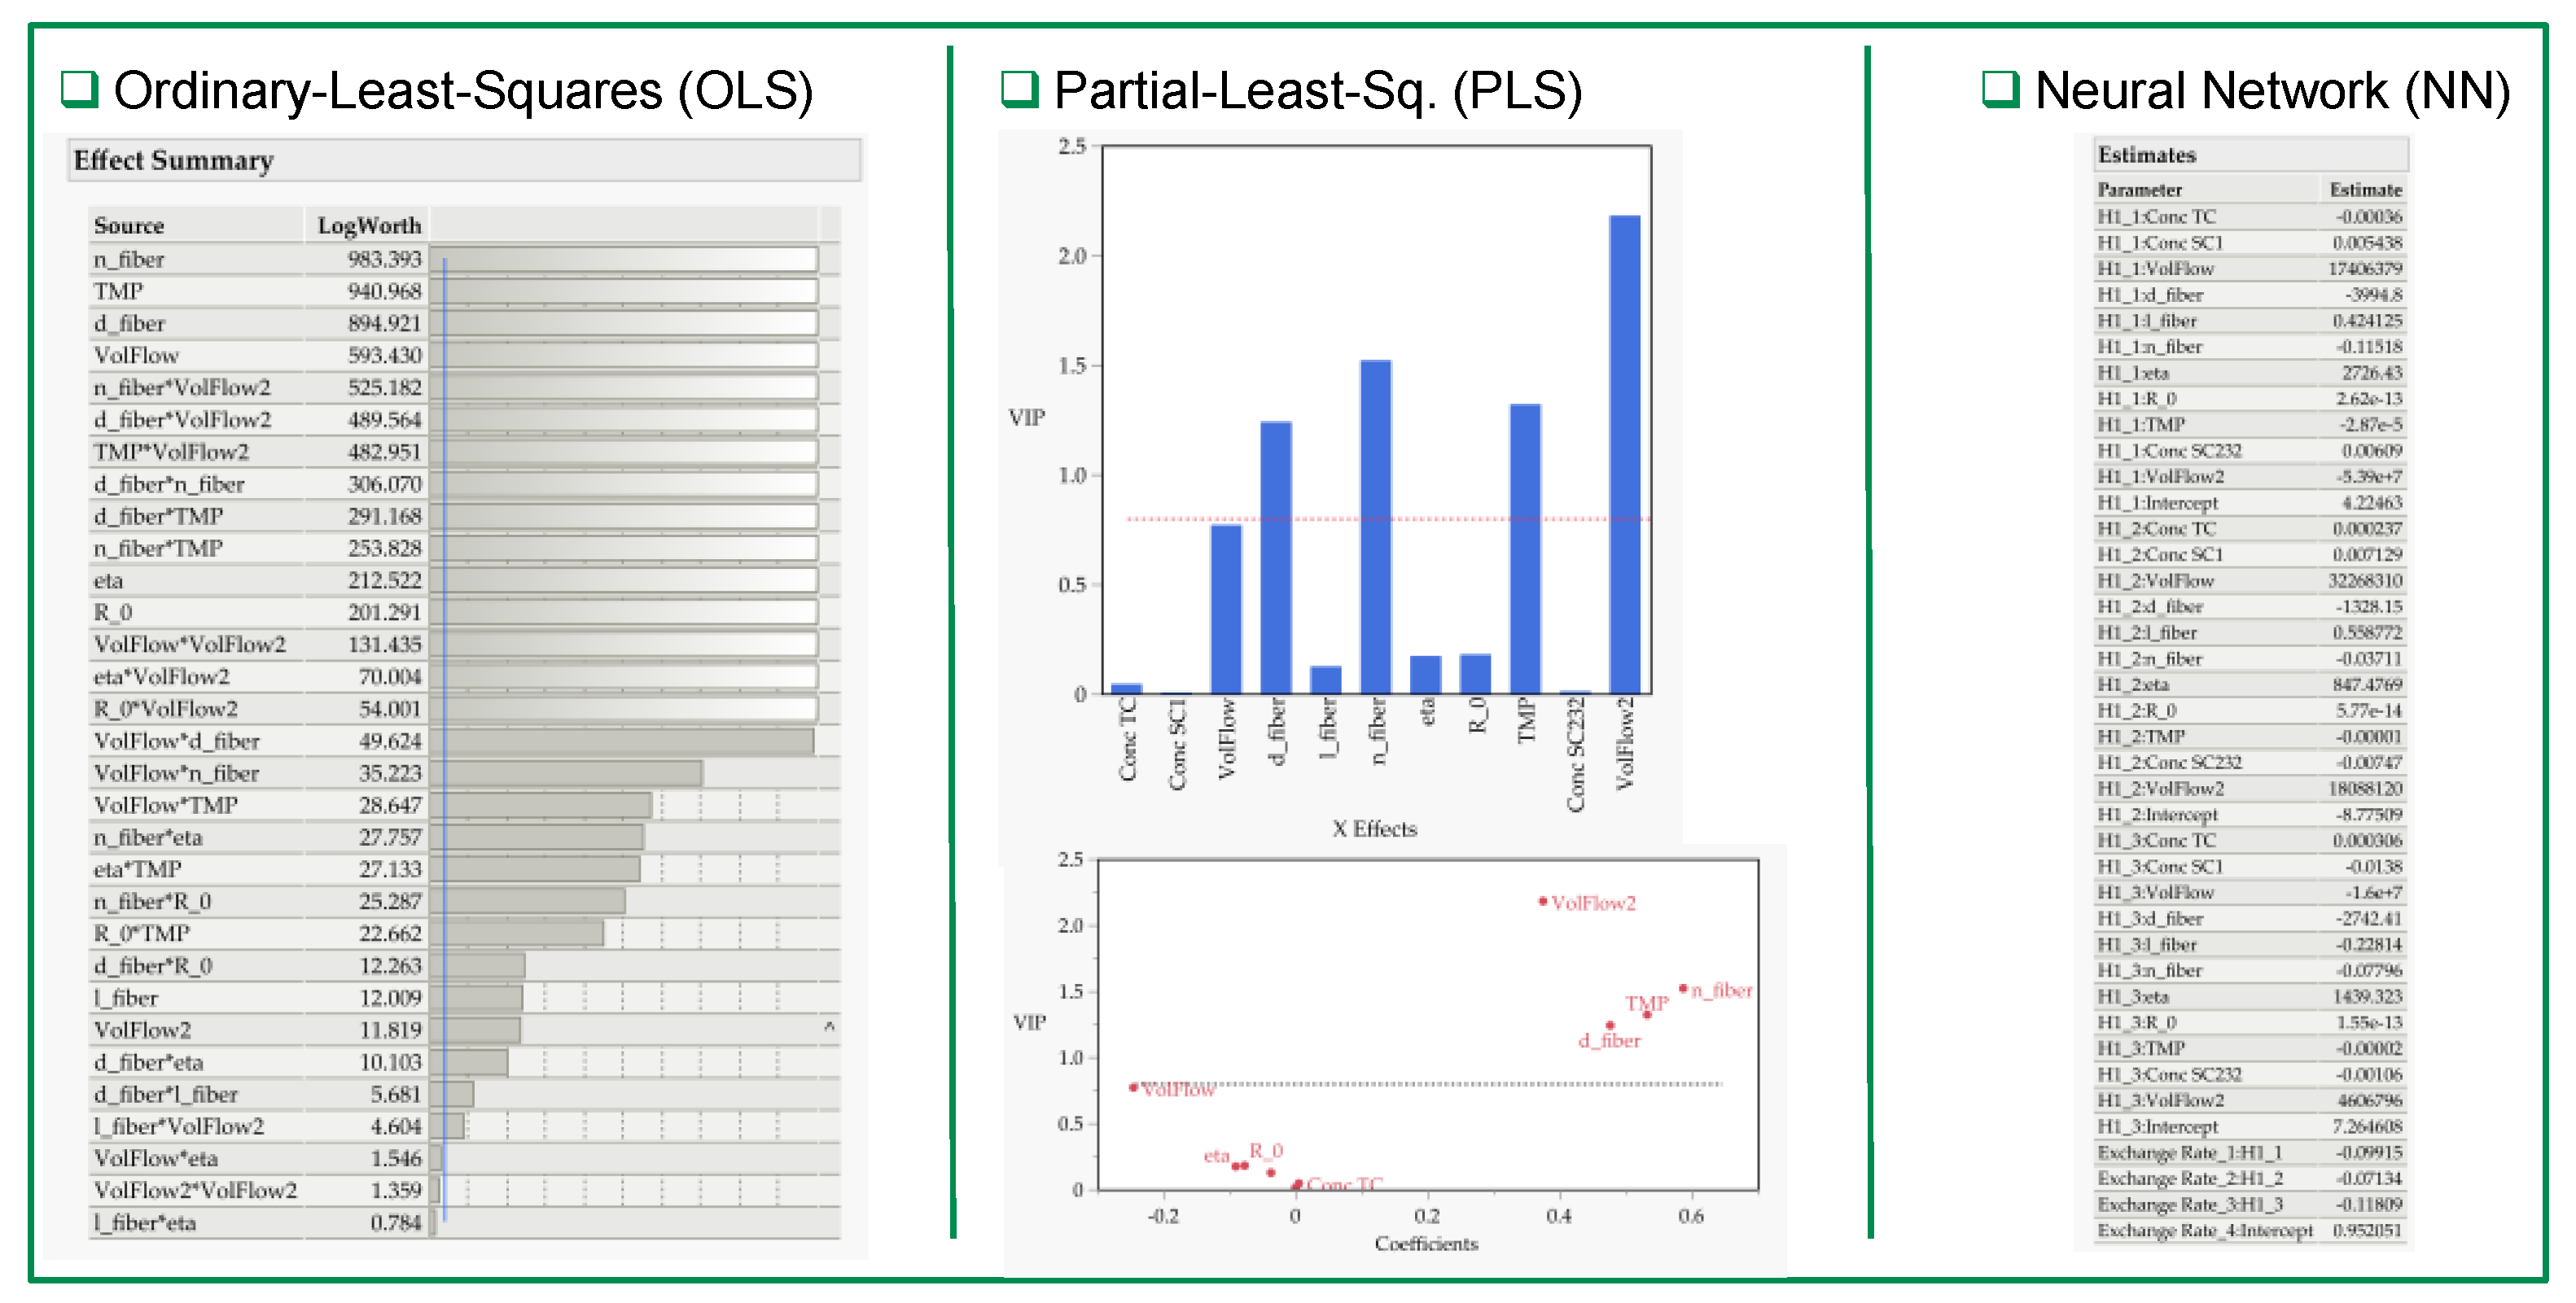
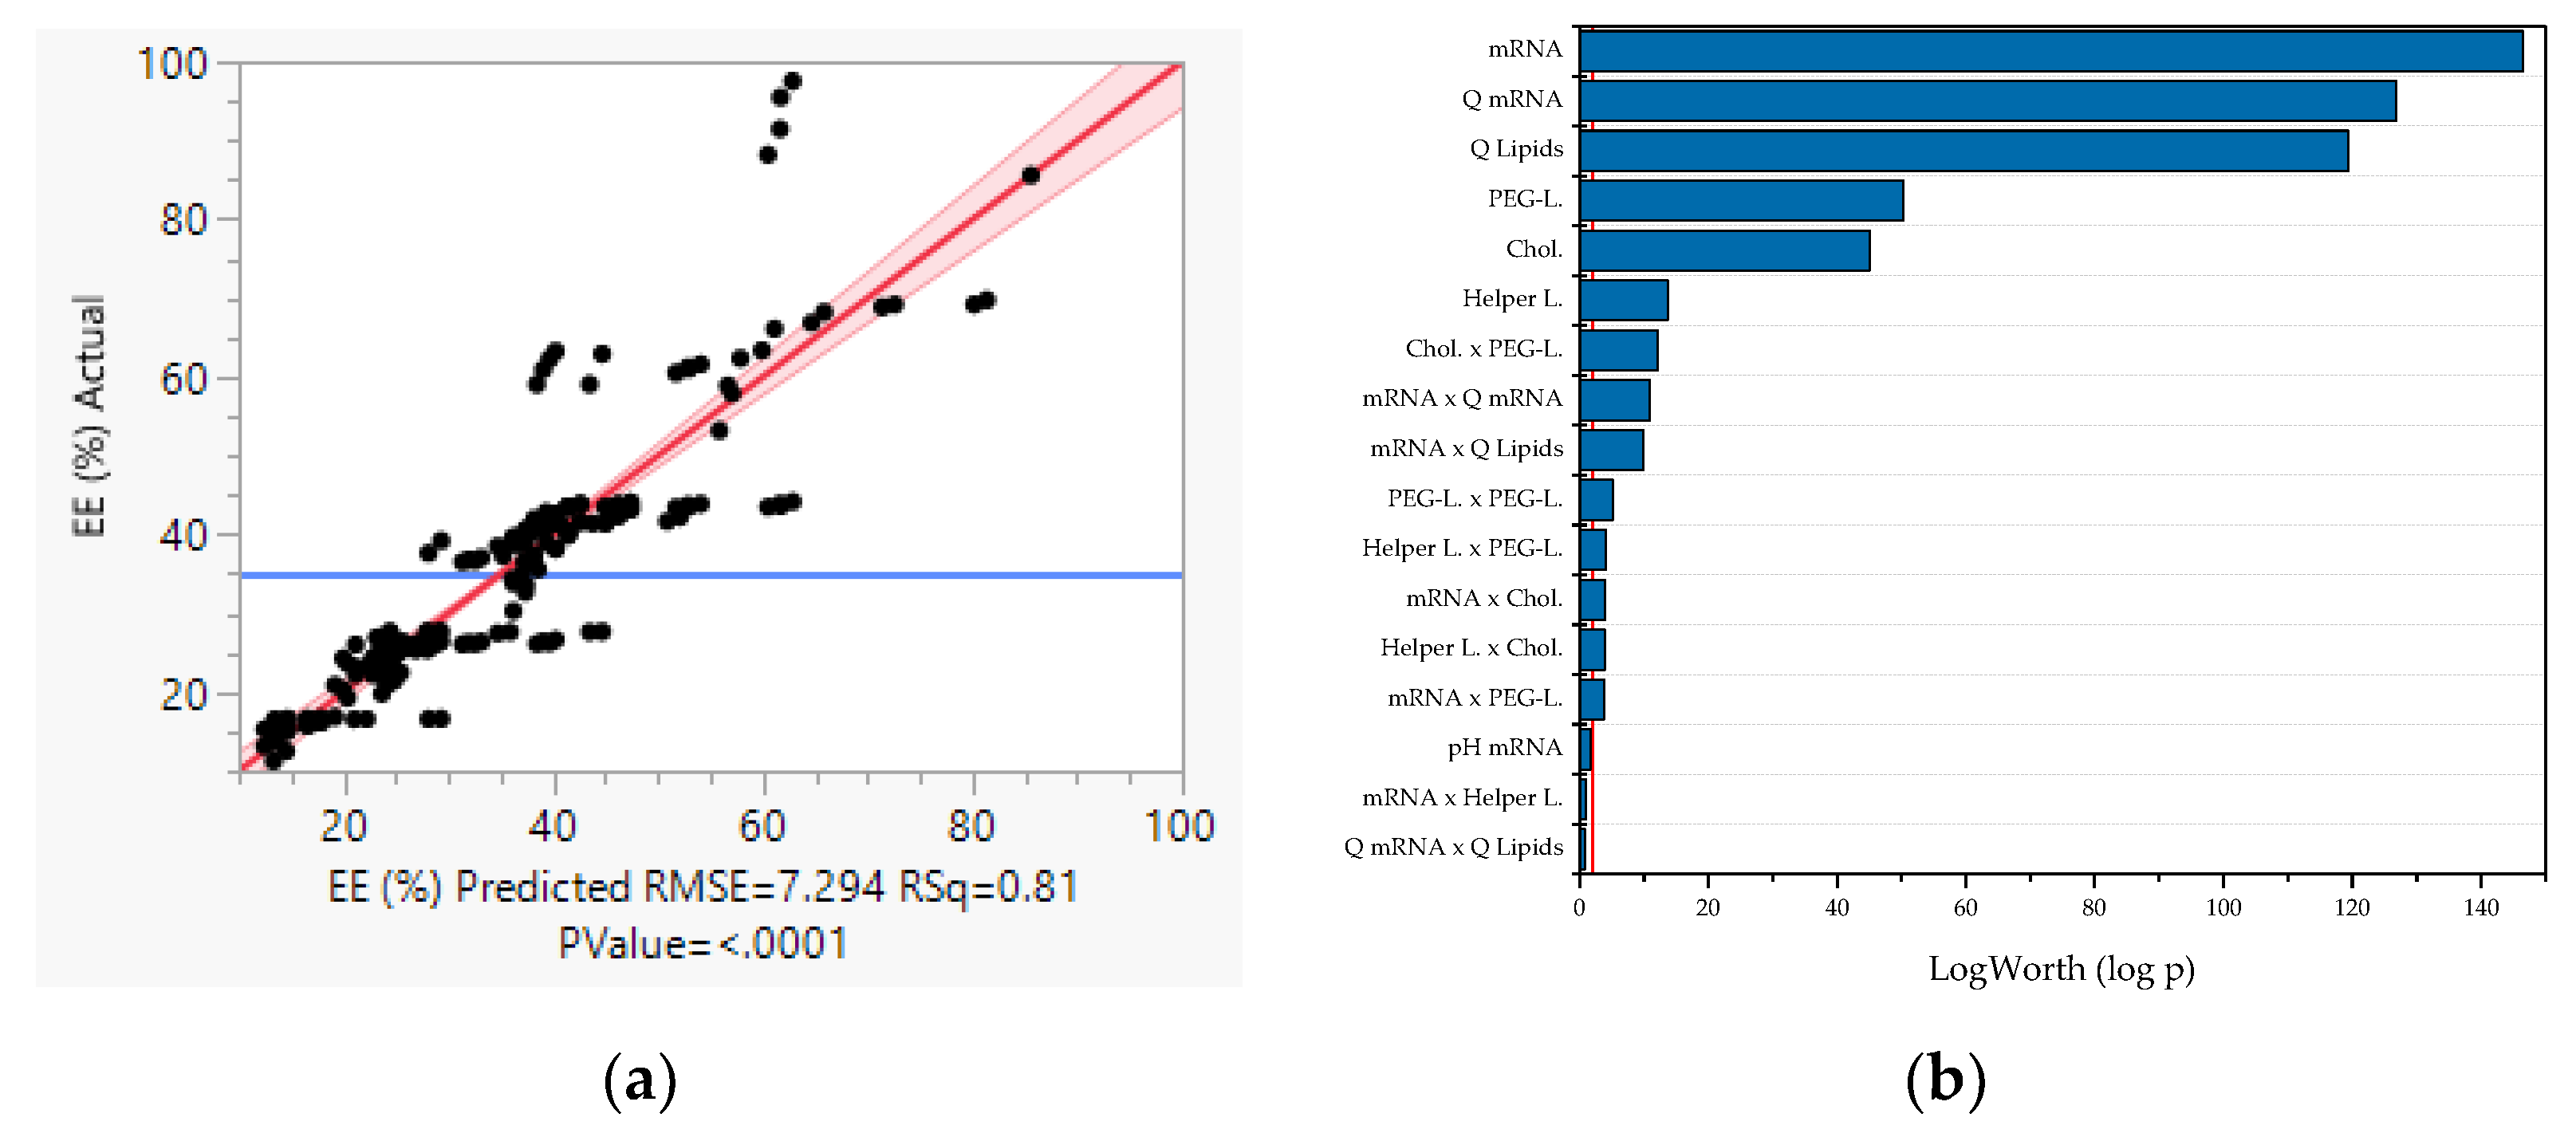
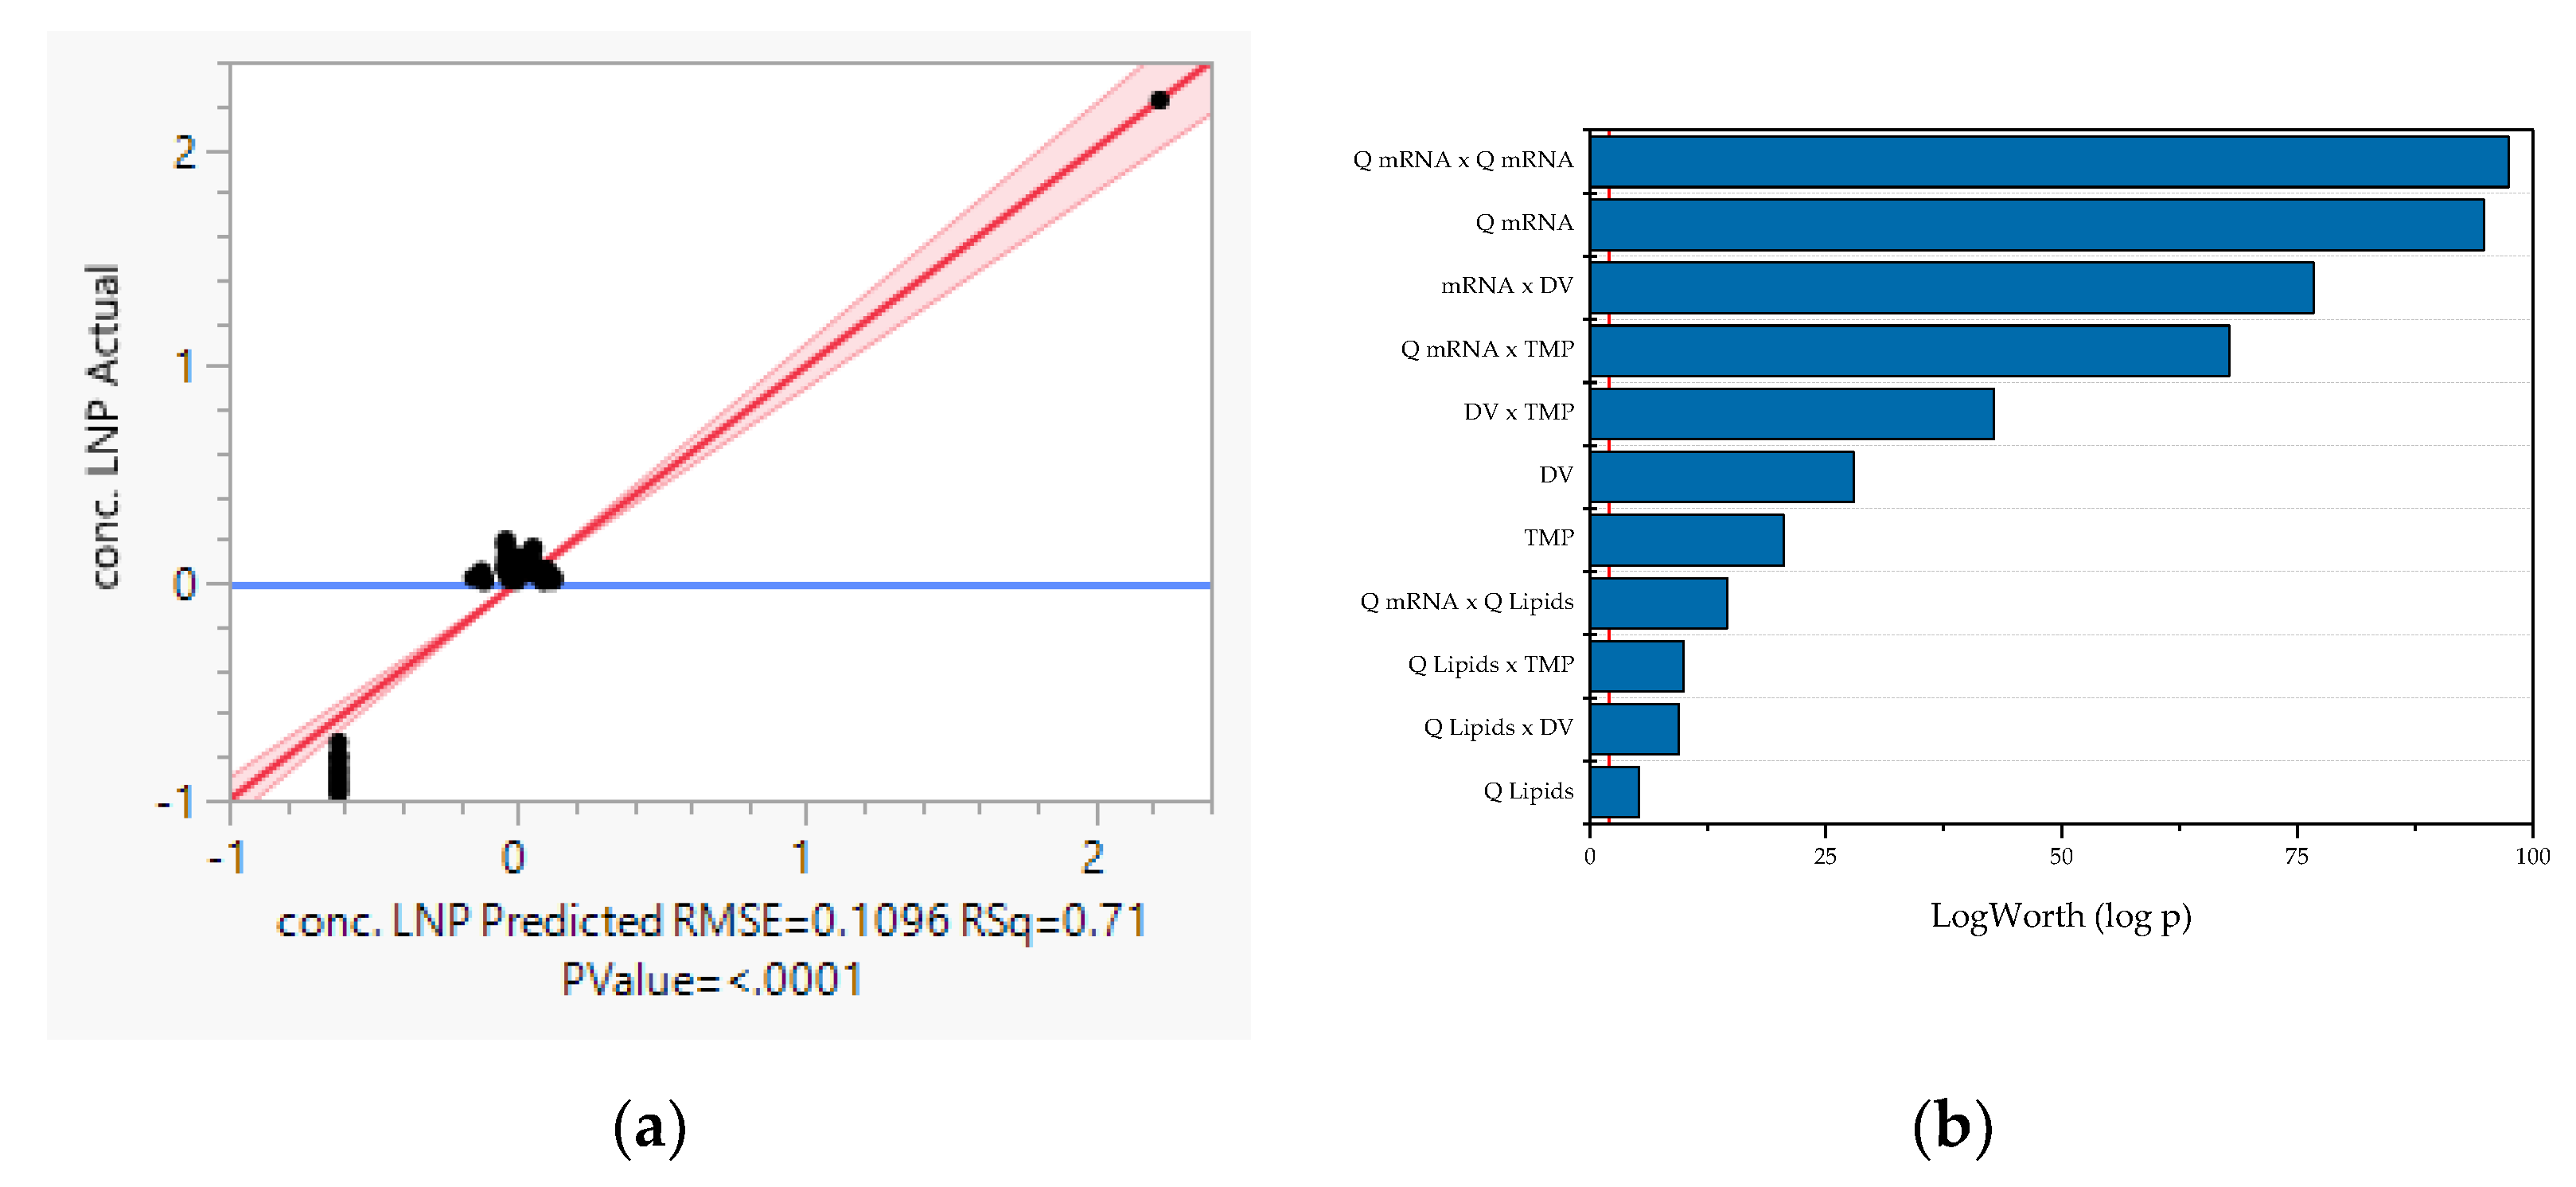
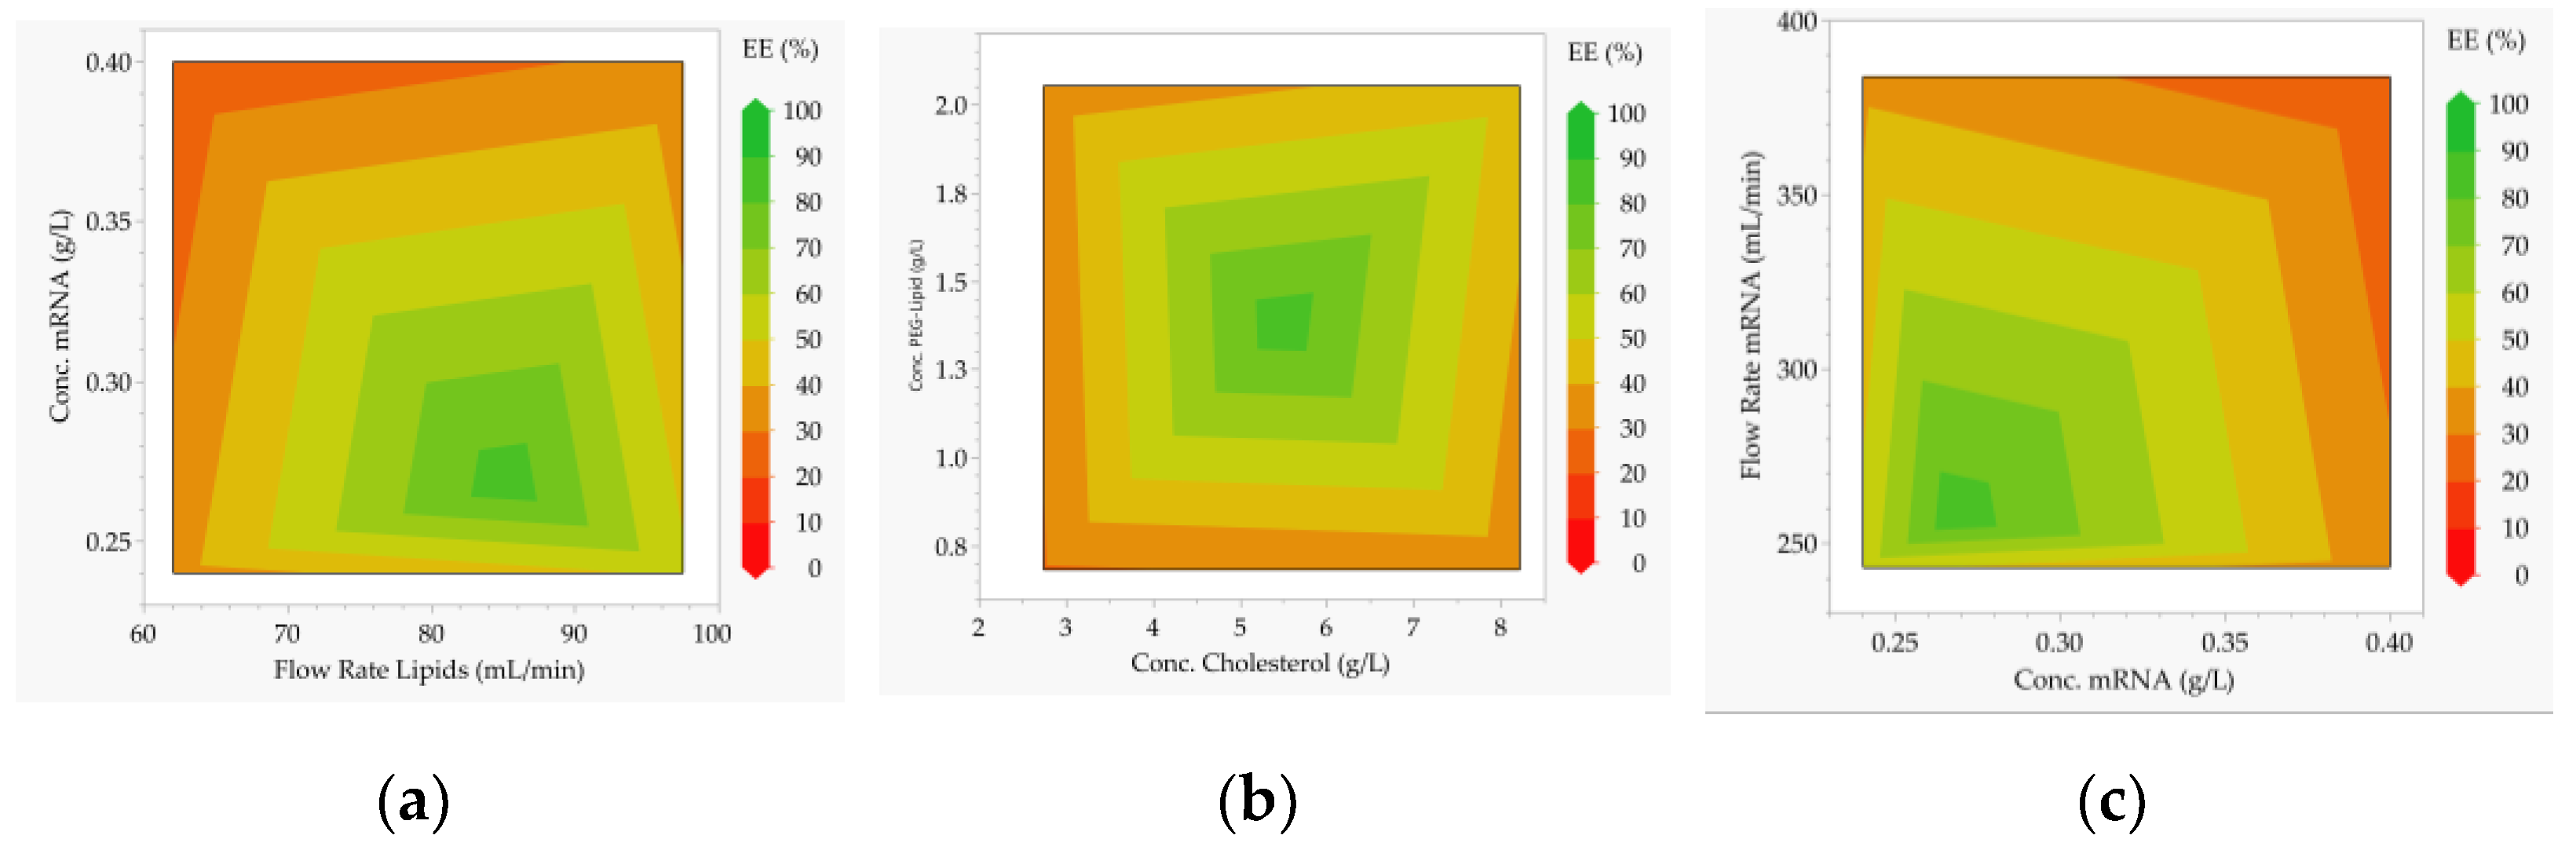
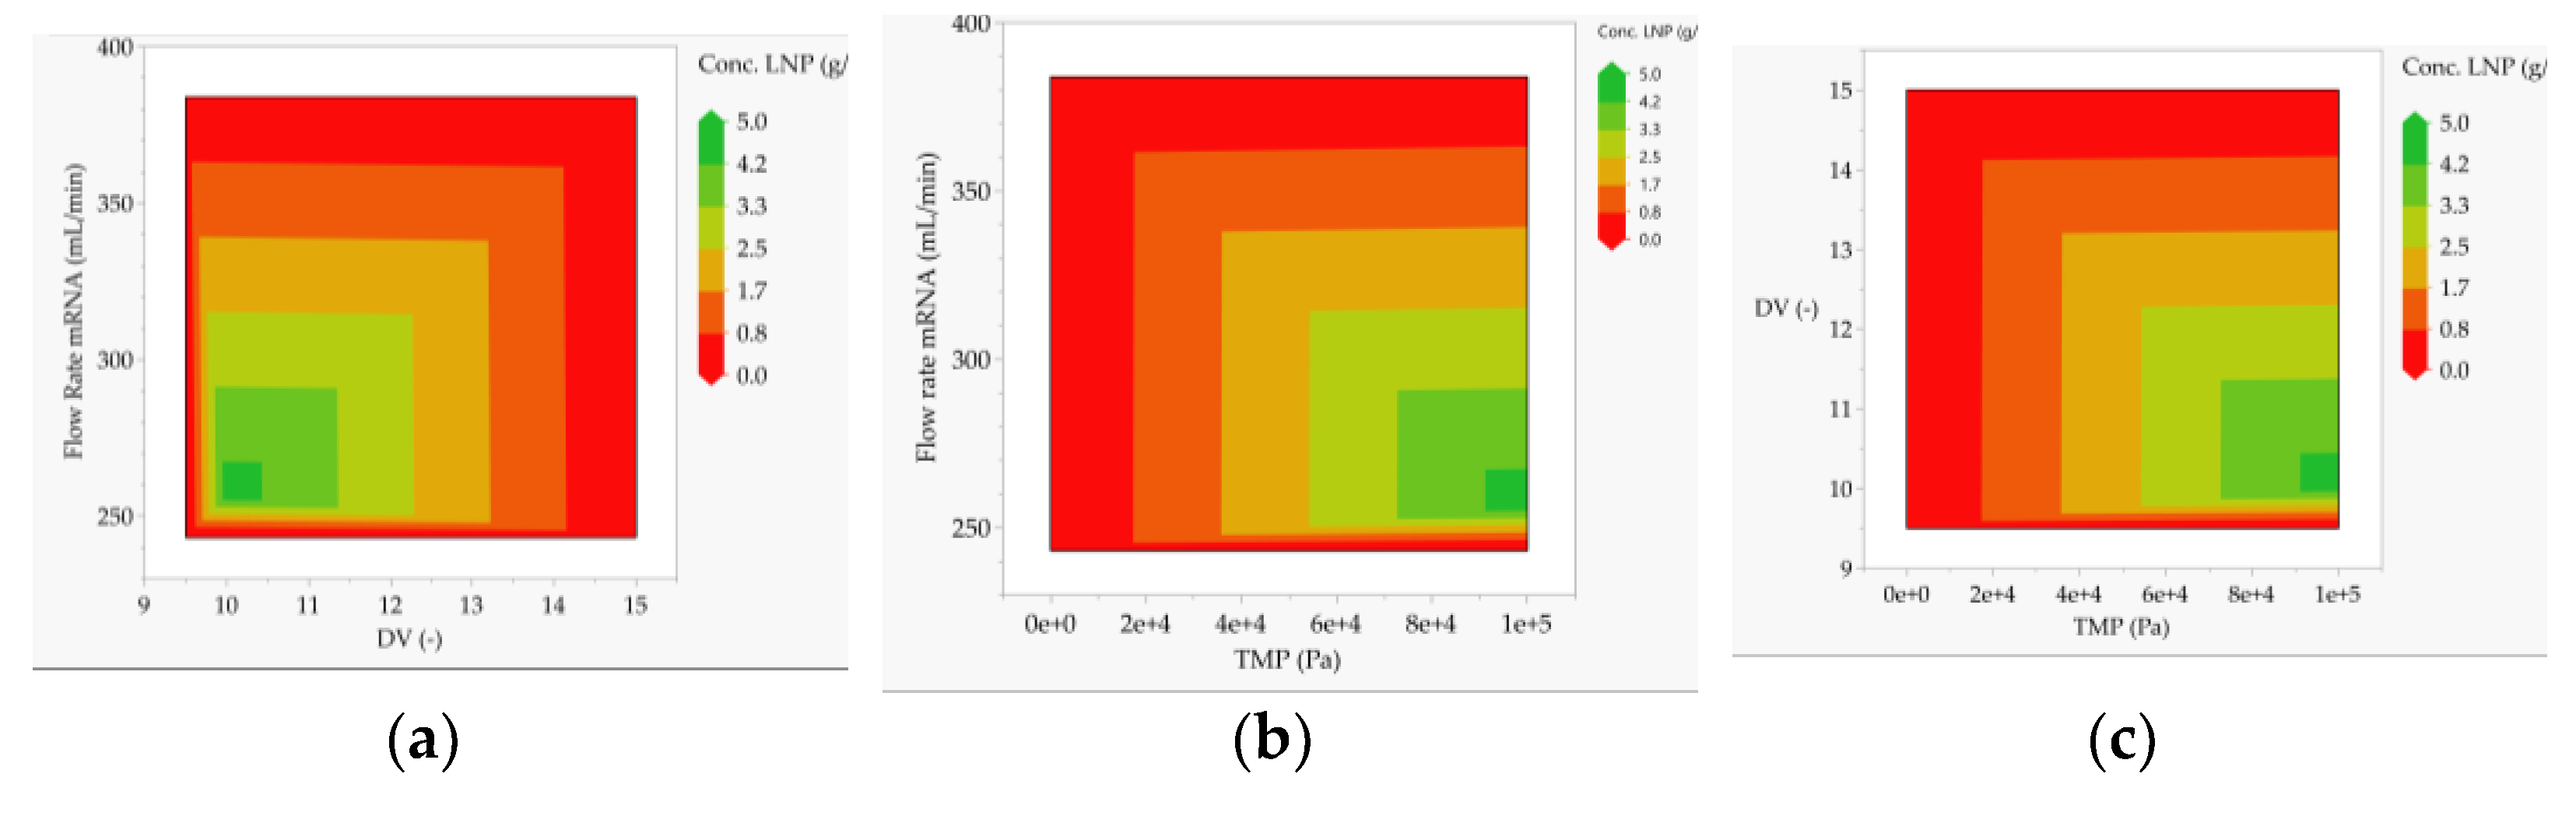
3.2. Multivariate Studies and Design Space Characterization
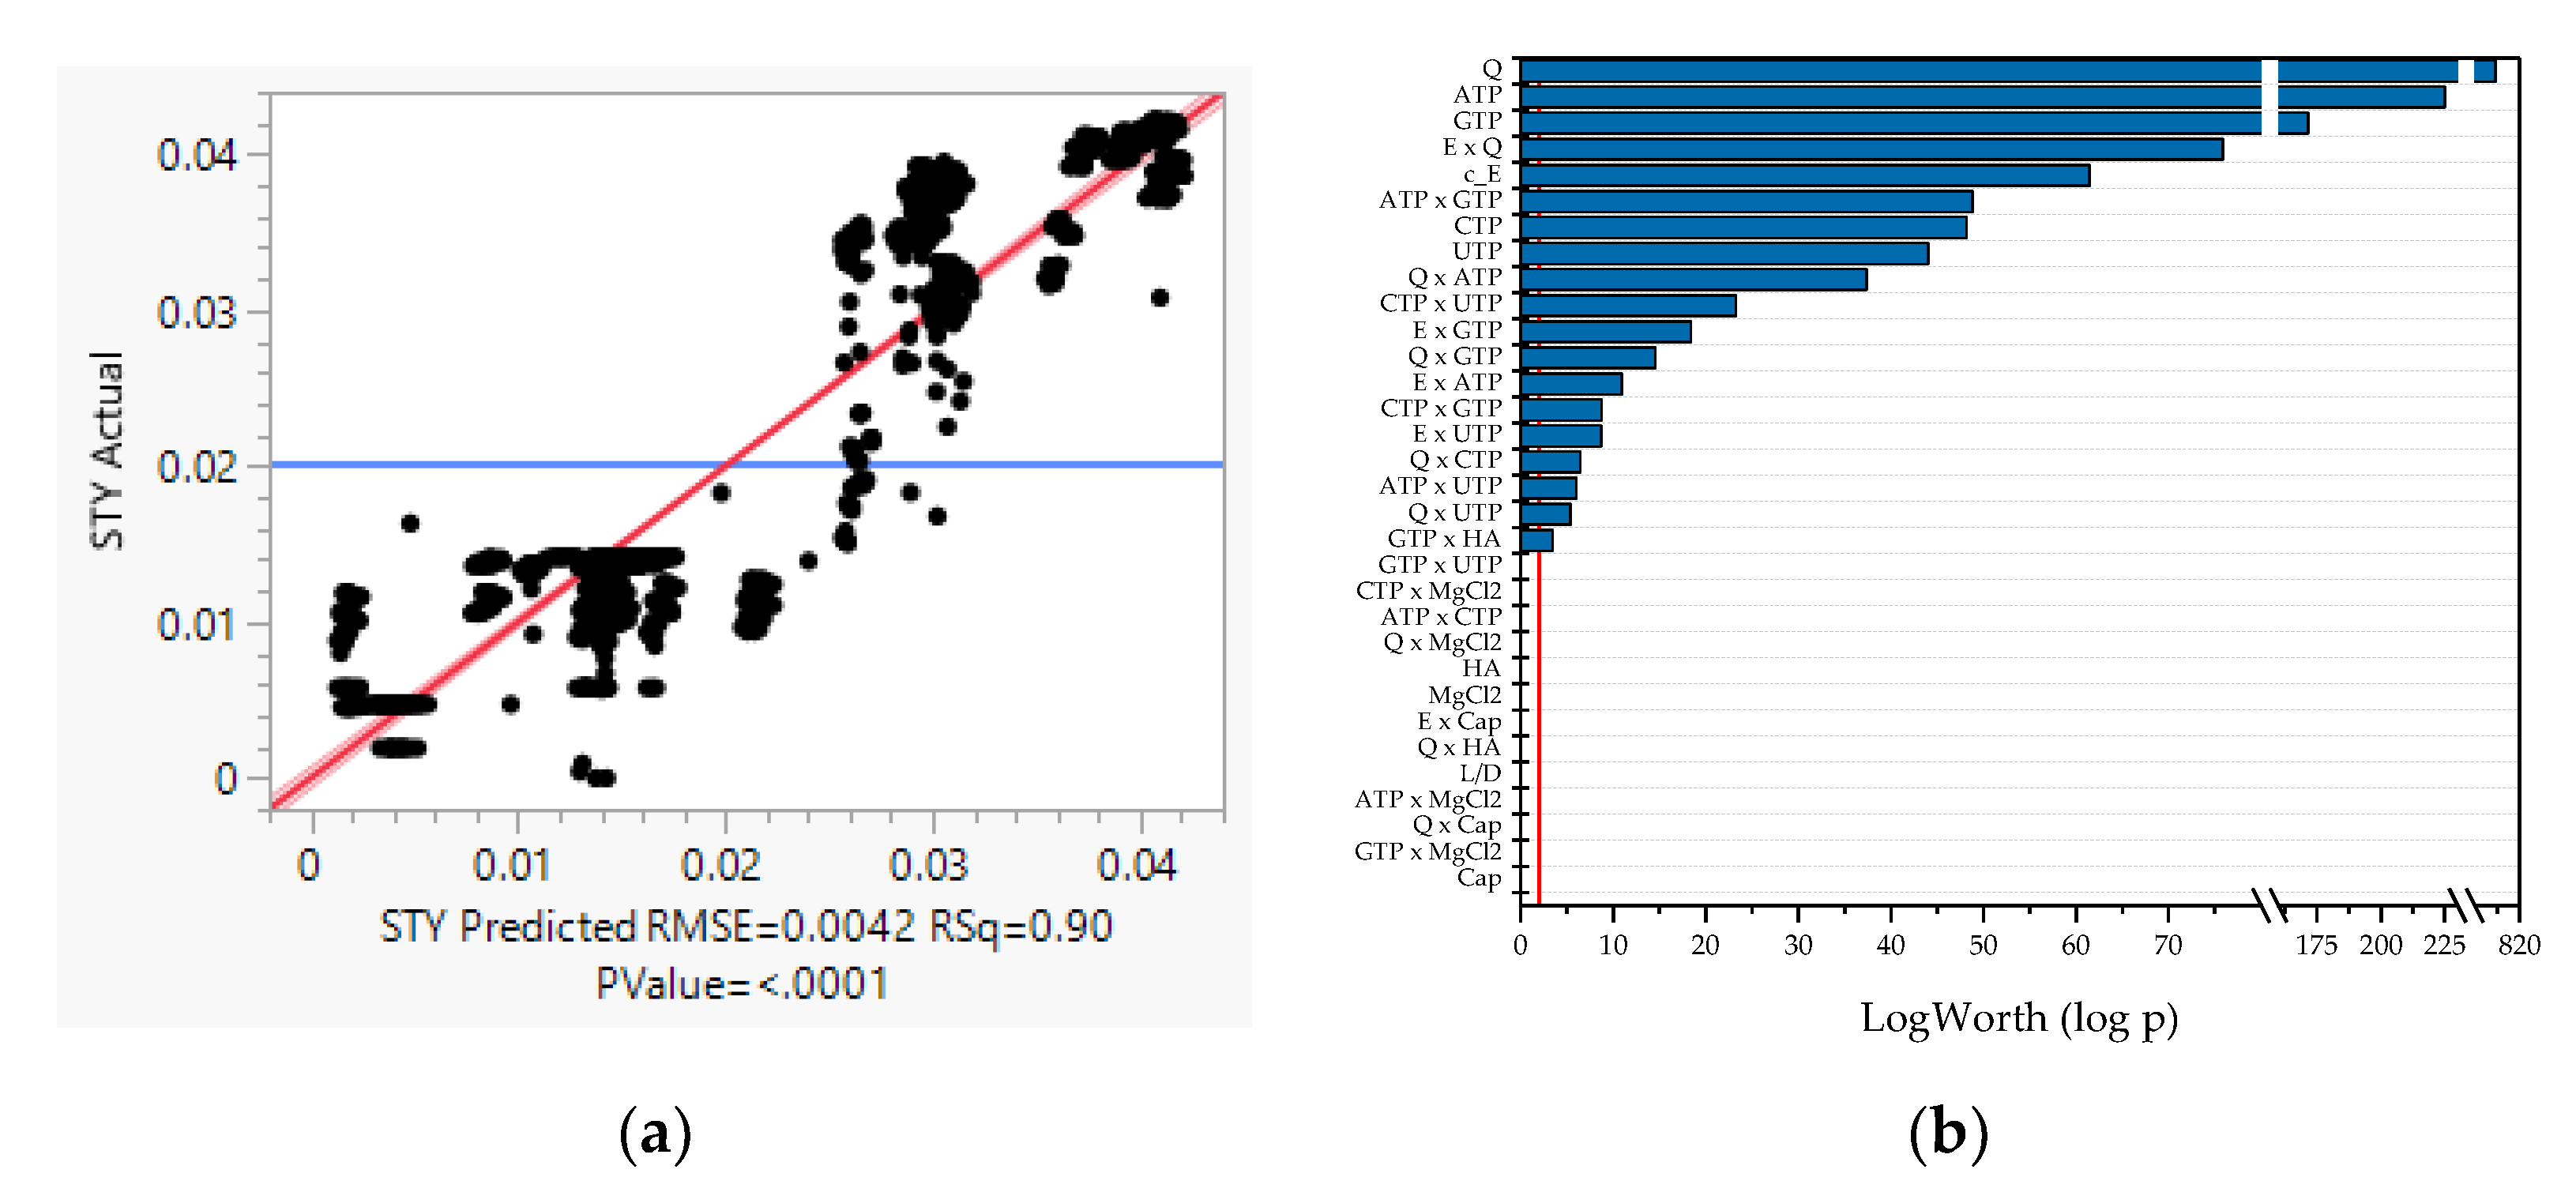
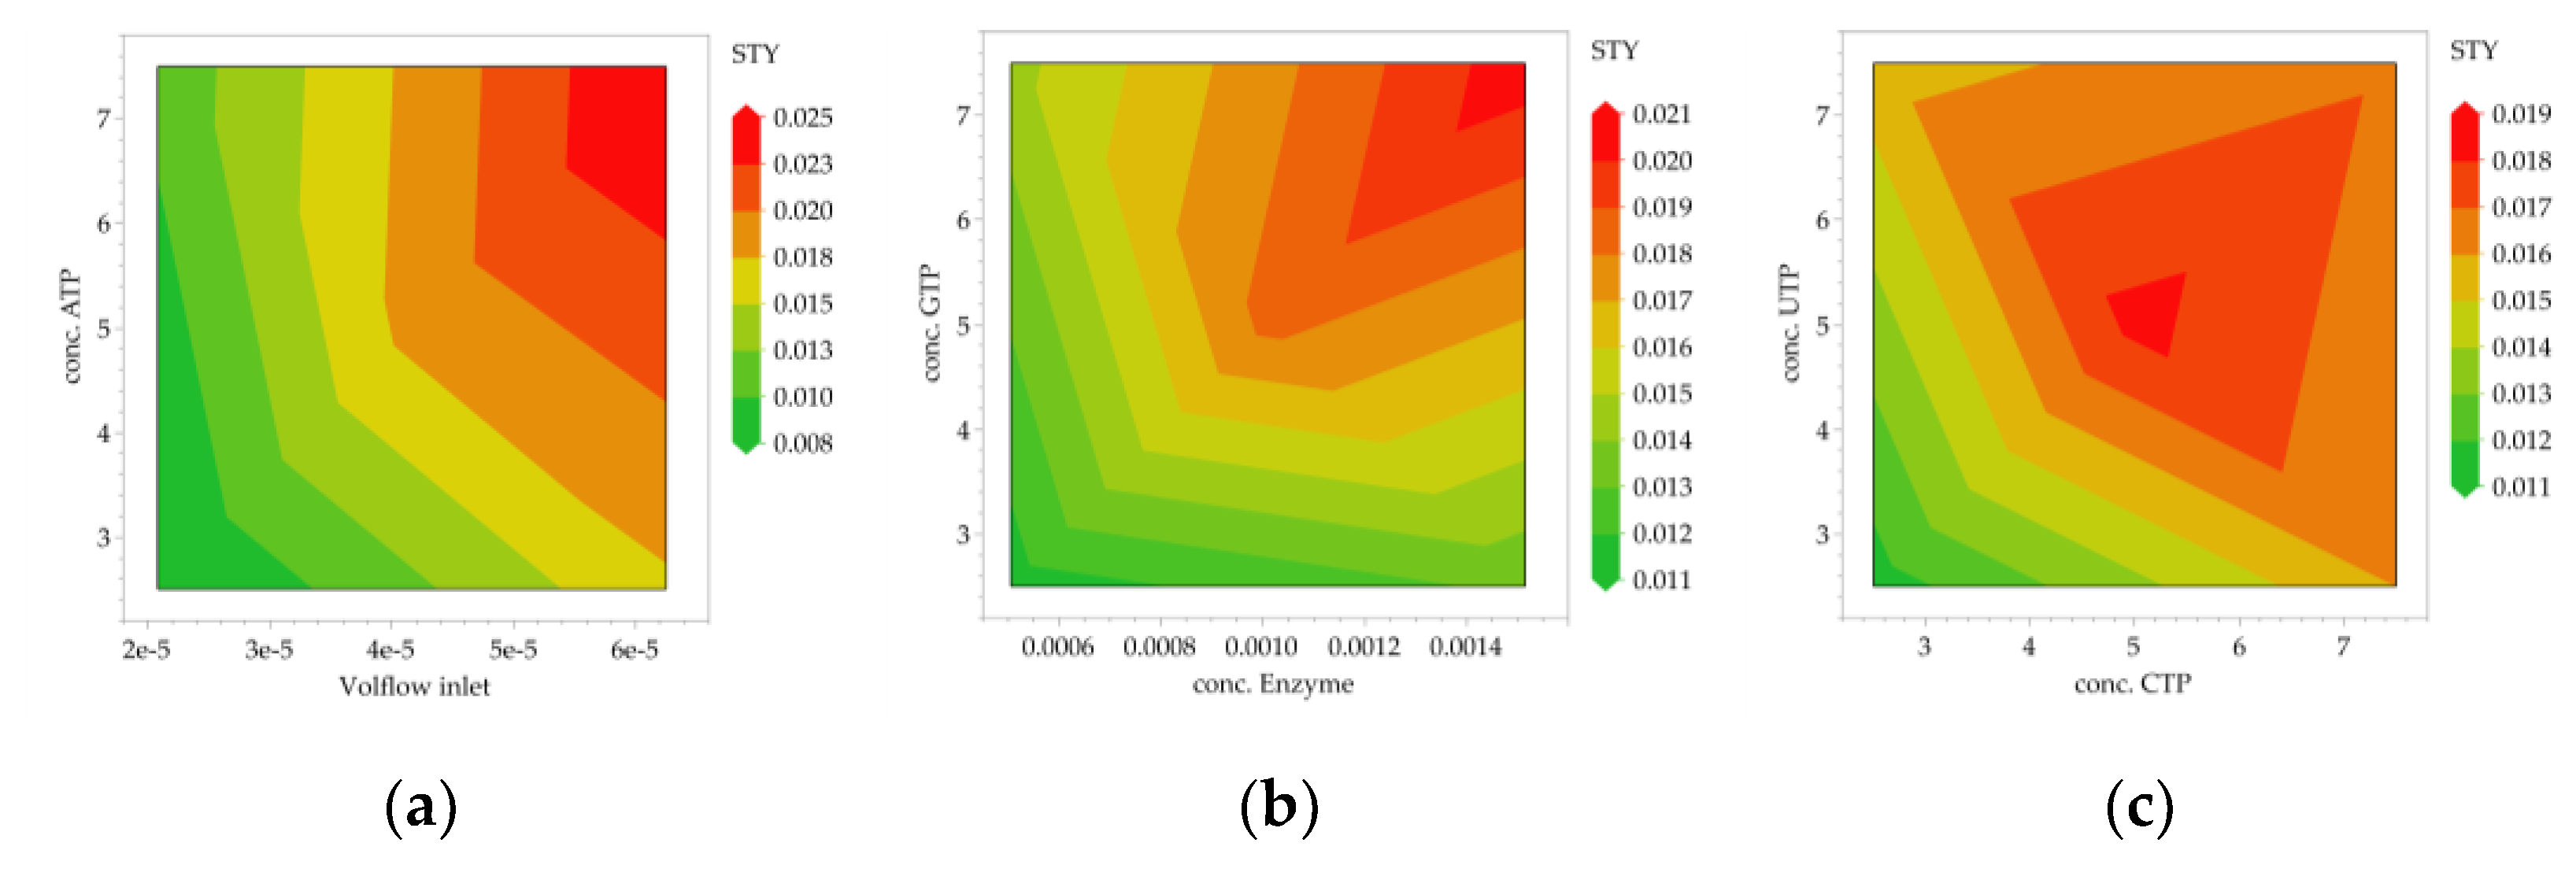
- IVT
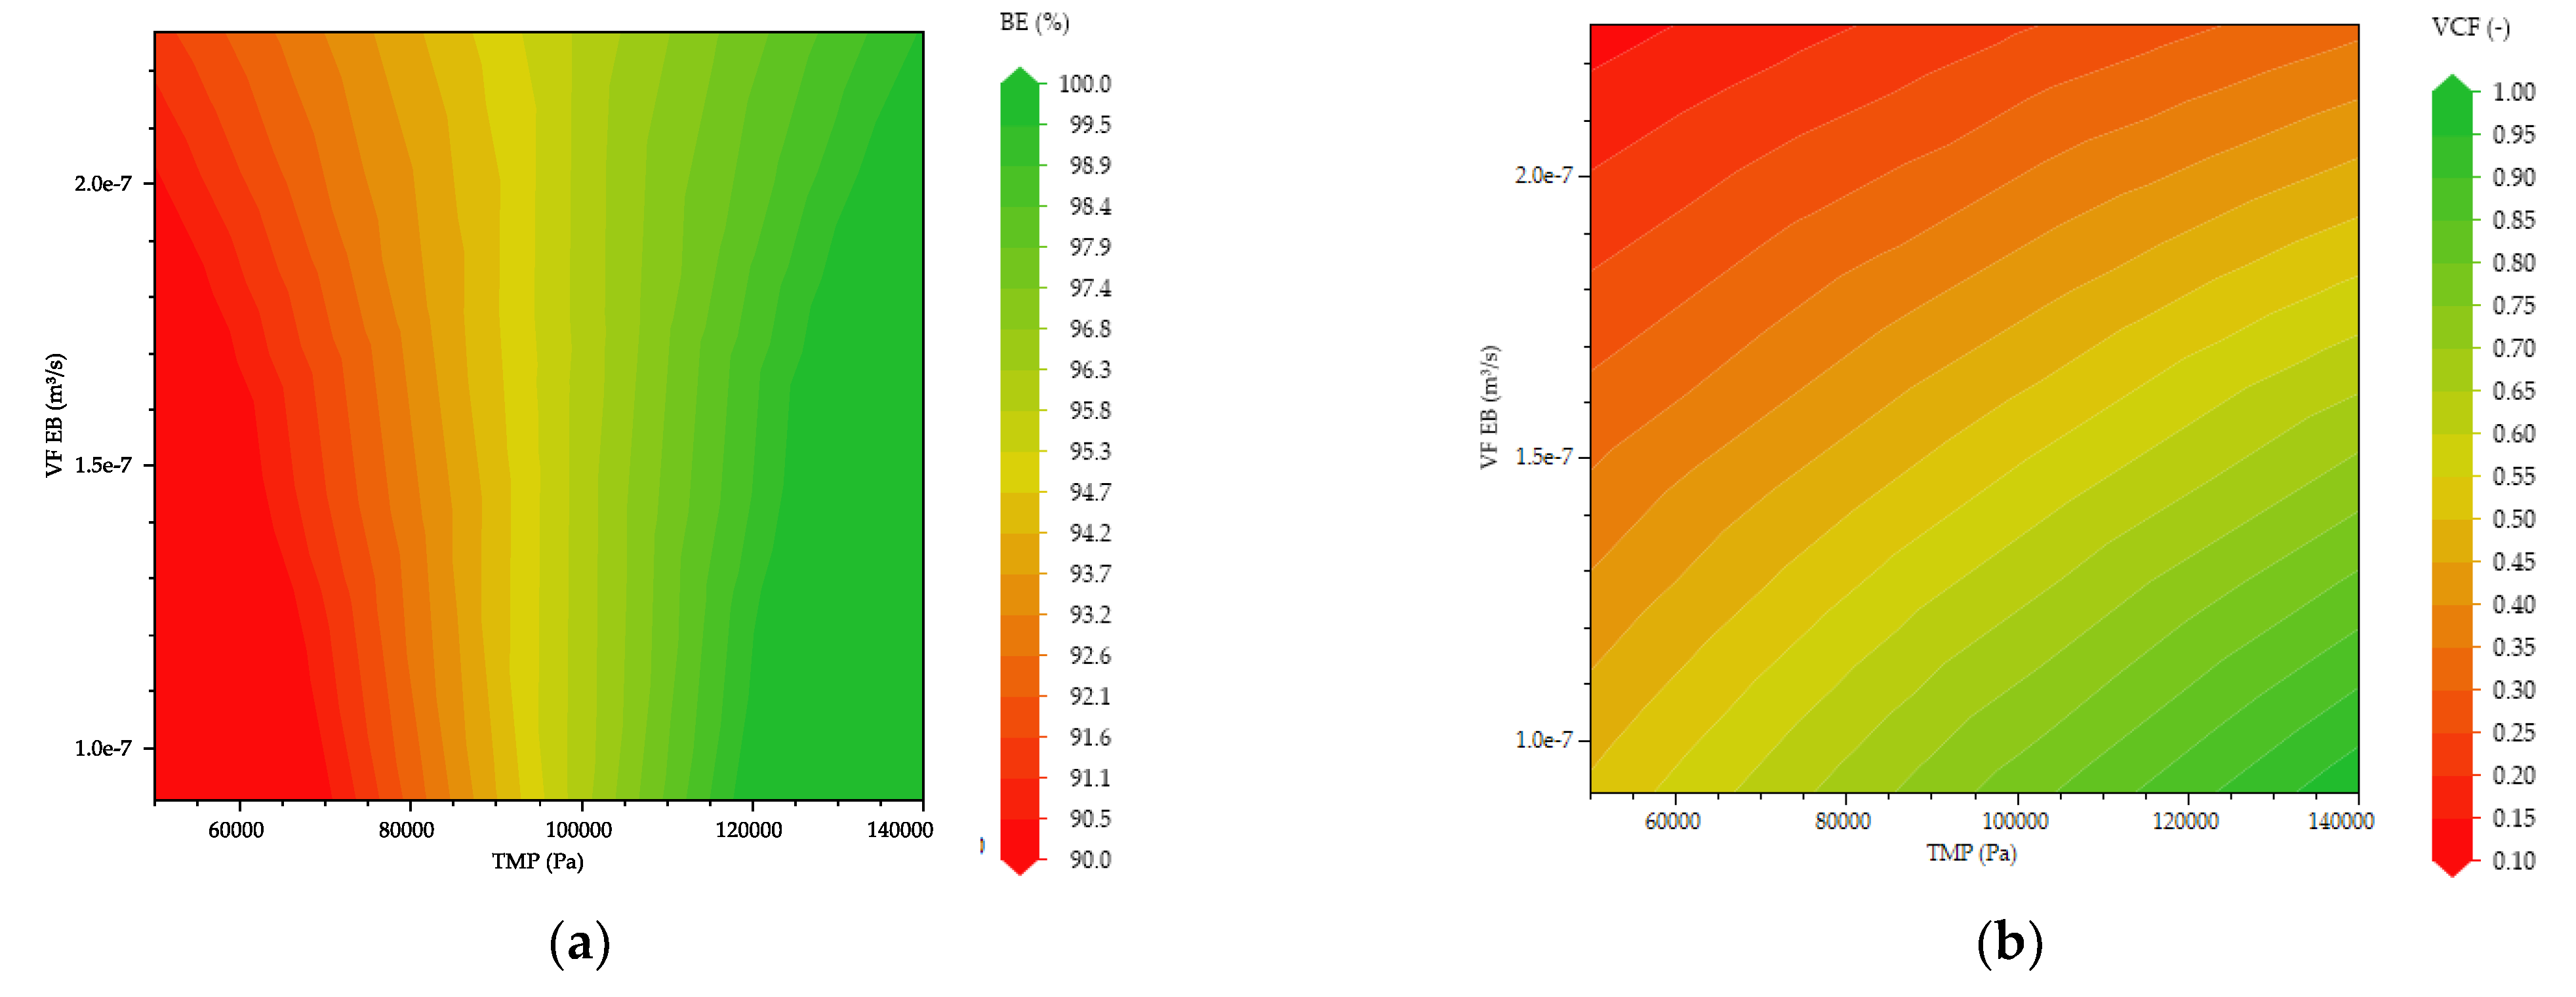
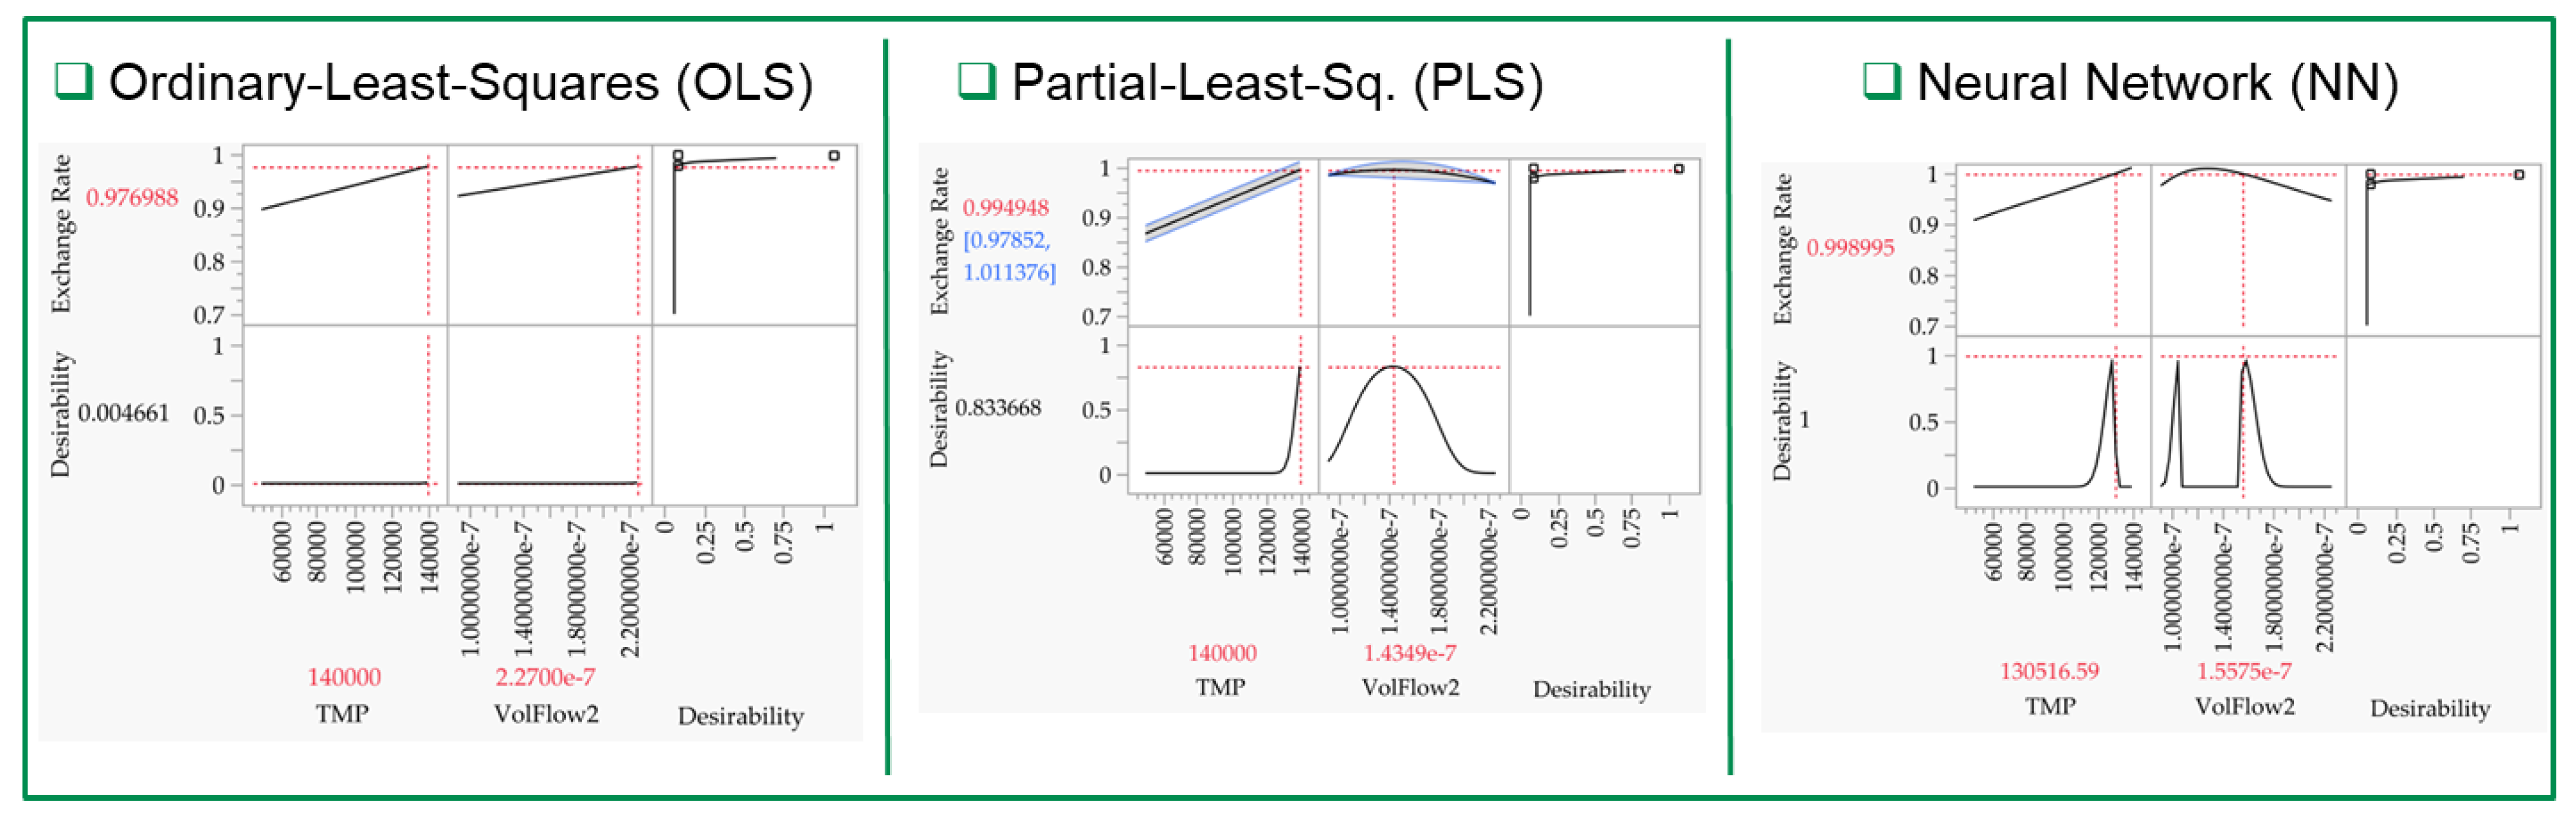
- Inline Diafiltration by SPTFF
- LNP
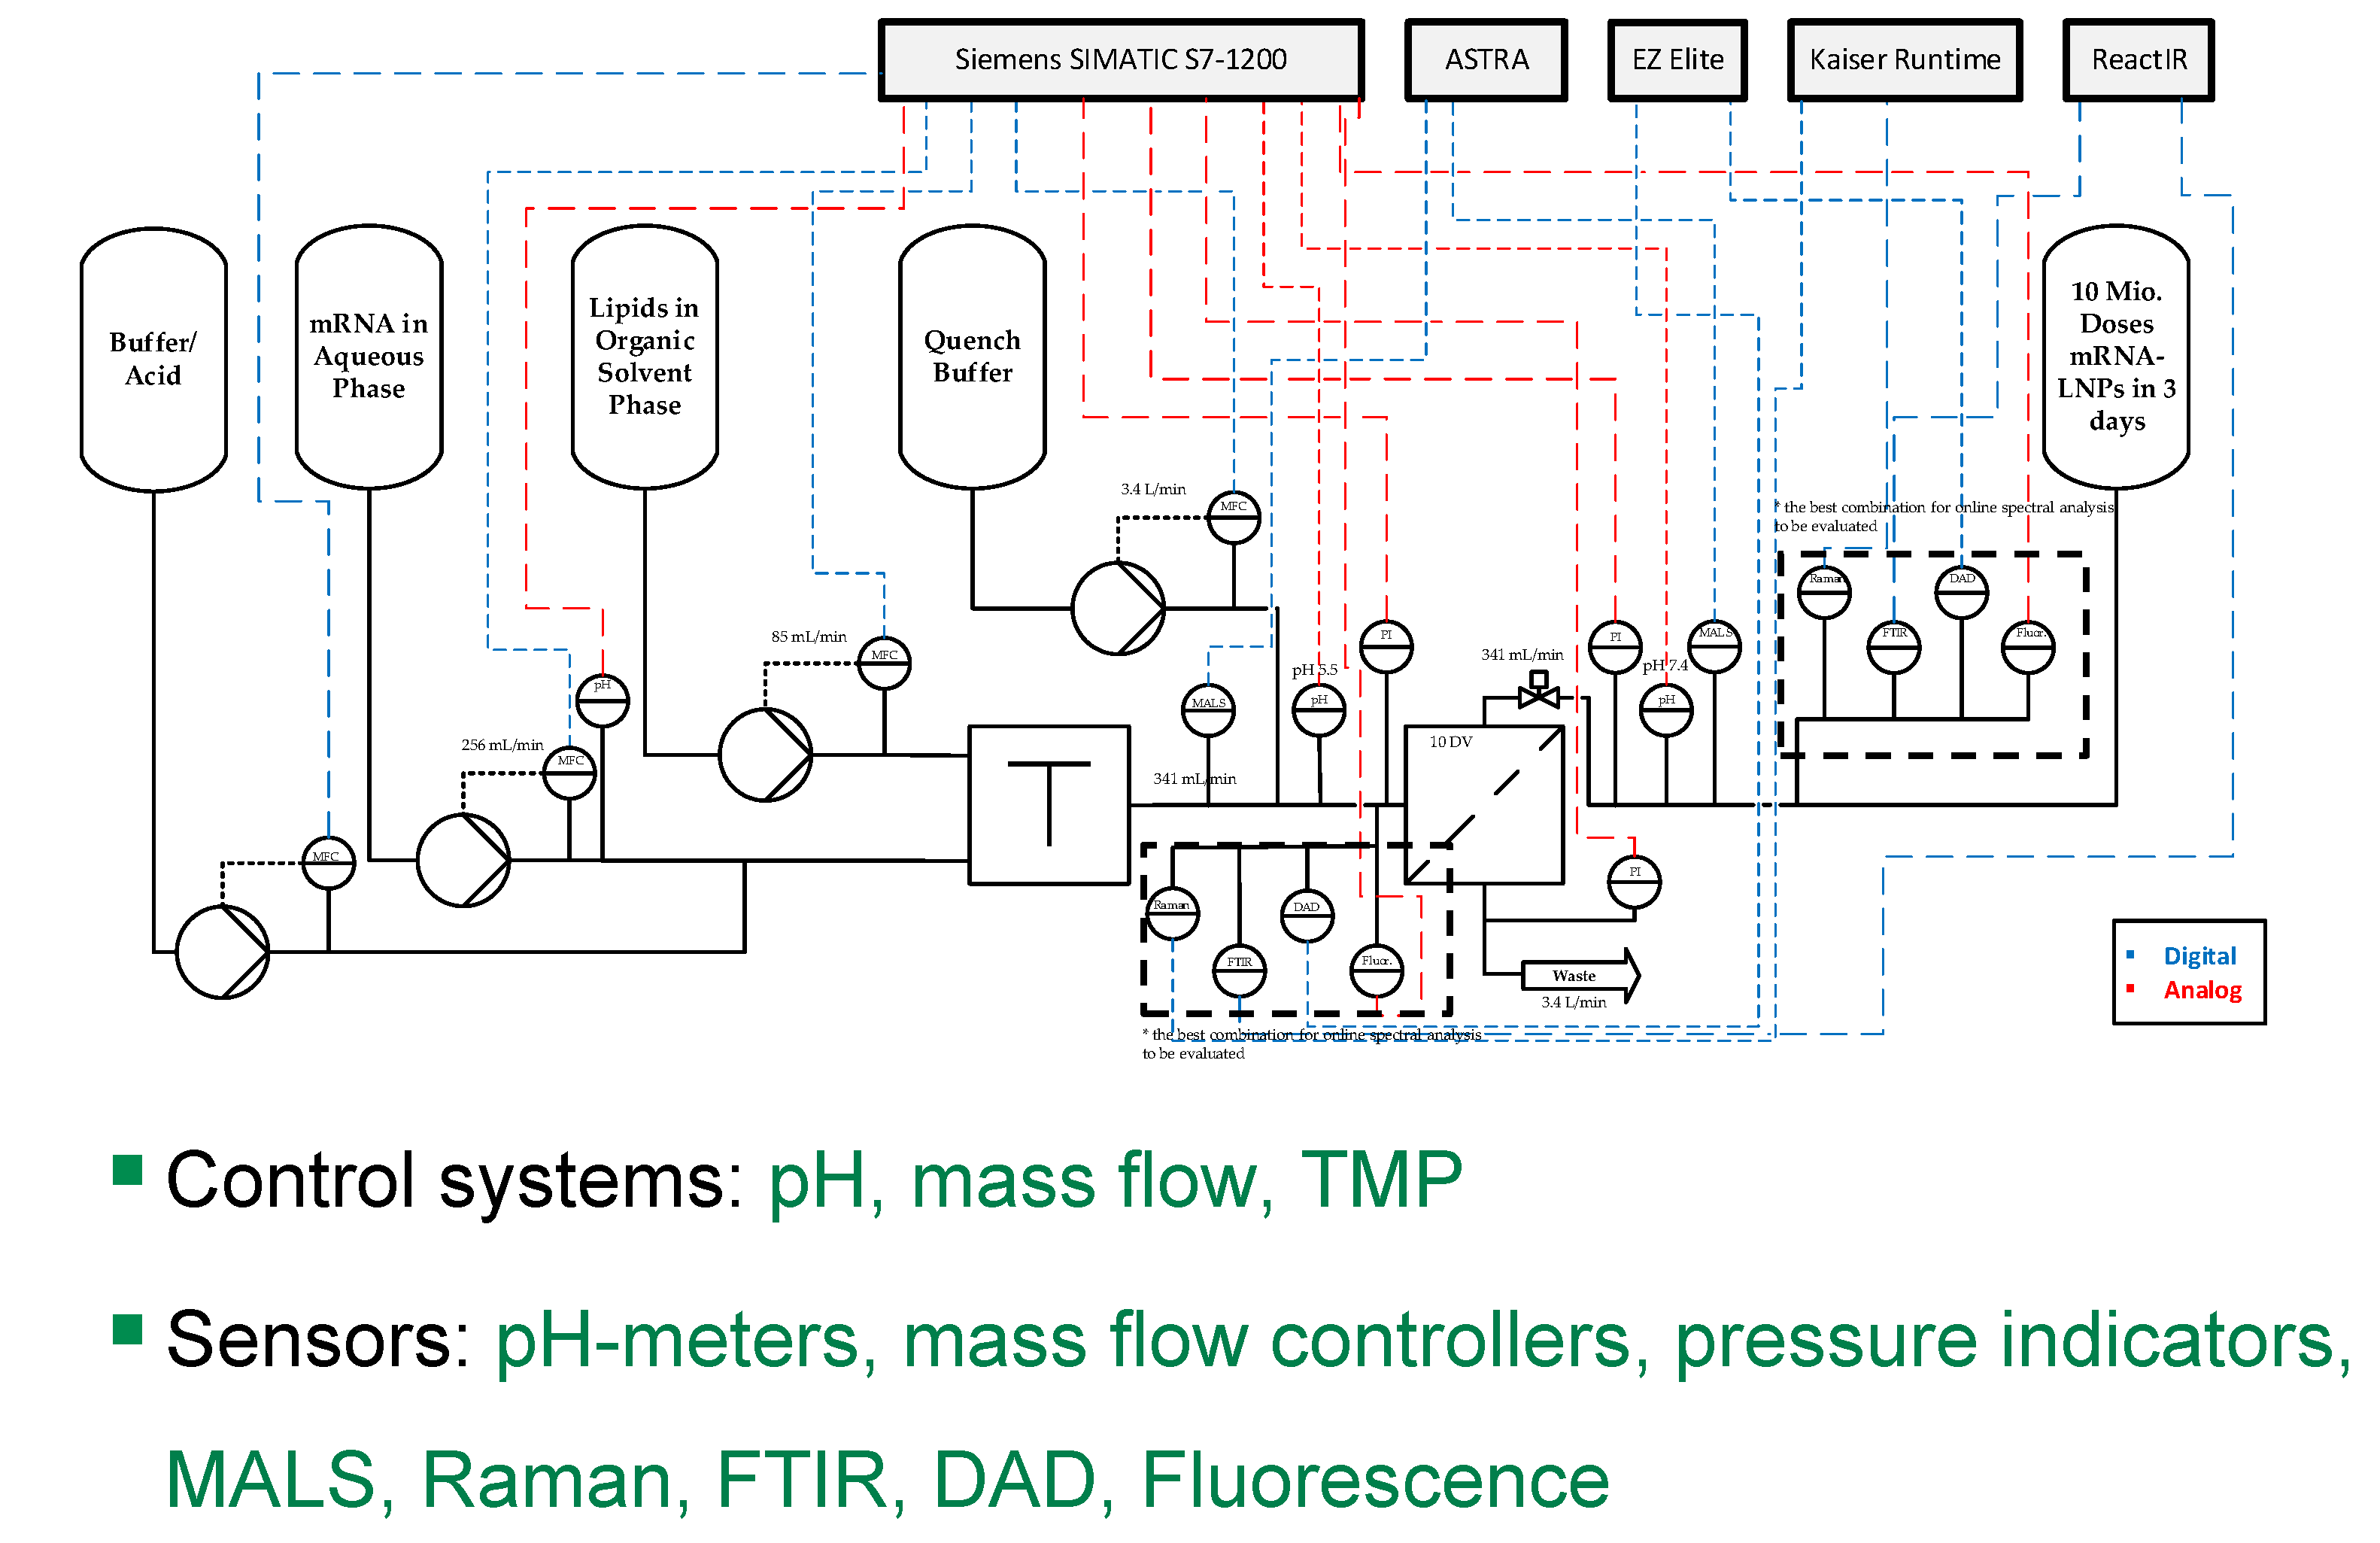
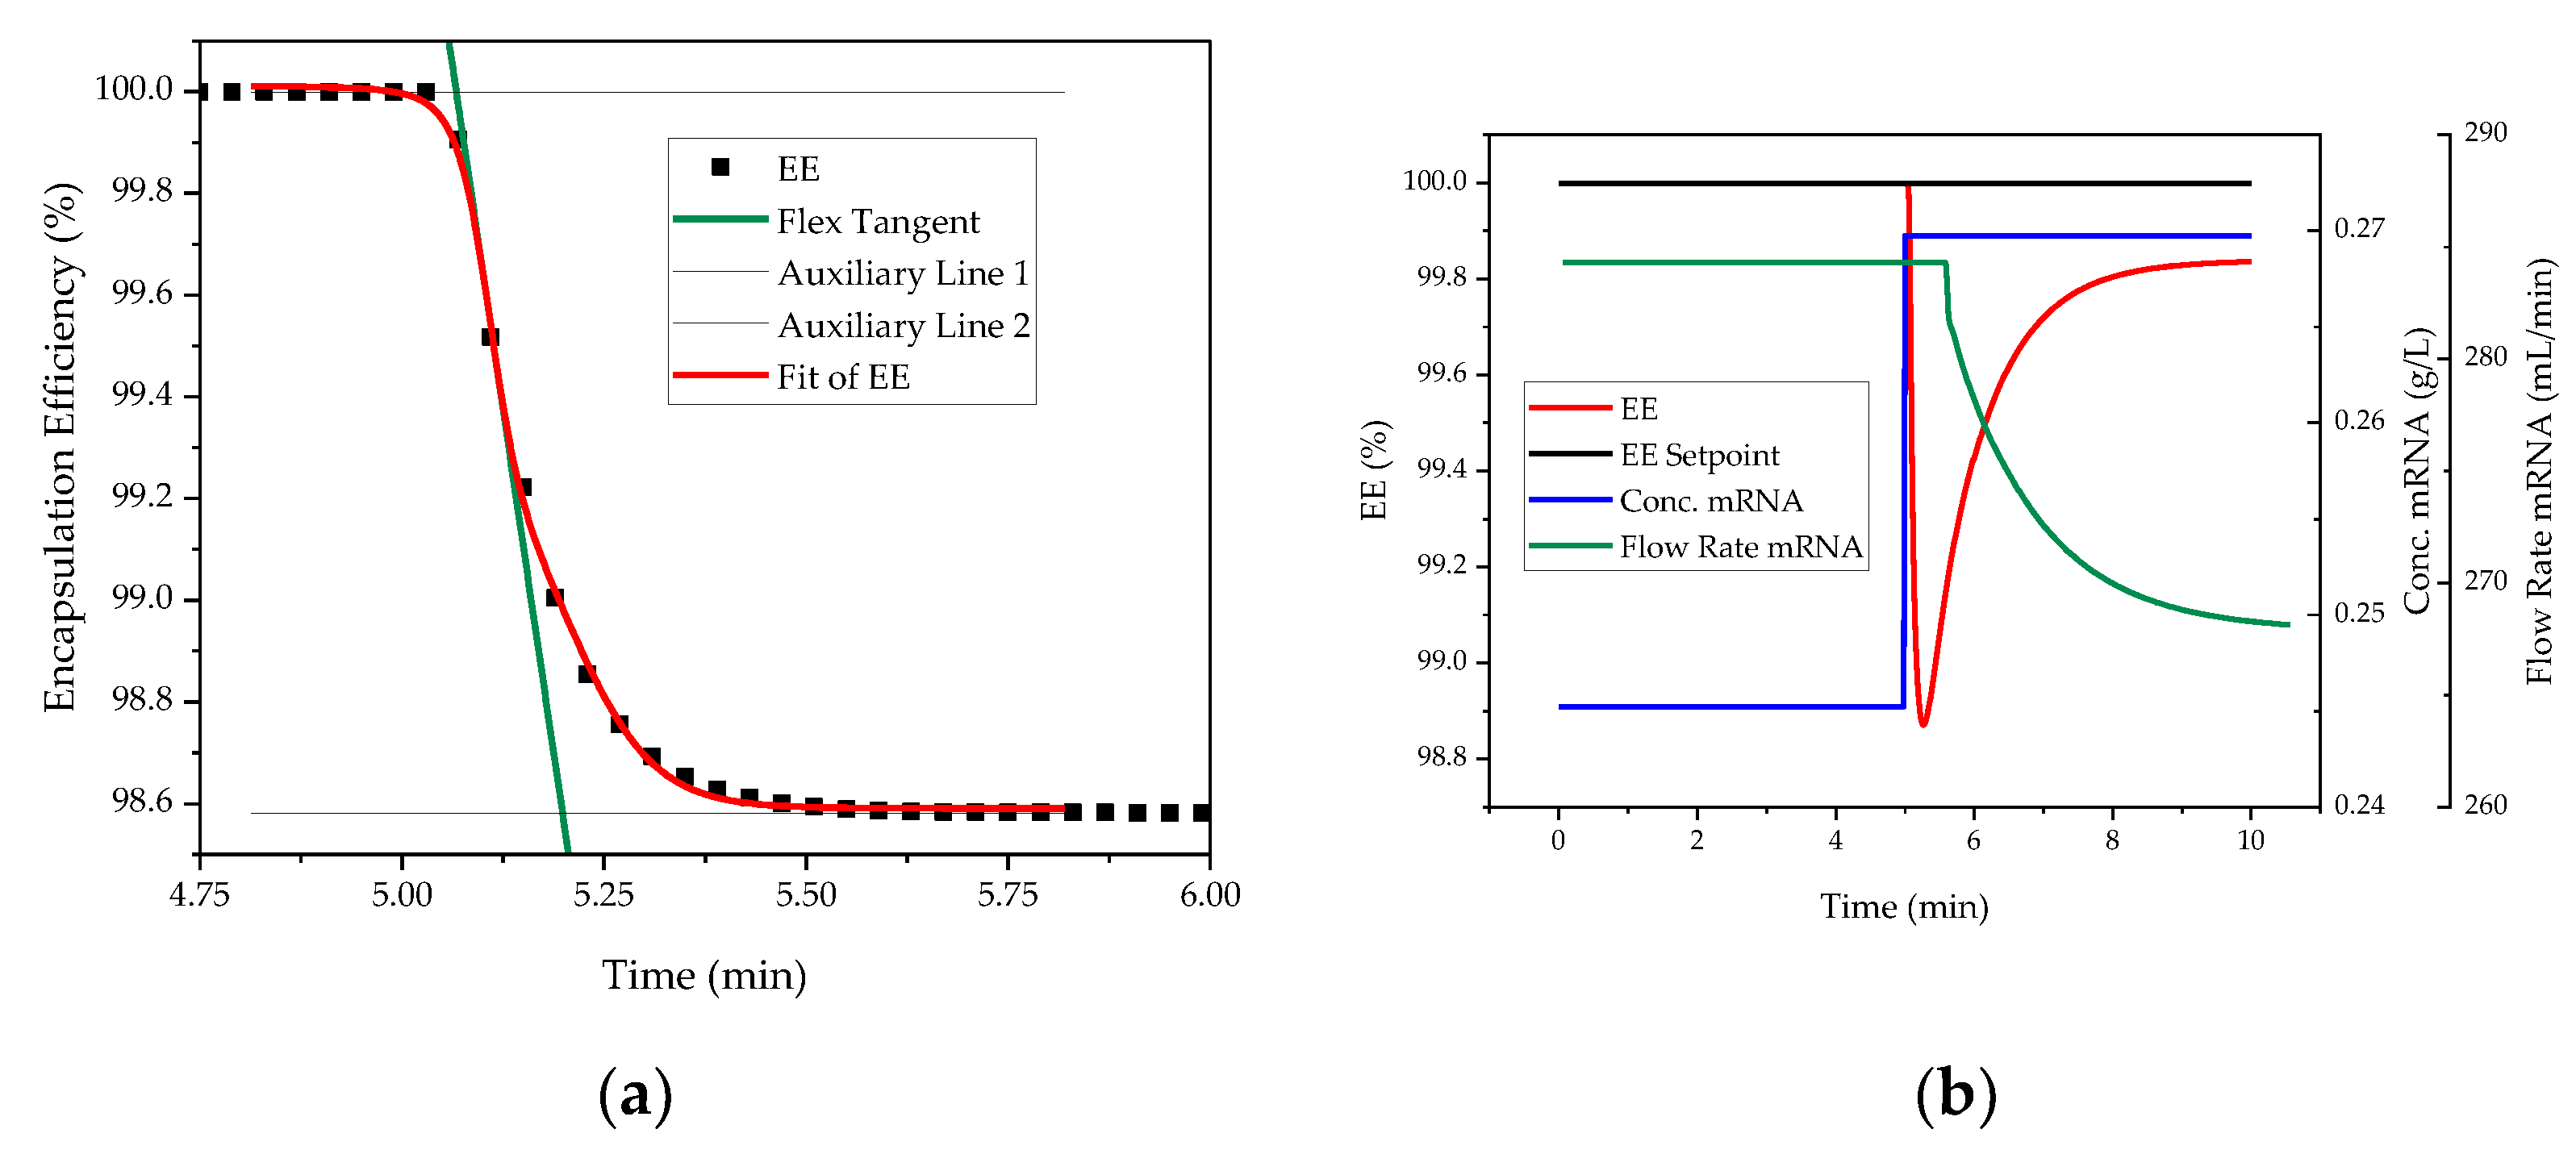
3.3. Process Control Strategies
- IVT
- Inline Diafiltration by SPTFF
- LNP
4. Conclusions
Author Contributions
Funding
Institutional Review Board Statement
Informed Consent Statement
Data Availability Statement
Acknowledgments
Conflicts of Interest
References
- Melinek, B.; Colant, N.; Stamatis, C.; Lennon, C.; Farid, S.S.; Polizzi, K.; Carver, M.; Bracewell, D.G. Toward a Roadmap for Cell-Free Synthesis in Bioprocessing. Available online: https://bioprocessintl.com/upstream-processing/expression-platforms/toward-a-roadmap-for-cell-free-synthesis-in-bioprocessing/ (accessed on 2 March 2021).
- Ipsen Biopharm Ltd. Novel Production Process for a Highly Potent Recombinant Protein Using Doggybone DNA (dbDNA) Vector and Cell Free Expression Technology. 2020. Available online: https://gtr.ukri.org/projects?ref=104201 (accessed on 3 June 2021).
- GenScript ProBio. Accelerating Vaccine Development against COVID-19. 2020. Available online: https://www.genscriptprobio.com/gsfiles/techfiles/GPB-COVID19-GMP%20plasmid-GPB_052020.pdf (accessed on 6 March 2021).
- Shin, D.; Azizian, K.T.; Henderson, J.M.; Hogrefe, R.I.; Lebedev, A.; Houston, M.; McCaffrey, A.P. CleanCap® Co-transcriptional Capping Streamlines mRNA Manufacturing. Available online: https://www.trilinkbiotech.com/media/contentmanager/content/mRNA_WVC2_1.pdf (accessed on 6 March 2021).
- Whitley, J.; Zwolinski, C.; Denis, C.; Maughan, M.; Hayles, L.; Clarke, D.; Snare, M.; Liao, H.; Chiou, S.; Marmura, T.; et al. Development of mRNA manufacturing for vaccines and therapeutics: mRNA platform requirements and development of a scalable production process to support early phase clinical trials. Transl. Res. 2022, 242, 38–55. [Google Scholar] [CrossRef] [PubMed]
- Weise, E.; Weintraub, K. A COVID-19 Vaccine Life Cycle: From DNA to Doses. 2021. Available online: https://eu.usatoday.com/in-depth/news/health/2021/02/07/how-covid-vaccine-made-step-step-journey-pfizer-dose/4371693001/ (accessed on 6 March 2021).
- von der Mülbe, F.; Reidel, L.; Ketterer, T.; Gontcharova, L.; Bauer, S.; Pascolo, S.; Probst, J.; Schmid, A. Method for Producing RNA. Available online: https://patents.google.com/patent/US10017826B2/en (accessed on 3 August 2022).
- BIA Separations. Purification of mRNA with CIMmultus PrimaS™: Technical Note. 2020. Available online: https://www.biaseparations.com/en/library/technical-notes/1088/purification-of-mrna-with-cimmultus-primastm (accessed on 2 March 2021).
- Nemec, K.S.; Cernigoj, U.; Vidic, J.; Livk, A.G.; Goricar, B.; Bozic, K.; Celjar, A.M.; Skok, J.; Mencin, N.; Kralj, S.; et al. High Yield mRNA Production Process from E. coli to Highly Pure mRNA. 2020. Available online: https://www.biaseparations.com/en/library/seminars-webinars/1098/high-yield-mrna-production-process-from-ecoli-to-highly-pure-mrna (accessed on 2 March 2021).
- Zobel-Roos, S.; Stein, D.; Strube, J. Evaluation of Continuous Membrane Chromatography Concepts with an Enhanced Process Simulation Approach. Antibodies 2018, 7, 13. [Google Scholar] [CrossRef] [PubMed]
- Ullmann’s Encyclopedia of Industrial Chemistry; Wiley-VCH Verlag GmbH & Co. KGaA: Weinheim, Germany, 2000; ISSN 3527306730.
- Vetter, F.L.; Zobel-Roos, S.; Mota, J.P.; Nilsson, B.; Schmidt, A.; Strube, J. Toward Autonomous Production of mRNA-Therapeutics in the Light of Advanced Process Control and Traditional Control Strategies for Chromatography: Submitted. Processes 2022. [Google Scholar]
- Vetter, F.L.; Strube, J. Enabling Total Process Digital Twin in Sugar Refining through the Integration of Secondary Crystallization Influences. Processes 2022, 10, 373. [Google Scholar] [CrossRef]
- Helling, C.; Strube, J. Quality-by-Design with Rigorous Process Modeling as Platform Technology of the Future. Chem. Ing. Tech. 2012, 84, 1334. [Google Scholar] [CrossRef]
- Yu, L.X.; Amidon, G.; Khan, M.A.; Hoag, S.W.; Polli, J.; Raju, G.K.; Woodcock, J. Understanding pharmaceutical quality by design. AAPS J. 2014, 16, 771–783. [Google Scholar] [CrossRef]
- Uhlenbrock, L.; Sixt, M.; Strube, J. Quality-by-Design (QbD) process evaluation for phytopharmaceuticals on the example of 10-deacetylbaccatin III from yew. Resour.-Effic. Technol. 2017, 3, 137–143. [Google Scholar] [CrossRef]
- Zobel-Roos, S.; Schmidt, A.; Mestmäcker, F.; Mouellef, M.; Huter, M.; Uhlenbrock, L.; Kornecki, M.; Lohmann, L.; Ditz, R.; Strube, J. Accelerating Biologics Manufacturing by Modeling or: Is Approval under the QbD and PAT Approaches Demanded by Authorities Acceptable Without a Digital-Twin? Processes 2019, 7, 94. [Google Scholar] [CrossRef]
- ICH Expert Working Group. PHARMACEUTICAL DEVELOPMENT Q8(R2). In Ich Harmonised Tripartite Guideline; 2009; pp. 1–28. Available online: https://database.ich.org/sites/default/files/Q8_R2_Guideline.pdf (accessed on 3 August 2022).
- ICH Expert Working Group. Quality risk management Q9, Current step. In Ich Harmonised Tripartite Guideline; 2005; p. 408. Available online: https://educationfactory.de/wp-content/uploads/2020/05/ICH-Q9-Quality-Risk-Management.pdf (accessed on 3 August 2022).
- ICH Expert Working Group. Pharmaceutical quality system Q10. In Ich Harmonised Tripartite Guideline; 2008. Available online: https://www.cls.co.at/media/files/ich-q10---pharmaceutial-quality-system.pdf (accessed on 3 August 2022).
- ICH Expert Working Group. Development and manufacture of drug substances (chemical entities and biotechnological/biological entities) Q11. In Ich Harmonised Tripartite Guideline; 2011. Available online: http://www.nihs.go.jp/dbcb/TEXT/Q11.pdf (accessed on 3 August 2022).
- Alt, N.; Zhang, T.Y.; Motchnik, P.; Taticek, R.; Quarmby, V.; Schlothauer, T.; Beck, H.; Emrich, T.; Harris, R.J. Determination of critical quality attributes for monoclonal antibodies using quality by design principles. Biologicals 2016, 44, 291–305. [Google Scholar] [CrossRef]
- Sixt, M.; Uhlenbrock, L.; Strube, J. Toward a Distinct and Quantitative Validation Method for Predictive Process Modelling—On the Example of Solid-Liquid Extraction Processes of Complex Plant Extracts. Processes 2018, 6, 66. [Google Scholar] [CrossRef]
- Steinebach, F.; Angarita, M.; Karst, D.J.; Müller-Späth, T.; Morbidelli, M. Model based adaptive control of a continuous capture process for monoclonal antibodies production. J. Chromatogr. A 2016, 1444, 50–56. [Google Scholar] [CrossRef]
- Steinebach, F.; Müller-Späth, T.; Morbidelli, M. Continuous counter-current chromatography for capture and polishing steps in biopharmaceutical production. Biotechnol. J. 2016, 11, 1126–1141. [Google Scholar] [CrossRef] [PubMed]
- Steinebach, F.; Ulmer, N.; Wolf, M.; Decker, L.; Schneider, V.; Wälchli, R.; Karst, D.; Souquet, J.; Morbidelli, M. Design and operation of a continuous integrated monoclonal antibody production process. Biotechnol. Prog. 2017, 33, 1303–1313. [Google Scholar] [CrossRef] [PubMed]
- Kornecki, M.; Schmidt, A.; Lohmann, L.; Huter, M.; Mestmäcker, F.; Klepzig, L.; Strube, J. Accelerating Biomanufacturing by Modeling of Continuous Bioprocessing—Piloting Case Study of Monoclonal Antibody Manufacturing. Processes 2019, 7, 495. [Google Scholar] [CrossRef]
- Helgers, H.; Schmidt, A.; Lohmann, L.J.; Vetter, F.L.; Juckers, A.; Jensch, C.; Mouellef, M.; Zobel-Roos, S.; Strube, J. Towards Autonomous Operation by Advanced Process Control—Process Analytical Technology for Continuous Biologics Antibody Manufacturing. Processes 2021, 9, 172. [Google Scholar] [CrossRef]
- Geering, H.P. Regelungstechnik: Mathematische Grundlagen, Entwurfsmethoden, Beispiele; Springer: Berlin/Heidelberg, Germany, 1994; ISBN 978-3-662-09719-9. [Google Scholar]
- Armstrong, A.; Horry, K.; Cui, T.; Hulley, M.; Turner, R.; Farid, S.S.; Goldrick, S.; Bracewell, D.G. Advanced control strategies for bioprocess chromatography: Challenges and opportunities for intensified processes and next generation products. J. Chromatogr. A 2021, 1639, 461914. [Google Scholar] [CrossRef]
- Nordh, P. Understand Advanced Process Control. Available online: https://www.aiche.org/resources/publications/cep/2016/june/understand-advanced-process-control (accessed on 29 June 2021).
- Schmidt, A.; Helgers, H.; Vetter, F.L.; Juckers, A.; Strube, J. Digital Twin of mRNA-Based SARS-COVID-19 Vaccine Manufacturing towards Autonomous Operation for Improvements in Speed, Scale, Robustness, Flexibility and Real-Time Release Testing. Processes 2021, 9, 748. [Google Scholar] [CrossRef]
- Zobel-Roos, S.; Schmidt, A.; Uhlenbrock, L.; Ditz, R.; Köster, D.; Strube, J. Digital Twins in Biomanufacturing. Adv. Biochem. Eng. Biotechnol. 2021, 176, 181–262. [Google Scholar] [CrossRef]
- Nikita, S.; Thakur, G.; Jesubalan, N.G.; Kulkarni, A.; Yezhuvath, V.B.; Rathore, A.S. AI-ML applications in bioprocessing: ML as an enabler of real time quality prediction in continuous manufacturing of mAbs. Comput. Chem. Eng. 2022, 164, 107896. [Google Scholar] [CrossRef]
- Mouellef, M.; Szabo, G.; Vetter, F.L.; Siemers, C.; Strube, J. Artificial Neural Network for Fast and Versatile Model Parameter Adjustment Utilizing PAT Signals of Chromatography Processes for Process Control under Production Conditions. Processes 2022, 10, 709. [Google Scholar] [CrossRef]
- Kornecki, M.; Strube, J. Process Analytical Technology for Advanced Process Control in Biologics Manufacturing with the Aid of Macroscopic Kinetic Modeling. Bioengineering 2018, 5, 25. [Google Scholar] [CrossRef] [PubMed] [Green Version]
- Schmidt, A.; Helgers, H.; Lohmann, L.J.; Vetter, F.; Juckers, A.; Mouellef, M.; Zobel-Roos, S.; Strube, J. Process analytical technology as key-enabler for digital twins in continuous biomanufacturing. J. Chem. Technol. Biotechnol. 2022. [Google Scholar] [CrossRef]
- Juckers, A.; Knerr, P.; Harms, F.; Strube, J. Advanced Process Analytical Technology in Combination with Process Modeling for Endpoint and Model Parameter Determination in Lyophilization Process Design and Optimization. Processes 2021, 9, 1600. [Google Scholar] [CrossRef]
- Hengelbrock, A.; Helgers, H.; Schmidt, A.; Vetter, F.L.; Juckers, A.; Rosengarten, J.F.; Stitz, J.; Strube, J. Digital Twin for HIV-Gag VLP Production in HEK293 Cells. Processes 2022, 10, 866. [Google Scholar] [CrossRef]
- Helgers, H.; Hengelbrock, A.; Schmidt, A.; Strube, J. Digital Twins for Continuous mRNA Production. Processes 2021, 9, 1967. [Google Scholar] [CrossRef]
- Zobel-Roos, S.; Mouellef, M.; Siemers, C.; Strube, J. Process Analytical Approach towards Quality Controlled Process Automation for the Downstream of Protein Mixtures by Inline Concentration Measurements Based on Ultraviolet/Visible Light (UV/VIS) Spectral Analysis. Antibodies 2017, 6, 24. [Google Scholar] [CrossRef]
- Kornecki, M.; Schmidt, A.; Strube, J. PAT as key-enabling technology for QbD in pharmaceutical manufacturing A conceptual review on upstream and downstream processing. Chim. Oggi-Chem. Today 2018, 36, 44–48. [Google Scholar]
- Vetter, F.L.; Zobel-Roos, S.; Strube, J. PAT for Continuous Chromatography Integrated into Continuous Manufacturing of Biologics towards Autonomous Operation. Processes 2021, 9, 472. [Google Scholar] [CrossRef]
- Lohmann, L.J.; Strube, J. Process Analytical Technology for Precipitation Process Integration into Biologics Manufacturing towards Autonomous Operation—mAb Case Study. Processes 2021, 9, 488. [Google Scholar] [CrossRef]
- Arnold, S.; Siemann, M.; Scharnweber, K.; Werner, M.; Baumann, S.; Reuss, M. Kinetic modeling and simulation of in vitro transcription by phage T7 RNA polymerase. Biotechnol. Bioeng. 2001, 72, 548–561. [Google Scholar] [CrossRef]
- Kartje, Z.J.; Janis, H.I.; Mukhopadhyay, S.; Gagnon, K.T. Revisiting T7 RNA polymerase transcription in vitro with the Broccoli RNA aptamer as a simplified real-time fluorescent reporter. J. Biol. Chem. 2021, 296, 100175. [Google Scholar] [CrossRef] [PubMed]
- Bhagavan, N.V. Water, Acids, Bases, and Buffers. In Medical Biochemistry; Elsevier: Amsterdam, The Netherlands, 2002; pp. 1–16. ISBN 9780120954407. [Google Scholar]
- Taylor, G. Dispersion of soluble matter in solvent flowing slowly through a tube. Proc. R. Soc. Lond. A 1953, 219, 186–203. [Google Scholar] [CrossRef]
- Danckwerts, P.V. Continuous Flow Systems; Elsevier: Amsterdam, The Netherlands, 1953. [Google Scholar]
- Kovo, A.S. Mathematical Modeling and Simulation of Dispersion in a Nonideal Plug Flow Reactor. J. Dispers. Sci. Technol. 2008, 29, 1129–1134. [Google Scholar] [CrossRef]
- Huter, M.J.; Jensch, C.; Strube, J. Model Validation and Process Design of Continuous Single Pass Tangential Flow Filtration Focusing on Continuous Bioprocessing for High Protein Concentrations. Processes 2019, 7, 781. [Google Scholar] [CrossRef]
- Huter, M.J.; Strube, J. Model-Based Design and Process Optimization of Continuous Single Pass Tangential Flow Filtration Focusing on Continuous Bioprocessing. Processes 2019, 7, 317. [Google Scholar] [CrossRef]
- Huter, M.J. Modellunterstützte Prozessauslegung Unterschiedlicher Grundoperationen am Beispiel von Kontinuierlicher Ultrafiltration und absatzweiser Kristallisation. Doctor Thesis, Clausthal University of Technology, Clausthal, Germany, 2021. [Google Scholar]
- Thiess, H.; Leuthold, M.; Grummert, U.; Strube, J. Module design for ultrafiltration in biotechnology: Hydraulic analysis and statistical modeling. J. Membr. Sci. 2017, 540, 440–453. [Google Scholar] [CrossRef]
- Thiess, H. Modellierung von Membrantrennverfahren am Beispiel der Ultrafiltration in der Biotechnologischen und der Pervaporation in der Chemischen Verfahrenstechnik. Doctor Thesis, Clausthal University of Technology, Clausthal, Germany, 2019. [Google Scholar]
- Michaels, A.S. New separation technique for CPI. Chem. Eng. Prog. 1968, 64, 31. [Google Scholar]
- Food and Drug Administration. Pfizer-BioNTech COVID-19 Vaccine EUA Letter of Authorization reissued 05-10-2021. Available online: https://www.fda.gov/media/144412/download (accessed on 3 August 2022).
- Avery, H.E. Basic Reaction Kinetics and Mechanisms; Macmillan: London, UK, 1974; ISBN 0333126963. [Google Scholar]
- Drake, P.L.; Hartshorn, R.T.; McGinnis, J.; Sykes, A.G. pH dependence of rate constants for reactions of cytochrome c with inorganic redox partners and mechanistic implications. Inorg. Chem. 1989, 28, 1361–1366. [Google Scholar] [CrossRef]
- Ziegler, J.G.; Nichols, N.B. Optimum Settings for Automatic Controllers. J. Dyn. Syst. Meas. Control. 1993, 115, 220–222. [Google Scholar] [CrossRef]
- Zacher, S.; Reuter, M. Regelungstechnik für Ingenieure; Springer Fachmedien Wiesbaden: Wiesbaden, Germany, 2017; ISBN 978-3-658-17631-0. [Google Scholar]
- Chien, K.L.; Hrones, J.A.; Reswick, J.B. On the Automatic Control of Generalized Passive Systems. Trans. Am. Soc. Mech. Eng. 1952, 74, 175–185. [Google Scholar] [CrossRef]
- Daniel, S.; Kis, Z.; Kontoravdi, C.; Shah, N. Quality by Design for enabling RNA platform production processes. Trends Biotechnol. 2022. [Google Scholar] [CrossRef] [PubMed]
- Buschmann, M.D.; Carrasco, M.J.; Alishetty, S.; Paige, M.; Alameh, M.G.; Weissman, D. Nanomaterial Delivery Systems for mRNA Vaccines. Vaccines 2021, 9, 65. [Google Scholar] [CrossRef] [PubMed]
- Uhlenbrock, L.; Jensch, C.; Tegtmeier, M.; Strube, J. Digital Twin for Extraction Process Design and Operation. Processes 2020, 8, 866. [Google Scholar] [CrossRef]
- Lohmann, L.J.; Strube, J. Accelerating Biologics Manufacturing by Modeling: Process Integration of Precipitation in mAb Downstream Processing. Processes 2020, 8, 58. [Google Scholar] [CrossRef]
- Mouellef, M.; Vetter, F.L.; Zobel-Roos, S.; Strube, J. Fast and Versatile Chromatography Process Design and Operation Optimization with the Aid of Artificial Intelligence. Processes 2021, 9, 2121. [Google Scholar] [CrossRef]
- Klepzig, L.S.; Juckers, A.; Knerr, P.; Harms, F.; Strube, J. Digital Twin for Lyophilization by Process Modeling in Manufacturing of Biologics. Processes 2020, 8, 1325. [Google Scholar] [CrossRef]
- Schmidt, A.; Helgers, H.; Vetter, F.L.; Juckers, A.; Strube, J. Fast and Flexible mRNA Vaccine Manufacturing as a Solution to Pandemic Situations by Adopting Chemical Engineering Good Practice—Continuous Autonomous Operation in Stainless Steel Equipment Concepts. Processes 2021, 9, 1874. [Google Scholar] [CrossRef]
- Helgers, H.; Schmidt, A.; Strube, J. Towards Autonomous Process Control—Digital Twin for CHO Cell-Based Antibody Manufacturing Using a Dynamic Metabolic Model. Processes 2022, 10, 316. [Google Scholar] [CrossRef]
- Helgers, H.; Hengelbrock, A.; Schmidt, A.; Rosengarten, J.; Stitz, J.; Strube, J. Process Design and Optimization towards Digital Twins for HIV-Gag VLP Production in HEK293 Cells, including Purification. Processes 2022, 10, 419. [Google Scholar] [CrossRef]
- Helgers, H.; Hengelbrock, A.; Schmidt, A.; Vetter, F.L.; Juckers, A.; Strube, J. Digital Twins for scFv Production in Escherichia coli. Processes 2022, 10, 809. [Google Scholar] [CrossRef]
- Saied, A.A.; Metwally, A.A.; Dhawan, M.; Choudhary, O.P.; Aiash, H. Strengthening vaccines and medicines manufacturing capabilities in Africa: Challenges and perspectives. EMBO Mol. Med. 2022, 14, e16287. [Google Scholar] [CrossRef] [PubMed]
- Uli Beisel. BioNTainer–A Manufacturing Solution for Africa or Circumventing Capacity? Available online: https://www.medizinethnologie.net/biontainer-a-manufacturing-solution-for-africa-or-circumventing-capacity/ (accessed on 1 August 2022).


| Impact | Critical Quality Attribute (CQA) | Process Attribute |
|---|---|---|
| No Impact/Interaction | 1 | 1 |
| Minor Impact/Interaction | 4 | 2 |
| Major Impact/Interaction | 8 | 4 |
| In Vitro Transcription | Factor | Main Effect CQA (purity) | Main Effect PA (STY) | Highest Main Effect Score | Interaction | Interaction | Highest Interaction Score | Severity |
| CQA (purity) | PA (STY) | |||||||
| T7 conc | 1 | 1 | 1 | 4 | 4 | 4 | 4 | |
| NTP conc | 8 | 4 | 8 | 8 | 4 | 8 | 64 | |
| Cap-analog conc | 8 | 1 | 8 | 8 | 2 | 8 | 64 | |
| Template conc | 1 | 1 | 1 | 1 | 2 | 2 | 2 | |
| Temp | 8 | 4 | 8 | 4 | 1 | 4 | 32 | |
| pH | 8 | 4 | 8 | 4 | 1 | 4 | 32 | |
| VF tot | 1 | 4 | 4 | 8 | 4 | 8 | 32 | |
| L/D | 1 | 1 | 1 | 1 | 2 | 2 | 2 | |
| Inline Diafiltration SPTFF | Factor | Main Effect CQA (BE) | Main Effect PA (VCF) | Highest Main Effect Score | Interaction | Interaction | Highest Interaction Score | Severity |
| CQA (BE) | PA (VCF) | |||||||
| VF Feed | 8 | 2 | 8 | 4 | 2 | 4 | 32 | |
| mRNA conc | 2 | 2 | 1 | 2 | 2 | 2 | 2 | |
| SC conc | 2 | 2 | 1 | 2 | 2 | 2 | 2 | |
| Viscosity | 8 | 4 | 8 | 2 | 2 | 2 | 16 | |
| Fiber Diameter | 8 | 4 | 8 | 4 | 4 | 4 | 32 | |
| Fiber Length | 8 | 4 | 8 | 4 | 4 | 4 | 32 | |
| Fiber Count | 8 | 4 | 8 | 8 | 8 | 8 | 64 | |
| Rm | 8 | 4 | 8 | 2 | 2 | 2 | 16 | |
| TMP | 8 | 8 | 8 | 8 | 8 | 8 | 64 | |
| VF EB | 4 | 8 | 8 | 8 | 8 | 8 | 32 | |
| Lipid-Nanoparticle Formation | Factor | Main Effect CQA (EE) | Main Effect PA (cLNP) | Highest Main Effect Score | Interaction | Interaction | Highest Interaction Score | Severity |
| CQA (EE) | PA (cLNP) | |||||||
| mRNA conc | 8 | 2 | 8 | 4 | 2 | 4 | 32 | |
| mRNA Feed pH | 4 | 2 | 4 | 8 | 4 | 8 | 32 | |
| WR Lipids:mRNA | 8 | 4 | 8 | 4 | 4 | 4 | 32 | |
| w% ionizable Lipid | 8 | 4 | 8 | 4 | 4 | 4 | 32 | |
| w/w ion./PEG-Lipid | 8 | 4 | 8 | 2 | 2 | 2 | 16 | |
| w/w ion./help Lipid | 8 | 4 | 8 | 2 | 2 | 2 | 16 | |
| w/w ion./Chol. | 8 | 4 | 8 | 4 | 2 | 4 | 32 | |
| VF tot | 1 | 4 | 4 | 8 | 4 | 8 | 32 | |
| v/v aq/EtOH | 8 | 4 | 8 | 4 | 4 | 4 | 32 | |
| DV | 1 | 4 | 4 | 1 | 2 | 2 | 8 | |
| TMP | 1 | 4 | 4 | 1 | 1 | 1 | 4 |
| Process Variable | Disturbance | Fluctuation | Control Mechanism |
|---|---|---|---|
| pH | Decrease due to reaction | +0.1/−1 | Addition of base/buffer at predefined positions |
| Temperature | Ambient temperature change | ±0.5 °C | Adjust thermostat temperature |
| Mass Flow | Deviating pump speed | ±5% | Adjust pump speed |
| Master Mix | Deviating concentration(s) | ±10% | Adjust volumetric flow rate = residence time |
| Process Variable | Disturbance | Fluctuation | Control Mechanism |
|---|---|---|---|
| mRNA | Deviating concentration | ±10% | Adjust volumetric flow rate = residence time |
| Flow Rate Feed | Deviating pump speed | ±5% | Adjust pump speed |
| Flow Rate EB | Deviating pump speed | ±5% | Adjust pump speed |
| Permeate Flux | Decrease due to fouling | ±10% | Adjust TMP |
| Process Variable | Disturbance | Fluctuation | Control Mechanism |
|---|---|---|---|
| mRNA | Deviating concentration | ±10% | Adjust volumetric flow rate = residence time |
| pH aq. buffer | Deviating value | ±0.2 | Addition of acid/buffer |
| Lipids | Deviating concentration(s) | ±5% | Adjust volumetric flow rate = residence time |
| Flow Rate | Deviating pump speed | ±5% | Adjust pump speed |
| Dv | Deviating pump speed | ±5% | Adjust pump speed |
| Permeate Flux | Decrease due to fouling | ±10% | Adjust TMP |
Publisher’s Note: MDPI stays neutral with regard to jurisdictional claims in published maps and institutional affiliations. |
© 2022 by the authors. Licensee MDPI, Basel, Switzerland. This article is an open access article distributed under the terms and conditions of the Creative Commons Attribution (CC BY) license (https://creativecommons.org/licenses/by/4.0/).
Share and Cite
Schmidt, A.; Helgers, H.; Vetter, F.L.; Zobel-Roos, S.; Hengelbrock, A.; Strube, J. Process Automation and Control Strategy by Quality-by-Design in Total Continuous mRNA Manufacturing Platforms. Processes 2022, 10, 1783. https://doi.org/10.3390/pr10091783
Schmidt A, Helgers H, Vetter FL, Zobel-Roos S, Hengelbrock A, Strube J. Process Automation and Control Strategy by Quality-by-Design in Total Continuous mRNA Manufacturing Platforms. Processes. 2022; 10(9):1783. https://doi.org/10.3390/pr10091783
Chicago/Turabian StyleSchmidt, Axel, Heribert Helgers, Florian Lukas Vetter, Steffen Zobel-Roos, Alina Hengelbrock, and Jochen Strube. 2022. "Process Automation and Control Strategy by Quality-by-Design in Total Continuous mRNA Manufacturing Platforms" Processes 10, no. 9: 1783. https://doi.org/10.3390/pr10091783