1. Introduction
Tracing technology has been applied in the oil and gas industry for over 70 years. Materials used in the tracing technology include isotopes [
1], dyes [
2,
3], chemical tracers, microelements [
4], ions [
5], nanoparticles [
6], and gases, such as noble gases [
7].
They are used as monitoring and surveillance tools along with other methods, such as monitoring the production rate of reservoir fluids and using 4D seismic tests, to obtain information about reservoirs [
8]. Tracers provide very informative data, especially in the complex reservoirs where other techniques could be complicated to use. Obvious information available from tracers in downhole conditions includes direct proof of communication in the connected pore spaces of the reservoir, and the determination of the underground fluid’s direction pathways, oil saturation, and well-to-well connectivity. To obtain a better understanding of the formation, tracers are typically added to the injection fluids, water, or gas, to track the fluid movements inside or between reservoirs. Accordingly, tracers are commonly applied for two major types of oilfield tests—inter- and single-well tracer tests [
9].
A single-well tracer test (SWTT) is performed around the borehole area (up to 10 m) and involves an injection of partitioning tracer followed by it’s production after a certain shut-in time. During the shut-in period, the injected partitioning tracer is miscible with oil and water phases, and overcomes partial hydrolysis in the formation brine to form a secondary tracer that is miscible with only water. The differences in the arrival times of the partitioning and secondary tracers are proportional to the downhole ratios of oil and water phases. Such tests provide information on the residual oil saturation of the formation [
10,
11]. Additionally, the formation permeability profile along the borehole can be estimated via the single-well tracer method through an injection of tracers and analyzing their consequent in-situ measurements. This technique can be further applied for quality control over cementing and packing operations; by doing so, we can detect well leakage and formation fractures. Examples of compounds that are used for SWTT as a partitioning tracer include esters (such as ethyl acetate, propyl formate, etc.); water tracers, including dyes and alcohols (isopropanol, methanol, tritiated water, etc.); and gases (radon, carbon dioxide, noble gases, etc.) [
8].
The inter-well tracer test is performed as an injection of passive and partitioning tracers into the injection well, followed by the tracers’ propagation and monitoring of their production from the production well via produced fluids sampling and characterization. The propagation of partitioning tracers progresses with chromatographic retardation due to their equilibration with water and oil phases. These tests provide information on distant (hundreds of meters) inter-well space characteristics, such as reservoir residual oil saturation, communication between wells, reservoir porosity and heterogeneity, fluid flow paths, and hydraulic fracturing efficiency. Some examples of passive tracers used for inter-well tests include water-soluble chemicals [
8], such as solvents (methanol, ethanol,
n-/
iso-propyl alcohol, acetone); dyes (fluorescein, rhodamine); halogen and other ions (Cl
−, I
−, SCN
−, [Co(CN)
6]
3−), substituted benzoic- and fluorobenzoic acids; and isotopically labeled water (HTO, D
2O, H
218O).
tert-Butanol, 2-propanol, tritiated
n-butanol,
14C-tagged
iso-amyl alcohol and other C
4+ long-chained and branched alcohols can be mentioned as partitioning inter-well tracers [
9]. Non-partitioning inter-well tracer tests are valuable for well connectivity and fluids flow studies, and are performed through the injection of passive tags into an injection well (one specific tracer per one well), with their consequent detection and monitoring at the observation or production well [
12].
Along with conventional uses of tracing techniques for well production surveillance and fracturing monitoring, tracers can be applied for the tracking of the well’s drilling progress, drilled formation characterization, and mud-logging procedures. Thus, it was reported that the addition of tracers to drilling mud allows for the estimation of the formation’s water composition [
13]. Moreover, barcodable polymeric nanoparticles were applied for labeling of drill cuttings at the depth of their generation to improve the lithological characterization of formation and cuttings depth assignments [
5].
Efficient chemical tracers require indicators to be tracked by unique chemical compositions or properties. Thus, the identification of radioactive isotope tracers could be performed through their radioactivity via gamma-ray logging or scintillation counting; furthermore, the detection of gases, solvents, and alcohols could be performed by their standard retention times (RT) via gas chromatography (GC or GC-MS) and/or high-performance liquid chromatography (HPLC). Chemicals, such as fluorobenzoic acid derivatives, could be analyzed by fluorine–atom presence via nuclear magnetic resonance (NMR) and/or by molecular weight and RT via HPLC-MS. Ions are commonly monitored and quantified using ionic chromatography (IC); furthermore, heavy-atom- and metal-containing ions could be tracked by ICP-AES or ICP-MS. All named tracer-based well-monitoring methods require the usage of expensive equipment and often time-consuming and labor-intensive sampling, probe preparation, and analytical techniques.
The main purpose of the current work is to design easily detectable tags for drill-cuttings labeling. To develop a fast, efficient, and simple tracing method, we engineered a novel type of fluorescent tracers and aimed these tracers’ applications toward on-site near-real-time well-drilling monitoring to label drill cuttings as they are made at the drill-bit face; furthermore, we desired to improve the accuracy of drill-cuttings identification upon sorting at the shale shaker to improve on-site drill-cuttings depth correlation. Knowing the simplicity and very-low detection limits of fluorescent materials, we engineered several tracers composed of carrier-matrices that were doped or covalently modified with various commercial fluorophores to determine the robustness of these tracers for harsh downhole conditions and the possibility of their visual detection by fluorescent emissions under UV light.
2. Materials and Methods
2.1. Materials
We purchased fully hydrolyzed poly(vinyl alcohol) (PVA) (MW approx. 145,000); fluorescein isothiocyanate (FITC); fluorescein; rhodamine B; high-purity grade SiO2, average pore size 60 Å (52–73 Å), 70–230 mesh, 63–200 μm, for column chromatography; and HPLC-grade solvents, including methanol, propanol-2, dimethyl sulfoxide (DMSO), pyridine, tetrahydrofuran (THF), diethyl ether, from Sigma Aldrich (St. Louis, MO, USA). We purchased commercial super-absorbent polymer (SAP) based on sodium polyacrylate (Prod.# C001B1) from Orbeegun (Moscow, Russia). We purchased glutaraldehyde, 50% aqueous solution (Cat.# 00001602) from Ruschim (Moscow, Russia). We purchased chitosan (water-soluble, MW 50–80 kDa, degree of deacetylation DD 80%) from Bioprogress (Moscow, Russia). We purchased RADGLO® PS-11 green thermoset fluorescent pigment from Afaya (Moscow, Russia). We used all materials and solvents without further purification. We prepared all aqueous solutions with deionized water (18.2 MΩ*cm), Sartorius, Arium® (Göttingen, Germany).
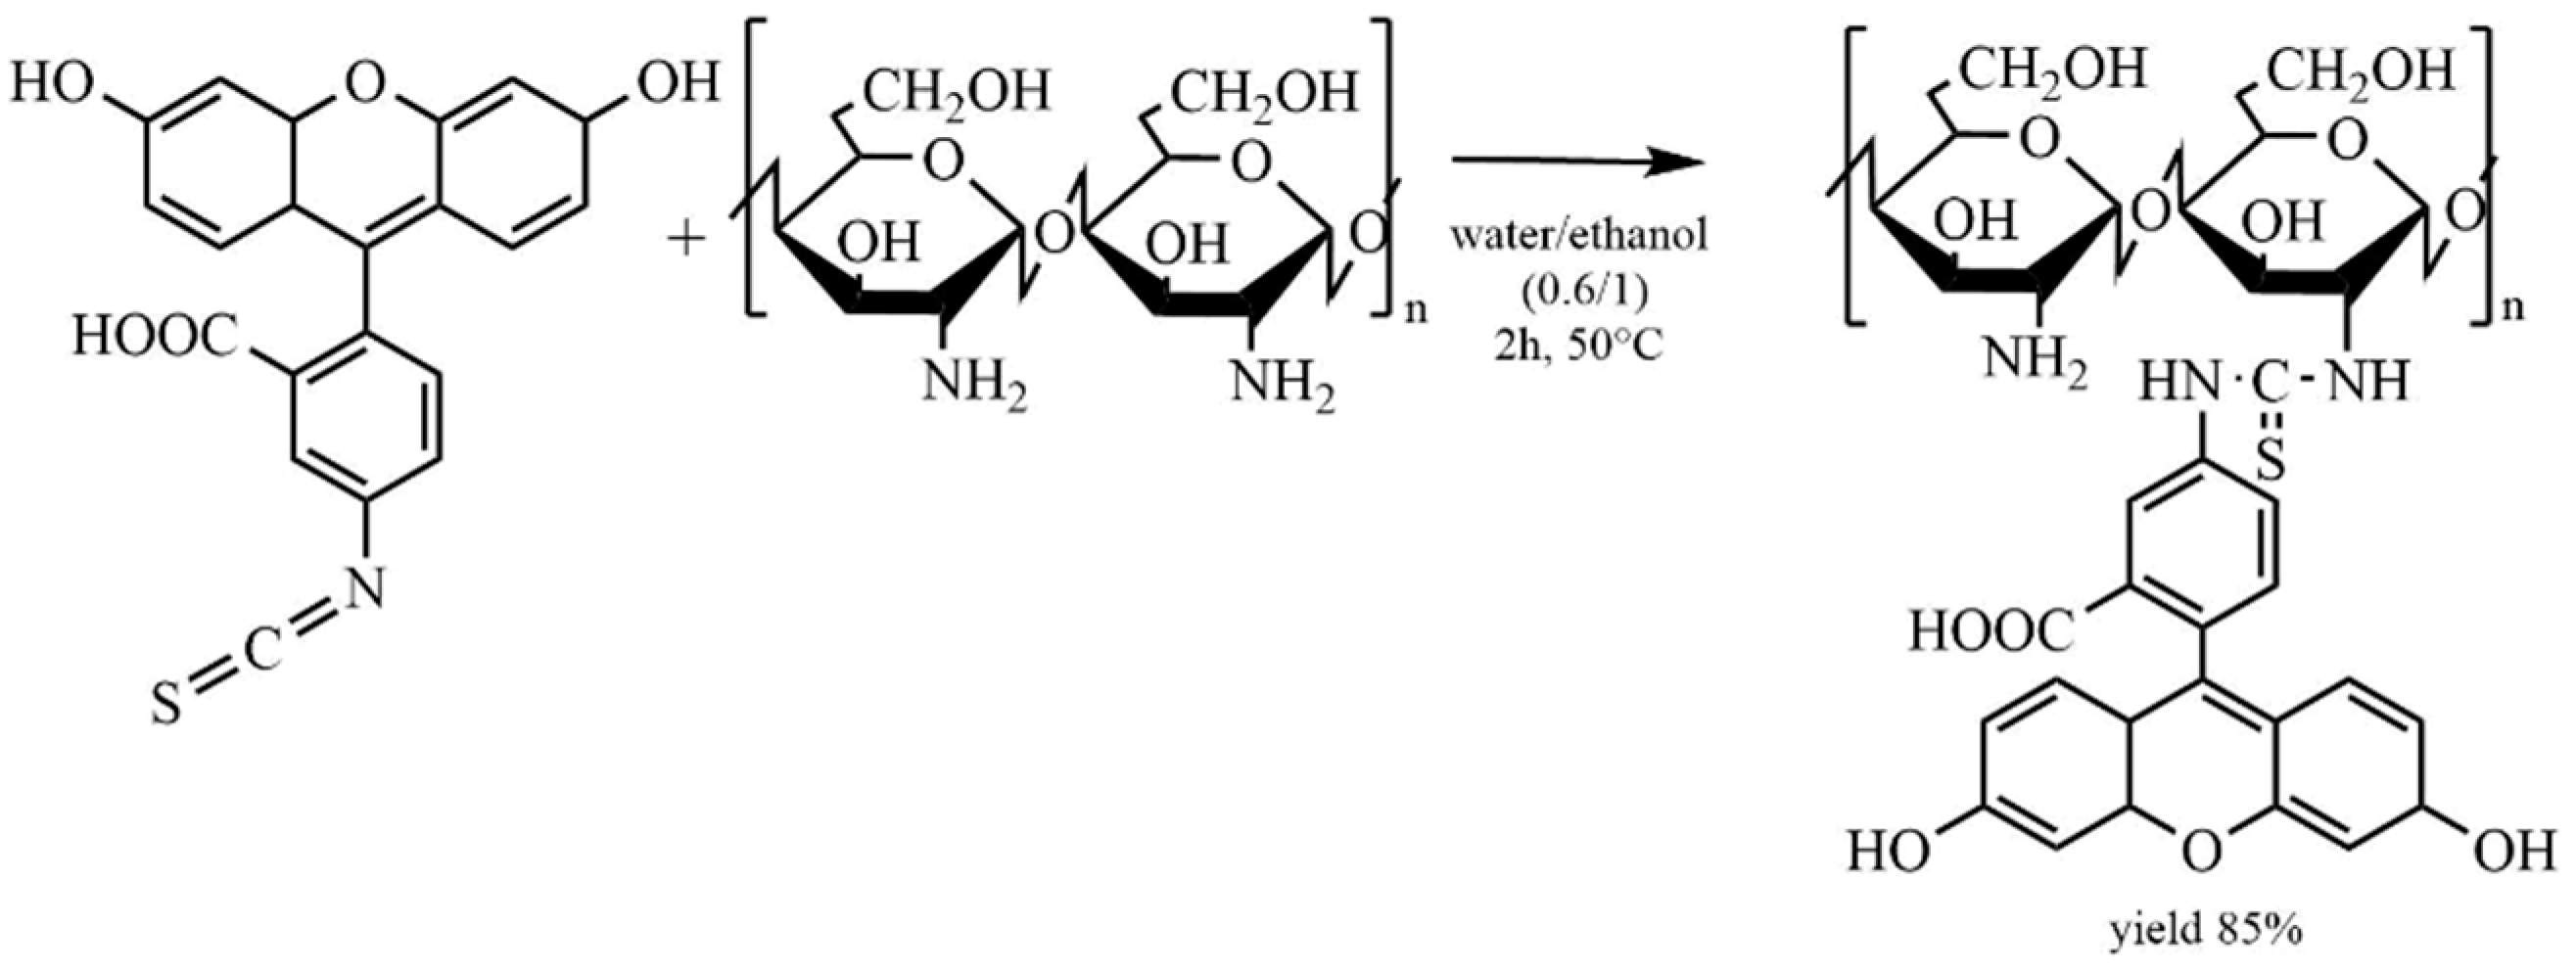
2.2. Synthesis of FITC-Labeled Chitosan
We dissolved chitosan (300 mg, 0.19 mmol) in water (15 mL) under vigorous stirring at room temperature (RT) over ~3 h. To obtain solution, we added fluorescein isothiocyanate (FITC) (1.48 mg, 0.0038 mmol) dissolved in ethanol (25 mL) dropwise. We chose the ratio of the reacting chemicals (FITC to d-glucosamine residue of chitosan) to be 1:50. We performed the reaction between fluorescein isothiocyanate and chitosan for 2 h at 50 °C in the dark to prevent fluorophore from photobleaching and yielded FITC-labeled chitosan. We precipitated the product from the reaction mixture with acetone (30 mL) and recovered by centrifugation. We performed purification of the obtained product by dispersing the resulted off-white solid in acetone (30 mL), followed by centrifugation (three times). We freeze-dried the resulted precipitate to remove residual water and yield light yellow powder of fluorescein-tagged chitosan (255 mg, 85%).
2.3. Synthesis of Pigment-Loaded Chitosan-Based Hydrogel
We dissolved chitosan (460 mg, 2.86 mmol) in water (19.54 mL) under vigorous stirring at RT over 3 h. We added commercial pigment (50 mg) in powder form to the obtained solution. The mass ratio of the pigment to chitosan was 1:10. We transferred the resulted mixture to a Petri dish followed by treating with 50% aqueous glutaraldehyde (0.2 mL, 1 mmol). We dried the produced hydrogel in a vacuum oven at 50 °C overnight to yield fine powder of cross-linked chitosan (600 mg, 98%).
2.4. Synthesis of FITC-Labeled PVA
We synthesized the PVA-FITC adduct as reported by Kaneo [
14]. We dissolved PVA (300 mg, 0.68 mmol) in dimethyl sulfoxide (DMSO) (8 mL) containing (50 μL, 0.63 mmol) of pyridine; then, we added solution of FITC (50 mg, 0.13 mmol) in DMSO (1 mL) and heated obtained mixture for 2 h at 95 °C in the dark (it was important to keep reaction in the dark to prevent FITC photobleaching). After 2 h, the reaction mixture cooled down to RT, and we added propanol-2 (30 mL) to remove excess of FITC into solution, and precipitate resulted in FITC-PVA adduct. We separated the solid product via centrifugation and further purified via dispersing in propanol-2 (30 mL) followed by centrifugation (three times until absence of the fluorescent signal of the supernatant solution in UV light). We transferred the resulted powder of the product to a beaker protected from light with aluminum foil and then dried in a vacuum oven at 40 °C overnight. We obtained FITC-labeled PVA as yellow powder (273 mg, 92%).
2.5. General Procedure for Preparation of Dye-Loaded Tracers (Super-Absorbent Polymer and SiO2)
We completely dissolved fluorescent dye (fluorescein or rhodamine B) (10 mg) in water (200 mL for SAP; 20 mL for SiO2) under vigorous stirring for 2 h at room temperature. To the obtained solution, we added SAP (5 g) or SiO2 (5 g) and kept the resulted mixture for 4 h at room temperature without steering to complete dye absorption into the matrix. Upon exposure to a dye solution, SAP or SiO2 particles soaked fluorophore. We dried the resulted wet tracers over 24 h at 70 °C under vacuum 10 mbar. We obtained four batches of fluorescein (or rhodamine B)-loaded SAP (or SiO2) with ratio of fluorophore to matrix 2 mg to 1 g.
2.6. Analytical Characterization of Obtained Materials
We registered FTIR spectra with Nicolet iS 50 Fourier transform infrared (FTIR) spectrometer (Waltham, MA, USA) using attenuated total reflection (ATR) sampling module in the range 4000–500 cm−1. We calibrated the instrument before sampling against clear and dry crystal surfaces. We registered thermogravimetry curves of samples on the TA TGA 5500 instrument (TA Instruments, New Castle, DE, USA) under nitrogen atmosphere at the temperature range from 25 to 400 °C and heating rate of 10 °C/min. We performed spectrofluorometric analysis on the Horiba FluoroMax-4 spectrofluorometer (Kyoto, Japan). We calibrated the instrument over deionized water; we performed sampling of the fluorescent dyes with deionized water solutions; and we performed sampling of the solids SAP and silica with dry materials.
We performed tracer chemical stability investigations via exposure of materials from 1 day to 1 week in five laboratory conditions mimicking downhole media. Tests included treatment of tracers with pure organic solvents, such as THF, diethyl ether, and diesel, as well as exposure of tracers to aqueous brines containing salts (1): NaCl (41.041 g/L), CaCl2 (2.384 g/L), MgCl2 (17.645 g/L), Na2SO4 (6.343 g/L), NaHCO3 (0.165 g/L); and brine (2): NaCl (150.446 g/L), CaCl2 (69.841 g/L), MgCl2 (20.396 g/L), Na2SO4 (0.518 g/L), NaHCO3 (0.487 g/L).
3. Results and Discussions
3.1. Preparation of Tracing Materials
To engineer efficient fluorescent tracers, we utilized a combinatorial chemistry approach for the preparation and selection of the best-performing combinations of fluorophores and carrier matrices. Knowing the possibility of aggregation-caused fluorescence-quenching fluorophores [
15], we proposed and fabricated several variants of fluorophore–matrix combinations that included covalent linkages between the matrix and fluorescent moiety that could be spatially tight, as well as the spatial compartmentalization of the fluorescent molecules within the cross-linked polymeric nets. Additionally, we investigated the possibility of loading fluorophores into the sorbent matrices with various ratios to estimate efficient fluorophore concentrations excluding aggregation-caused quenching.
Various matrices were studied for the trial loading of/modification with fluorophores, including silica, poly(vinyl alcohol), chitosan, and super-absorbent polymer (SAP) based on the sodium salt of poly(methyl acrylate). A number of fluorophores including fluorescein isothiocyanate, fluorescein, rhodamine B, and commercial pigments were used in the current investigation for matrices customization. Upon the development of the tracers, we chose two different approaches of matrix modification: the covalent binding of the fluorescent agents and the physical absorption of fluorophores into the carrier to result in fluorescence-bearing tags. These fluorescent-labeled/loaded tracers were subsequently used for chemical stability evaluations and fluorescence studies.
For the development of tracers by carrier modifications through a physical absorption, selected matrices (silica and sodium polyacrylate SAP) were soaked with an aqueous solution of fluorescent dyes (fluorescein, rhodamine B, and commercial pigments), followed by the drying of the resulted impregnated sorbents in a vacuum oven. Super-absorbent polymer was used as a matrix for tracers loaded with xanthene dyes—fluorescein and rhodamine B. Similarly, a SiO2 matrix was impregnated with fluorescein and fluorescent pigment.
To evaluate the efficiency of the chemical modification of the matrices, we chose readily available commercial polymers, such as chitosan and poly(vinyl alcohol), for treatment with fluorescein isothiocyanate. The FITC–chitosan adduct produced with a 50:1 molar ratio of the fluorophore-to-matrix loading (
Figure 1) exhibited a low intensity of fluorescent emission in the powder form and a high fluorescent emission in an aqueous solution, presumably due to the aggregation-caused fluorescent quenching [
16] at the solid state.
To overcome this drawback and produce an emissive tracer, tags based on chitosan loaded with 10 wt.% of fluorescent pigment and cross-linked with glutaraldehyde were synthesized (
Figure 2). The obtained cross-linked chitosan-network-bearing pigment demonstrated high fluorescent intensity, which was visible by the naked eye, both in the powder form and in aqueous suspensions.
Poly(vinyl alcohol) was modified with fluorescein isothiocyanate at a molar ratio of ~5:1 according to the published procedure [
15] (
Figure 3). Contrary to FITC–chitosan derivatives, the FITC-PVA adduct exhibited a high fluorescent intensity upon exposure to UV light, both in dry states and in aqueous dispersions. Unfortunately, this labeled polymer has low resistance to high temperatures and brines.
3.2. ATR-FTIR Characterization of Tracing Materials
All engineered tracing materials were characterized using ATR-FTIR spectroscopy to elucidate the molecular structure of products modified via fluorophores loading or covalent attachment.
3.2.1. ATR-FTIR Investigations of Chitosan-Based Tracers
The FTIR spectra of chitosan-based tracers are represented in
Figure 4. The FTIR spectrum of starting chitosan shows a broad absorption band at 3451 cm
−1, attributed to O-H stretching vibrations, which overlaps the N-H stretching at the same region. Bands at 2931–2925 cm
−1 represent C-H stretching vibrations of aliphatic CH bonds of polysaccharide cycles and methylene groups. The band at 1635 cm
−1 represents the N-H bending vibration. The bands at 1167 cm
−1 and 1045 cm
−1 are attributed to C-O-C stretching vibrations of the glycoside link and chitosan ring.
Similarly, the FTIR spectrum of the hydrogel based on chitosan cross-linked with glutaraldehyde exhibits broad absorption bands at 3417 cm
−1, representing overlapping O-H and N-H stretching vibrations; furthermore, bands at 2930–2925 cm
−1 are attributed to the C-H vibrations of the CH and methylene groups. Absorption bands at 1167 cm
−1 and 1028 cm
−1 are attributed to the C-O-C bond vibrations of the glycoside link and chitosan ring. Contrary to the starting material, the N-H bending vibration band of the amine group at ~1630 cm
−1 diminished in intensity, and an additional band attributed to the C=N vibrations of the imine group [
17] appeared at 1652 cm
−1, confirming the formation of cross-linked structures upon the reaction of the chitosan amino group with glutaraldehyde.
Elucidating the structure of the FITC–chitosan adduct, we noted characteristic bands at 3417 cm−1 attributed to O-H and N-H stretching vibrations, and absorption bands at 2930–2925 cm−1, which were attributed to the C-H vibrations. Moreover, additional absorption peaks appeared at 1594 cm−1, 1535 cm−1, and 1458 cm−1, which are representative of the stretching vibrations of C=C bonds in the aromatic rings of the FITC moiety. Noticeably, an additional N-H bending vibration band appeared at 1640 cm−1, compared to and in addition to the amine group’s bending vibration of pure chitosan at 1630 cm−1, confirming the partial modification of the NH2 residue. A small band from the lactone carbonyl group appeared at 1727 cm−1, which was attributed to lactone forming the FITC moiety. The strong band at 1050 cm−1 can be attributed to C=S group vibrations formed upon the covalent attachment of the fluorescein isothiocyanate group to the chitosan amino function.
3.2.2. ATR-FTIR Spectroscopy of Poly(Vinyl Alcohol)-Based Tracers
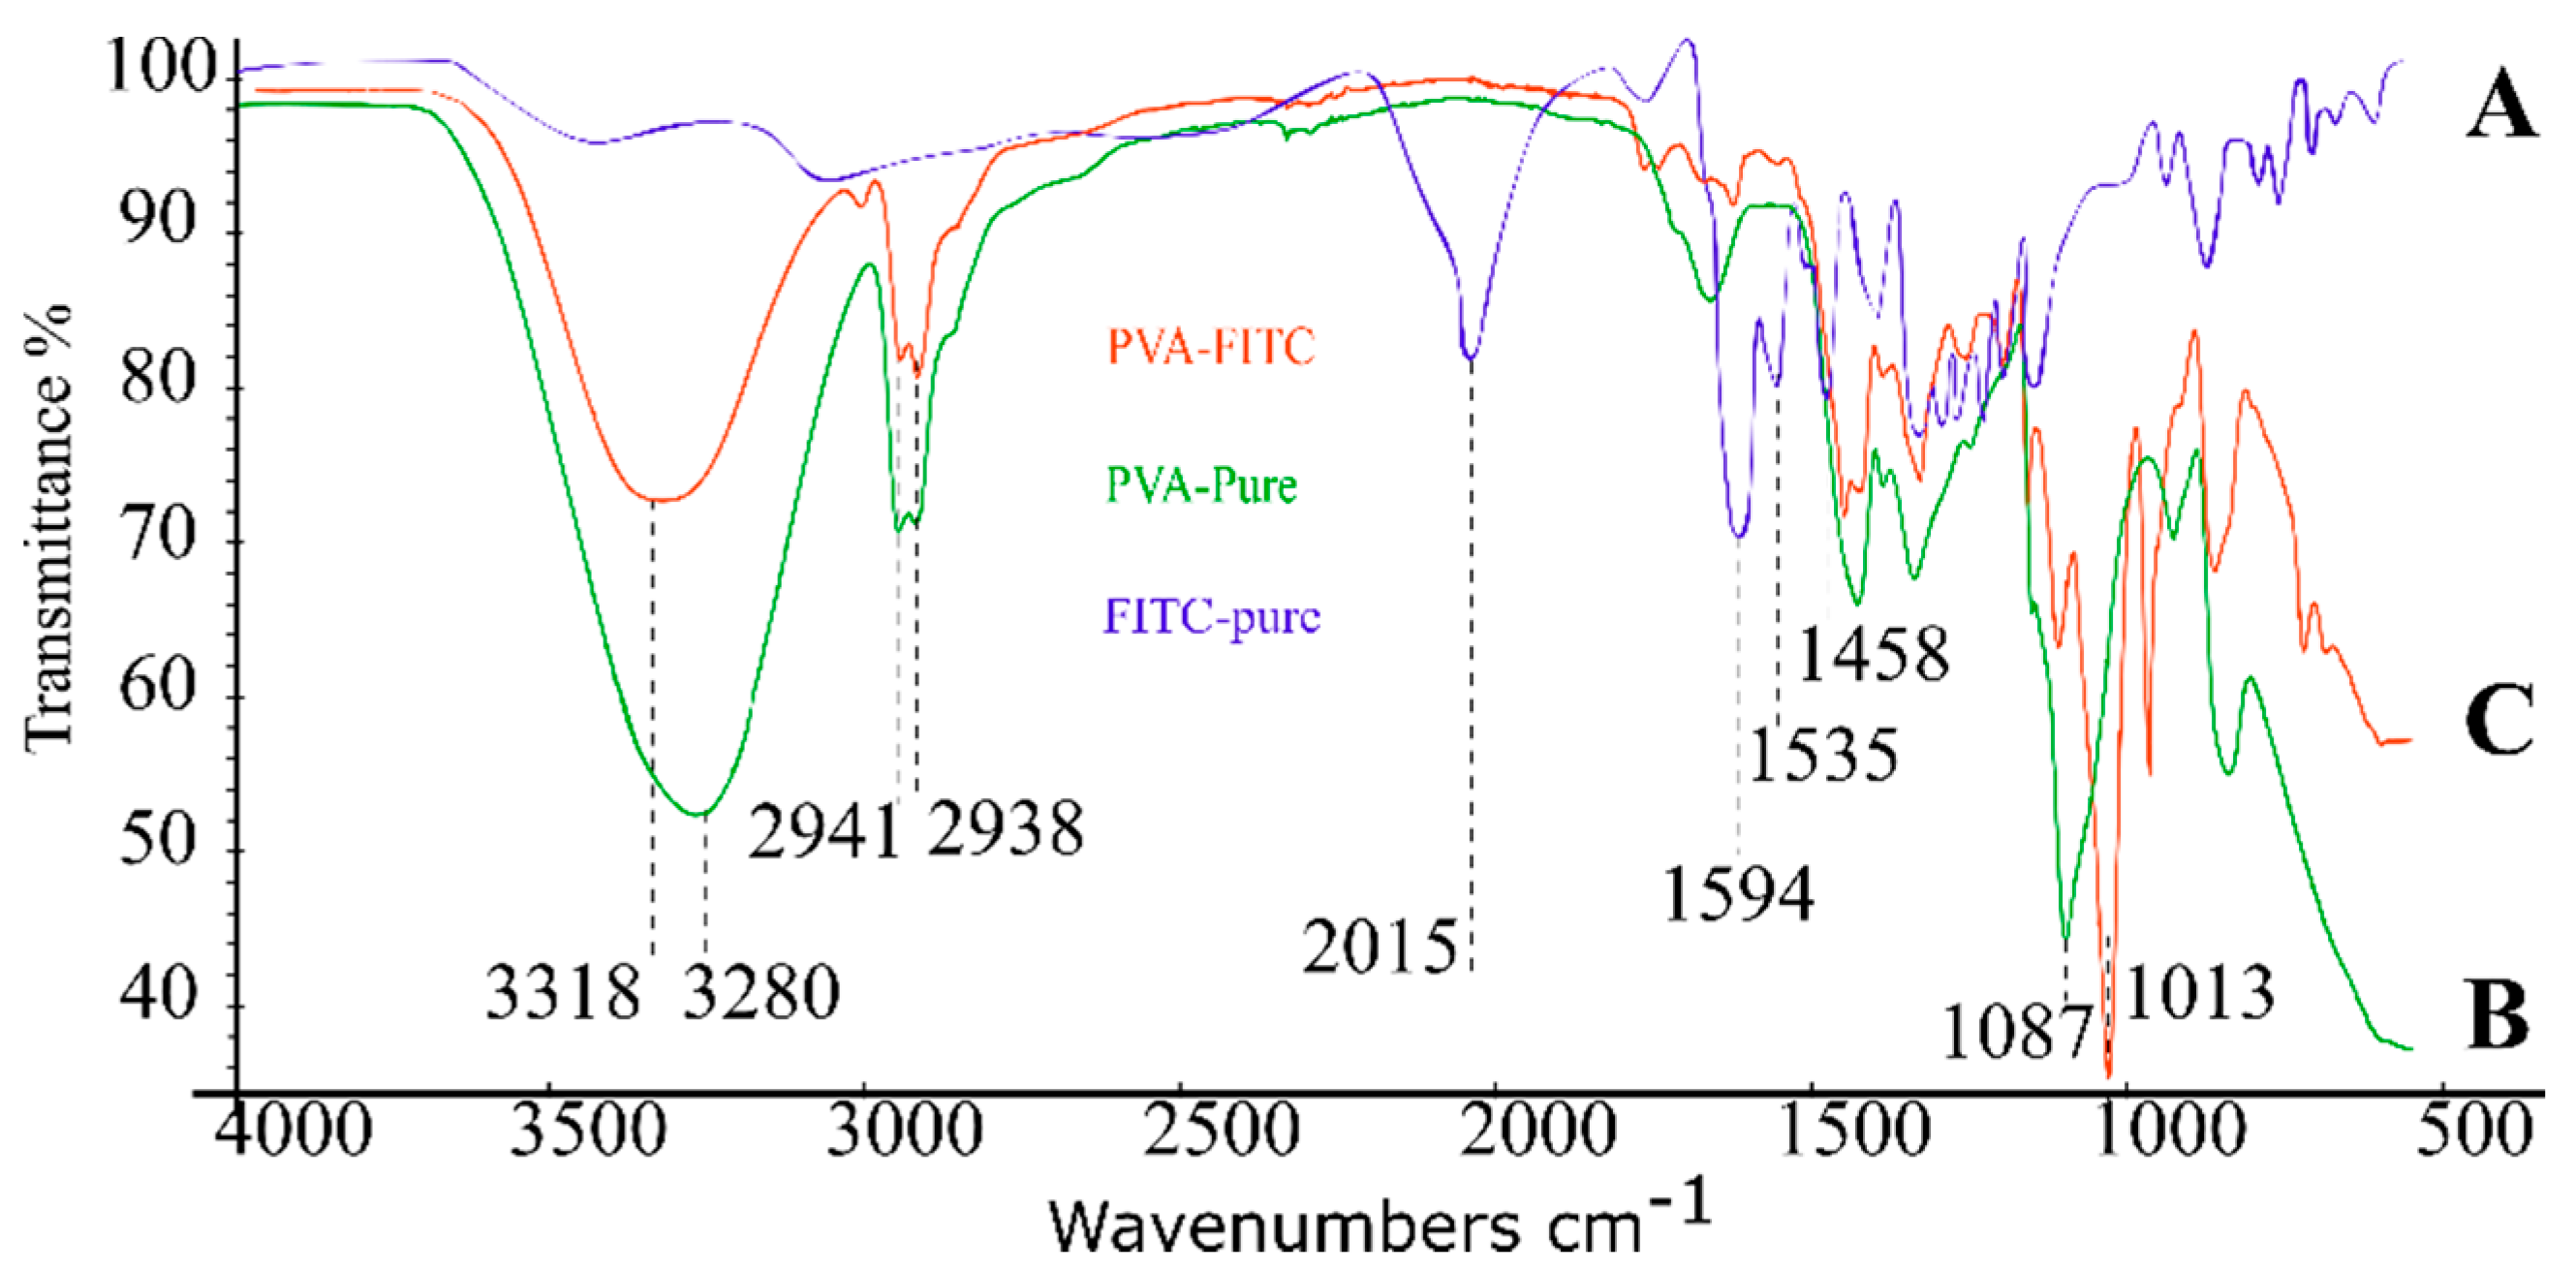
To confirm the chemical modification of PVA with FITC, we registered the FTIR spectra of the starting polymer, fluorescent dye, and resulted FITC-PVA product (
Figure 5). The ATR-FTIR spectrum of pure FITC demonstrates a strong absorbance peak at 2015 cm
−1, which is characteristic of the isothiocyanate functional group. Absorption peaks at 1594 cm
−1, 1535 cm
−1, and 1458 cm
−1 are representative of the stretching vibrations of the C=C bonds of aromatic cycles. A comparison of the spectra of the PVA-FITC adduct and pure FITC shows the absence of absorption at 2015 cm
−1 and indicates that isothiocyanate was fully converted upon the modification of poly(vinyl alcohol). The spectra B and C (
Figure 5) show strong broad absorbance bands at 3288 cm
−1 for pure PVA, and 3318 cm
−1 for the FITC-labeled derivate. These bands are assigned to the O-H stretching vibrations of the hydroxyl group of PVA, and this band shows a reduced intensity in the FITC adduct of PVA, confirming that the hydroxyl group was involved in the addition reaction with isothiocyanate. Bands corresponding to the C-H asymmetric stretching vibrations of the CH
2 group occur at 2938 cm
−1 and 2941 cm
−1, both for the starting polymer and for FITC-modified PVA. The sharp band 1087 cm
−1 corresponds to the C-O stretching of the secondary alcohol groups present on the PVA and FITC-PVA derivatives; furthermore, an additional absorbance band appeared in the spectrum of the FITC-modified PVA at 1013 cm
−1, which was attributed to the newly formed C=S bond of the FITC adduct.
3.2.3. ATR-FTIR Characterization of Sodium Polyacrylate-Based Tracers
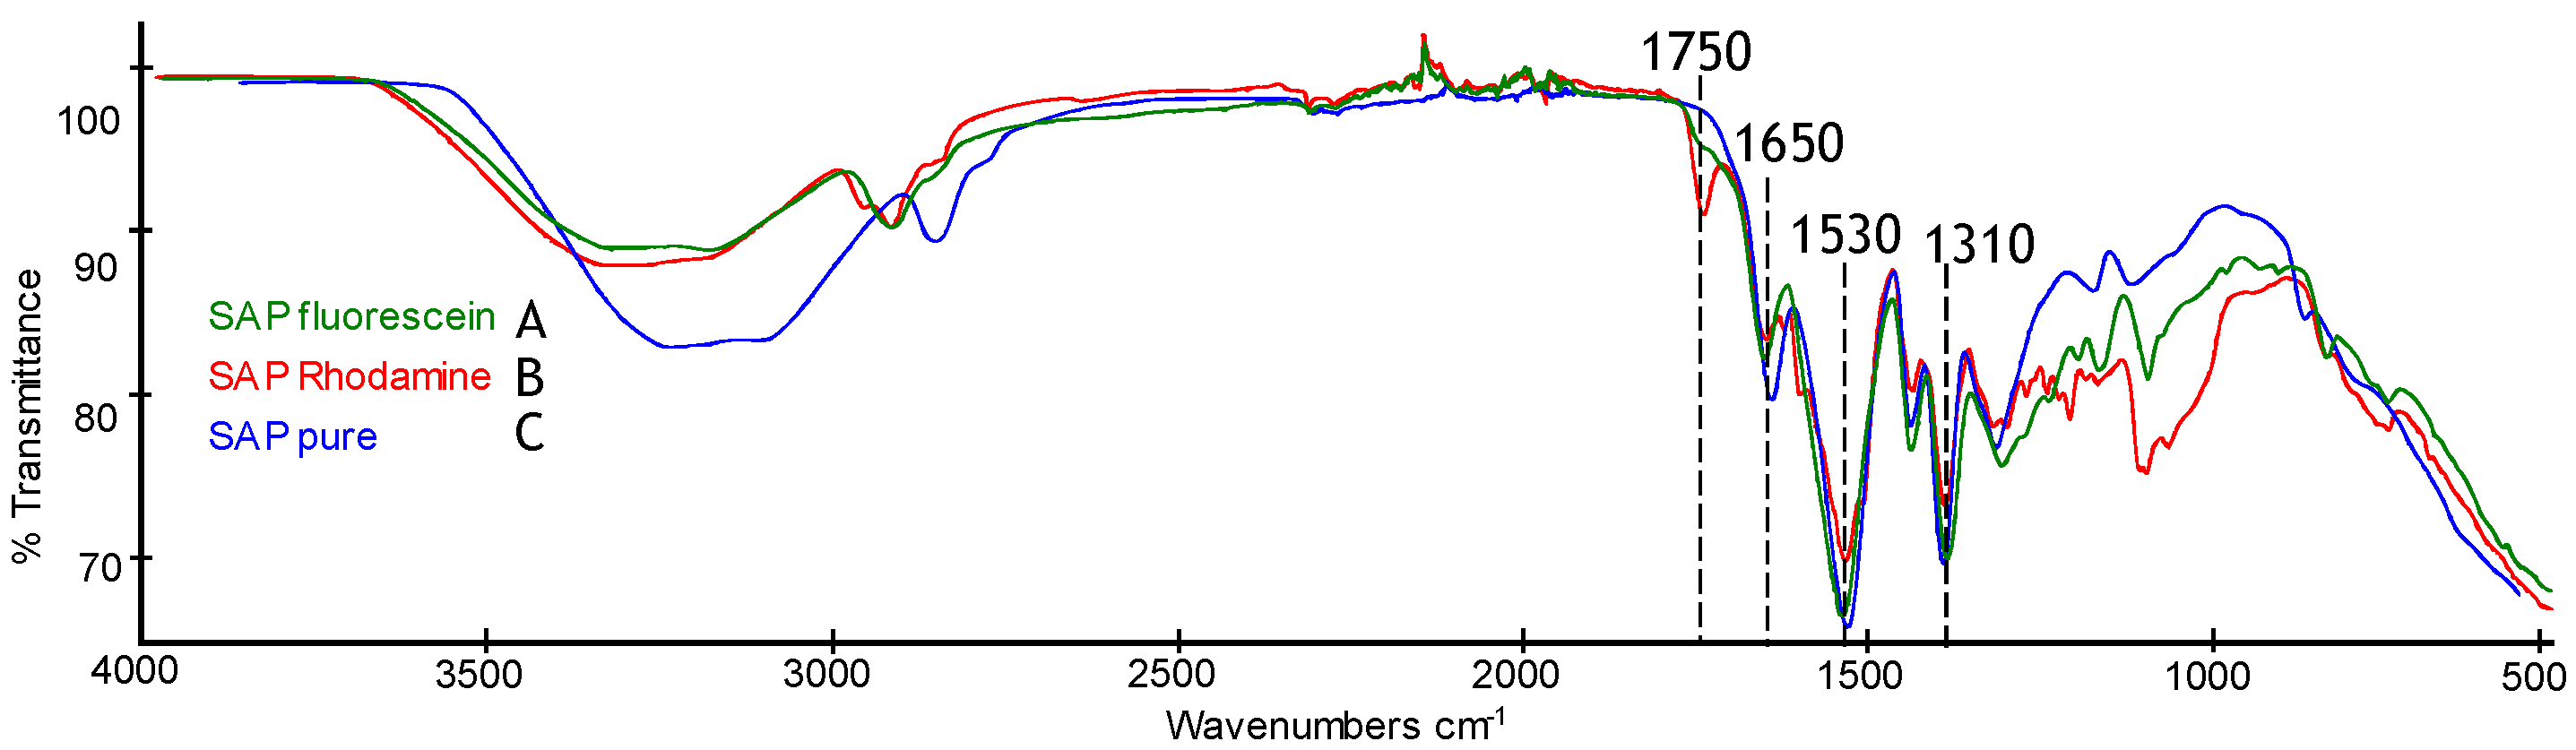
The FT-IR spectra of the tracers based on sodium polyacrylate before and after loading fluorescent dyes are represented in
Figure 6. The spectrum of pristine SAP exhibits a strong broad absorption area around 3400–3100 cm
−1, which corresponds to the stretching vibrations of the hydroxyl groups from adsorbed water. Shoulder bands around 2800 cm
−1 are attributed to the C-H asymmetric stretching vibrations of polymeric-chained CH and CH
2 groups. A characteristic absorption band at 1650 cm
−1 is attributed to the deformation vibrations of the C-OH group. Bands at 1530 cm
−1 and 1310 cm
−1 are typical for salts of carboxylic acids [
18] and are attributed to the symmetrical stretching vibrations of carboxyl anions –COO
−. Upon impregnation of the SAP sorbent with xanthene dyes, the novel bands appear at 1750 cm
−1, which is attributed to the -C=O vibrations of the carbonyl fragment of the lactone form of fluorescein and rhodamine B.
Presumably, the adsorption of dyes as fluorescein and rhodamine B into the SAP matrix is associated with electrostatic acid–base interactions between the guest dye molecule and polar functional groups of the carrier matrix. At a steady state, the equilibrium between the acid and base forms of the dye will be reached, and both spirolactone and opened dye structures will be presented in the matrix. Tautomeric forms of lactone rhodamine B base and opened rhodamine B acid are represented in
Figure 7.
3.2.4. ATR-FTIR Spectra of Silica-Based Tracers
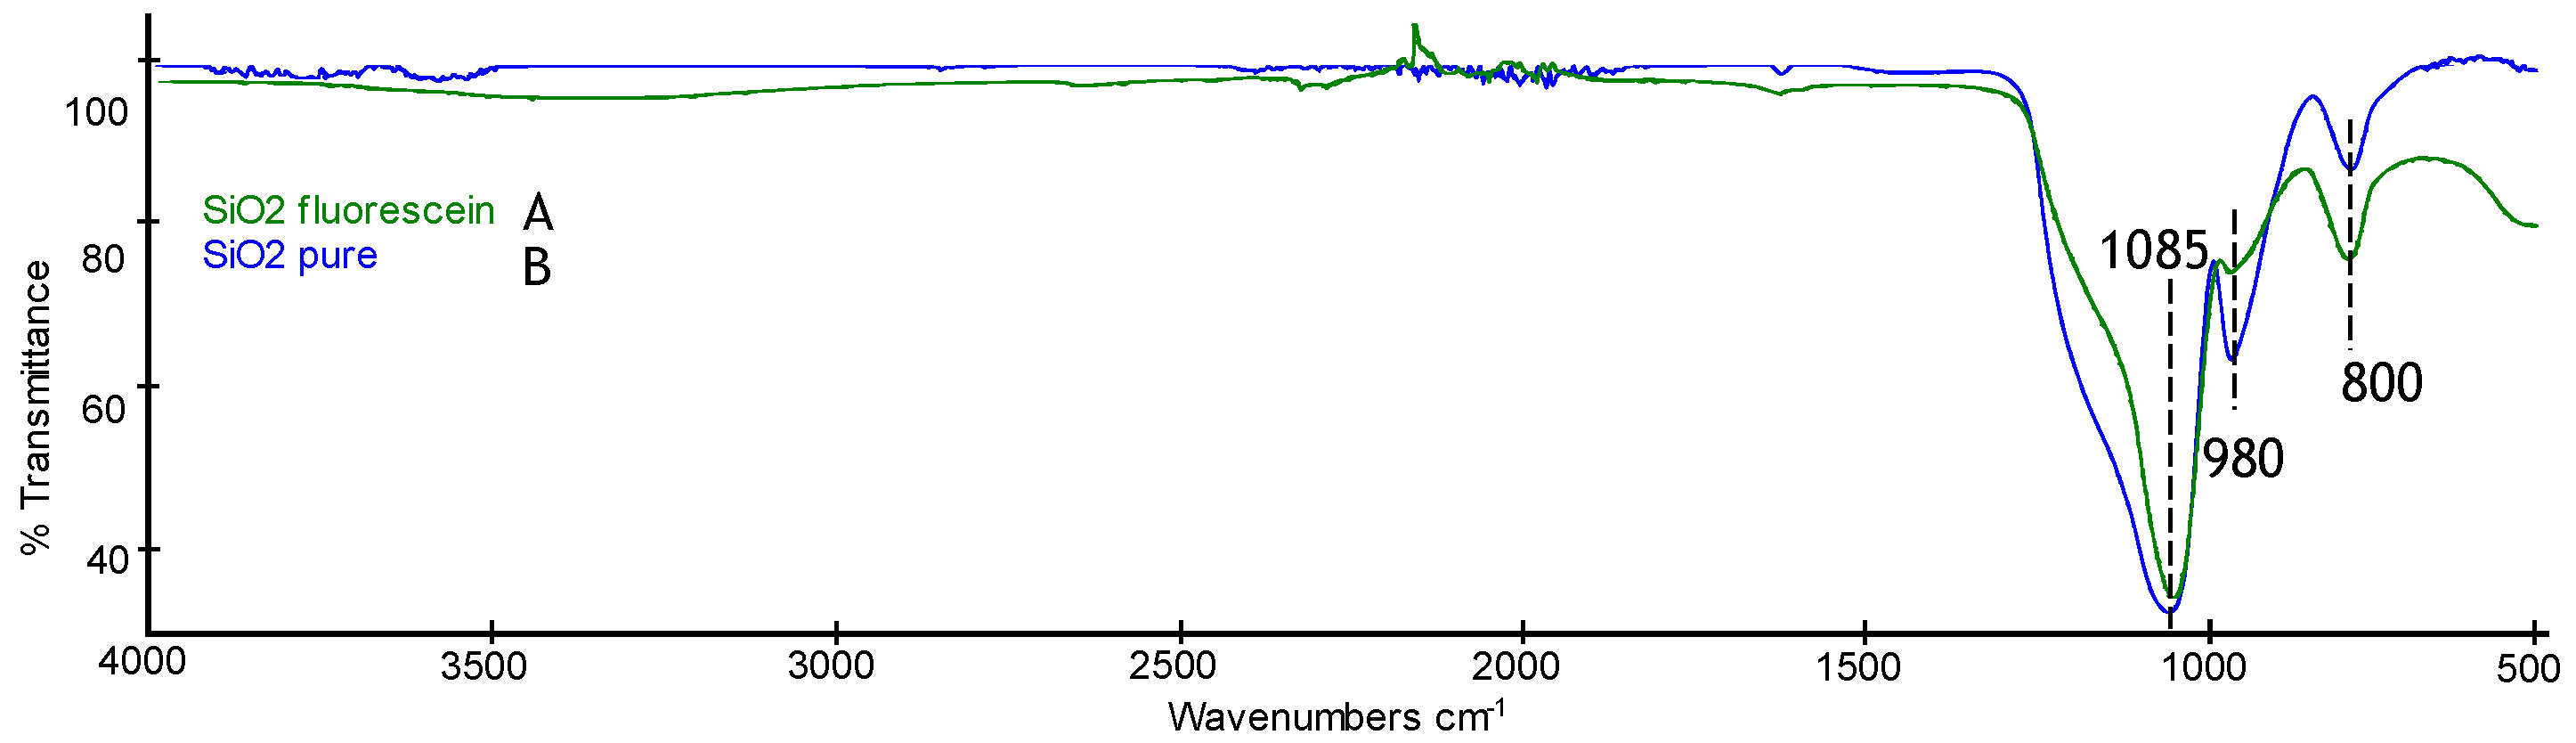
We examined the loading of the silica-based matrix with xanthene dyes and presented the FTIR spectra of the pure and fluorescein-loaded SiO
2 in the range of 4000–500 cm
−1 in
Figure 8. Both spectra exhibited characteristic peaks for silica at 800, 980, and 1085 cm
−1 owing to Si-O-Si symmetric stretching, Si-OH stretching, and Si-O-Si asymmetric stretching vibrations, respectively [
19]. Due to the low molar ratio of SiO
2 to fluorescein, there were almost no detectable differences in the spectra of the initial and dye-loaded samples. Other than that, the porosity and non-transparent structures of the matrix can impede the detection of dye inside SiO
2-based tracers by ATR-FTIR. The successful loading of silica with fluorescein was confirmed via UV–Vis fluorescence spectroscopy.
3.3. Chemical Stability Examination of Tracers
For the application of engineered tracers for downhole operations, we screened obtained materials for their chemical stabilities to sour media, and treated them with formation fluids. For this goal, tracer samples were exposed to acidic aqueous solutions with pH~1. Chitosan-based materials exhibited fast degradation upon acid treatment and were detached from further tests as chemically unstable tracer carriers.
The remaining materials were further tested for stability to the conditions mimicking downhole media. Thus, samples of fluorescent-loaded tags were incubated at 90 °C with aqueous brines containing formation salts NaCl, CaCl
2, MgCl
2, Na
2SO
4, and NaHCO
3 for a period of 1 day up to 1 week. Degradation via hydrolysis was noted for fluorescent-modified poly(vinyl alcohol) upon exposure to electrolyte solutions over a few hours. Fluorescein and fluorescent-pigments-loaded silica (Flu-SiO
2), as well as xanthene-dyes-loaded super-absorbing polymer (Flu-SAP), exhibited no visible decomposition and demonstrated almost no leakage of dyes at the described conditions. Consequently, these stable matrices (Flu-SiO
2, Flu-SAP) were further tested for resistance to organic solvents (THF, ether, and diesel). Among the materials tested for exposure to organic media, fluorescein- and rhodamine B-loaded SAPs, fluorescein, and pigments-loaded SiO
2 exhibited no visible deterioration of their fluorescent properties.
Table 1 summarizes the results of these investigations.
3.4. Investigation of the Thermal Stability of Tracers by TGA
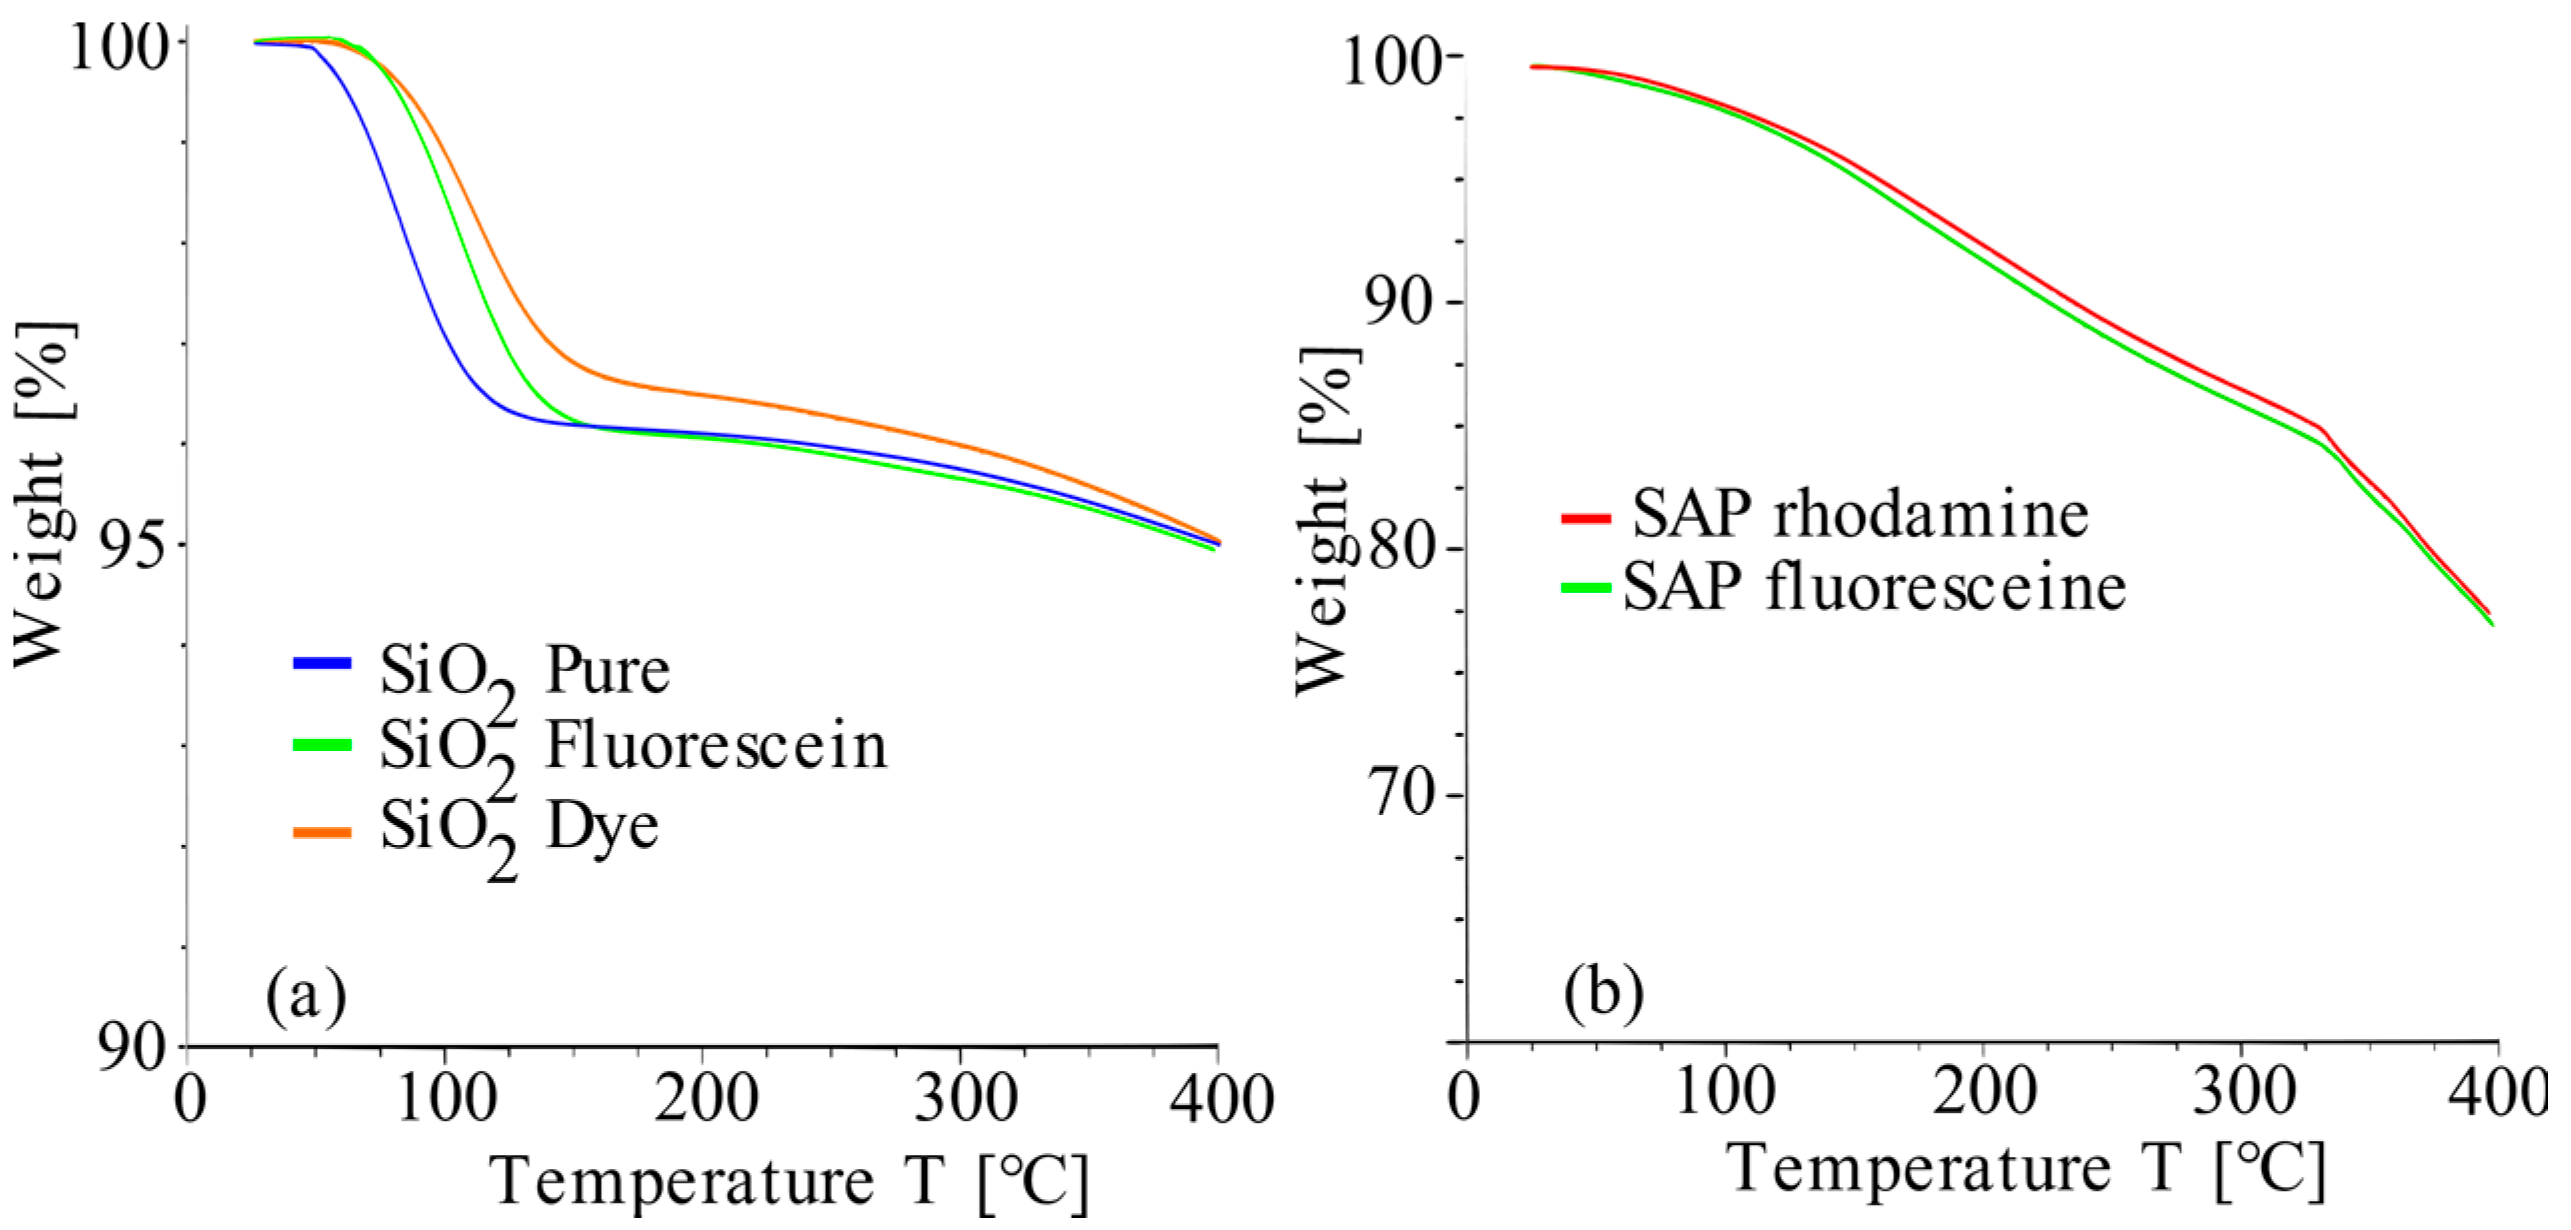
To evaluate the thermal stability of the selected tracers, we performed a TGA monitoring of the samples’ weight losses upon heat treatment from RT to 400 °C at a heating rate of 10 °C/min in a nitrogen atmosphere. As shown in
Figure 9a, the TG curves of silica-based tracers, as well as the pure silica, exhibited weight losses of about 5 wt. % upon exposure to 100 °C temperatures; further they kept almost a constant mass. All curves in
Figure 9a demonstrated similar behaviors; moreover, the highest weight losses occurred at the temperature range of 20–150 °C and corresponded to the loss of absorbed water.
Figure 9b represents the TG curves of super-absorbent-based tracers. The total gradual weight losses of the SAP-tracers at the temperature range of 20 to 400 °C reached up to 22–23%. A sharp inflection could be noted at 315 °C, which is attributed to the degradation of dyes.
Table 2 summarizes TG total weight losses of selected tracers and indicates limits of the thermal stability of chosen specimens. Thus, tracers based on super-absorbent polymers loaded with xanthene dyes are relatively stable up to 170 °C, showing no deterioration of fluorescent properties. Silica-based tracers are even more robust during high temperature exposure.
3.5. Fluorescence Spectroscopy Characterization of Selected Stable Tracers
The fluorescent behaviors of fluorescein- and rhodamine B-loaded tracers were explored using UV–Vis fluorescence spectroscopy. Excitation and emission wavelengths were recorded for SAP–rhodamine B-, SAP–fluorescein-, and silica–fluorescein-loaded tracers and compared with published data because the photochemical properties of xanthene dyes are sensitive to the measurements medium [
20]. Tracers based on SAP–rhodamine B demonstrated standard maxima excitation and emission wavelengths (λ
Ex 560 nm; λ
Em 590 nm) characteristic of rhodamine B (λ
Ex 554 nm, λ
Em 578 nm, [
20]) without much deviation because of the interactions of the dye with the matrix. Similarly, tracers based on silica loaded with fluorescein demonstrated excitation and emission wavelengths (few peaks at λ
Ex 470–491 nm; λ
Em 515 nm) corresponding to the literature [
21] (λ
Ex 488 nm; λ
Em 515 nm). Deviation from the standard values was detected only for SAP loaded with fluorescein (λ
Ex 462 nm; λ
Em = 545 nm), presumably due to the basic pH of the sodium polyacrylate matrix.
Figure 10 summarizes the emission and excitation spectra for SAP and SiO
2 matrices loaded with fluorescent agents.
3.6. Applications of Tracers in Drill-Cuttings Tagging
Selected fluorescent tracers stable to downhole conditions, namely, SAP–fluorescein-, SAP–rhodamine B-, and silica–fluorescein-loaded tags, were tested for their ability to label drill cuttings with further camera detection in laboratory conditions. For this goal, samples of the drilling cuts were collected from the oil fields and mixed with the selected tracer, and pictures of the tagged cuts under day and UV light were recorded via camera (
Figure 11).
The library of pictures of tagged drilling cuts is further used for the development of an image recognition system. It is noted that tracers based on silica–fluorescein were barely detectable by the camera as a separate particle, both at day and UV light, due to their small sizes of 60–200 µm; however, SAP-dyes-loaded tags of 0.5–1 mm in size were detectable with a camera under UV light upon drill-cuttings labeling. These obtained SAP-based tracers were clearly visible after mixing with drill-cuttings samples, especially under UV light. This type of tag is primary selected for drill cuttings colored tagging according to the depth of the mud-cuttings on circulation prototype equipped with the shale shaker and UV camera. Recorded photographs and videos of tagged formation cuts are used for the further engineering of camera-detection- and AI-based image recognition systems, and consequent field trials are currently ongoing.


