Article

Determination of the Plastic Stress–Strain Relationship of a Rupture Disc Material with Quasi-Static and Dynamic Pneumatic Bulge Processes

School of Chemical Engineering, Dalian University of Technology, Dalian 116024, China
*
Author to whom correspondence should be addressed.
Processes 2022, 10(8), 1463; https://doi.org/10.3390/pr10081463
Submission received: 29 June 2022 / Revised: 23 July 2022 / Accepted: 23 July 2022 / Published: 26 July 2022

Abstract

:
Rupture discs, manufactured using a hydraulic or pneumatic bulge process, are widely used to protect vessels from over-pressuring. The stress–strain relationship of the material in the bulge process plays a major role in understanding the performance of rupture discs. Moreover, both the theoretical analyses and numerical simulations of rupture discs demand a reliable stress–strain relationship of the material in a real bulge process. In this paper, an approach for determining the plastic stress–strain relationship of a rupture disc material in the bulge process is proposed based on plastic membrane theory and force equilibrium equations. Pressures of compressed air and methane/air mixture explosions were used for the bulge pressure to accomplish the quasi-static and dynamic bulge processes of tested discs. Experimental apparatus for the quasi-static bulge test and the dynamic bulge test were built. The stress–strain relations of 316L material during bulge tests were obtained, compared, and discussed. The results indicated that the bulge height at the top of the domed disc increased linearly with an increase in bulge pressure in the quasi-static and dynamic bulge processes, and the effective strain increased exponentially. The rate of pressure rise during the bulge process has a significant effect on the deformation behavior of disc material and hence the stress–strain relationship. At the same bulge pressure, a disc tested with a larger pressure rise rate had smaller bulge height and effective strain. At the same effective stress at the top of the domed disc, discs subjected to a higher pressure rise rate had smaller effective strain, and hence they are more difficult to rupture. Hollomon’s equation is used to represent the relationship between the effective stress and strain during bulge process. For pressure rise rates in the following range of 0 (equivalent to quasi-static condition), 2–10 MPa/s, 10–50 MPa/s, and 50–100 MPa/s, the relation of stress and strain is σe = 1259.4·εe0.4487, σe = 1192.4·εe0.3261, σe = 1381.2·εe0.2910, and σe = 1368.4·εe0.1701, respectively.

1. Introduction

Rupture discs (also called bursting disks) are widely used in many industries [1,2]. They are designed to rupture at a predetermined pressure in order to protect vessels from over-pressuring. Normally, rupture discs are pre-bulged during manufacture by using a hydraulic or pneumatic bulge process described below [3,4,5,6]. First, a thin metallic flat disc is clamped peripherally. Then pressure is applied to one side of the disc. The thin disc arches gradually with the increase of pressure. After the pressure is released, the thin disc keeps the domed shape due to the irreversible plastic deformation of the metallic material.
After a rupture disc is manufactured, it can be used in two ways according to the direction of the working pressure [7,8]. When the working pressure is applied to the concave side of a rupture disc, it is called a conventional domed rupture disc (forward acting), which bursts due to tensile stresses. By contrast, when working pressure is applied to the convex side of a rupture disc, it is called a reverse domed rupture disc (reverse acting), which acts due to buckling. No matter what kind of rupture disc is used, rupture at the predetermined pressure (called bursting pressure) is the most important performance [9,10,11]. Thus, an understanding the relations between bursting pressure and all influencing factors is the emphasis of rupture disc studies [12,13,14].
The stress–strain relationship of a rupture disc material plays a major role in understanding the performance of rupture discs, and it is of paramount importance to the success of the bulge process. Previous studies have revealed that the stress–strain relationship representing a material’s property significantly affects internal stress, bulge height, bulge profile, and disc thickness during the bulge process, and hence it affects the bursting performance of rupture discs [15]. In addition, both the theoretical analyses and the numerical simulations demand a reliable stress–strain relationship of a material in order to describe the plastic deformation behavior during the bulge process. Especially in simulations, the accuracy of numerical results strongly depends on the real stress–strain relationship of a material [16].
Normally, rupture discs are made of metallic material. Numerous studies have been performed on how to determine the stress–strain relationship of metallic material under various conditions [17]. Due to its simple and easy implementation, the uniaxial tensile test method was first developed, and it has become the most popular method. However, later studies proved that numerical results could have unacceptable discrepancies when the stress–strain relationship tested by the uniaxial tensile method was used [18]. The reason for this is that the stress state in the bulge process is a biaxial stress state, which is different from the uniaxial stress state in the uniaxial tensile test. Some researchers have proposed a biaxial tensile test and a multiaxial tensile test to obtain the reliable stress–strain relationship of a material under some other conditions [19]. However, more studies need to be performed on the stress–strain relationship of rupture disc materials with a real bulge process.
Among all these stress–strain tensile tests, the pressure applied to a material specimen is quasi-static, neglecting the dynamic effect. In other words, the pressure rise rates in these tests are small, so their effect on the stress–strain relationship of the material is neglected. However, in working conditions where rupture discs are installed, dynamic overpressure conditions, with large pressure rise rates, usually occur when an explosion or a runaway reaction happens [20]. Thus, the focus needs to be on the stress–strain relationship of rupture disc materials with a dynamic bulge process. However, there are no studies available on this subject now.
The objective of this work is to present an approach for determining the stress–strain relationship of a rupture disc material with quasi-static and dynamic pneumatic bulge processes. This paper is organized as follows: First, methodology on how to calculate stress and strain data from measurable parameters is established. Then, quasi-static and dynamic pneumatic bulge experimental apparatuses are built in order to collect the measurable parameters. Finally, the stress–strain relations of 316L rupture disc material with quasi-static and dynamic pneumatic bulge processes are obtained, discussed, and compared.

2. Methodology

There are two challenges in this work. The first is how to obtain the real stress and strain values of rupture disc material with a pneumatic bulge process. The second is how to design a dynamic pneumatic bulge process to test the disc material. Here, the methodology of these two challenges is discussed in detail.

2.1. Determination of Stress and Strain

2.1.1. Problem Description

It is very difficult for researchers to directly measure the stress and strain on the three-dimensional surface of a domed disc. In the present study, an analytical method derived from the literature is used to obtain the stress–strain relationship of disc materials [21]. A schematic of the bulge process is shown in Figure 1a, where a flat disc is clamped peripherally. The diameter of the unclamped region is D, and the original thickness is t0. Bulge pressure is applied to one side of the disc, as shown in Figure 1b. When the pressure Pi increases, the disc gradually becomes domed and the bulge height increases. Due to the axi-symmetry, a coordinate system is set up, taking the center of the top surface of the undeformed disc as the coordinate origin. The parameter of the x-axis is the radius, r, of the disc, and the parameter of the y-axis is bulge height, h.
The following assumptions and premises are made in this paper [22]:
(1)
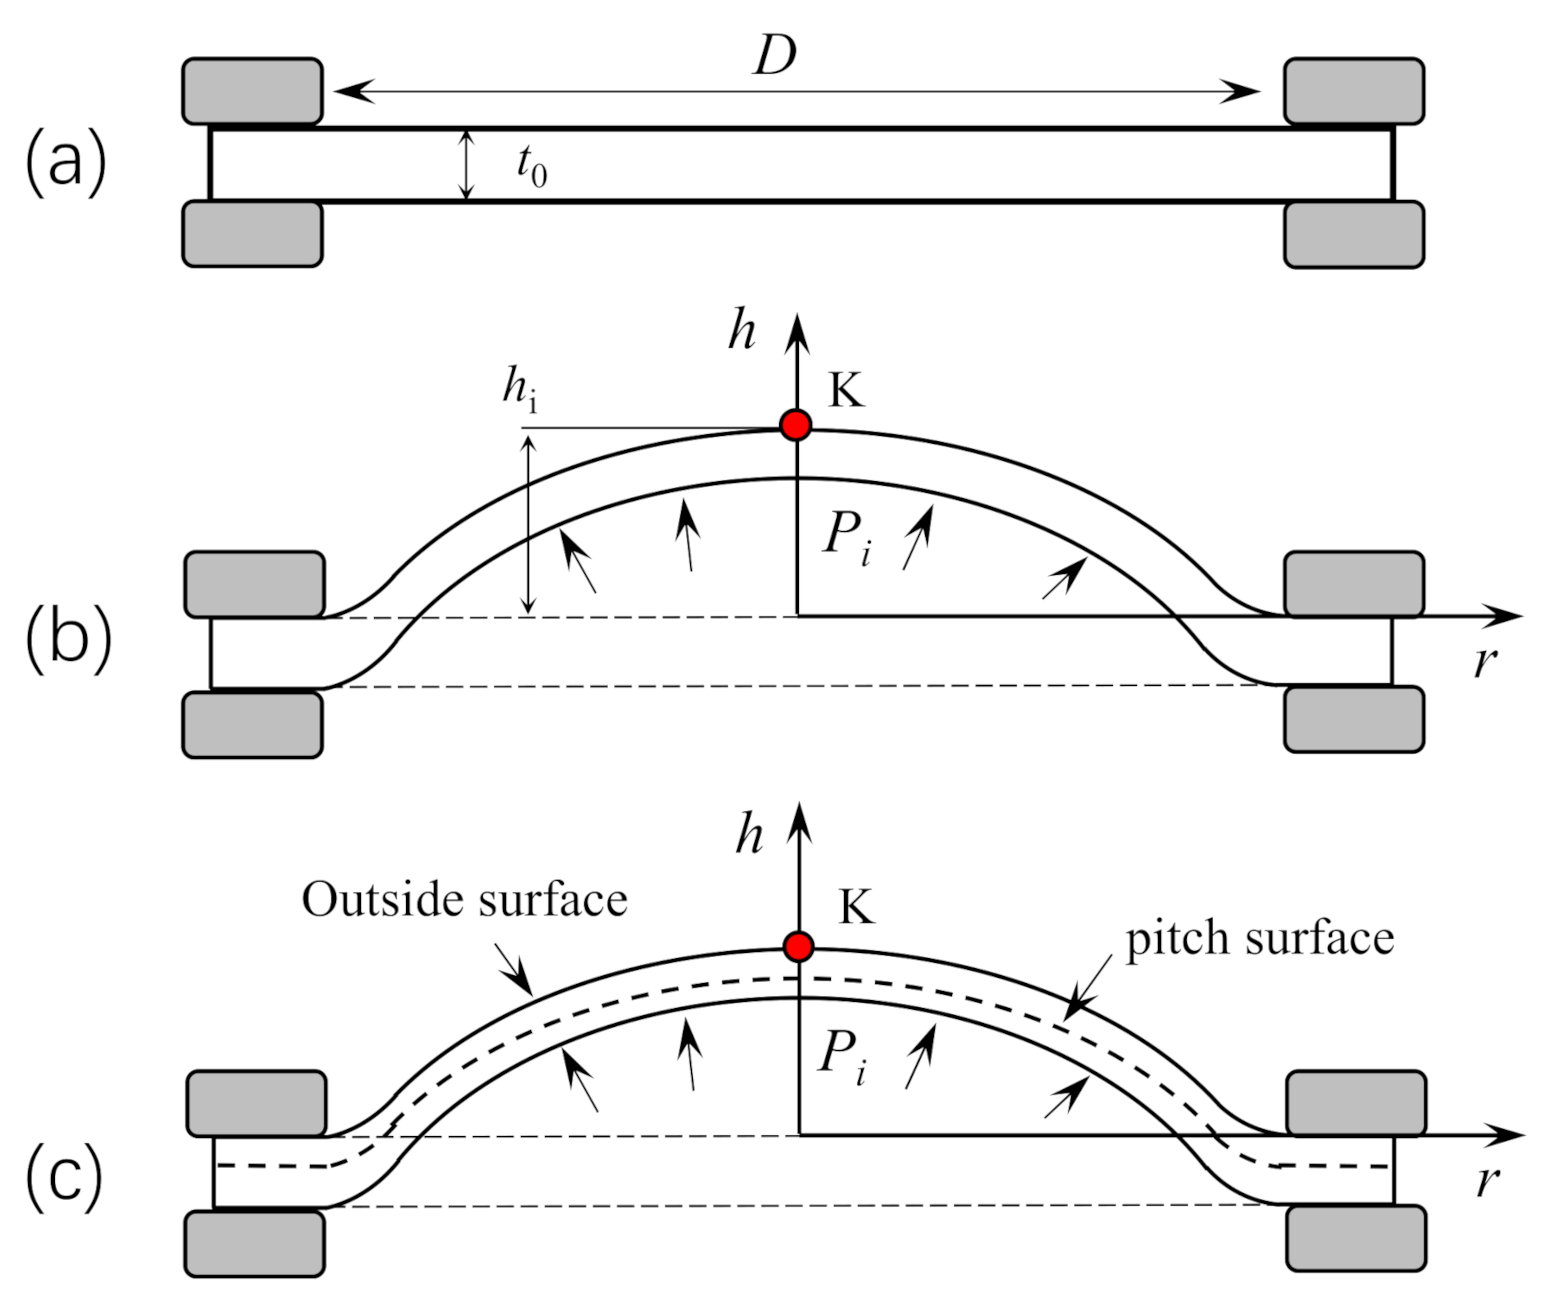
After the bulge pressure is released, the shape of the disc will change because the elastic deformation will snap back. However, it is very difficult to measure the elastic deformation accurately in experiments. Thus, only the plastic deformation is considered by measuring the deformation of the disc after pressure release. Some results show that in the bulge process of metallic structures, the deformation of materials in the elastic regime leads to insignificant volume changes (lower than 1%), so the consideration of plastic deformation is still representative.
(2)
The disc after pressure release has axi-symmetry, and it can be considered as a rotational thin shell. The stress inside the disc can be calculated according to membrane theory.
(3)
According to membrane theory, stress on the pitch diameter can be calculated from the force equilibrium equation with a known curvature of the pitch diameter. However, it is difficult to measure the curvature and strain of the pitch diameter. Since the disc is thin and the ratio of thickness to diameter is very small, the outside surface of the disc is used to replace the pitch surface of the thickness direction, as shown in Figure 1c.
(4)
During bulge process, the stress and strain of a disc at different locations are different. However, the top of the domed disc (Point K in Figure 1), where the rupture of a disc begins, has the maximum stress and a representative stress–strain relationship for the disc material. Therefore, only the stress and strain at this point are calculated in the following section.
(5)
The disc material is isotropic. The results in this paper are not suitable for anisotropic materials.

2.1.2. Determination of Strain

During bulge process, the bulge height, hi, at the top of domed disc increases with increasing bulge pressure, Pi. Normally, the whole pressurizing process is divided into several stages during the bulge process. In this paper, Pi (i = 0…, m) is defined to represent the bulge pressure point of the i stage, and P0 = 0. Pm is the maximum bulge pressure during rupture disc manufacture.
It is very difficult to directly test the strain at the top of the domed disc. Considering that at pressure Pi, strain should increase continuously when radius r decreases from D/2 to 0 (top of domed disc), a method was developed by testing the strain of the adjacent radial direction (r > 0) and then extrapolating from these tested strain values to obtain the strain at the top of the domed disc. It should be noticed that the radii of the adjacent radial direction would be small for improving the accuracy.
In order to accomplish this method, several circles are marked around the center of the tested disc before the bulge process, as shown in Figure 2a. Assume the number of circles is n, the radii of the circles from the inside out before the bulge process (Pi = P0 = 0) are labeled as rj0 (j = 1, …, n). After the pressure Pi (i = 1, …, m) is applied to one side of the disc, locations of rj0 change to rji due to bulge deformation. The circumferential strain εθji at location rji can be calculated by the following equation according to membrane theory:
ε θ j i = l n r j i r j 0
The real strain εpi at the top of domed disc at pressure Pi (i = 1, …, m) can be extrapolated from εθji by the Newton interpolation method. Taking n = 4, for example, εpi is calculated by the following equation:
ε p i = ε θ 1 i f r 1 i , r 2 i r 1 i + f r 1 i , r 2 i , r 3 i r 1 i r 2 i f r 1 i , r 2 i , r 3 i , r 4 i r 1 i r 2 i r 3 i
According to the incompressibility hypothesis of plasticity theory, the effective strain εei at the top of the domed disc at pressure Pi is expressed by
ε e i = 2 ε p i
If the values of rji (j = 1, …, n; i = 1, …, m) are tested in experiments, the effective strain εei at the top of domed disc at pressure Pi can be determined.

2.1.3. Determination of Stress

Based on these assumptions and premises, stress for an element on a domed disc at pressure Pi can be written as
σ θ i R θ i + σ φ i R φ i = P i t i
where σθi and σφi are the circumferential and meridian stresses at the element, Rθi and Rφi are the circumferential and meridian curvature radii of the element, Pi is the current bulge pressure, and ti is the current thickness of the element.
At the top location of the domed disc, as shown in Figure 3a, the circumferential curvature radius and meridian curvature radius are the same. By taking the equilibrium Equation (4) at this position, the following equation is derived:
σ θ i = σ φ i = P i · R i 2 · t i
where Ri and ti are the values of circumferential and meridian curvature radii and thickness at the top of the domed disc at bulge pressure Pi.
Considering the plane–stress condition, the von Mises effective stress σei at the top of the domed disc with pressure Pi can be calculated as:
σ e i = σ θ i 2 σ θ i · σ φ i + σ φ i 2 = P i · R i 2 · t i
Apparently, the calculation of σei needs two values of unknown parameters: Ri and ti. The present issue is how to determine these two parameters.
The determination of Ri is completed with the geometric profile of a domed disc in the bulge process. As shown in Figure 3b, the bulge profile of a domed disc is a continuous curve with changing curvature. Similar to the method shown in Figure 2, if other circles with radii of rji (j = 1, …, n; I = 1, …, m) are marked around the center of the disc before the bulge process, the bulge profile curve h = f (r) can be fitted by using the spline function with the tested coordinate points (rji, hji). After that, through making first and secondary derivations of the curve function h = f (r), the circumferential and meridian curvature radii can be determined using the following equation:
R i = 1 d 2 h / d r 2 r = 0
Determination of ti is calculated based on the relationship of thickness variation and effective strain at the top of the domed disc. According to the definition of strain, the effective strain, εei, is defined by the following equation:
ε e i = l n t i t 0
As εei was calculated using Equation (3) and t0 is known, ti is calculated by using the following equation:
t i = t 0 · e ε e i
After Ri and ti are calculated, the effective stress σei at the top of a domed disc with pressure Pi can be calculated.

2.2. Implementing the Method of Dynamic Pneumatic Bulge Processes

The experimental method for the quasi-static pneumatic bulge process is easy. In this work, the disc was pressurized with compressed air. However, the experimental method for a dynamic pneumatic bulge process is difficult and has not been found in the literature. In this paper, the method of a premixed combustible gas explosion was chosen to accomplish a dynamic bulge process. During the gas explosion process, the explosion pressure is applied to one side of the disc. The key to this method is how to control the dynamic pressure and the pressure rise rate. In this paper, a sacrificial rupture disc was used to accomplish this. The schematic diagram of this method is shown in Figure 4. A test disc is set to test the deformation of dynamic bulge process, and it does not rupture in experiments. A sacrificial rupture disc, manufactured by Dalian Duta Technology Safety System Co., Ltd. (Dalian, China), is used to control the dynamic bulge pressure and the pressure rise rate. It ruptures in every experiment. By changing the sacrificial rupture disc with different quasi-static bursting pressures, the dynamic bulge pressure and the pressure rise rate are controlled and changed. It must be noticed that the real dynamic bulge pressure Pi is obtained by recording the pressure–time histories, and this is different from the quasi-static bursting pressure of the sacrificial rupture disc. The detailed method will be described in the next section.

3. Experimental Methods

3.1. Test Discs

The test discs used in the experiments are made of 316L stainless steel. The diameter D of the unclamped part is 100 mm, and the thickness, t0, is 0.05 mm. Seven circles and three lines are marked on one side of the disc before the quasi-static or dynamic bulge experiments by using an MDL-200 type laser engraving machine (Figure 5). The pre-set radii of seven circles are listed in Table 1. The intersection points of the circles and one line are marked as the testing points. In this study, the first four circles (r11, r21, r31, r41, the unit is mm) were used to calculate the effective strain εei at the top of the domed disc at pressure Pi (MPa), and the last four circles (r41, r51, r61, r71, the unit is mm) were used to calculate the curvature radius Ri (mm) and thickness ti (mm) and hence the effective stress σei (MPa) at the top of dome disc is pressure Pi (MPa).
After the circles were marked, the real radii of these circles were tested with a universal tool microscope of the 19J(JX7) type (shown in Figure 6). The measuring accuracy of the universal tool microscope is 0.001 mm. The real radii were slightly different from the pre-set values, shown in Table 1. The real radii were used in the following calculation.
The properties of 316L are important for this study. The chemical composition is shown in Table 2. The true stress–strain relationship tested by using the uniaxial tensile test method (plate specimen) in a tensile testing machine is shown in Figure 7.

3.2. Apparatus for the Quasi-Static Pneumatic Bulge Process

An experimental apparatus to obtain the experimental data required for determination of the stress–strain relationship of the quasi-static pneumatic bulge process was built; it is shown in Figure 8. A test disc was assembled in position by a disc holder, which was fixed by a hydraulic press. The pressure of compressed air was applied to the disc by adding gas from a gas tank to the space composed by the test disc and the operation table of a hydraulic press. In quasi-static experiments, the pneumatic pressure Pi was applied in several stages. The pressure rise rate was controlled to be low, at about 0.1 MPa/min.
The experimental procedure is as follows: (1) A test disc is assembled in the apparatus. (2) Gas pressure P0 is applied to the disc. (3) The test disc is removed from the apparatus and tested by the universal tool microscope to record the radii rj1 and bulge heights hj1 of the marked points. (4) The above steps are repeated to test the radii, rji, and bulge heights, hji, of marked points at quasi-static bulge pressure Pi. (5) The strain and stress of the disc material are calculated.

3.3. Apparatus for Dynamic Pneumatic Bulge Process

An experimental apparatus to obtain the experimental data required for the determination of the stress–strain relationship of a dynamic pneumatic bulge process was also built, as shown in Figure 9. It consists of two explosion tanks, a vacuum pump, several gas cylinders, an ignition system, a pressure sensor, and a data acquisition system.
Two connected tanks (tanks A and B) were used as the explosion space for the combustible mixture. Tank A is a cylindrical vessel with an internal diameter of 100 mm and a volume of 5 L. Tank B is also a cylindrical vessel with an internal diameter of 100 mm and volume of 10 L. A vacuum pump and several gas cylinders were used to evacuate the tanks and fill them with gas. The concentration of combustible gas in the tanks was obtained using the partial pressure method. A test disc and a sacrificial rupture disc were installed at the two ends of tank B. The conventional domed rupture discs with a relief diameter of 100 mm were used as sacrificial rupture discs. The bursting pressure of the sacrificial rupture disc in each experiment is different.
An ignition system (including an ignition control box and two electrodes) was used to ignite the combustible mixture in the tanks. The ignition voltage was 10 kV, and the gap of two electrodes was 3 mm. The ends of the two electrodes were placed at the center of the tank A.
A CYG 1401F piezoelectric pressure sensor (manufactured by Kunshan Shuangqiao Group, China) was installed on the wall of tank B to rapidly measure the explosion pressure as a function of time. The range, accuracy, and frequency of the pressure sensor are 0–6 MPa, 0.5%, and 1 MHz, respectively. A data acquisition system was used to record the pressure at different times after the combustible gas explosion.
A methane/air mixture with a concentration of 10% was used as the medium. The initial pressure was 0.1 MPa (gauge pressure) before ignition at room temperature.
The experimental procedure is as follows: (1) A tested disc is assembled in the apparatus. (2) A sacrificial rupture disc with bursting pressure Pb1 is assembled in the apparatus. (3) Methane and air are filled into the tanks to the pre-set concentration and the initial pressure. (4) The combustible mixture is ignited. The explosion pressure is applied to both the tested disc and the sacrificial rupture disc, which ruptures under pressure. The explosion pressure history with time is recorded. (5) Both the tested disc and the sacrificial rupture disc are removed from the apparatus. The tested disc is tested using the universal tool microscope to record the radii rj1 and bulge heights hj1 of marked points. The dynamic pressure P1 and the pressure rise rate dP/dt are obtained from the pressure–time history. (4) The sacrificial rupture disc is changed with bursting pressure Pbi, and the above steps are repeated to test the radii rj0, and bulge heights hj0, of marked points at dynamic pressure Pi. (5) The strain and stress of disc material are calculated.

4. Results and Discussion

4.1. Stress–Strain Relationship of Quasi-Static Pneumatic Bulge Process

The appearances of discs at different pressures, Pi, after the bulge process are shown in Figure 10. After testing the values of rji and hji at different pressures, Pi, the strain and stress values were calculated according to the methodology described in Section 2.1.
Figure 11 presents the tested bulge heights and the calculated effective strains at the top of the domed disc with different quasi-static pressures. It is observed that the bulge height increases linearly with an increase in the quasi-static pressure. When the pressure changes from 0.11 to 0.93 MPa, the bulge height changes from 4.56 to 30.95 mm. The effective strain increases exponentially with the quasi-static pressure. When the pressure reaches 0.93 MPa, the effective strain is 0.49. The quasi-static bursting pressure of the tested disc is 0.99 MPa, hence, the ultimate strain at the top of the domed disc before rupture is about 0.55.
In terms of the calculated thickness, ti, and curvature radius, Ri, at the top of the domed discs, they both decrease with an increase in the quasi-static pressure, as demonstrated in Figure 12. Obviously, the curvature radius decreases rapidly at the early stage of the bulge process, and then it decreases slightly later in the process. When the pressure reaches 0.93 MPa, the thickness and curvature radius are equal to 0.0305 and 54.65 mm, respectively.
Figure 13 exhibits the calculated effective stress and the effective strain at the top of the domed disc during the pneumatic bulge process. The uniaxial stress–strain relationship is also given in the figure. Clearly, the effective stress during the bulge process is larger than the value under the uniaxial tensile condition at the same strain, presenting a kind of hardening behavior. In mechanics of materials, Hollomon’s equation [23] is widely used to present the stress–strain behavior in material hardening, listed below:
σ = K·εn
where K is the strength coefficient, n is the strain hardening exponent. In this paper, Hollomon’s equation is used to represent the relationship between the effective stress and strain during quasi-static bulge process. The fitted formula is shown in Equation (11):
σe = 1259.4·εe0.4487

4.2. Stress–Strain Relationship of Dynamic Pneumatic Bulge Process

The experimental results of the dynamic bulge process are more complicated than those of the quasi-static bulge process. Although a sacrificial rupture disc is used in the experiments, the real bulge pressure Pi cannot be predetermined, but can only be determined using the explosion pressure curve after the experiments.
Figure 14 presents the values of bulge heights at the top of the domed discs at different dynamic bulge pressures. The experimental results of the quasi-static bulge process are also given in the figure. It is observed that the bulge height fluctuates dramatically with bulge pressure, but the overall trend increases. It is assumed that the reason for the fluctuation can be attributed to the different pressure rise rates. Apparently, the pressure rise rate during the dynamic bulge process has a significant effect on the deformation behavior of the disc material. Moreover, it appears that the bulge height at the quasi-static condition is larger than that at the dynamic condition when the bulge pressure is the same.
In order to further analyze the effect of the pressure rise rate on disc deformation behavior, it is necessarily to describe the relationship between bulge height and bulge pressure at different pressure rise rates. However, the most troublesome problems are that the pressure rise rate is hard to precisely control in experiments due to the variability of the explosions and the difficulty in determining the pressure rise rate. For example, each data point in Figure 14 has a different value for pressure rise rate. Although the pressure rise rate is hard to precisely control at a fixed value, it was found that if we classify these bulge height values according to a range of pressure rise rates, we can obtain good regularity in the relationship between the bulge height and the dynamic pressure, as shown in Figure 15. The pressure rise rates are divided into three ranges: 2–10, 10–50, and 50–100 MPa/s. It is noted that the bulge heights all increase linearly with dynamic pressure increases at different pressure rise rate ranges. At the same bulge pressure, a disc with a larger pressure rise rate has a smaller bulge height, indicating that the deformation of a disc at a large pressure rise rate is difficult.
Figure 16 shows the calculated effective strain values at the top of the domed discs at different dynamic bulge pressures with different pressure rise rate ranges. Similar to the quasi-static condition, the effective strain increases exponentially with the dynamic pressure at every pressure rise rate range. At the same dynamic pressure, the higher the pressure rise rate, the smaller the effective strain.
The relationship between the calculated effective stress and the arc top effective strain at the top of the domed disc is shown in Figure 17 at different pressure rise rate ranges. Obviously, with the increase in the pressure rise rate, the effective stress of the bulge process increases at the same strain. Like the quasi-static condition, Hollomon’s equation [23] is used to represent the relationship between the effective stress and strain during dynamic bulge process.
The fitted formula at every pressure rise rate range is listed below:
When pressure rise rate is between 2 and 10 MPa/s:
σe = 1192.4·εe0.3261
When pressure rise rate is between 10 and 50 MPa/s (10 is not included):
σe = 1381.2·εe0.2910
When pressure rise rate is between 50 and 100 MPa/s (50 is not included):
σe = 1368.4·εe0.1701

5. Conclusions

Based on the plastic membrane theory and the force equilibrium equations, an approach for determining the plastic stress–strain relationship of rupture disc material in the bulge process is proposed, by testing the changes in bulge heights and radii of marked points on the disc at different bulge pressures. Two experimental apparatuses for pneumatic bulge tests with quasi-static and dynamic conditions were built. Explosions of a methane/air mixture and sacrificial rupture discs were used to accomplish the dynamic bulge process.
Whether the bulge process is quasi-static or dynamic, the bulge heights all increased linearly with increasing dynamic pressure, and the effective strain increased exponentially with the dynamic pressure. The pressure rise rate during the dynamic bulge process has a significant effect on the deformation behavior of the disc material. At the same bulge pressure, discs with a larger pressure rise rate had a smaller bulge height and effective strain at the top of domed disc, indicating that deformation of a disc is difficult with a large pressure rise rate. The stress–strain relations of 316L material at different pressure rise rate ranges were obtained by using Hollomon’s equation, and they are listed below:
  • σe = 1259.4·εe0.4487 (quasi-static).
  • σe = 1192.4·εe0.3261 (pressure rise rate between 2 and 10 MPa/s).
  • σe = 1381.2·εe0.2910 (pressure rise rate between 10 and 50 MPa/s).
  • σe = 1368.4·εe0.1701 (pressure rise rate between 50 and 100 MPa/s).

Author Contributions

Conceptualization, X.Y. (Xingqing Yan); methodology, X.Y. (Xiaozhe Yu), X.Y. (Xingqing Yan) and Y.L.; investigation, X.Y. (Xiaozhe Yu), F.Z. and S.K.; formal analysis X.Y. (Xingqing Yan) and F.Z.; writing—original draft preparation, X.Y. (Xiaozhe Yu) and X.Y. (Xingqing Yan); writing—review and editing, X.Y. (Xingqing Yan); resources, J.Y.; supervision, J.Y.; funding acquisition, X.Y. (Xiaozhe Yu) and J.Y. All authors have read and agreed to the published version of the manuscript.

Funding

This research has been supported by the financial of National Natural Science Foundation of China (No. 52104187 and No. 52174167), China Postdoctoral Science Foundation (No. 2022M710585).

Institutional Review Board Statement

Not applicable.

Informed Consent Statement

Not applicable.

Data Availability Statement

Not applicable.

Conflicts of Interest

The authors declare no conflict of interest.

References

  1. Smith, P.; Zappe, R.W. Valve Selection Handbook: Engineering Fundamentals for Selecting the Right Valve Design for Every Industrial Flow Application, 5th ed.; Elsevier: Amsterdam, The Netherlands, 2004. [Google Scholar]
  2. Shannak, B. Experimental and theoretical investigation of gas-liquid flow pressure drop across rupture discs. Nucl. Eng. Des. 2010, 240, 1458–1467. [Google Scholar] [CrossRef]
  3. Yang, C.; Hui, H.; Song, X.Y.; Huang, S. Theoretical and Experimental Research on Designed Bursting Pressure of Ultrahigh Pressure Rupture Disk. J. Press. Vessel Technol. Trans. ASME 2021, 143, 7. [Google Scholar] [CrossRef]
  4. Kong, X.W.; Zhang, J.C.; Li, X.Q.; Jin, Z.B.; Zhong, H.; Zhan, Y.; Han, F.J. Experimental and finite element optimization analysis on hydroforming process of rupture disc. In Proceedings of the 17th International Conference on Metal Forming (Metal Forming), Toyohashi, Japan, 16–19 September 2018; pp. 892–898. [Google Scholar]
  5. Liu, L.L.; Yuan, C.X.; Li, W.; Li, B.B.; Liu, X.M. Influence of Moulding Pressure on the Burst Pressure of Reverse-Acting Rupture Discs. Processes 2021, 9, 18. [Google Scholar] [CrossRef]
  6. Zhao, G.B. An easy method to design gas/vapor relief system with rupture disk. J. Loss Prev. Process Ind. 2015, 35, 321–328. [Google Scholar] [CrossRef]
  7. Mutegi, M.K.; Schmidt, J.; Denecke, J. Sizing rupture disk vent line systems for high-velocity gas flows. J. Loss Prev. Process Ind. 2019, 62, 14. [Google Scholar] [CrossRef]
  8. ISO 4126-2; Safety Devices for Protection against Excessive Pressure—Part 2: Bursting Disc Safety Devices. International Organization for Standardization: Geneva, Switzerland, 2003.
  9. Jeong, J.Y.; Jo, W.; Kim, H.; Baek, S.H.; Lee, S.B. Structural Analysis on the Superficial Grooving Stainless-Steel Thin-Plate Rupture Discs. Int. J. Precis. Eng. Manuf. 2014, 15, 1035–1040. [Google Scholar] [CrossRef]
  10. Zhu, H.B.; Xu, W.P.; Luo, Z.P.; Zheng, H.X. Finite Element Analysis on the Temperature-Dependent Burst Behavior of Domed 316L Austenitic Stainless Steel Rupture Disc. Metals 2020, 10, 232. [Google Scholar] [CrossRef] [Green Version]
  11. Mohebbi, M.; Panahizadeh, V.; Hoseinpour, M. Analytically predicting the burst pressure of composite rupture discs by considering nonlinear strain path. Proc. Inst. Mech. Eng. Part B J. Eng. Manuf. 2022, 10, 09544054221100324. [Google Scholar] [CrossRef]
  12. Murty, D.V.R.; Reddy, A.C.; Rao, Y.B. Factors to Be Considered for Selection and Design of Rupture Disc. In Proceedings of the 14th International Conference on Nuclear Engineering, Miami, FL, USA, 17–20 July 2006. [Google Scholar]
  13. Tanaka, N.; Wada, Y.; Tamura, M.; Yoshida, T. Performance of Pressure-Vessel Test Concerned with Heating Rate of Pressure-Vessel and Bursting Pressure of Rupture Disk. J. Hazard. Mater. 1990, 23, 89–107. [Google Scholar] [CrossRef]
  14. Juszczyk, A.S.; Radford, D.R.; Curtis, R.V. Sensitivity of a disc rupture strength test to air bubble pores in phosphate-bonded investment materials at elevated temperatures. Dent. Mater. 2002, 18, 255–262. [Google Scholar] [CrossRef]
  15. Dundu, M. Evolution of stress-strain models of stainless steel in structural engineering applications. Constr. Build. Mater. 2018, 165, 413–423. [Google Scholar] [CrossRef]
  16. Murty, D.; Rao, Y.B. Design and Analysis—Computer Simulation of Rupture Disc Design. In Proceedings of the ASME 2006 Pressure Vessels and Piping/ICPVT-11 Conference, Vancouver, BC, Canada, 23–27 July 2006; Volume 2006, pp. 233–240. [Google Scholar]
  17. Goh, T.N.; Shang, H.M. Effects of Shape and Size of Tensile Specimens on the Stress-Strain Relationship of Sheet-Metal. J. Mech. Work. Technol. 1982, 7, 23–37. [Google Scholar] [CrossRef]
  18. Atkinson, M. Accurate determination of biaxial stress-strain relationships from hydraulic bulging tests of sheet metals. Int. J. Mech. Sci. 1997, 39, 761–769. [Google Scholar] [CrossRef]
  19. Yamanaka, A.; Kamijyo, R.; Koenuma, K.; Watanabe, I.; Kuwabara, T. Deep neural network approach to estimate biaxial stress-strain curves of sheet metals. Mater. Des. 2020, 195, 16. [Google Scholar] [CrossRef]
  20. Sun, W.K.; Liu, L.J.; Li, Y.; Huang, C.Y.; Chen, X.F.; Feng, M.M. Insight into vented explosion mechanism and premixed flame dynamics in linked vessels: Influence of membrane thickness and blocking rate. J. Loss Prev. Process Ind. 2021, 72, 11. [Google Scholar] [CrossRef]
  21. Lianfa, Y.; Cheng, G. Determination of stress-strain relationship of tubular material with hydraulic bulge test. Thin Walled Struct. 2008, 46, 147–154. [Google Scholar] [CrossRef]
  22. Fuchizawa, S.; Narazaki, M. Bulge test for determining stress-strain characteristics of thin tubes. Adv. Technol. Plast. 1993, 1, 448–493. [Google Scholar]
  23. Hollomon, J.H. Tensile Deformation. Met. Technol. 1945, 12, 268–290. [Google Scholar]
Figure 1. Schematic of the pneumatic bulge process of a rupture disc: (a) the initial unloaded state, (b) the state under the bulge pressure Pi, (c) the outside surface and the pitch surface under the bulge pressure Pi.
Processes 10 01463 g001
Figure 2. Schematic for the determination of strain at the top of a domed disc (taking n = 4 as an example): (a) the initial unloaded state, (b) the state under the bulge pressure.
Processes 10 01463 g002
Figure 3. Schematic of a domed disc during the bulge process: (a) determination of the stress at the top of the disc, (b) The outside surface of the disc under bulge pressure.
Processes 10 01463 g003
Figure 4. Schematic diagram of the dynamic pneumatic method.
Processes 10 01463 g004
Figure 5. Photos of the test specimen and grid line: (a) Tested disc, (b) Grid line marked on test disc, (c) laser engraving machine.
Processes 10 01463 g005
Figure 6. Universal tool microscope of the 19J(JX7) type.
Processes 10 01463 g006
Figure 7. The true stress–strain relationship tested by using the uniaxial tensile test method.
Processes 10 01463 g007
Figure 8. Schematic of experimental apparatus of quasi-static pneumatic bulge process (not to scale).
Processes 10 01463 g008
Figure 9. Schematic of the experimental apparatus for the dynamic pneumatic bulge process (not to scale).
Processes 10 01463 g009
Figure 10. The appearance of discs after the quasi-static pneumatic bulge process.
Processes 10 01463 g010
Figure 11. The bulge heights and effective strains at the top of the domed discs with different quasi-static pressures.
Processes 10 01463 g011
Figure 12. The thicknesses and curvature radii at the top of the domed discs with different quasi-static pressures.
Processes 10 01463 g012
Figure 13. The calculated effective stress and the effective strain at the top of the domed disc with the quasi-static bulge process.
Processes 10 01463 g013
Figure 14. The bulge heights at the top of the domed discs at different dynamic bulge pressures.
Processes 10 01463 g014
Figure 15. The bulge heights at the top of the domed discs with different dynamic pressures.
Processes 10 01463 g015
Figure 16. The effective strains at the top of the domed discs with different dynamic pressures.
Processes 10 01463 g016
Figure 17. The calculated effective stress and effective strain at the top of the domed disc with the dynamic bulge process.
Processes 10 01463 g017
Table 1. The pre-set and real radii of seven marked circles before the bulge test.
Radiusr11r21r31r41r51r61r71
Pre-set value/mm0.511.52.557.510
Real value/mm0.50380.99991.49792.49934.99877.50029.9991
Table 2. Chemical composition of 316L used in experiments/%.
CCrMnMoNNiPSSiFe
0.02016.4001.3182.0100.01210.0300.0280.0020.59669.584
Publisher’s Note: MDPI stays neutral with regard to jurisdictional claims in published maps and institutional affiliations.

