Article

A Step for the Valorization of Spent Yeast through Production of Iron–Peptide Complexes—A Process Optimization Study

1
Centre for Biotechnology and Fine Chemistry, School of Biotechnology, Portuguese Catholic University, Rua Diogo Botelho 1327, 4169-005 Porto, Portugal
2
Amyris Bio Products Portugal, Unipessoal Lda, 4169-005 Porto, Portugal
*
Author to whom correspondence should be addressed.
Processes 2022, 10(8), 1464; https://doi.org/10.3390/pr10081464
Submission received: 14 June 2022 / Revised: 14 July 2022 / Accepted: 20 July 2022 / Published: 26 July 2022
(This article belongs to the Special Issue Value-Added Utilization Processes of Industrial Wastes)

Abstract

:
Given the importance of iron in human nutrition and the significance of waste and by-product valorisation in a circular economy environment, we investigated the effects of protein and iron concentration on the production yield of iron–peptide complexes from spent Saccharomyces cerevisiae. For this purpose, different amounts of protein and iron were used in the complexation process. The results have shown that higher concentrations, although permitting a faster and larger scale process, provide a significantly lower complexation yield, which deems the process less feasible. This is corroborated by fluorescence analysis, which shows a lower degree of complexation with higher protein concentration. In addition, varying the concentration of iron does not change the quality of formed complexes, as evidenced by Fourier transform infrared spectroscopy (FT-IR) analysis. The morphology of all samples was also evaluated using scanning electron microscopy (SEM). Therefore, further studies are needed to optimize the process and to evaluate the best conditions for an economically sound valorization process for iron–peptide complexes. Nonetheless, current results in the development of a new process for the valorisation of spent yeast, in the form of iron-peptide complexes, look promising.

1. Introduction

As an essential micronutrient required for proper human nutrition, iron is involved in many biochemical processes in the human metabolism and is indispensable for correct oxygen transport, gene regulation, electron transfer, cell growth regulation and enzyme operation [1,2]. It is no surprise, then, that special attention is given to iron nutrition, since insufficient iron intake can result in fatigue, tiredness, lethargy and weakness, decreased exercise capacity, decreased work and school performance [3], and, in more severe cases, anaemia and death [4]. As a matter of fact, according to the World Health Organization (WHO), about 1.62 billion people suffer from anaemia [5]. More recently, it was reported that 30% of women (between 15 and 49 years) and 40% of children under five years, suffered from anaemia in 2019 [6], while other estimates place the global age-standardized prevalence point of anaemia at around 23% [4].
A common remedy to iron malnutrition is through iron supplementation. For this purpose, different sources have been used, such as elemental iron and some common iron salts, such as iron fumarate, citrate, carbonate, and sulphate [7]. Nevertheless, these have shortcomings, including the lack of iron bioavailability [8,9], which can cause health issues such as gastrointestinal irritation, vomiting, lethargy, pneumonitis or convulsions [10], and can alter food properties [11].
Organic complexing agents have been used as alternatives to eliminate these issues. Among them, peptides are a widely studied alternative [8,9,12,13,14,15,16,17,18]. One of the main reasons for the choice of peptides relies upon their availability from the protein-rich by-products generated through other existing processes. A common protein-rich by-product is brewer’s yeast, Saccharomyces cerevisiae [19]. Bearing in mind the principles of the circular economy, we wish to develop a complexation process based on those described in the previous literature.
Most works agree on the general process method. The complexation reaction of peptides and metal ions is usually conducted in solution, with the reaction being heavily dependent on the pH, metal–protein ratio, and to a lesser extent, temperature, time and stirring [20]. Besides the extraction of the protein/peptide extracts, some authors also proceed to purification or isolation efforts, using, for example, membrane techniques [9,14], or immobilized metal affinity chromatography (IMAC) [21,22]. Although these methods have the advantage of increasing the protein-rich extract purity, they also represent an extra cost for the overall process. With the objective of reducing costs, we did not apply pretreatment to our autolysis extract, and used it as is. After the complexation reaction, samples are usually filtered and cleaned from any precipitate, to retain only the soluble (complexed) iron in solution. Samples are then freeze-dried for final, long-term storage and use [8,9,20]. Authors such as Caetano et al. [23] and Lin et al. [24] have described complexation processes with the use of iron and protein concentrations as low as 0.1% by mass. Although satisfactory at a laboratory scale, these low concentrations have negative consequences: the working solution becomes too dilute, and since a drying step is also required, much energy and time is wasted as a consequence of the high volumes of water used to process equal amounts of complex mass with a lower concentration of peptide and iron, making the valorization of the spent yeast as iron–peptide complexes unviable in these conditions.
The reduction in the amount of water being used in the process was the first step in the optimization of our process. In this manner, we can reduce the subsequent evaporations costs, as well as increase final solid yield per batch. To this end, a set of experiments were conducted, using an undiluted autolysis supernatant and a solution diluted to the reported concentrations. Both were compared from the perspective of yield and structure, in order to study the feasibility of using more concentrated peptide solutions in future optimization steps. A critical analysis was also carried out of the autolysis performed, where points of improvement are discussed.

2. Materials and Methods

2.1. Spent Yeast

Spent yeast was obtained from Amyris as a by-product of farnesene production, at the end of the fermentation cycle. Prior to further processing, the collected broth was centrifugated (15,000× g, 10 min) and the yeast pellet was collected and weighted.

2.2. Autolysis

Spent yeast mass was subjected to autolysis before further processing. Autolysis is a natural process by which cells undergo disintegration by through their own enzymes. To this end, a yeast pellet concentration of 1 g/mL was used, and the autolysis was promoted using conditions previously used by our lab group [25], whereby autolysis was conducted at 56 °C for 16 h in an Innova Incubator Shaker (Eppendorf, Hamburg, Germany), at constant shaking (250 rpm).
At the end of the autolysis cycle, samples were collected and centrifuged (19,500× g, 5 min); the supernatant was filtered using a qualitative filter paper (ø = 11 µm, Whatman®, Maidstone, UK), and stored at 4 °C for later use. Samples were collected for dry weight and protein determination of supernatant after centrifugation and filtration. Dry weight was determined gravimetrically by drying samples using a freeze-drier. The protein content of the supernatant samples was measured using the Bicinchoninic acid (BCA) protein assay, as previously described [26], using a commercial kit (Thermo Scientific, Waltham, MA, USA).

2.3. Complexation

The complexation reaction of the peptide-rich supernatant and iron was conducted in a three-necked flask in three steps: First, the filtered peptide-rich extract solution was prepared to a protein concentration of 1 g/L, or left undiluted at 16.6 g/L (Original_1 and Original_17, respectively). A previously freeze-dried sample of the filtered peptide-rich extract was also used to prepare a peptide-rich solution with a concentration of 1 g/L (Dried_1). The peptide-rich solution was placed in the reaction flask and purged with nitrogen gas for 10 min. Secondly, FeSO4 (Sigma Aldrich, St. Louis, MO, USA) was added to the flask to achieve a final protein-to-Fe ratio of 2:1 (w/w), and the solution was stirred for 10 min. Finally, the pH of the solution was slowly increased and stabilized at 7.0 for the next 30 min, with the aid of an Automatic Potentiometric Titrator At-710 (KEM, Kyoto, Japan), using a 0.125 M NaOH solution (LaborSpirit, Santo Antão do Tojal, Portugal).
At the end of the 30 min, the solution was collected in a flask and its air removed and replaced with nitrogen gas. The solution was then stored overnight at room temperature. The solution was centrifuged the following day at 12,000× g for 5 min and the supernatant filtered (ø = 0.45 µm). The soluble Fe from the resulting solution, as well as the total iron in aliquots collected at the different steps of centrifugation and filtration, was measured in an optical emission spectrometer, Model Optima 7000 DV ™ ICP-OES (Dual View, PerkinElmer Life and Analytical Sciences, Shelton, CT, USA) with radial configuration. Samples were also collected to determine the supernatant’s dry weight and protein determination after centrifugation and filtration, as described above.

2.4. Characterization

2.4.1. Intrinsic Fluorescence

The peptide-rich extract and complex intrinsic fluorescence emission spectra were recorded using a Synergy H1 microplate reader (Biotek Instruments, Winooski, VT, USA). A wavelength of 280 nm was used for the excitation of samples and emission wavelengths from 300 to 400 nm were recorded, with a step of 5 nm. Samples were measured in triplicate and the results expressed as an average.

2.4.2. Fourier Transform Infrared Spectroscopy (FT-IR)

Spray-dried complex samples and original autolysis samples were analysed on the diamond crystal of an attenuated total reflectance (ATR) assembly in a Perkin-Elmer Frontier FTIR spectrometer, coupled with a Universal ATR Sampling Accessory (Waltham, MA, USA). Samples were measured in a wavenumber range between 4000 and 550 cm−1 for 32 scans at a spectral resolution of 1 cm−1.

2.4.3. Scanning Electron Microscopy (SEM)

The microstructure of spray-dried samples of iron complexes and original autolysis matrix were analysed by using scanning electron microscopy (JSM-5600 LV Scanning Electron Microscope from JEOL, Japan). Before the analysis, the samples were placed into observation stubs (covered with double-sided adhesive carbon tape (NEM tape, Nisshin, Tokyo, Japan) and coated with Au/Pd (target SC510-314B from ANAME, S.L., Madrid, Spain) using a Sputter Coater (Polaron, Bad Schwalbach, Germany). All observations were performed in the high vacuum mode, with an acceleration voltage of 30 kV, at a working distance of 9–10 mm and with a spot-size of 24. The specimen was observed using a 200× magnification, and all images are representative of the morphology of each sample.

2.5. Chemical Speciation

Chemical speciation of Fe(II) solubility was carried out using Visual MINTEQ ver. 3.1 (KTH, Stockholm, Sweden). The stability constants in the native software database were used for the simulations.

2.6. Statistical Analysis

Statistical analysis was performed using the Real Statistics Resource Pack software (Release 7.2, Copyright (2013–2021) Charles Zaiontz, www.real-statistics.com). Pair-wise samples were tested using a two-sample t-test and multi-sample tests were performed using a one-way ANOVA. All tests were performed with a 95% confidence level.

3. Results and Discussion

3.1. Autolysis Process

The autolysis yields can be found in Table 1. About 200 g were used for each, from which a little above 200 mL of supernatant was obtained. Prior to the filtration step, the supernatant had a dry weight content of 67 g/L and a protein concentration of 17.1 g/L, leading to a protein purity of 25.6%. However, after filtration, these values decreased to 50.7 and 16.6 g/L, respectively. This decrease is not proportional, however, and protein is lost to a lesser extent, as evidenced by the increase in protein purity (Table 1). In fact, while about 25% of the overall dry weight was lost in the filtration step, only 3% of protein was lost. With this simple step, a clear and purer protein extract is thus obtained for posterior use.
Regarding the overall yield, this was rather low, with only 5.64% of the initial mass converted into soluble mass in the supernatant, and only 1.85% with regard to protein. According to some estimates, spent brewer’s yeast (mostly S. cerevisiae) contains somewhere between 45 and 60% protein, on a dry-weight basis [27]. That means that from the initial 195 g, one could obtain somewhere between 88 and 117 g of protein, instead of the 3.5 g obtained in the current process. The low yield may be credited to the method used, since autolysis is a more gentle extraction method than others, such as high-pressure homogenization or bead milling [27]. The efficiency of autolysis could be increased by increasing the autolysis time; however, this would decrease the size of peptides found in the final product and dramatically increase the amount of free amino acids in the supernatant [28]. This level of peptide degradation and hydrolysis is undesirable for our purposes, although many authors have described peptides ranging in size from 300 to 1500 Da as ideal for iron complexation [20,28,29].

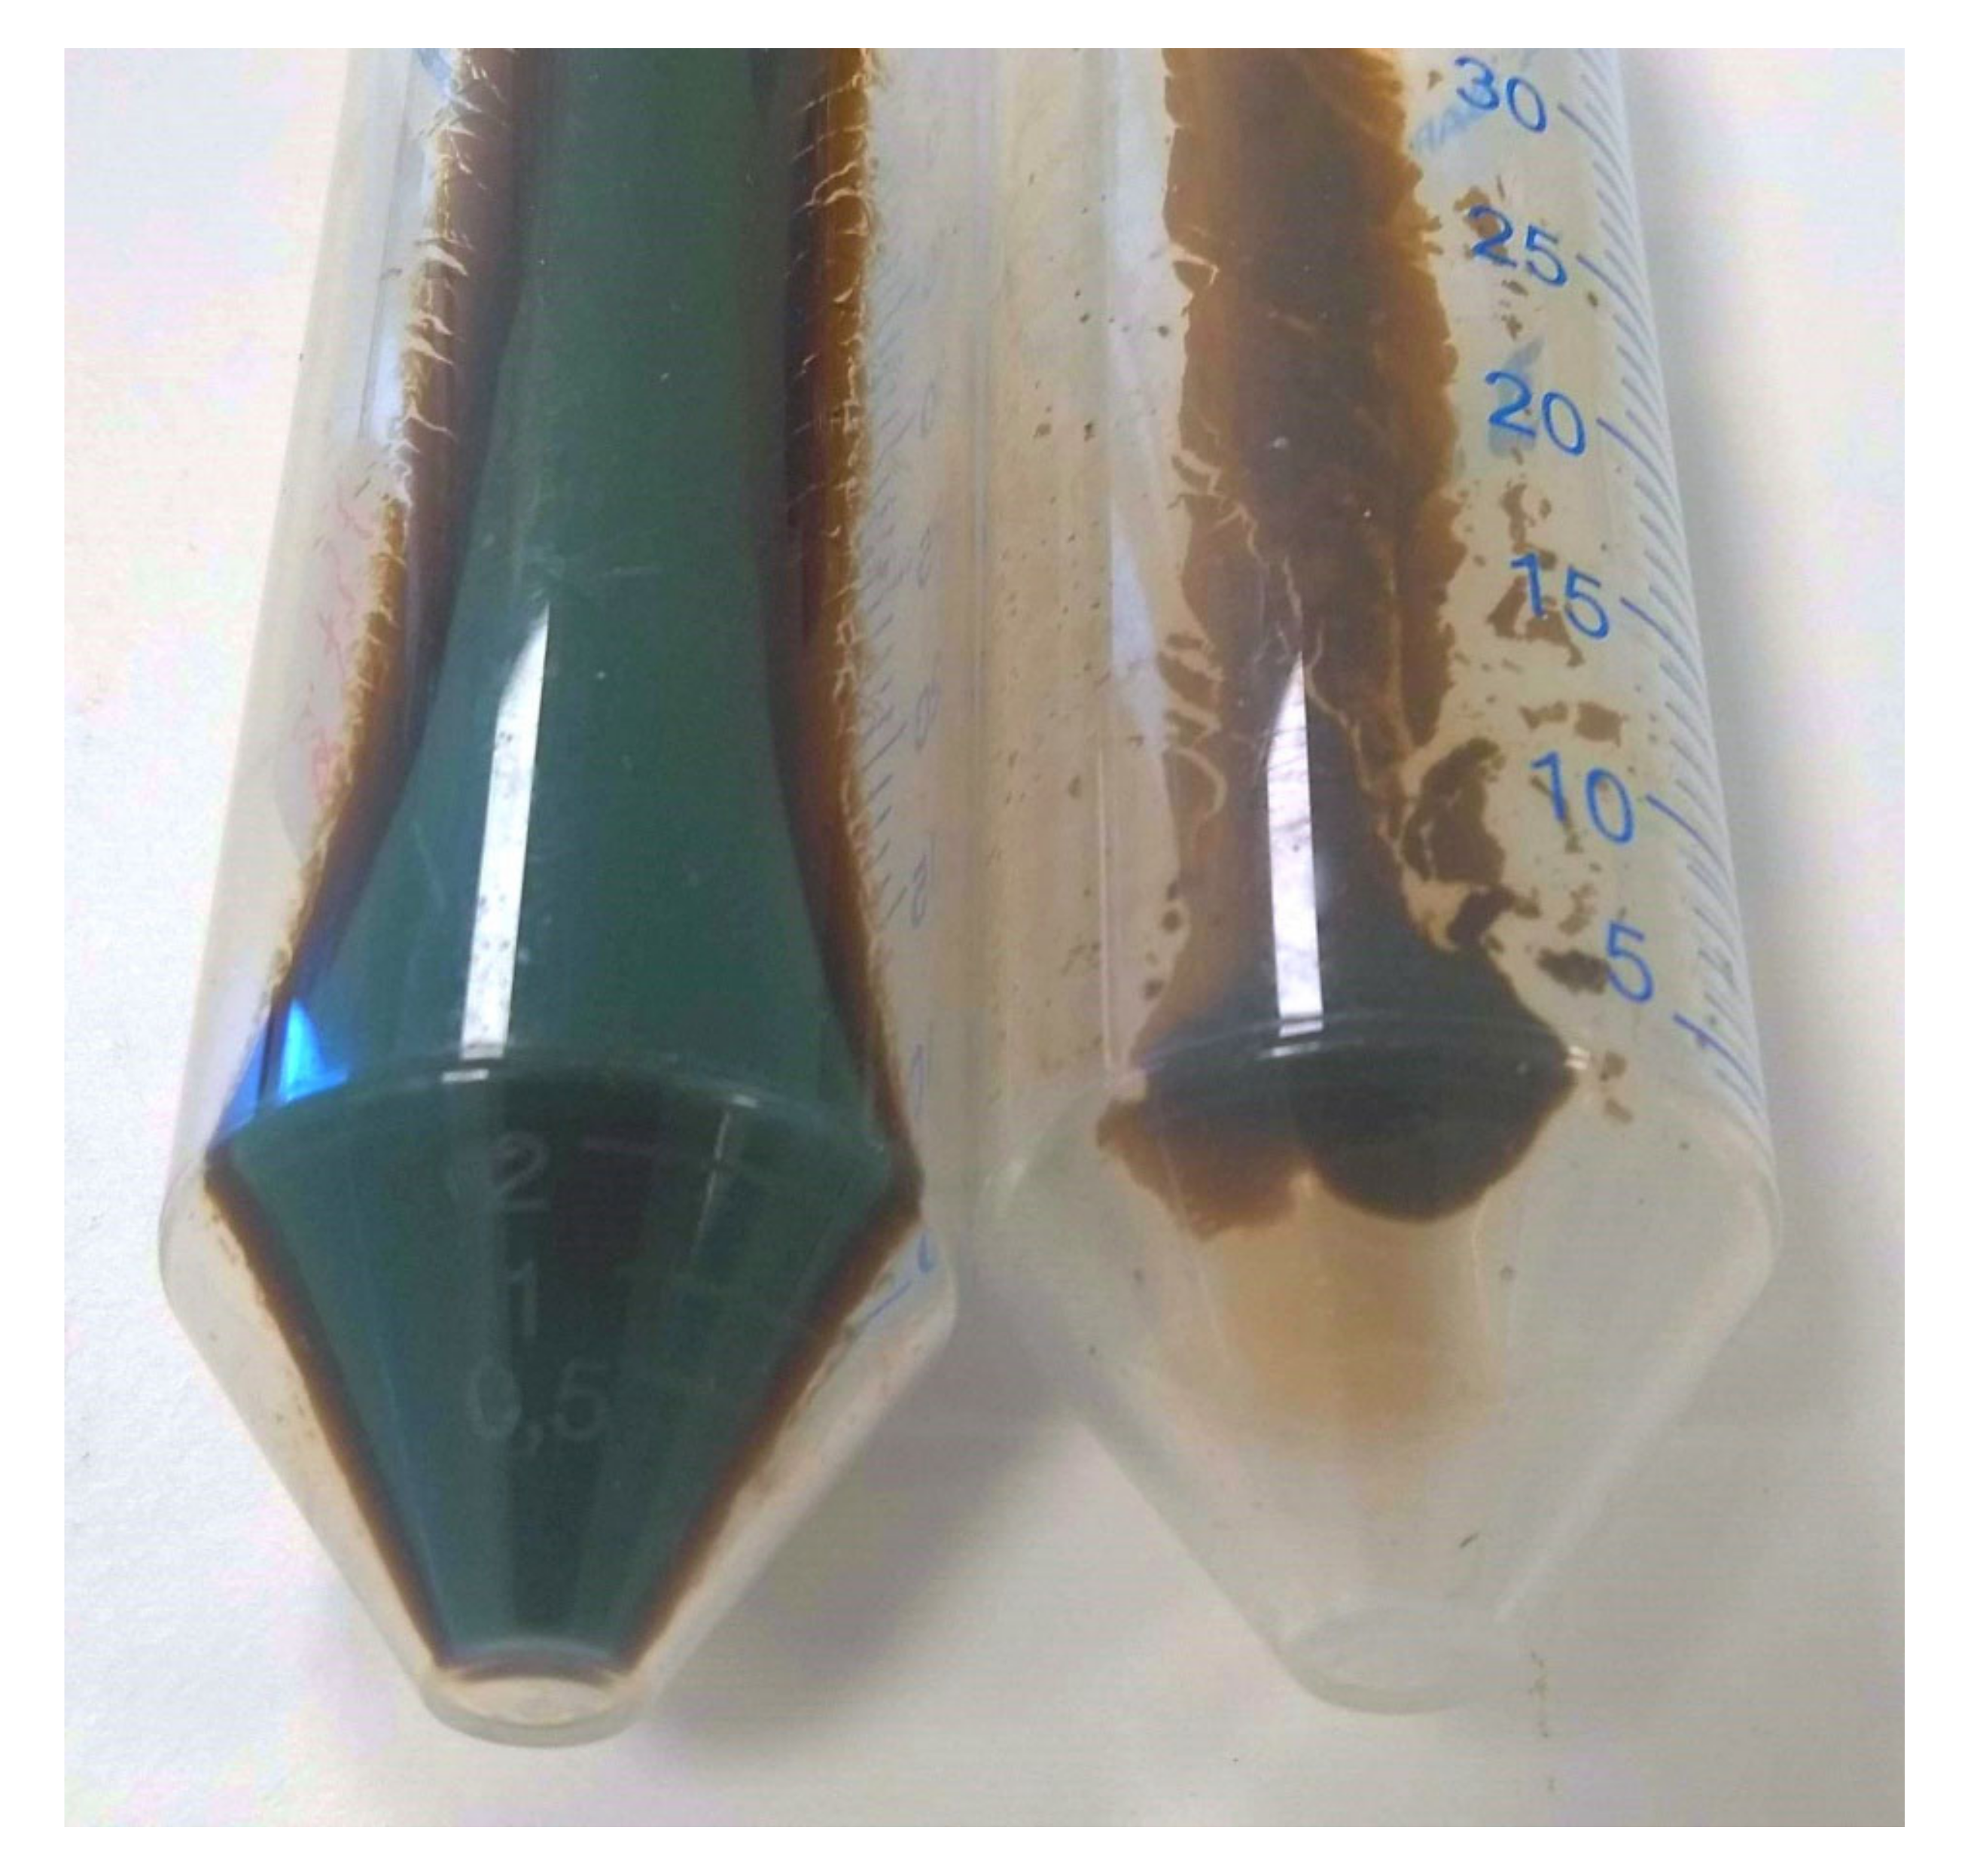
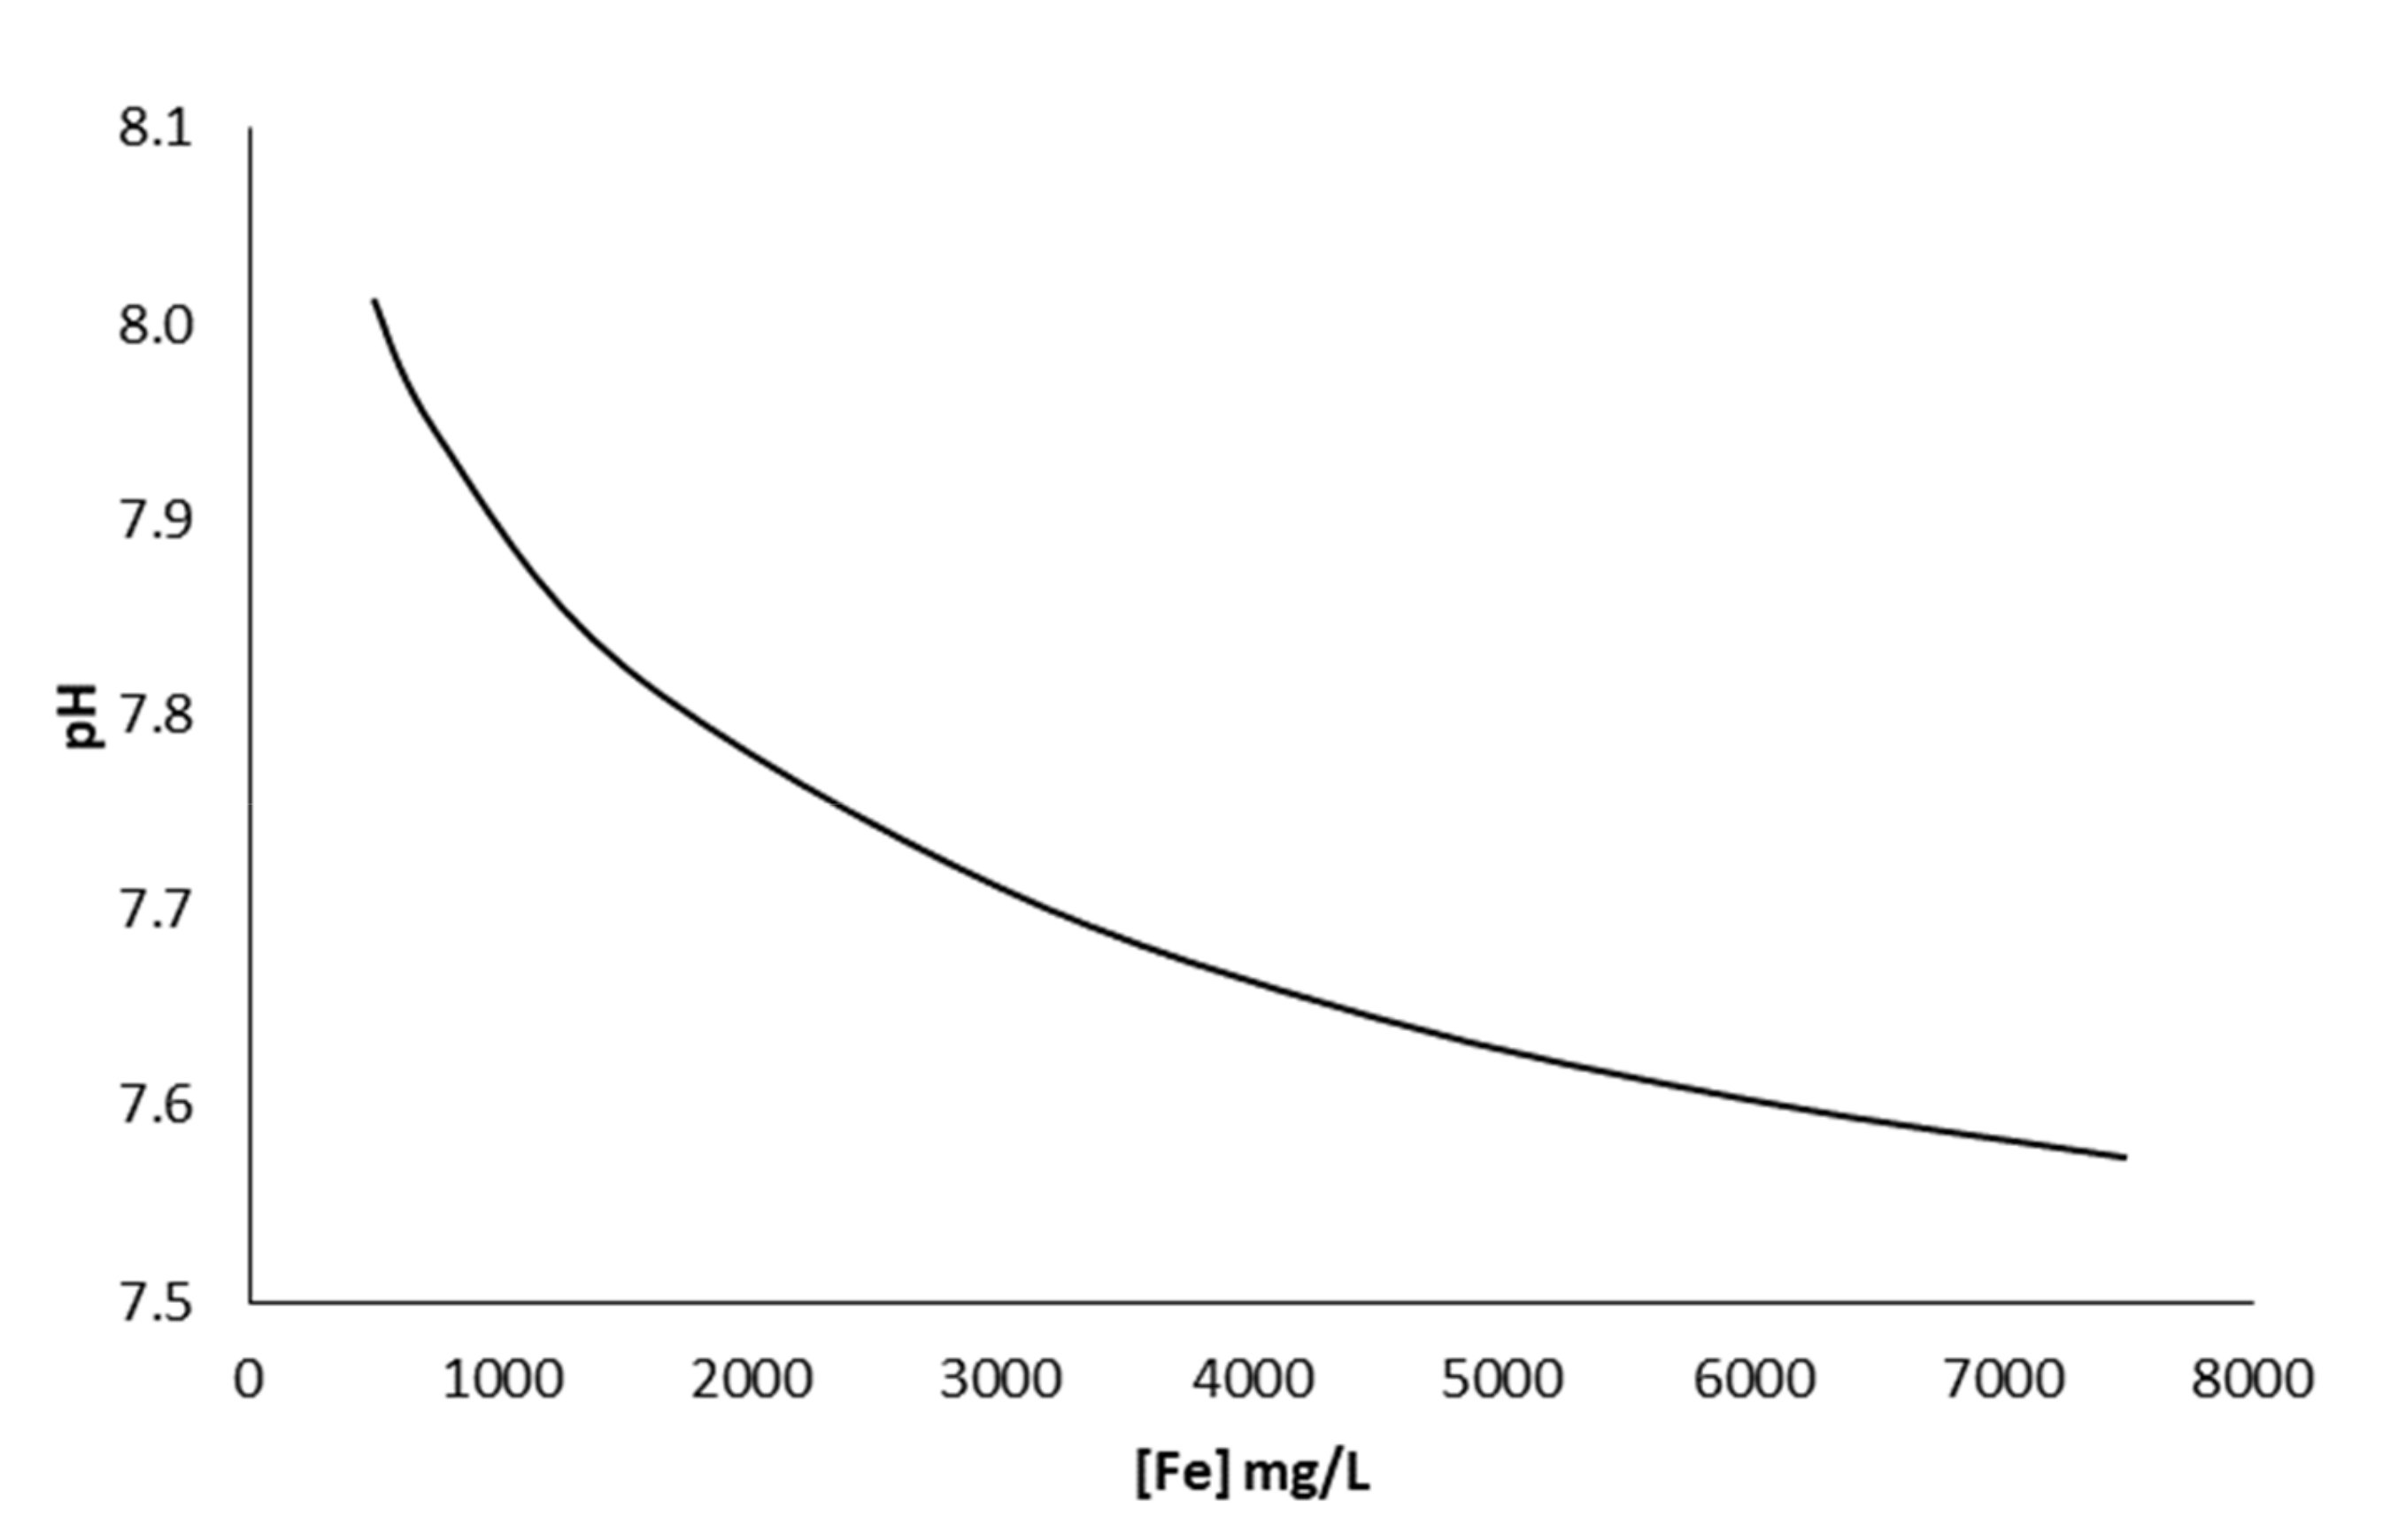
3.2. Iron Complexation

Once supernatant was filtered and protein content was determined, the complexation reaction was conducted using a protein-to-iron ratio of 2:1. Two protein concentrations were tested: 1 g/L and 16.6 g/L (samples Original_1 and Original_17, respectively). At the lower concentration, the effect of pre-drying the supernatant was also evaluated (sample Dried_1). After the complexation reaction, samples were centrifuged for the removal of bigger precipitates and later filtered using a glass fibre membrane (1.2 µm pore size). Samples were collected at each point for dry weight and iron determination, and named initial, pre-filtration and post-filtration, respectively, as seen in Table 2.
Regarding the dry weight of both dried and original samples, the lower concentration samples started with about 1.1 g per batch and ended with 0.91 and 1.06 g per batch, respectively. This corresponds to an overall yield of 84 and 91%, respectively. Although small, the difference is statistically significant, and in favour of not drying the supernatant prior to the complexation reaction. The same trend is visible with the iron mass found in the final product, with similar yields. Therefore, drying out the supernatant may only be a viable option if long-term dry storage is needed, although further stability tests are needed to confirm this theory.
Interestingly, the complexation reaction with a higher concentration has shown a significant difference when compared to that of the lower concentration reaction, particularly regarding iron mass (Table 2). At 83.7%, dry mass yield equals that of the dried sample at the lower concentration (84.0%), which is less than that of equal process but also at lower concentration (91%). However, the most striking difference lies with the soluble iron content (and allegedly complexed) found at the end of the cleaning process. While both samples with a protein concentration of 1 g/L had a total yield of about 80%, protein concentration samples of 17 g/L only had a total yield of 63.4%, an almost 20 percent drop. Despite the complexation process being the same, the pellet obtained when changing protein and iron concentrations, was completely different: when observing the pellet of the lowest concentration used (Original_1), a uniformly brownish pellet was observed; in the highest concentration (Original_17), a two-layer pellet was observed, with a large and denser, green-blueish precipitate (Figure 1).
Given both its colour and the loss of iron in the process, our first assumption was that they were likely to be iron (II) hydroxides. Conducting a chemical simulation with varying Fe(II) concentrations shows that the point of equilibrium for the precipitation of the ferrous hydroxides (Equation (1)) decreases from about pH 8.0 to pH 7.6, as the concentration of iron increases from 250 to 7500 mg/L (Figure 2). These values fall short of those observed experimentally, and are therefore not enough to explain the observed precipitation. However, another possible reason is that although a N2 purge is conducted to create an anoxic environment, it is still possible that the pE is enough to oxidize some Fe(II) into Fe(III). The formation of the mixed Fe(II) and Fe(III) precipitate Fe3(OH)8, of a greenish colour, has been described previously when using sulphate salts during titration reactions at pH 7.0 [29]. It is thus possible that the formation of Fe(III) species, due to the oxidation of Fe(II), lead to the formation of more insoluble species of Fe(III) and mixed species such as the Fe3(OH)8, (putatively formed as in Equation (2)), which have the described colour, as observed in the precipitate (as in Figure 1) [29,30]. These are then, in turn, protected from oxidation by the generally anoxic environment, and later, by the lighter organic pellet formed above. However, further studies would need to be conducted to confirm this assumption.
FeOH 2 s Fe 2 + aq + 2   OH   aq
Fe 3 OH 8 aq Fe 2 + aq +   Fe 3 + aq + 8   H 2 O   aq
Finally, if we combine the extraction (autolysis) mass yield with the complexation mass yields in the different tested conditions, we can obtain the overall mass yield of iron–peptide complexes per amount of yeast used (w/w basis). For the Dried_1 sample, an overall yield of 4.73% was obtained, while for the Original_1 and Original_17 samples, the yields were 5.13 and 4.72%, respectively.
Therefore, taking into consideration the current results, a more diluted concentration of protein (and, therefore, iron salts) is desirable in order to achieve a maximum complexation yield, compared to that obtained when using the undiluted supernatant solution tested in this study. Other intermediate concentrations need to be tested to further pinpoint the optimal concentration.

3.3. Characterization

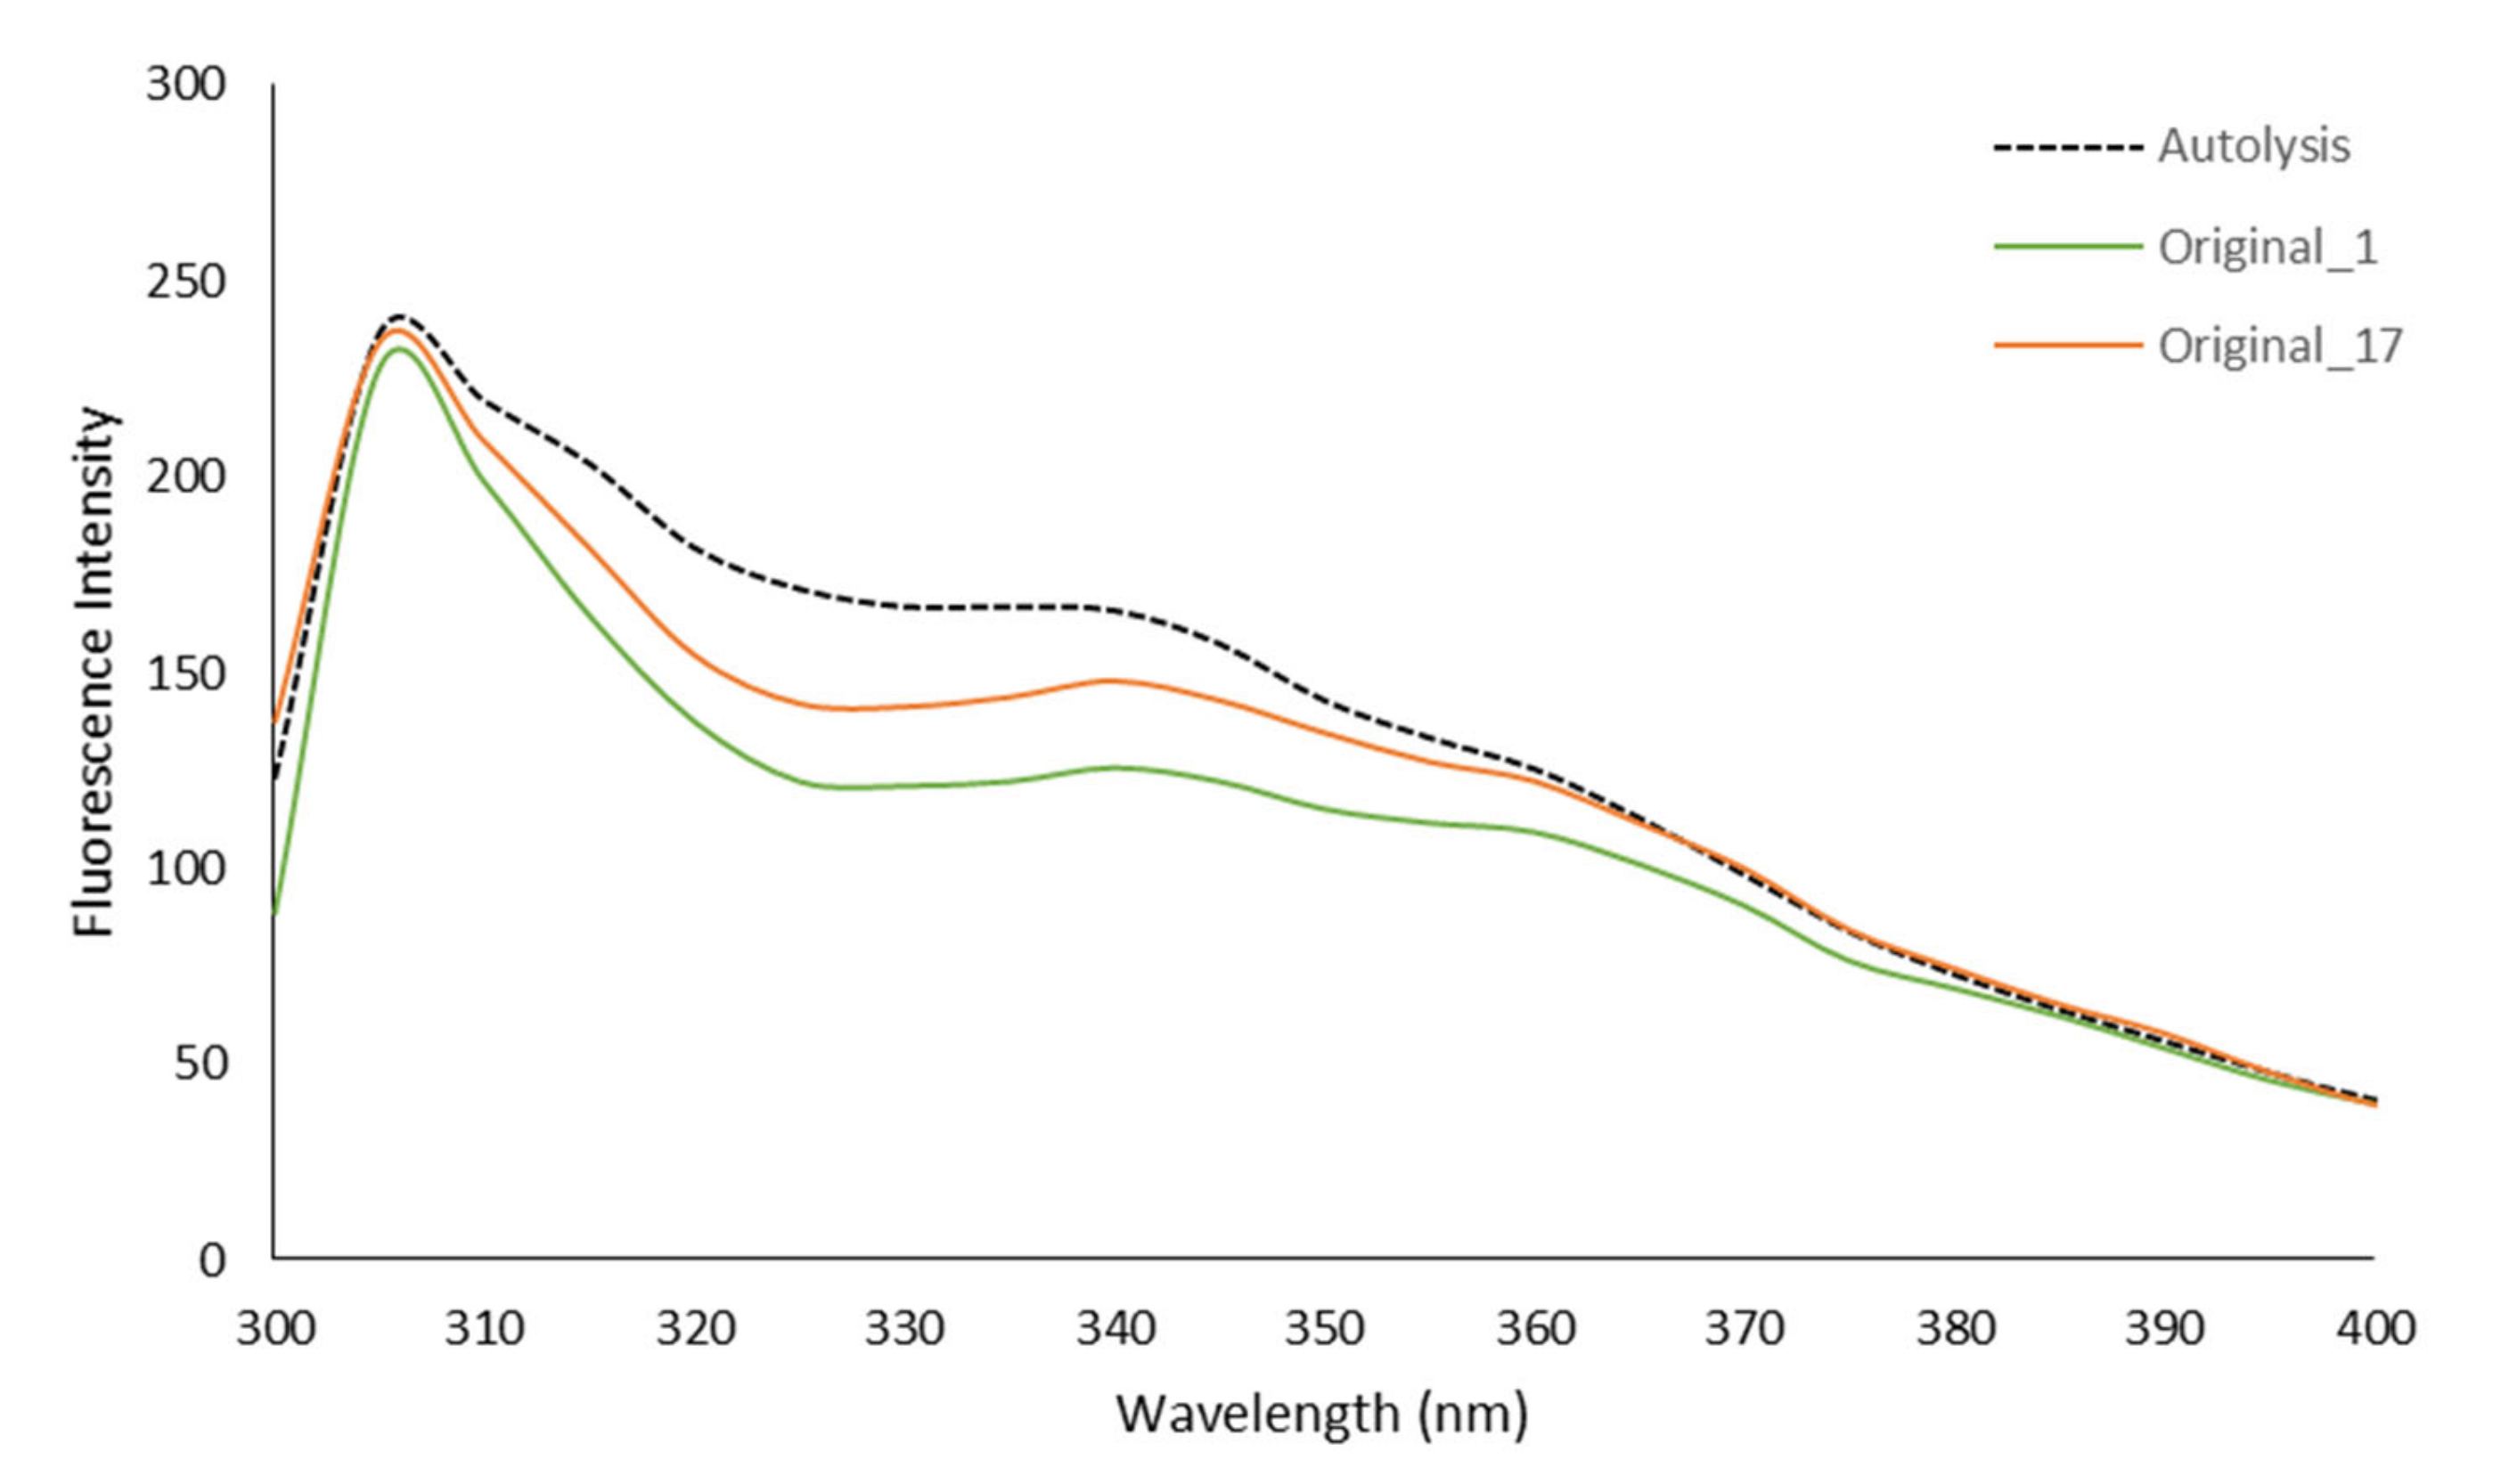
3.3.1. Intrinsic Fluorescence
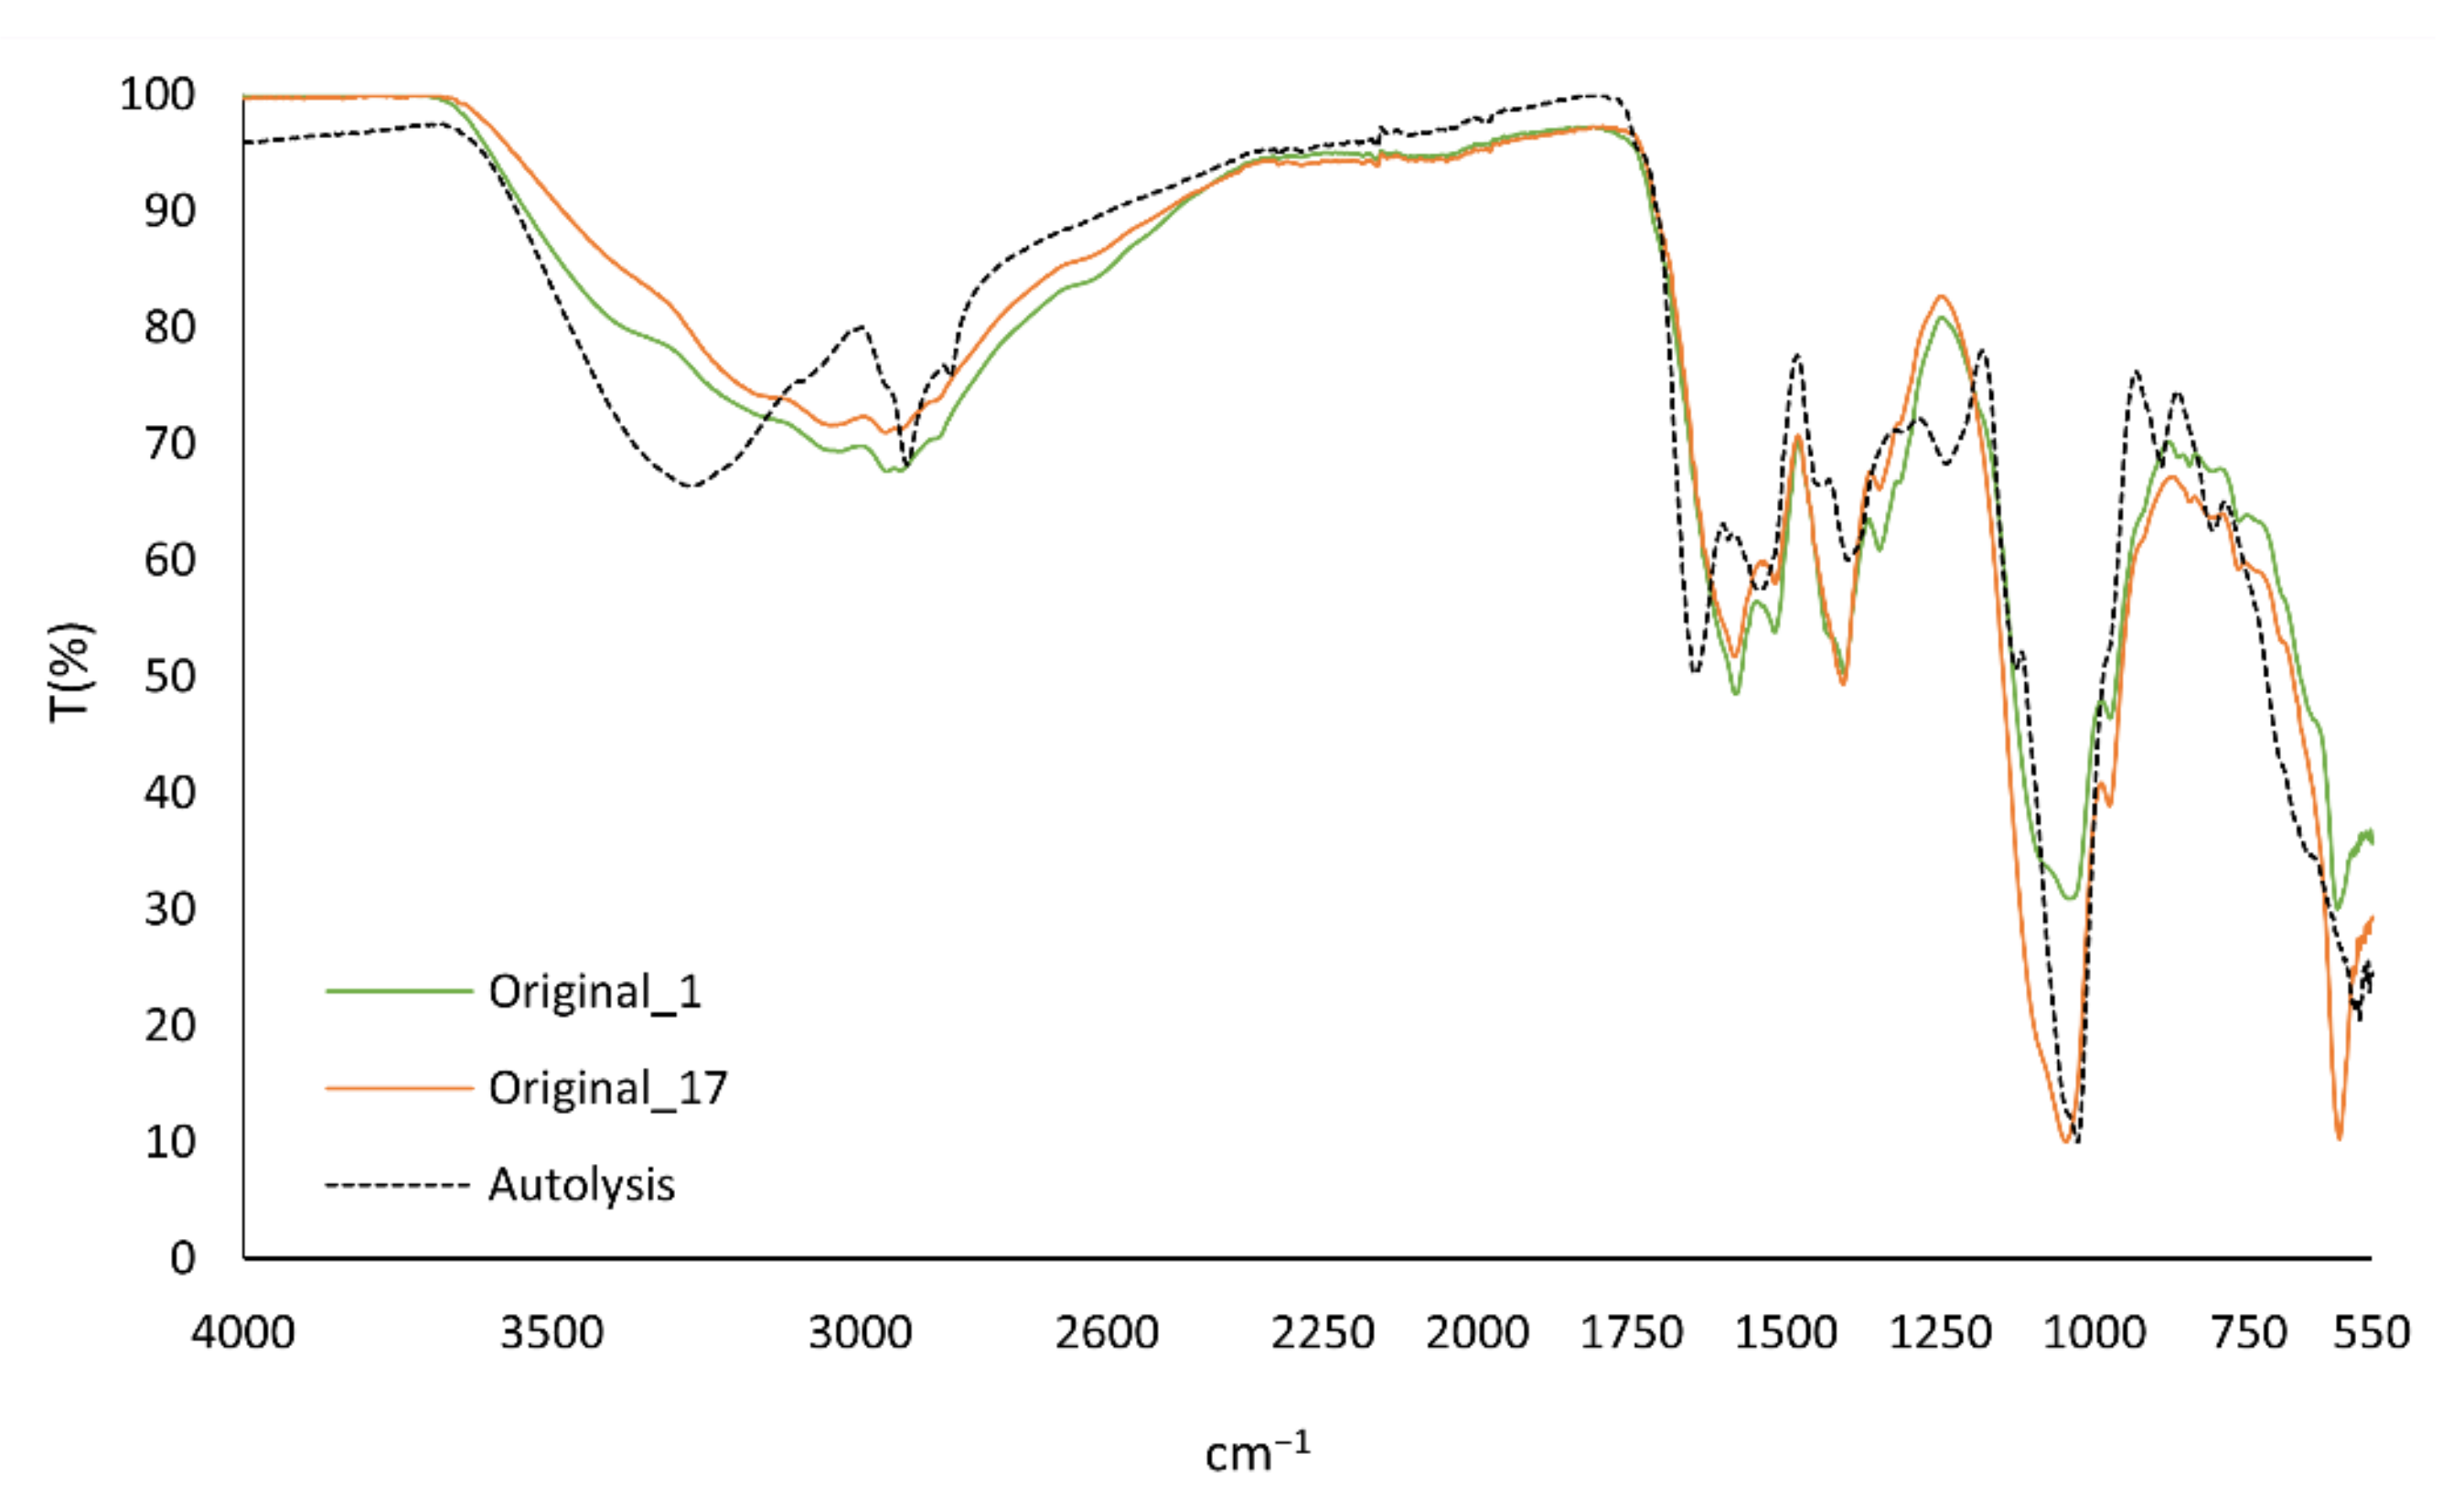
The intrinsic fluorescence of the original autolysis supernatant and the two iron–peptide complex mixtures can be seen in Figure 3. An overall decrease in fluorescence intensity is seen as a result of the reaction with iron, as a consequence of conformational changes induced by the complexation of iron, resulting in a lower exposure of tryptophan to solvent. This, in turn, changes the emission behaviour, resulting in a lower fluorescence intensity [31]. The obtained data are in agreement with those found in the literature. For example, Wu et al. [22] observed a decrease in fluorescence after the addition of FeSO4 to anchovy muscle protein. Likewise, Zhou et al. [32] and Lin et al. [24] also observed a reduction in fluorescence intensity when mixing their protein matrices with iron salts.
Comparing the two tested concentrations, a greater decrease in fluorescence is seen in the complexes formed with a protein concentration of 1 g/L, which might indicate a higher degree of complexation than that found in the complex mix created at a protein concentration of 17 g/L. This result further supports the previous observations that this high concentration is not beneficial for complexation, as it evidences a lower degree of complexation compared to that of the lower concentration, reflected by the lower decrease in fluorescence, as recorded in Figure 3.

3.3.2. FT-IR

Spectral FT-IR analysis can be seen in Figure 4, where samples which did not undergo complexation (autolysis) are compared to both samples of different concentrations (Origianl_1 and Original_17, respectively). The most significant difference is found in the range from 3500 to 2500 cm−1, where the sharp C-H stretching bands are located at about 3000 cm−1 [33], and the wide band at 3400 cm−1, which can be attributed to Amine A [16], can be seen on the autolysis spectrum. It is also noted that with both complex mixes, the amine A band seems to have shifted from 3400 to about 3100 cm−1 and has broadened, almost masking the C-H band. This type of shifting and widening has also been reported by Zhou et al. [32], who associated this change with the N-H stretch and with the hydrogen bonds being replaced by Fe-N bonds [32].
Other changes are also visible in the from 1750 to 1400 cm−1 range. Two strong peaks have appeared at 1580 and 1410 cm−1, while in the un-complexed supernatant, similar bands are found at 1650 and 1390 cm−1, with lower intensity in the latter. These shifts may be related to the stretching vibration of Fe-COO bonds, asymmetrically and symmetrically, respectively, as reported previously [34], further supporting the presence of iron–peptide complexes.
Given the FT-IR results, and the likeliness of Original_1 and Original_17 spectra, one can conclude that not only is the formation of complexes likely, but that the difference in concentrations used has no significant impact on the type of complexes formed.

3.3.3. Scanning Electron Microscopy (SEM)

As evident in Figure 5, while the surface and shape of the autolysis supernatant powder (Figure 5A) and both complexes (Figure 5B,C) are similar, it can be observed that there is a clear size reduction in the iron–peptide complexes. In all samples, it is possible to observe particle aggregates constituted by smaller rough spherical forms. In the case of the autolysis supernatant (Figure 5A) and the iron–peptide complex represented in Figure 5C, it is also possible to observe scarce, small, smooth plates besides the rough spherical forms. Therefore, there is an overall decrease in the particle size observed for the iron–peptide complexes (Figure 5), which may be attributed to the complexation reaction, due to the interaction of peptides and iron ions, and which is also in agreement with studies reported for other iron–peptide complexes [24]. The presence of spherical particles is also typical in the formation of iron–peptide complexes, as reported by different authors [13].

4. Conclusions

It has been shown in this study that it is possible to increase the concentration of the complex constituents (peptide-rich supernatant and iron) without affecting the quality of the complex formed. However, a decrease in yield is expected as iron concentration is increased. Nonetheless, as shown by the FT-IR analysis, the type and quality of the metal complexes is not affected by the increasing concentrations. When increasing the iron concentration, iron equilibria must be considered, both from the perspective of soluble complex species being formed, and as precipitates and oxidation reactions, which might undermine the final complexation and process yields. Therefore, not only care should be given to the concentration, but also to the deployment and maintenance of an anoxic condition. It was also concluded that the process of predrying peptide-rich supernatant solutions can be bypassed, and its use is only advisable if long-term storage is required. Regarding the overall process, further optimization studies are required in order to pinpoint the optimal concentration that can lead to the design of an optimal process for the valorization of spent yeast as forms of iron supplementation. This includes studies on the precipitate material, to understand the type and quality of the metal precipitates formed and how this can be avoided to further enhance the process. This further research will ultimately allow us to develop a method for the valorization of spent yeast as an added-value commercial item, namely, iron–peptide complexes.

Author Contributions

Conceptualization, C.F. and A.P.C.; Formal analysis, C.F., C.F.P., A.S.O., M.F., A.M.P., J.D. and J.O.P.; Funding acquisition, M.E.P. and A.P.C.; Investigation, C.F., C.F.P., A.S.O., M.F., A.M.P., J.D. and J.O.P.; Methodology, C.F. and C.F.P.; Project administration, M.E.P. and A.P.C.; Resources, M.E.P. and A.P.C.; Supervision, M.E.P. and A.P.C.; Validation, A.P.C.; Writing—original draft, C.F. and C.F.P.; Writing—review and editing, C.F. and C.F.P. All authors have read and agreed to the published version of the manuscript.

Funding

This work was co-financed by European Regional Development Fund (ERDF), through the Operational Program for Competitiveness and Internationalization (POCI) under Alchemy project—Capturing high value from industrial fermentation bio products (POCI-01-0247-FEDER-027578). We would also like to thank the FCT project UIDB/50016/2020.

Institutional Review Board Statement

Not applicable.

Informed Consent Statement

Not applicable.

Data Availability Statement

Not applicable.

Acknowledgments

The authors wish to gratefully thank the funding institutions for their support. They also acknowledge the Centre for Biotechnology and Fine Chemistry (CBQF), Amyris Bio Products Portugal and the Catholic University of Porto and respective staff for their administrative, logistical, and technical support.

Conflicts of Interest

The authors declare no conflict of interest.

References

  1. Waldvogel-Abramowski, S.; Waeber, G.; Gassner, C.; Buser, A.; Frey, B.M.; Favrat, B.; Tissot, J.-D. Physiology of Iron Metabolism. Transfus. Med. Hemotherapy 2014, 41, 213–221. [Google Scholar] [CrossRef] [PubMed] [Green Version]
  2. Gharibzahedi, S.M.T.; Jafari, S.M. The Importance of Minerals in Human Nutrition: Bioavailability, Food Fortification, Processing Effects and Nanoencapsulation. Trends Food Sci. Technol. 2017, 62, 119–132. [Google Scholar] [CrossRef]
  3. Gowan, J.; Roller, L. Disease State Management: Iron Deficiency with or without Anaemia. Aust. J. Pharm. 2022, 103, 110–117. [Google Scholar]
  4. Safiri, S.; Kolahi, A.A.; Noori, M.; Nejadghaderi, S.A.; Karamzad, N.; Bragazzi, N.L.; Sullman, M.J.M.; Abdollahi, M.; Collins, G.S.; Kaufman, J.S.; et al. Burden of Anemia and Its Underlying Causes in 204 Countries and Territories, 1990–2019: Results from the Global Burden of Disease Study 2019. J. Hematol. Oncol. 2021, 14, 185. [Google Scholar] [CrossRef] [PubMed]
  5. World Health Organization. Worldwide Prevalence of Anaemia 1993–2005; WHO: Geneva, Switzerland, 2008. [Google Scholar]
  6. WHO Anaemia in Women and Children. Available online: https://www.who.int/data/gho/data/themes/topics/anaemia_in_women_and_children (accessed on 29 March 2022).
  7. Fairweather-Tait, S.J.; Teucher, B. Iron and Calcium Bioavailability of Fortified Foods and Dietary Supplements. Nutr. Rev. 2002, 60, 360–367. [Google Scholar] [CrossRef] [Green Version]
  8. Zhang, Y.; Ding, X.; Li, M. Preparation, Characterization and in Vitro Stability of Iron-Chelating Peptides from Mung Beans. Food Chem. 2021, 349, 129101. [Google Scholar] [CrossRef]
  9. Athira, S.; Mann, B.; Sharma, R.; Pothuraju, R.; Bajaj, R.K. Preparation and Characterization of Iron-Chelating Peptides from Whey Protein: An Alternative Approach for Chemical Iron Fortification. Food Res. Int. 2021, 141, 110133. [Google Scholar] [CrossRef]
  10. Jeppsen, R.; Borzelleca, J. Safety Evaluation of Ferrous Bisglycinate Chelate. Food Chem. Toxicol. 1999, 37, 723–731. [Google Scholar] [CrossRef]
  11. Shubham, K.; Anukiruthika, T.; Dutta, S.; Kashyap, A.V.; Moses, J.A.; Anandharamakrishnan, C. Iron Deficiency Anemia: A Comprehensive Review on Iron Absorption, Bioavailability and Emerging Food Fortification Approaches. Trends Food Sci. Technol. 2020, 99, 58–75. [Google Scholar] [CrossRef]
  12. Budseekoad, S.; Yupanqui, C.T.; Sirinupong, N.; Alashi, A.M.; Aluko, R.E.; Youravong, W. Structural and Functional Characterization of Calcium and Iron-Binding Peptides from Mung Bean Protein Hydrolysate. J. Funct. Foods 2018, 49, 333–341. [Google Scholar] [CrossRef]
  13. Wang, T.; Lin, S.; Cui, P.; Bao, Z.; Liu, K.; Jiang, P.; Zhu, B.; Sun, N. Antarctic Krill Derived Peptide as a Nanocarrier of Iron through the Gastrointestinal Tract. Food Biosci. 2020, 36, 100657. [Google Scholar] [CrossRef]
  14. Yuan, B.; Zhao, C.; Cheng, C.; Huang, D.; Cheng, S.; Cao, C.; Chen, G. A Peptide-Fe(II) Complex from Grifola Frondosa Protein Hydrolysates and Its Immunomodulatory Activity. Food Biosci. 2019, 32, 100459. [Google Scholar] [CrossRef]
  15. Smialowska, A.; Matia-Merino, L.; Carr, A.J. Assessing the Iron Chelation Capacity of Goat Casein Digest Isolates. J. Dairy Sci. 2017, 100, 2553–2563. [Google Scholar] [CrossRef] [Green Version]
  16. Wu, W.; Li, B.; Hou, H.; Zhang, H.; Zhao, X. Identification of Iron-Chelating Peptides from Pacific Cod Skin Gelatin and the Possible Binding Mode. J. Funct. Foods 2017, 35, 418–427. [Google Scholar] [CrossRef]
  17. Sun, N.; Cui, P.; Jin, Z.; Wu, H.; Wang, Y.; Lin, S. Contributions of Molecular Size, Charge Distribution, and Specific Amino Acids to the Iron-Binding Capacity of Sea Cucumber (Stichopus japonicus) Ovum Hydrolysates. Food Chem. 2017, 230, 627–636. [Google Scholar] [CrossRef]
  18. Chen, Q.; Guo, L.; Du, F.; Chen, T.; Hou, H.; Li, B. The Chelating Peptide (GPAGPHGPPG) Derived from Alaska Pollock Skin Enhances Calcium, Zinc and Iron Transport in Caco-2 Cells. Int. J. Food Sci. Technol. 2017, 52, 1283–1290. [Google Scholar] [CrossRef]
  19. Oliveira, A.S.; Ferreira, C.; Pereira, J.O.; Pintado, M.E.; Carvalho, A.P. Spent Brewer’s Yeast (Saccharomyces cerevisiae) as a Potential Source of Bioactive Peptides: An Overview. Int. J. Biol. Macromol. 2022, 208, 1116–1126. [Google Scholar] [CrossRef]
  20. Caetano-Silva, M.E.; Netto, F.M.; Bertoldo-Pacheco, M.T.; Alegría, A.; Cilla, A. Peptide-Metal Complexes: Obtention and Role in Increasing Bioavailability and Decreasing the pro-Oxidant Effect of Minerals. Crit. Rev. Food Sci. Nutr. 2020, 5, 1–20. [Google Scholar] [CrossRef]
  21. Guo, L.; Hou, H.; Li, B.; Zhang, Z.; Wang, S.; Zhao, X. Preparation, Isolation and Identification of Iron-Chelating Peptides Derived from Alaska Pollock Skin. Process Biochem. 2013, 48, 988–993. [Google Scholar] [CrossRef]
  22. Wu, H.; Liu, Z.; Zhao, Y.; Zeng, M. Enzymatic Preparation and Characterization of Iron-Chelating Peptides from Anchovy (Engraulis Japonicus) Muscle Protein. Food Res. Int. 2012, 48, 435–441. [Google Scholar] [CrossRef]
  23. Caetano-Silva, M.E.; Bertoldo-Pacheco, M.T.; Paes-Leme, A.F.; Netto, F.M. Iron-Binding Peptides from Whey Protein Hydrolysates: Evaluation, Isolation and Sequencing by LC-MS/MS. Food Res. Int. 2015, 71, 132–139. [Google Scholar] [CrossRef]
  24. Lin, S.; Hu, X.; Li, L.; Yang, X.; Chen, S.; Wu, Y.; Yang, S. Preparation, Purification and Identification of Iron-Chelating Peptides Derived from Tilapia (Oreochromis niloticus) Skin Collagen and Characterization of the Peptide-Iron Complexes. Lwt 2021, 149, 111796. [Google Scholar] [CrossRef]
  25. Amorim, M.; Pereira, J.O.; Gomes, D.; Pereira, C.D.; Pinheiro, H.; Pintado, M.M.M. Nutritional Ingredients from Spent Brewer’s Yeast Obtained by Hydrolysis and Selective Membrane Filtration Integrated in a Pilot Process. J. Food Eng. 2016, 185, 42–47. [Google Scholar] [CrossRef] [Green Version]
  26. Smith, P.K.; Krohn, R.I.; Hermanson, G.T.; Mallia, A.K.; Gartner, F.H.; Provenzano, M.D.; Fujimoto, E.K.; Goeke, N.M.; Olson, B.J.; Klenk, D.C. Measurement of Protein Using Bicinchoninic Acid. Anal. Biochem. 1985, 150, 76–85. [Google Scholar] [CrossRef]
  27. Oliveira, A.S.; Ferreira, C.; Pereira, J.O.; Pintado, M.E.; Carvalho, A.P. Valorisation of Protein-Rich Extracts from Spent Brewer’s Yeast (Saccharomyces cerevisiae): An Overview. Biomass Convers. Biorefinery 2022, 1–23. [Google Scholar] [CrossRef]
  28. Podpora, B.; Swiderski, F. Spent Brewer’s Yeast Autolysates as a New and Valuable Component of Functional Food and Dietary Supplements. J. Food Process. Technol. 2015, 6. [Google Scholar] [CrossRef] [Green Version]
  29. Hansen, H.C.B.; Borggaard, O.K.; Sørensen, J. Evaluation of the Free Energy of Formation of Fe(II)-Fe(III) Hydroxide-Sulphate (Green Rust) and Its Reduction of Nitrite. Geochim. Cosmochim. Acta 1994, 58, 2599–2608. [Google Scholar] [CrossRef]
  30. Bourrié, G.; Trolard, F.; Jaffrezic, J.-M.R.G.; Maître, V.; Abdelmoula, M. Iron Control by Equilibria between Hydroxy-Green Rusts and Solutions in Hydromorphic Soils. Geochim. Cosmochim. Acta 1999, 63, 3417–3427. [Google Scholar] [CrossRef]
  31. Walters, M.; Esfandi, R.; Tsopmo, A. Potential of Food Hydrolyzed Proteins and Peptides to Chelate Iron or Calcium and Enhance Their Absorption. Foods 2018, 7, 172. [Google Scholar] [CrossRef] [Green Version]
  32. Zhou, J.; Wang, X.; Ai, T.; Cheng, X.; Guo, H.Y.; Teng, G.X.; Mao, X.Y. Preparation and Characterization of β-Lactoglobulin Hydrolysate-Iron Complexes. J. Dairy Sci. 2012, 95, 4230–4236. [Google Scholar] [CrossRef]
  33. Coates, J. Interpretation of Infrared Spectra, A Practical Approach. In Encyclopedia of Analytical Chemistry; John Wiley & Sons, Ltd.: Chichester, UK, 2006; pp. 1–23. [Google Scholar]
  34. Caetano-Silva, M.E.; Alves, R.C.; Lucena, G.N.; Frem, R.C.G.; Bertoldo-Pacheco, M.T.; Lima-Pallone, J.A.; Netto, F.M. Synthesis of Whey Peptide-Iron Complexes: Influence of Using Different Iron Precursor Compounds. Food Res. Int. 2017, 101, 73–81. [Google Scholar] [CrossRef] [PubMed] [Green Version]
Figure 1. Pellets from centrifugation of complexation solution at 5000 rpm for 2 min. On the left Original_17, on the right, Original_1. Note the blue-greenish precipitate found in the Original_17 pellet, which is not present in the Original_1 pellet.
Processes 10 01464 g001
Figure 2. Simulation of equilibrium pH for the precipitation of Fe(OH)2 as a function of total Fe(II) in solution.
Processes 10 01464 g002
Figure 3. Fluorescence emission spectra of autolysis supernatant (dashed line) and iron–peptide complexes at 1 and 17 g/L protein concentrations (solid green and orange lines, respectively). Excitation wavelength = 280 nm; emission wavelength = 300 to 400 nm.
Processes 10 01464 g003
Figure 4. FT-IR spectra of iron–peptide complexes at a protein concentration of 1 g/L (Original_1) and 17 g/L (Original_17) versus autolysis supernatant (original peptide-rich substrate for complexation).
Processes 10 01464 g004
Figure 5. SEM images of the microstructure of spray-dried samples of autolysis supernatant (A) and iron–peptide complexes at protein concentrations of 1 g/L (B) and 17 g/L (C).
Processes 10 01464 g005
Table 1. Average ± standard deviation (n = 2) data collected from the autolysis process of spent Saccharomyces cerevisiae yeast. Autolysis conducted at a 1 g/mL concentration in water at 56 °C. Content was centrifuged at 10,000 rpm for 10 min. Filtration was carried out using a 1.2-µm glass filter.
Yeast PelletPre-FiltrationPost-FiltrationFiltration Step Yield (%)Total Yield (%)
Initial mass (g)195.72 ± 1.02----
Dry Weight (g/L)-67.0 ± 0.450.7 ± 0.675.7% ± 7.3%5.64% ± 0.27%
Protein (g/L)-17.1 ± 0.016.6 ± 0.397.0% ± 1.8%1.85% ± 0.04%
Protein purity (w/w)-25.6%32.7%--
Table 2. Mass balance regarding total mass (dry weight) and iron content in the complexation process. Average ± standard deviation (n = 2). Yield percentages refer to the stepwise (pre-filtration and post-filtration) and overall process yield of each sample, relative either to dry mass or iron mass in samples.
SampleInitialPre-FiltrationPost-FiltrationOverall
Dry weight (g)Dried_11.083 ± 0.0580.947 ± 0.0110.910 ± 0.021
Original_11.170 ± 0.0771.066 ± 0.0031.065 ± 0.012
Original_1716.04 ± 0.5314.29 ± 0.4413.43 ± 0.35
Weight Yield (%)Dried_1 87.4%96.1%84.0%
Original_1 91.1%99.9%91.0%
Original_17 89.1%94.0%83.7%
Iron mass (g)Dried_10.131 ± 0.0060.109 ± 0.0010.105 ± 0.001
Original_10.128 ± 0.0020.106 ± 0.0050.103 ± 0.007
Original_172.805 ± 0.0512.021 ± 0.0761.778 ± 0.106
Iron Mass Yield (%)Dried_1 83.4%96.3%80.3%
Original_1 83.3%96.5%80.4%
Original_17 72.1%88.0%63.4%
Publisher’s Note: MDPI stays neutral with regard to jurisdictional claims in published maps and institutional affiliations.

