
Correlations Based on Numerical Validation of Oscillating Flow Regenerator

 ,
,
Abstract
:1. Introduction
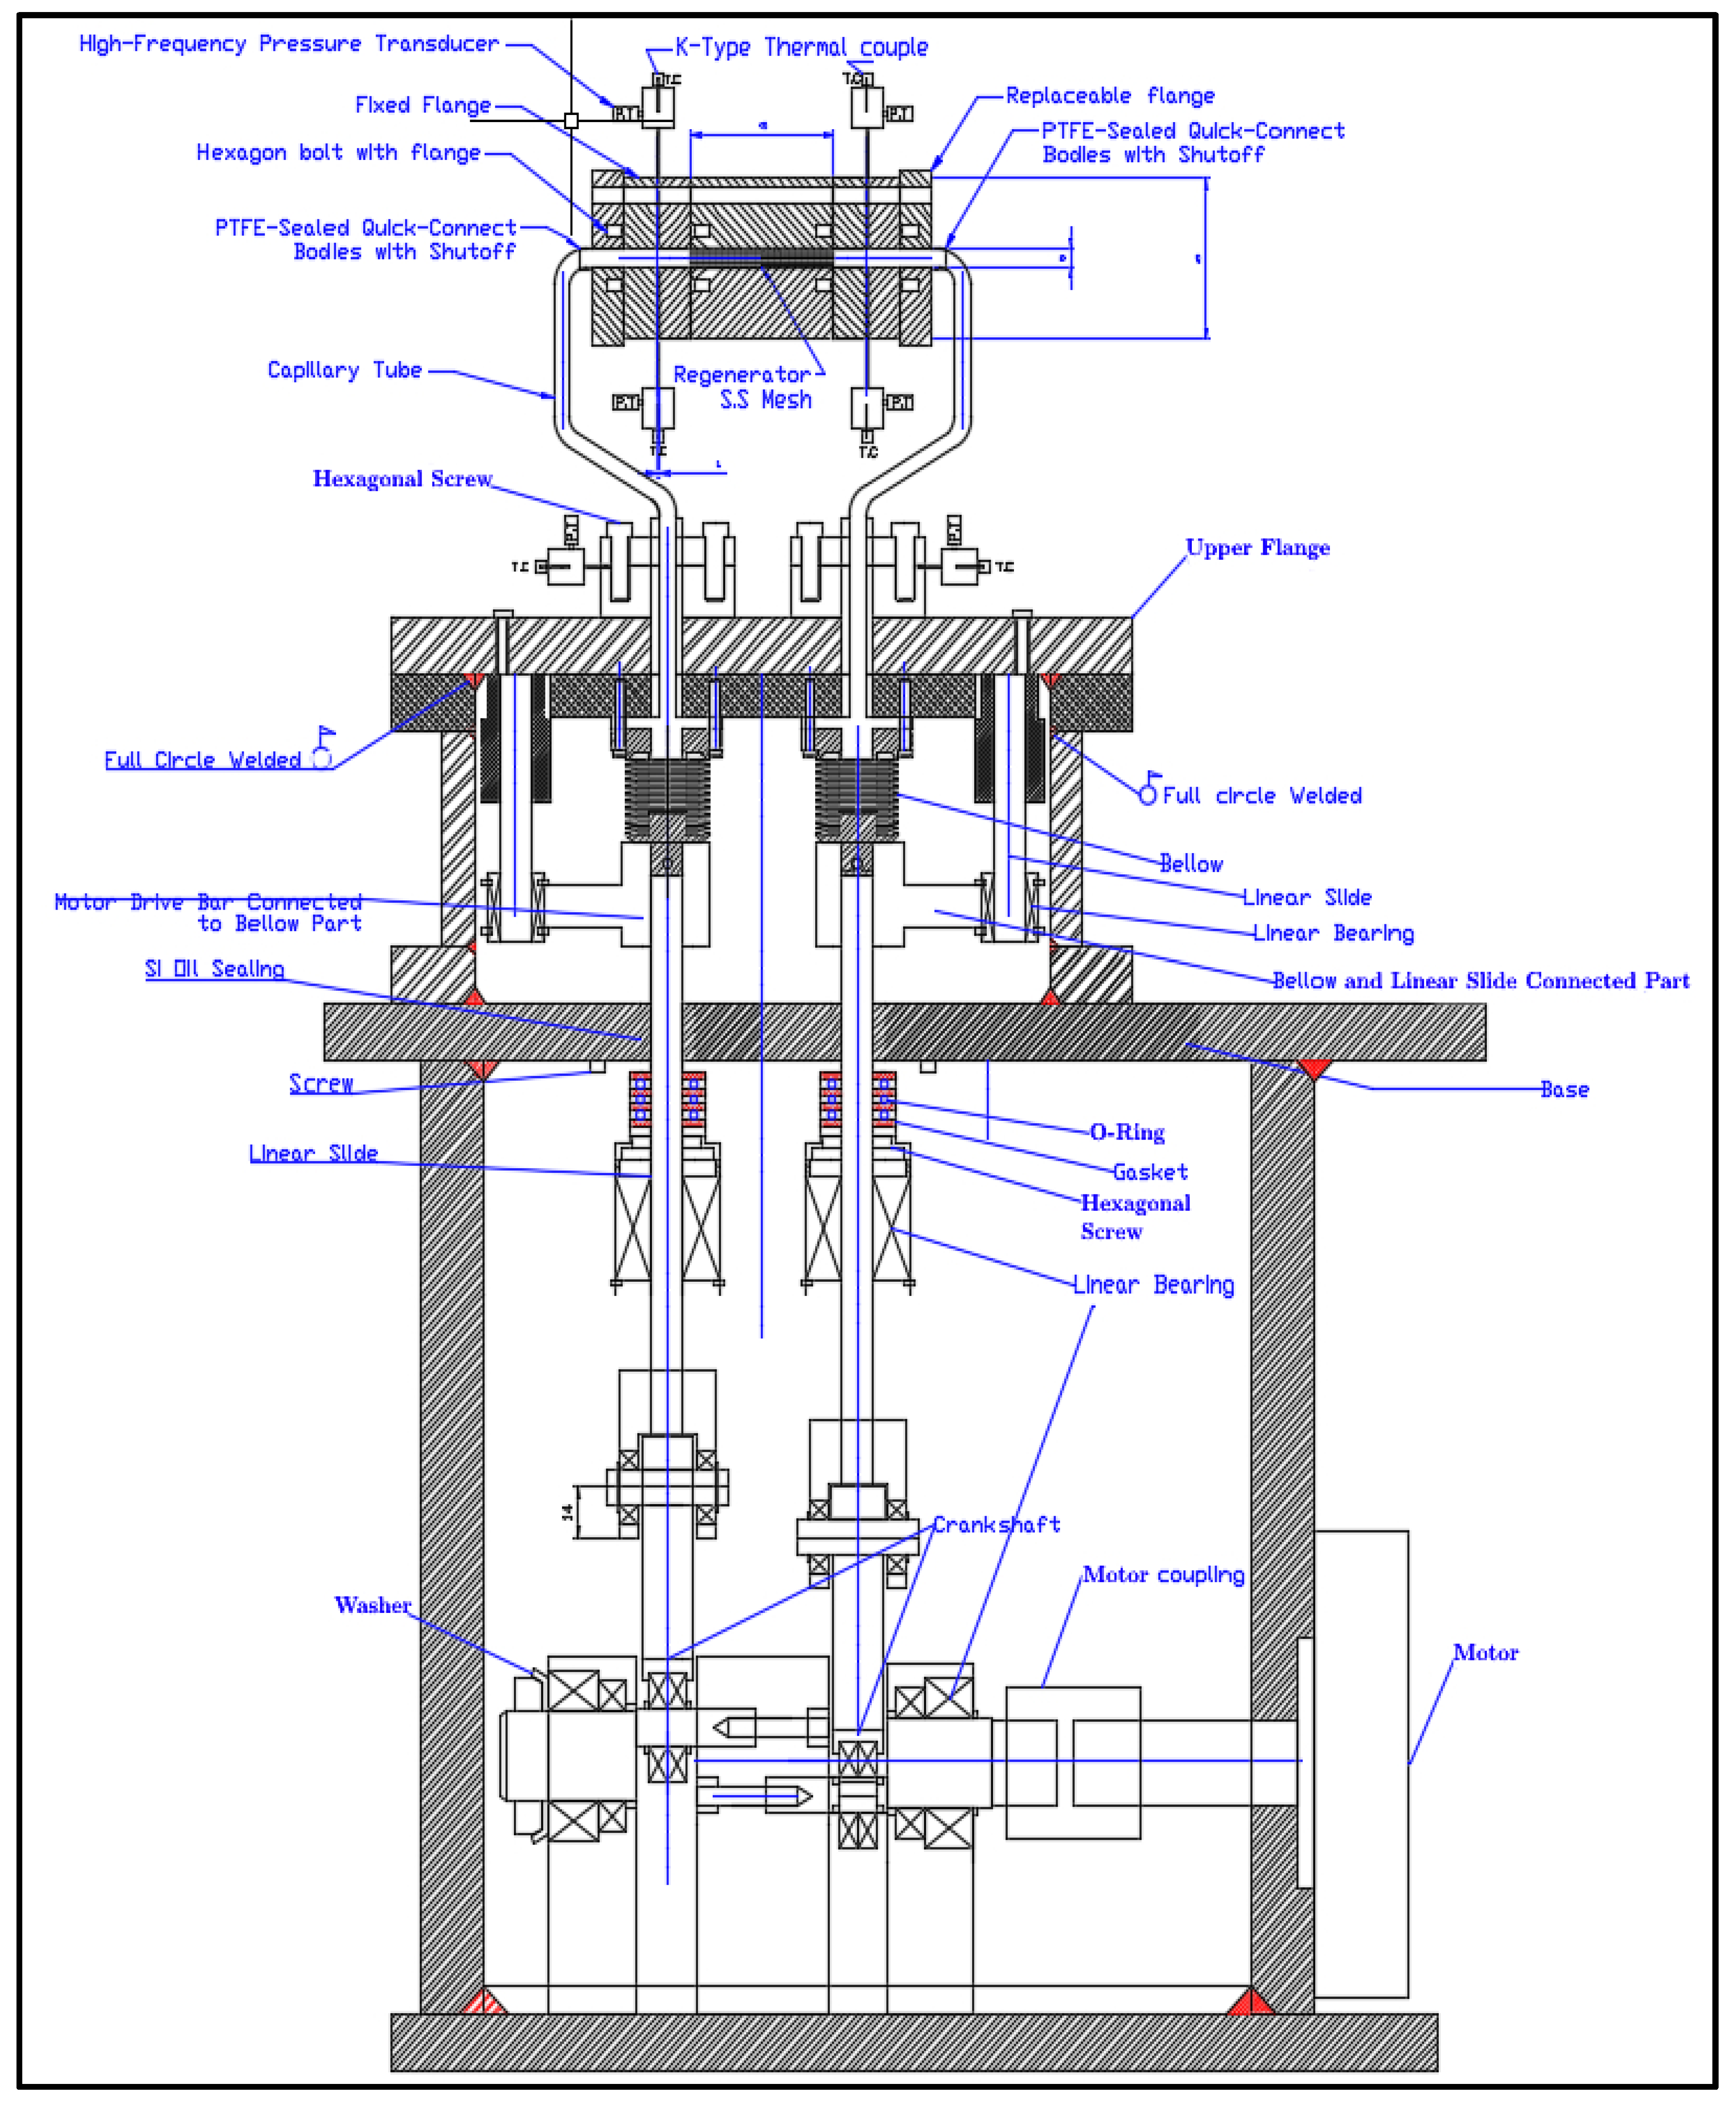
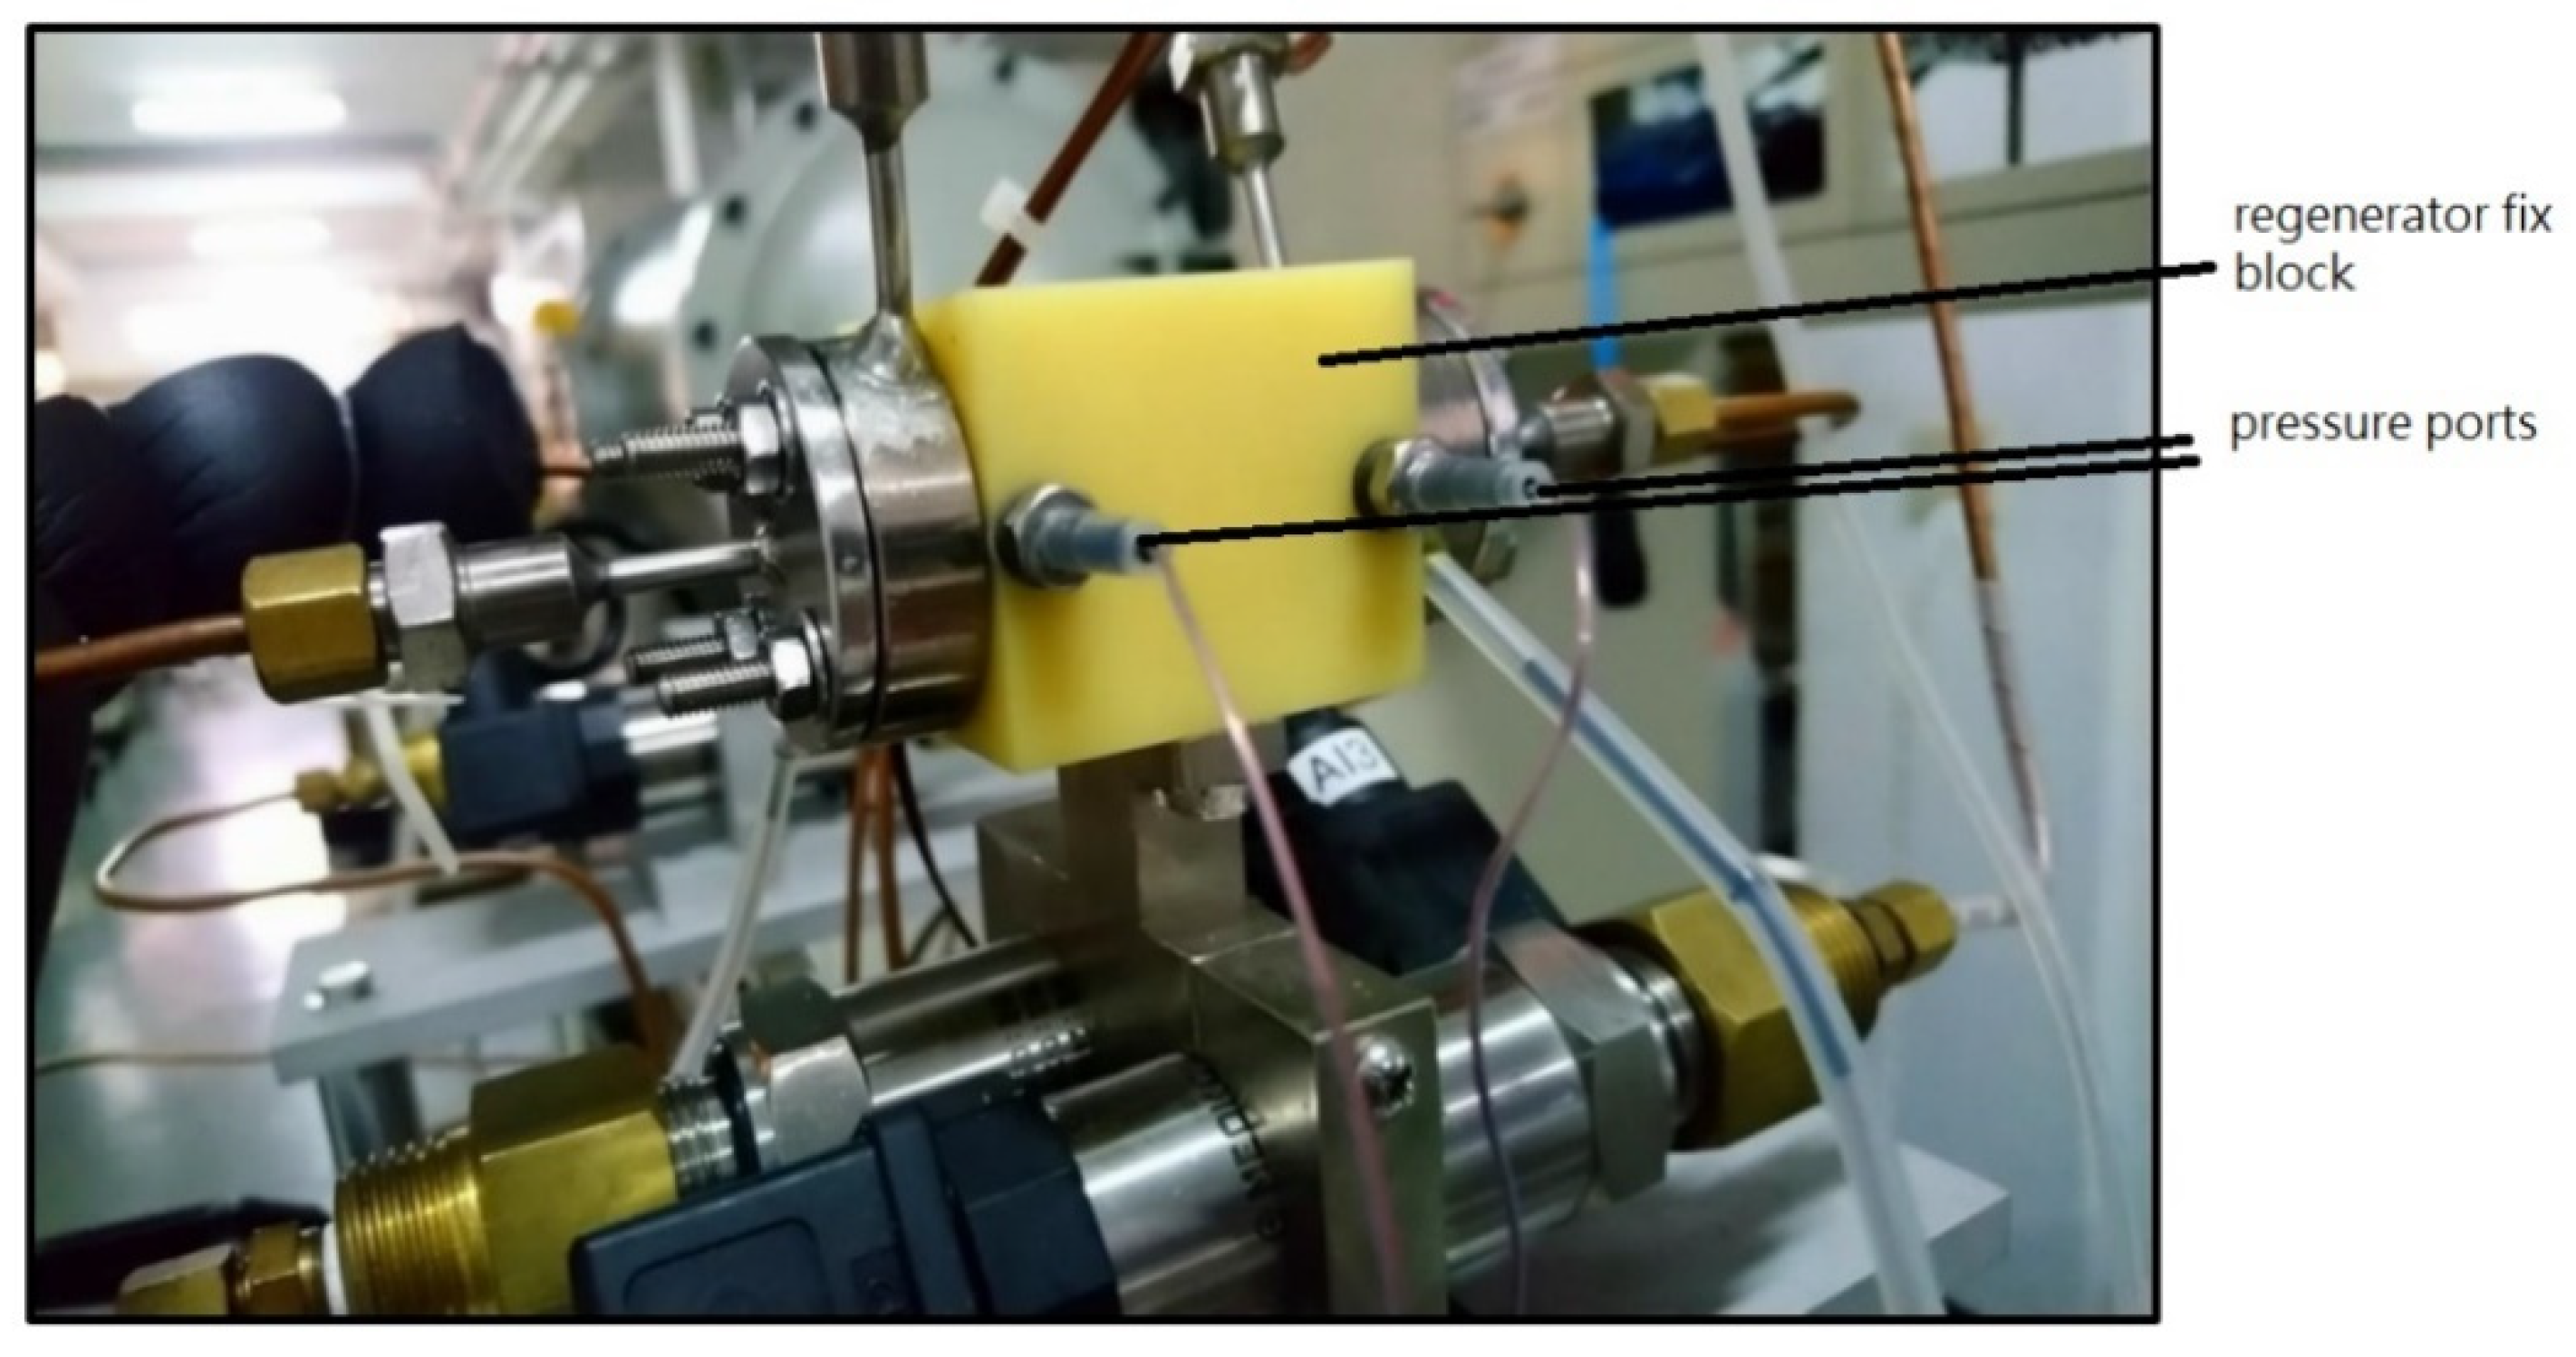
2. Experiment Design and Setup
2.1. Working Fluids
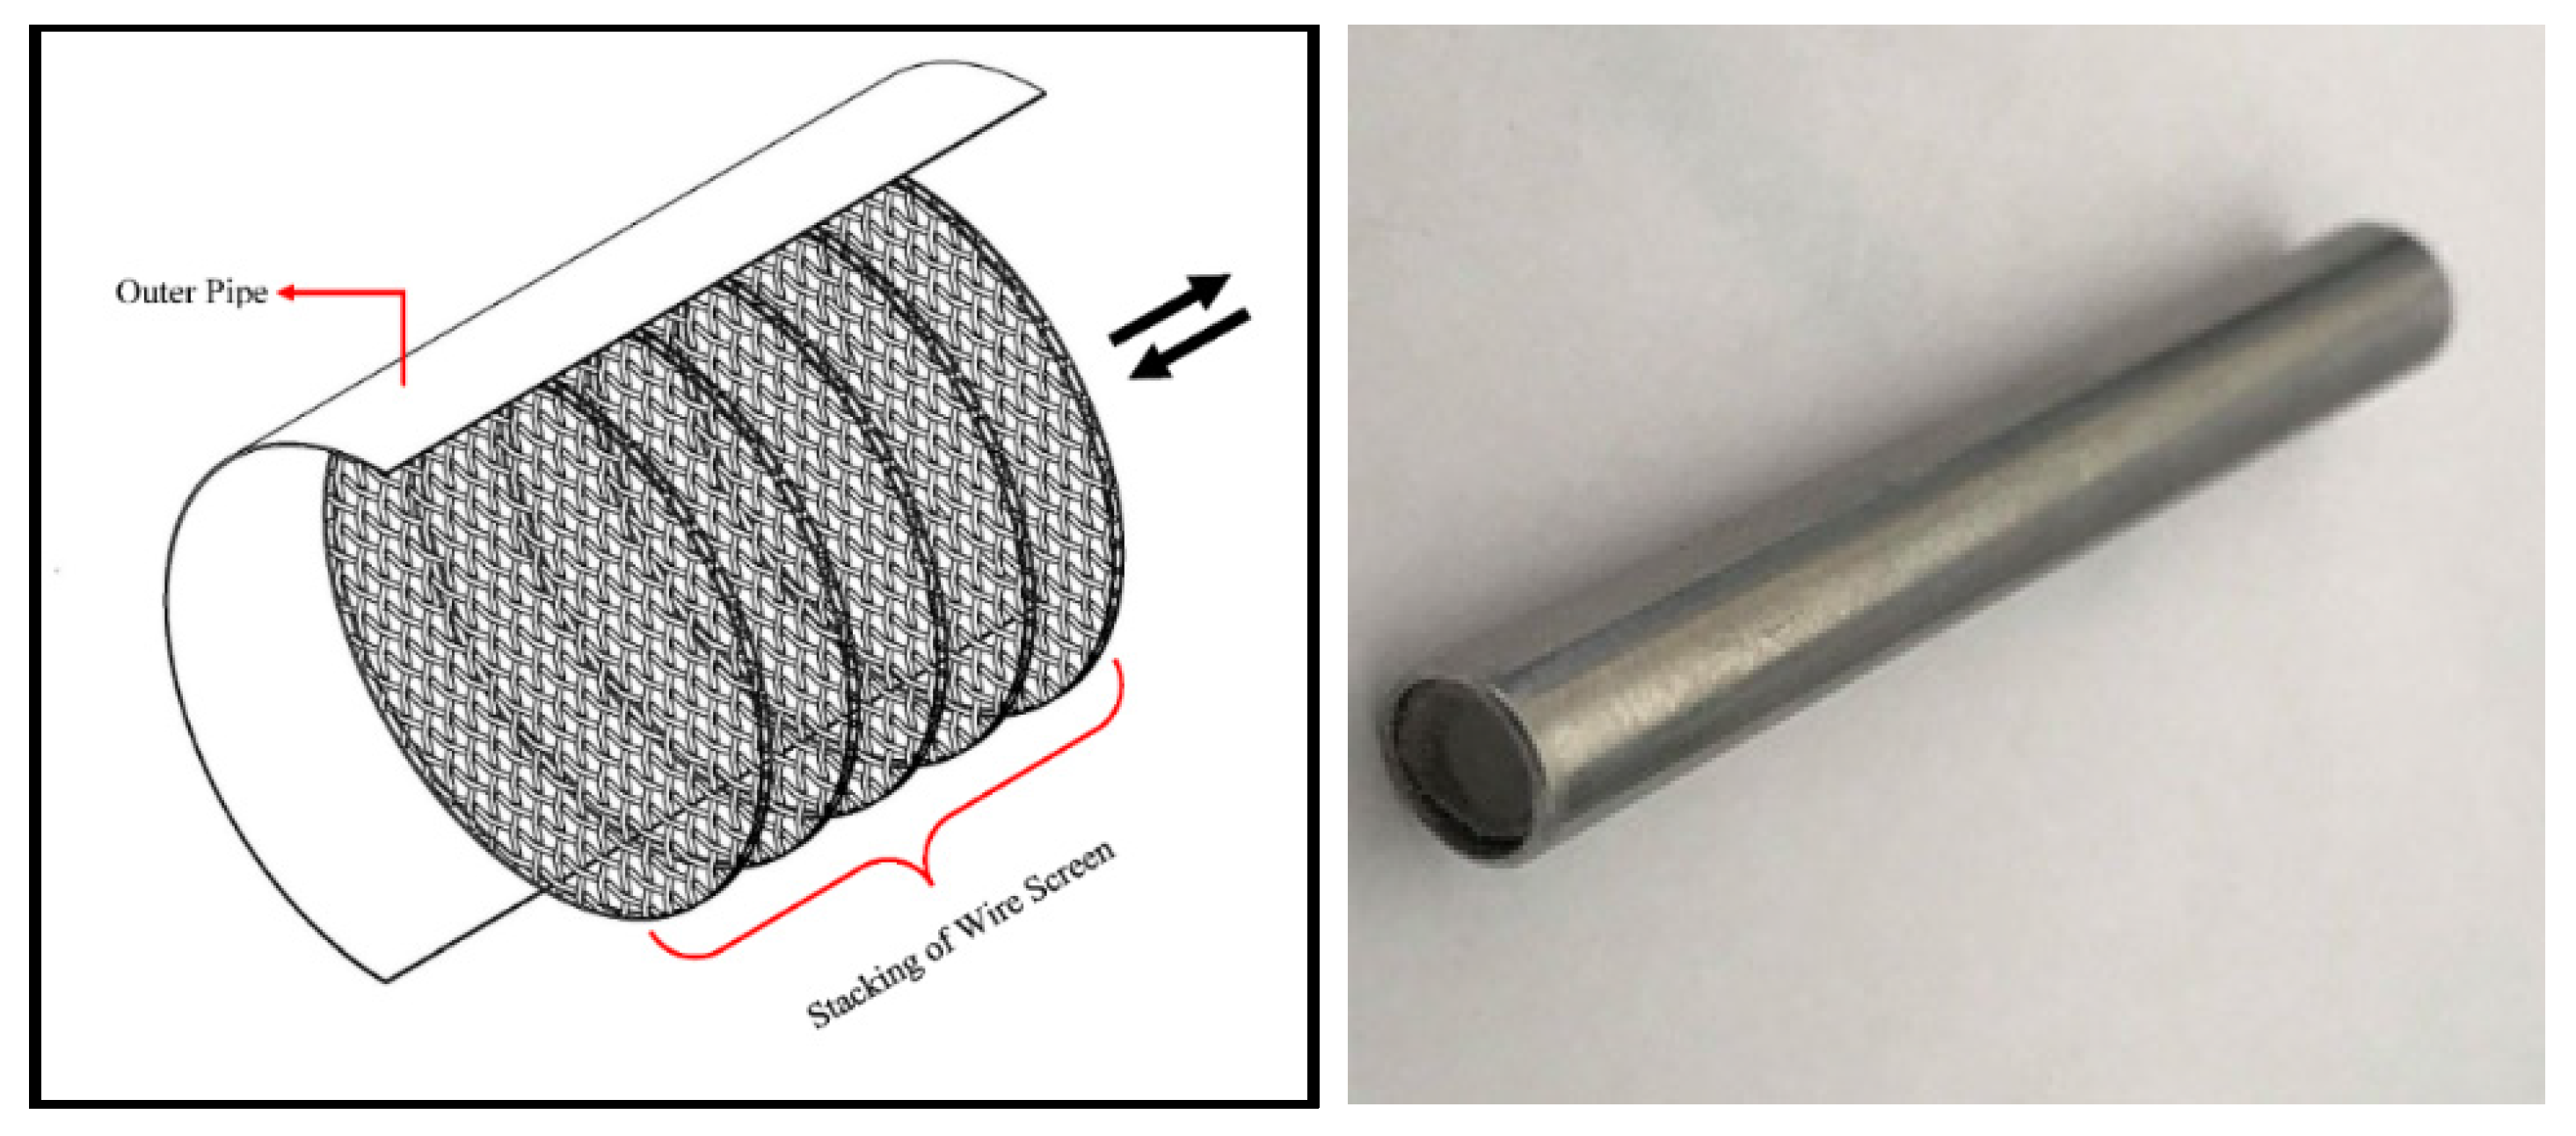
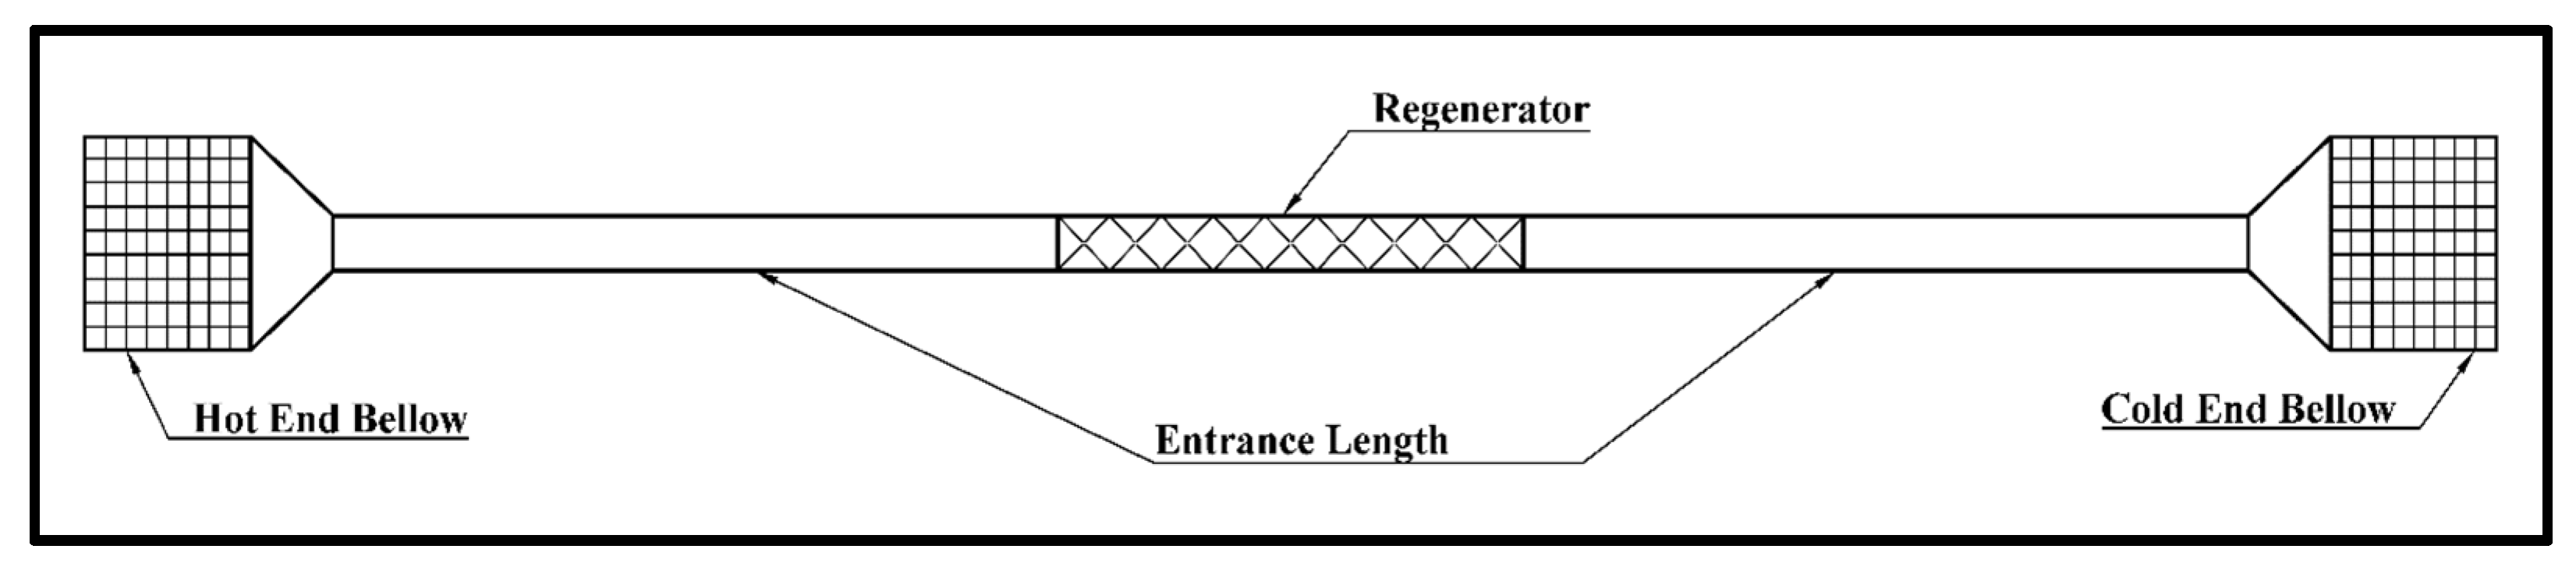
2.2. Regenerator
2.3. Bellow
2.4. Pressurization
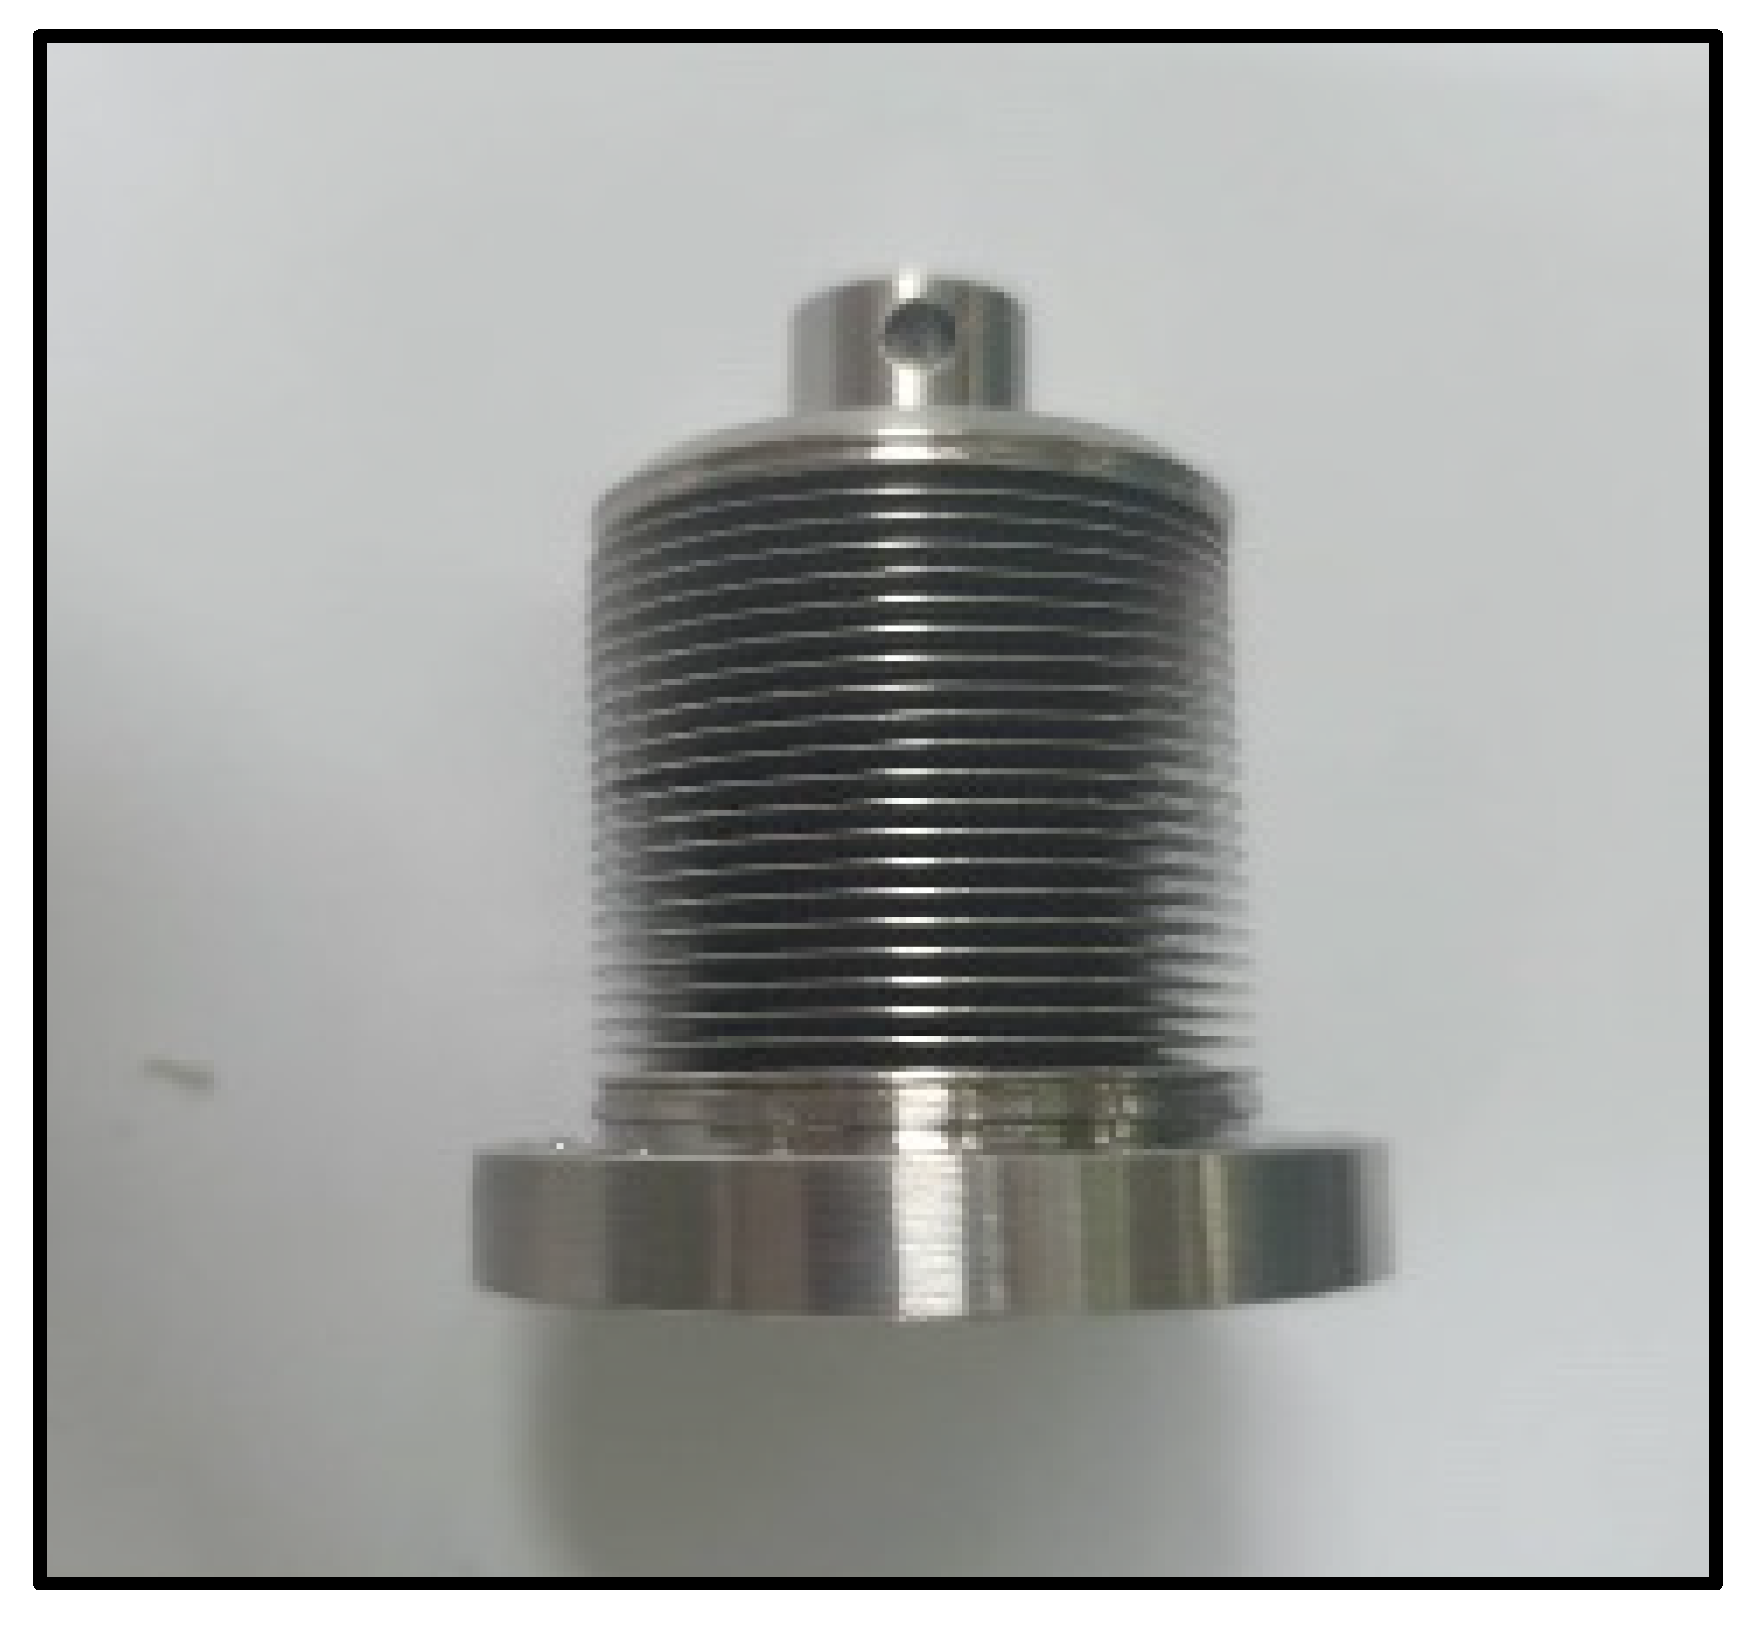
2.5. Measuring Technique
2.6. Error Analysis
3. Numerical Modelling
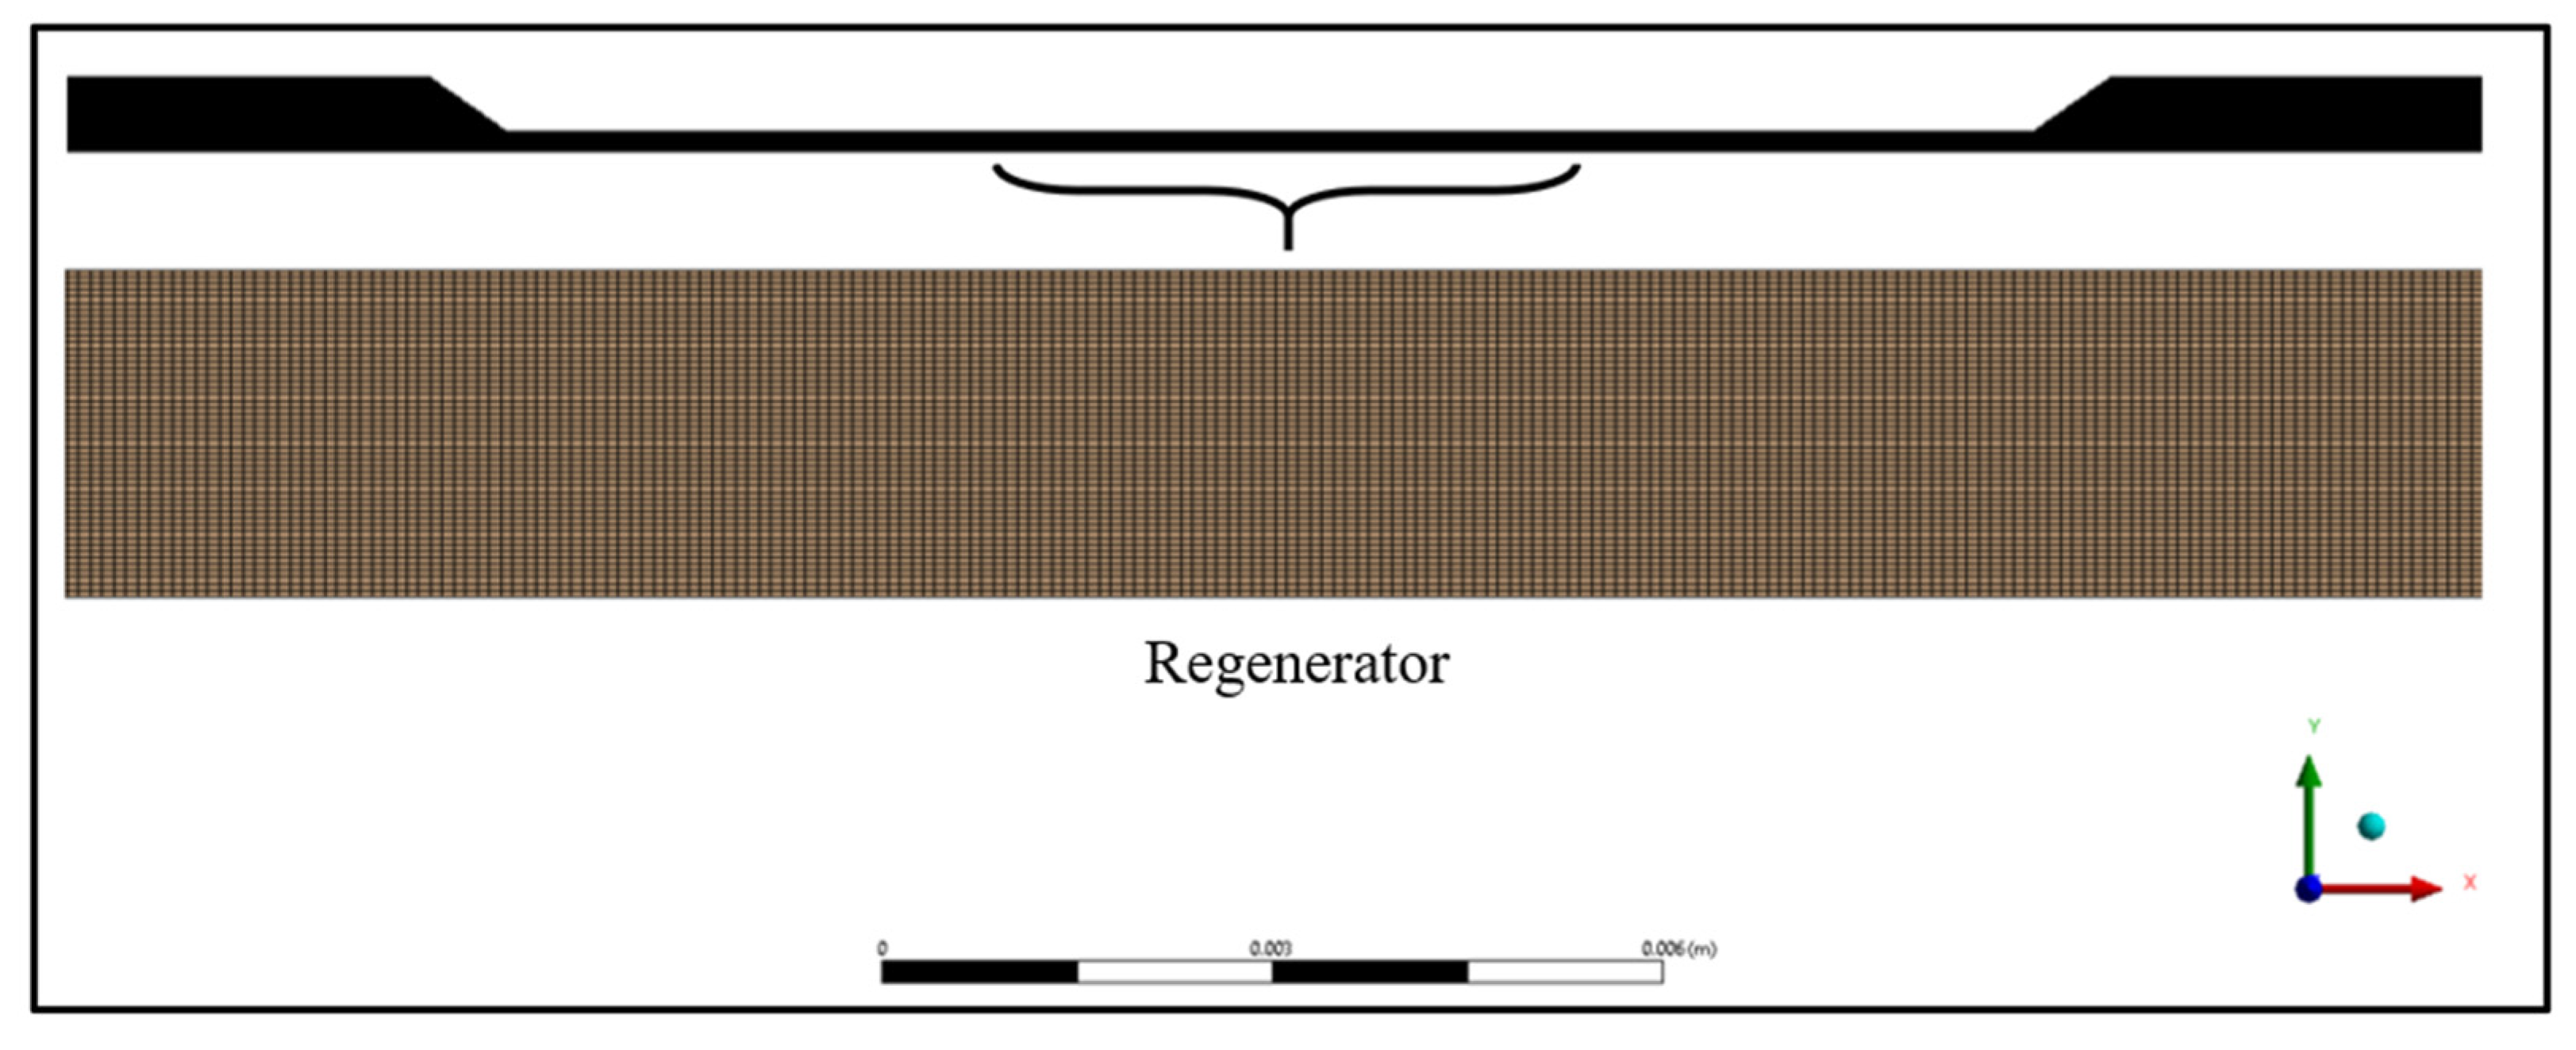
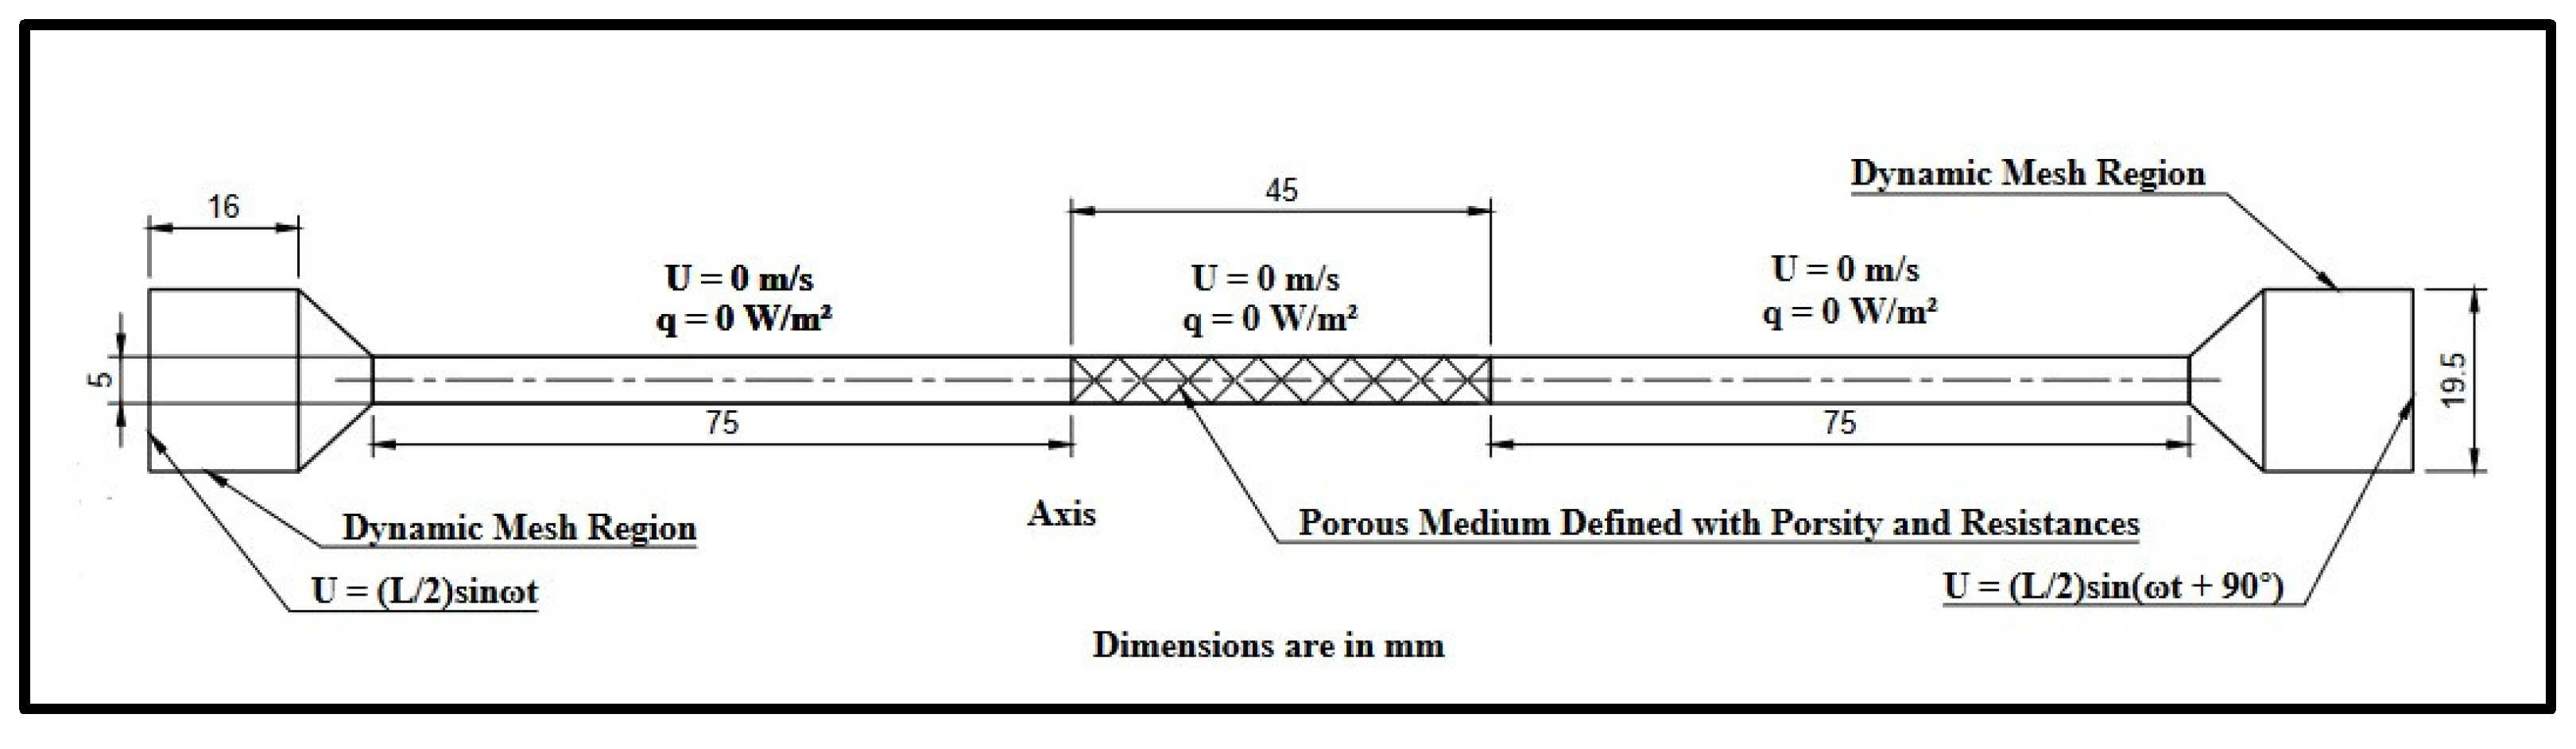
3.1. Geometry and Meshing
3.2. Porous Definition in Numerical Study
3.3. Governing Equations
3.4. Numerical Discretization
4. Results and Discussion
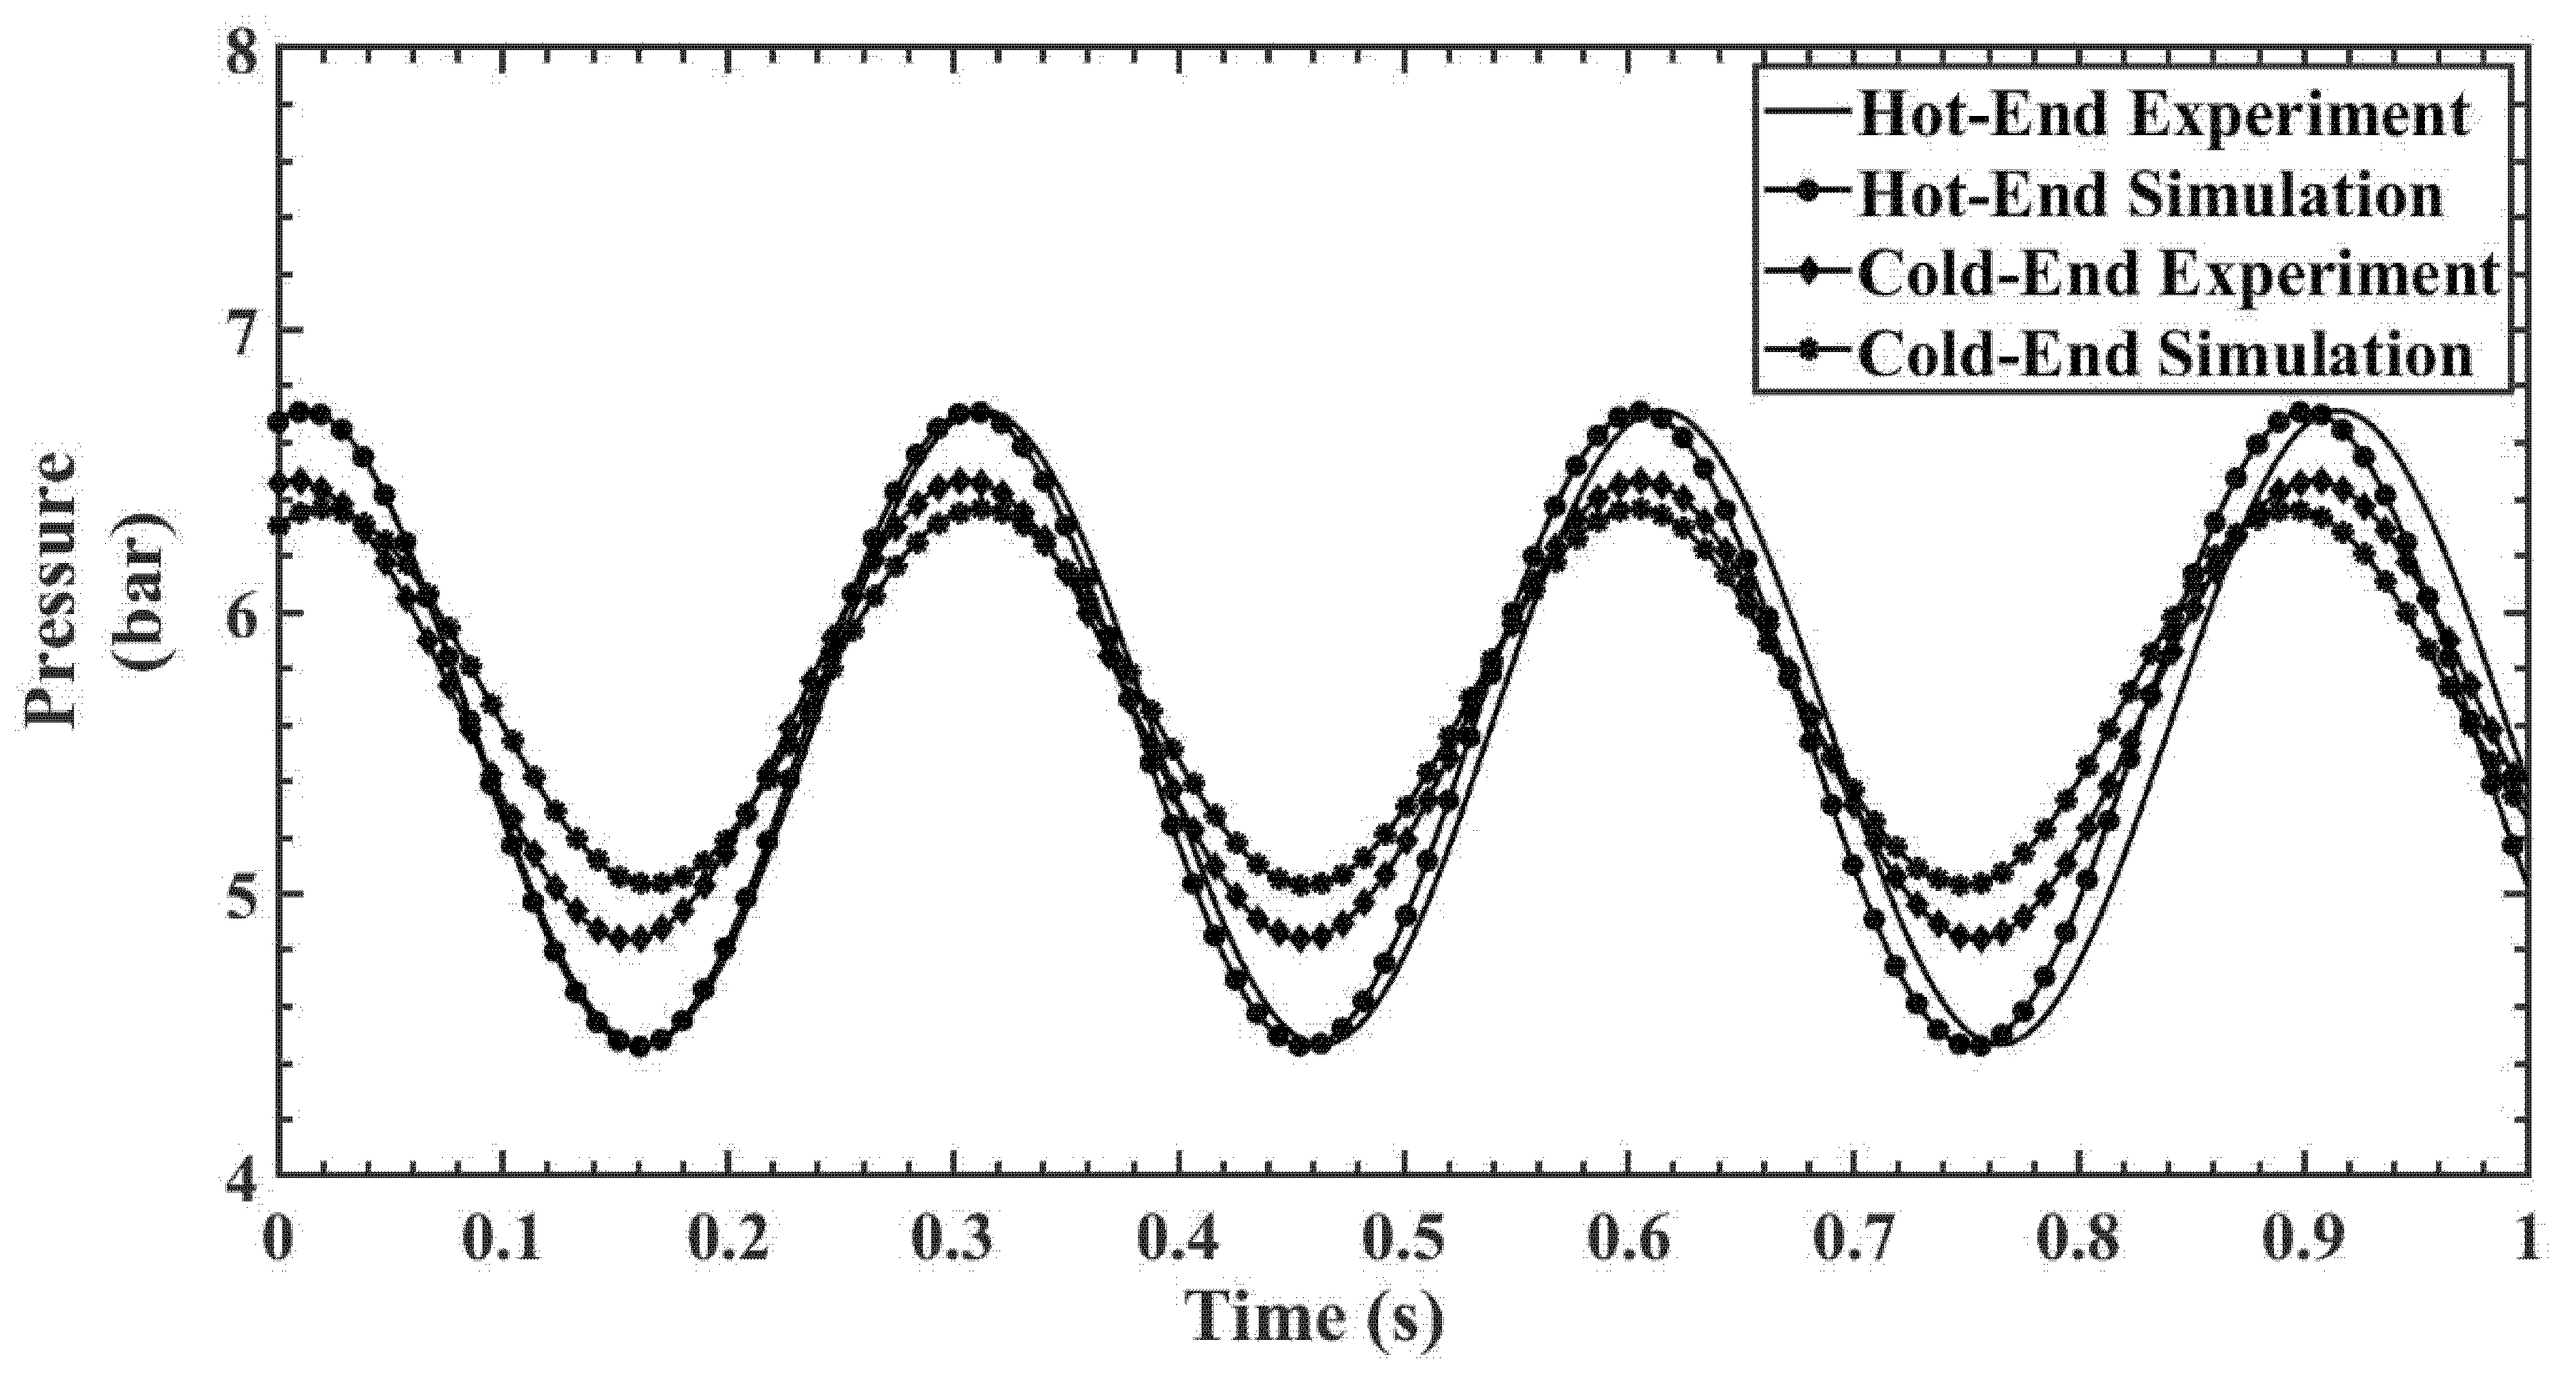
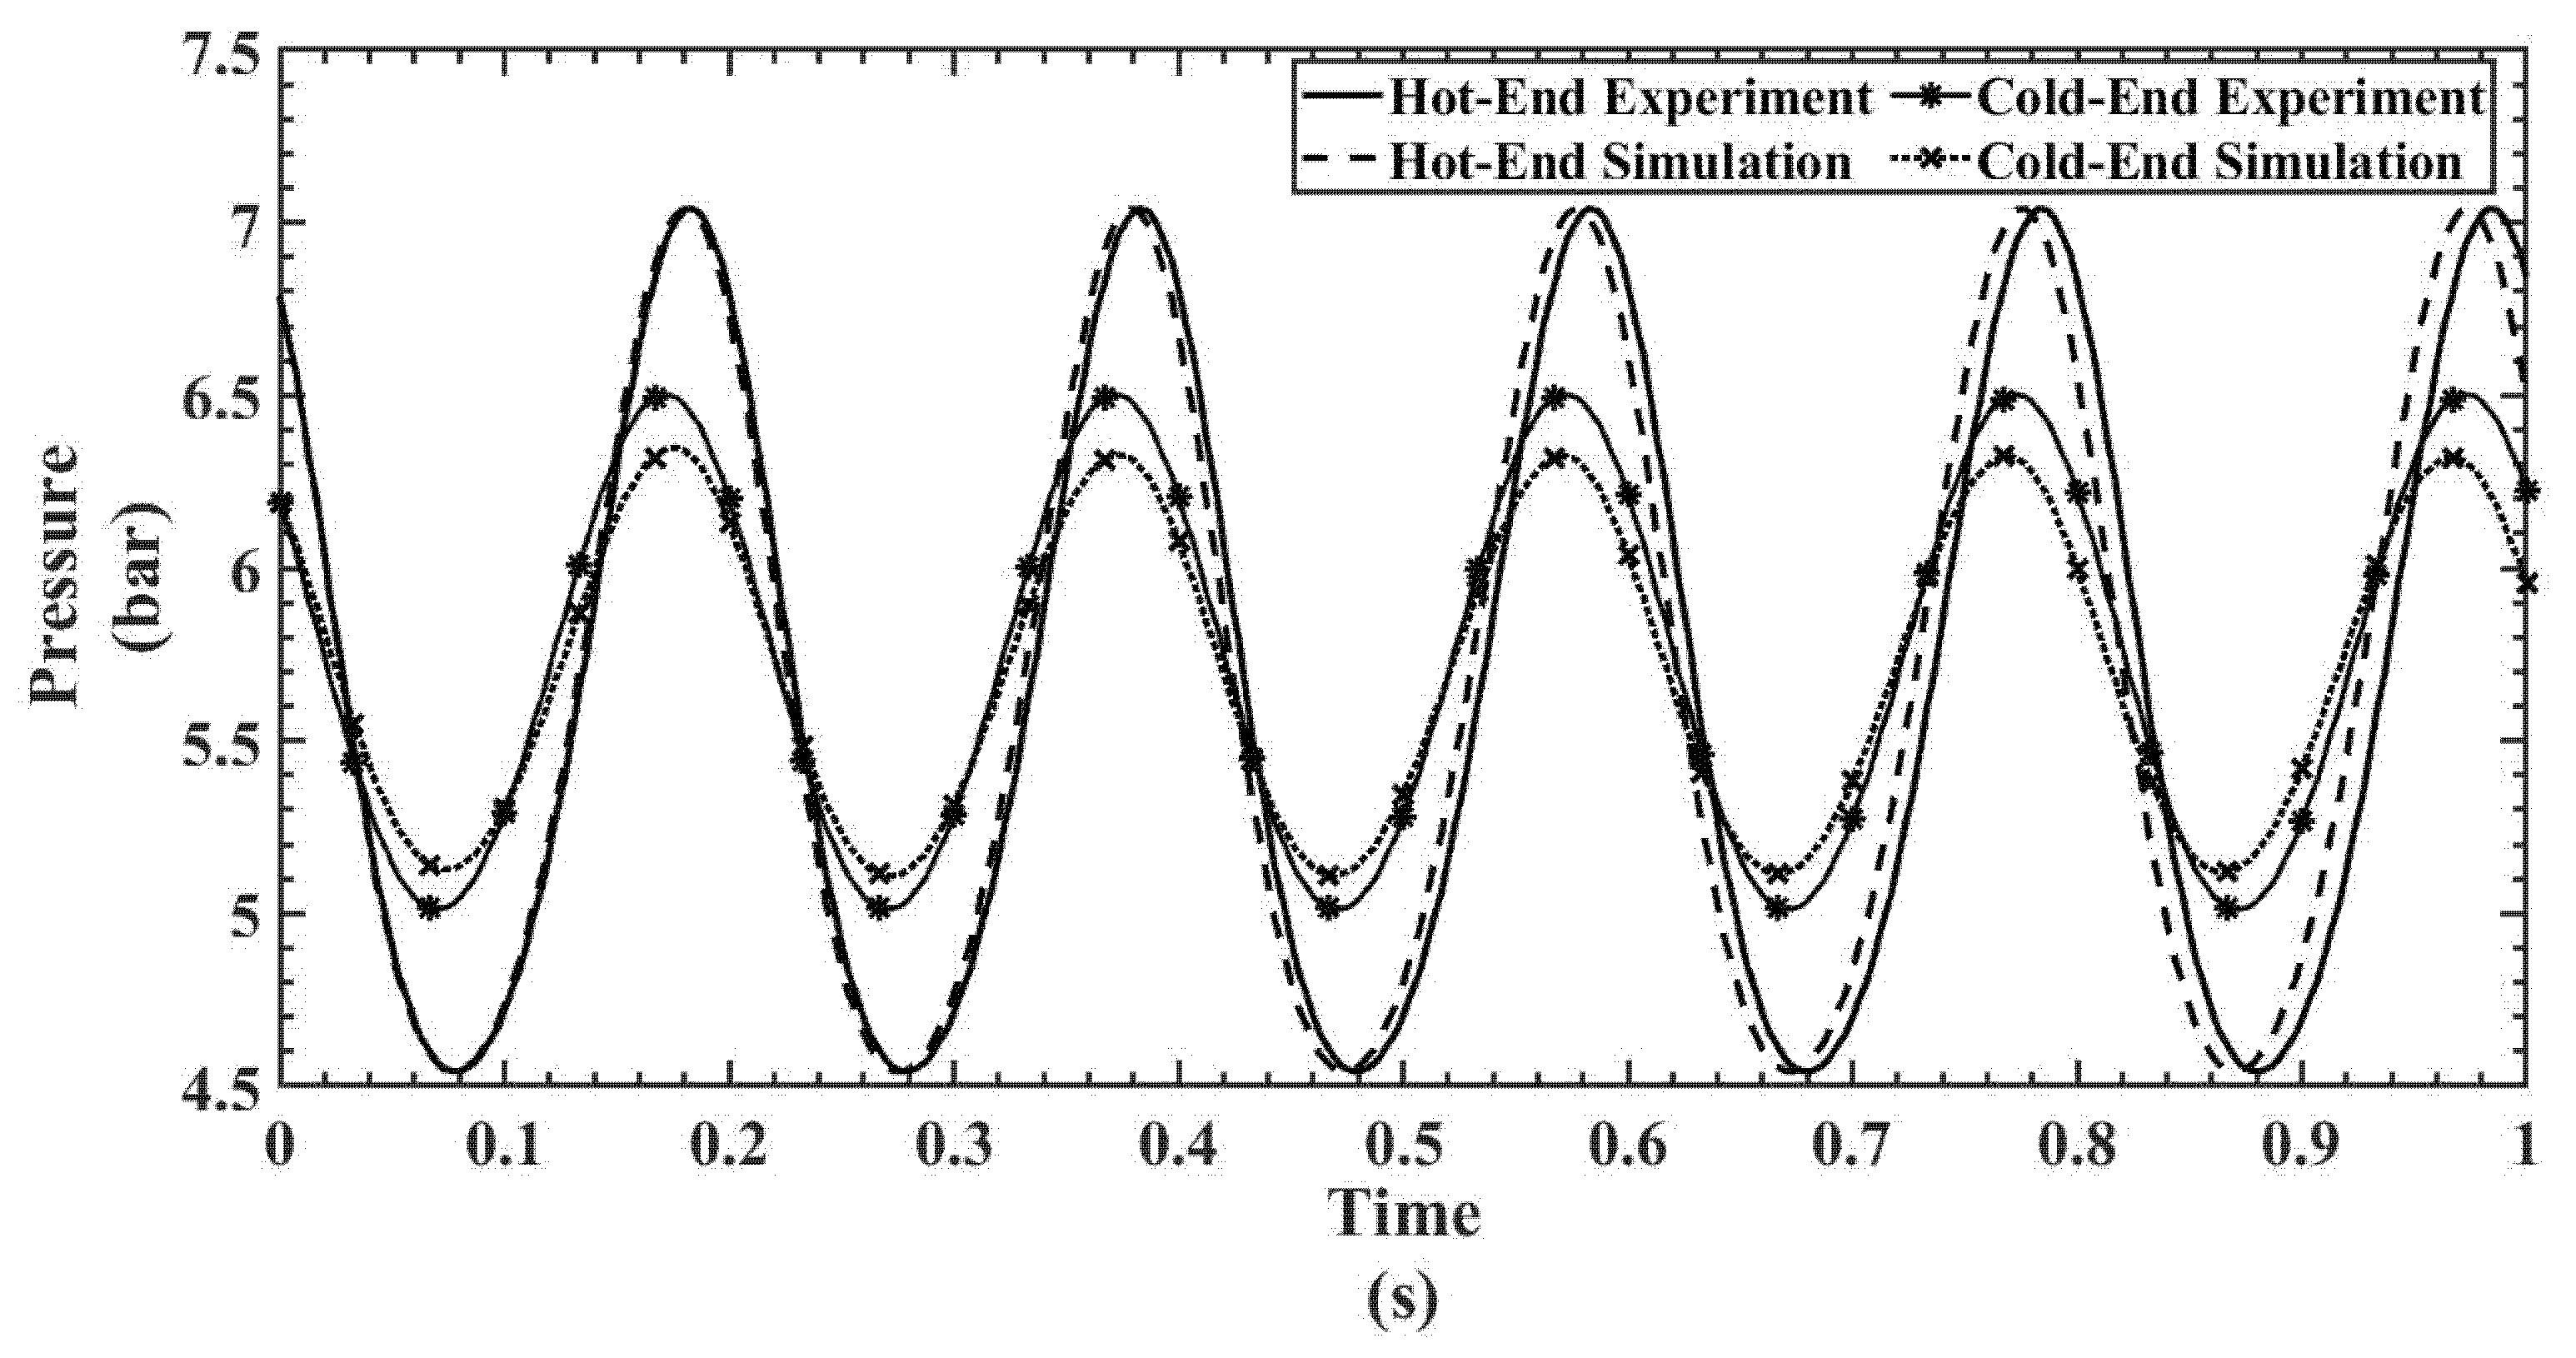
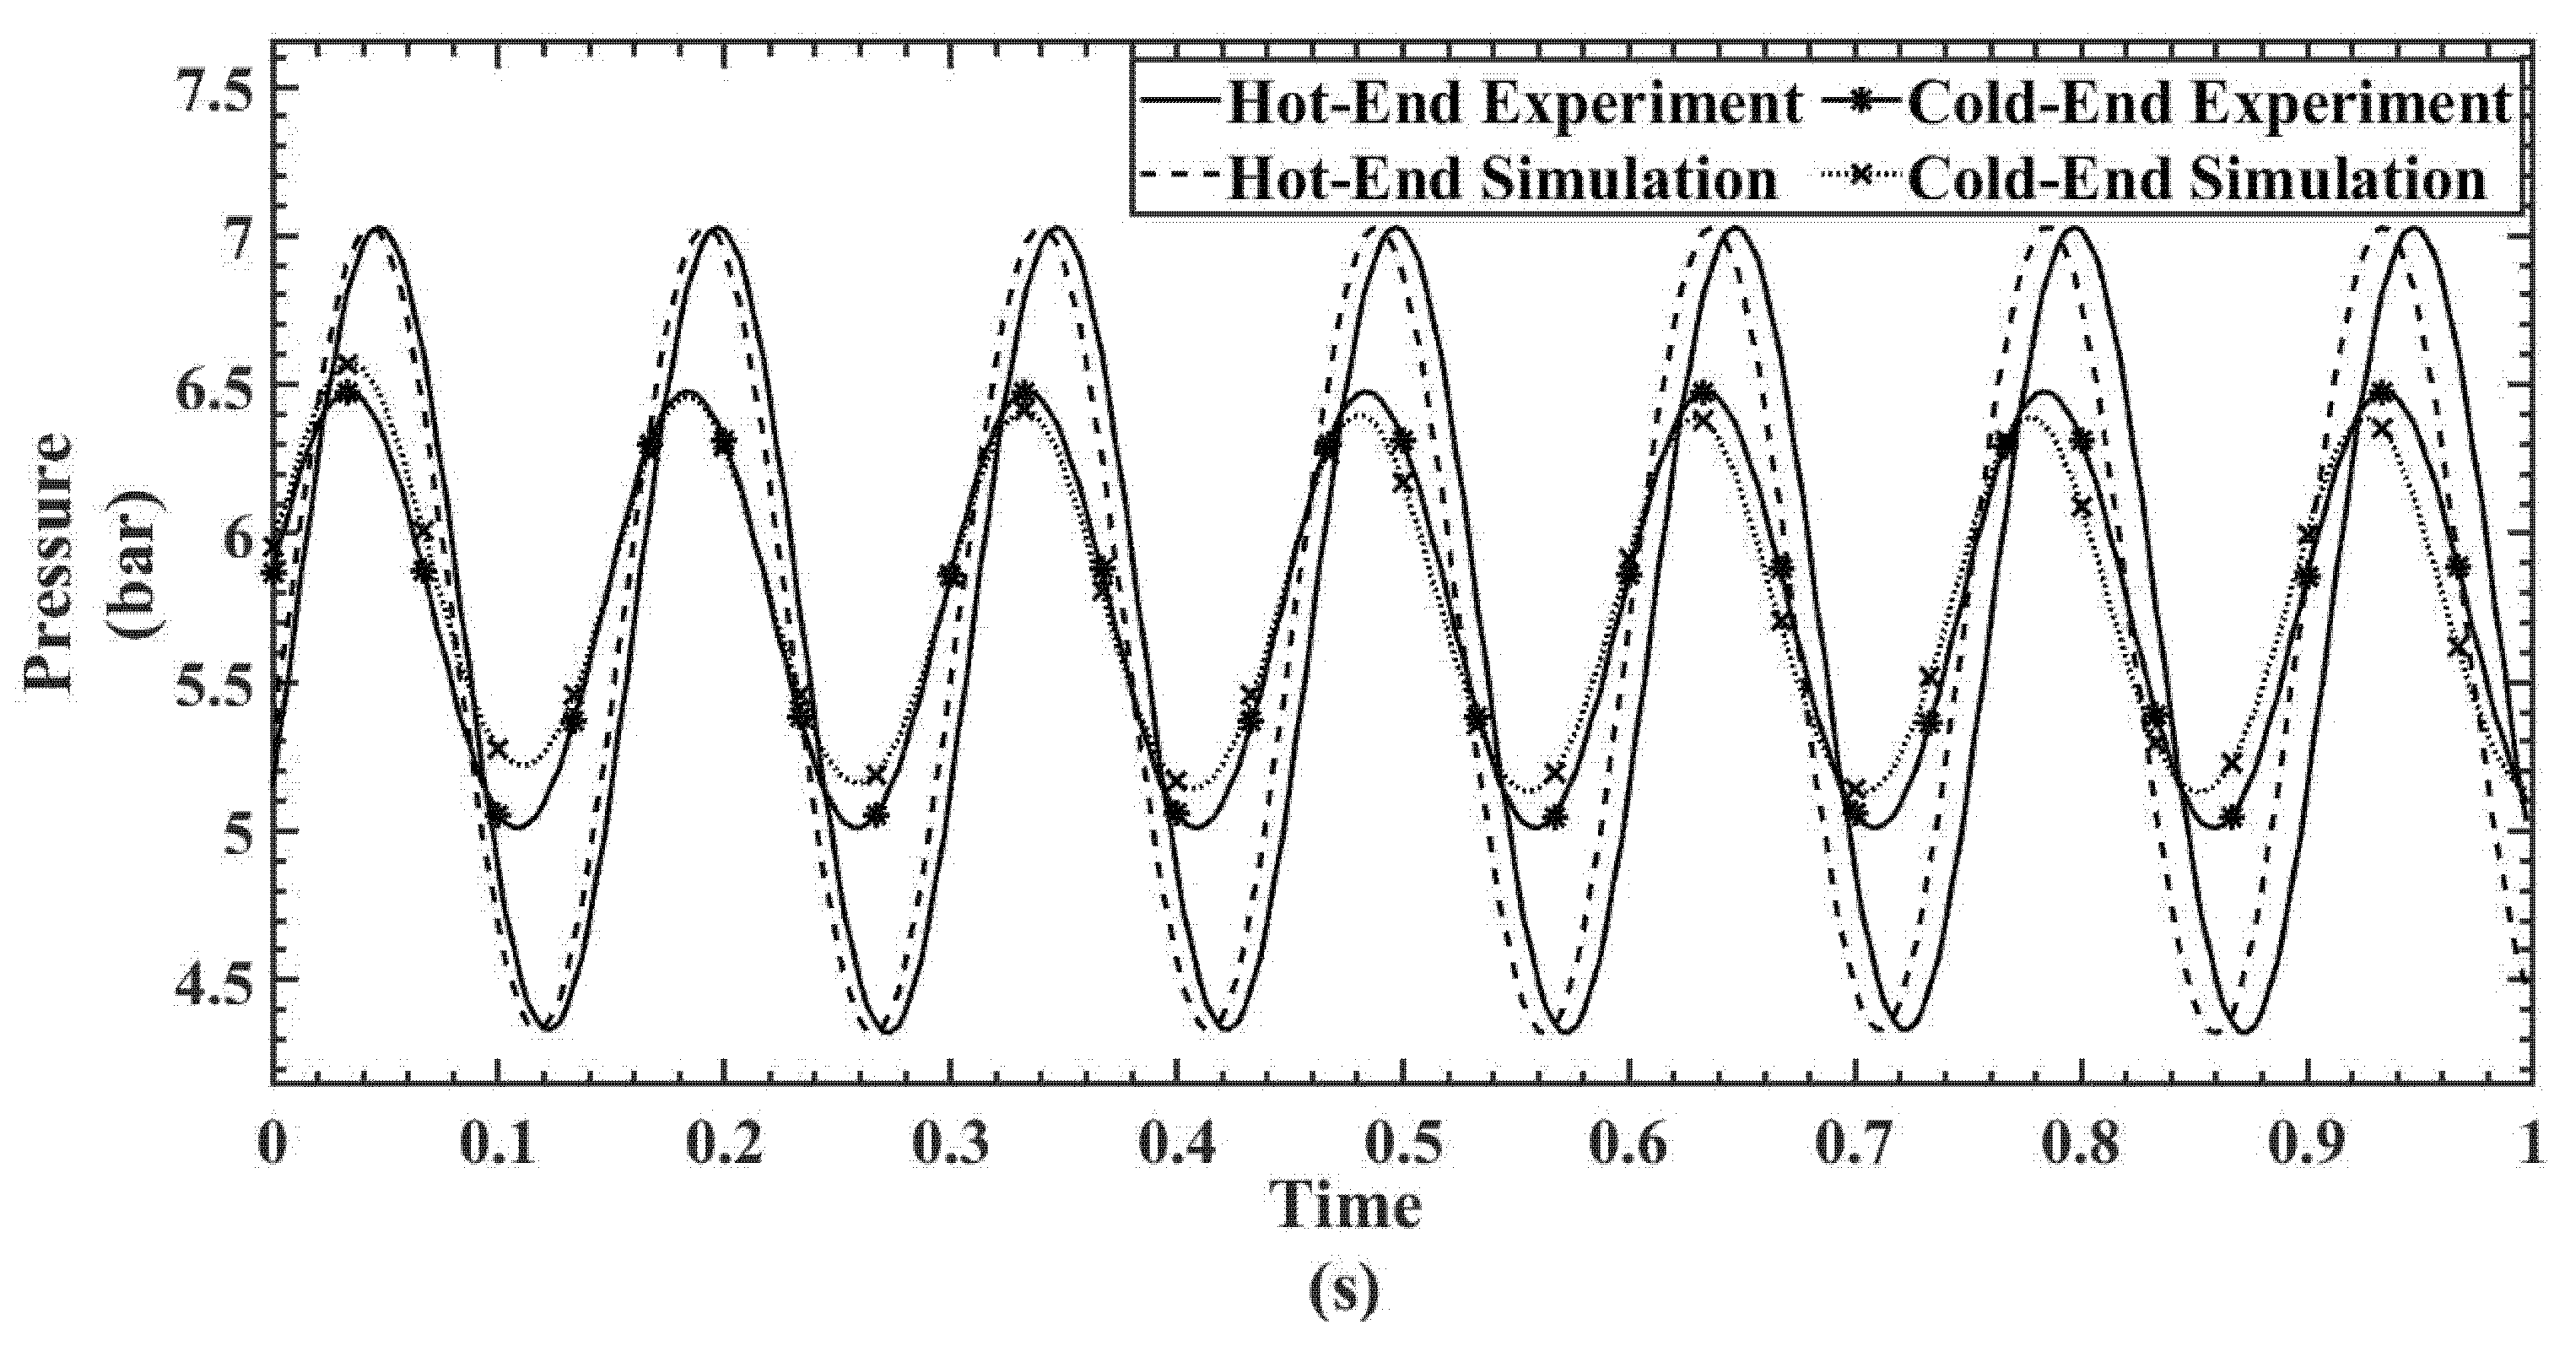
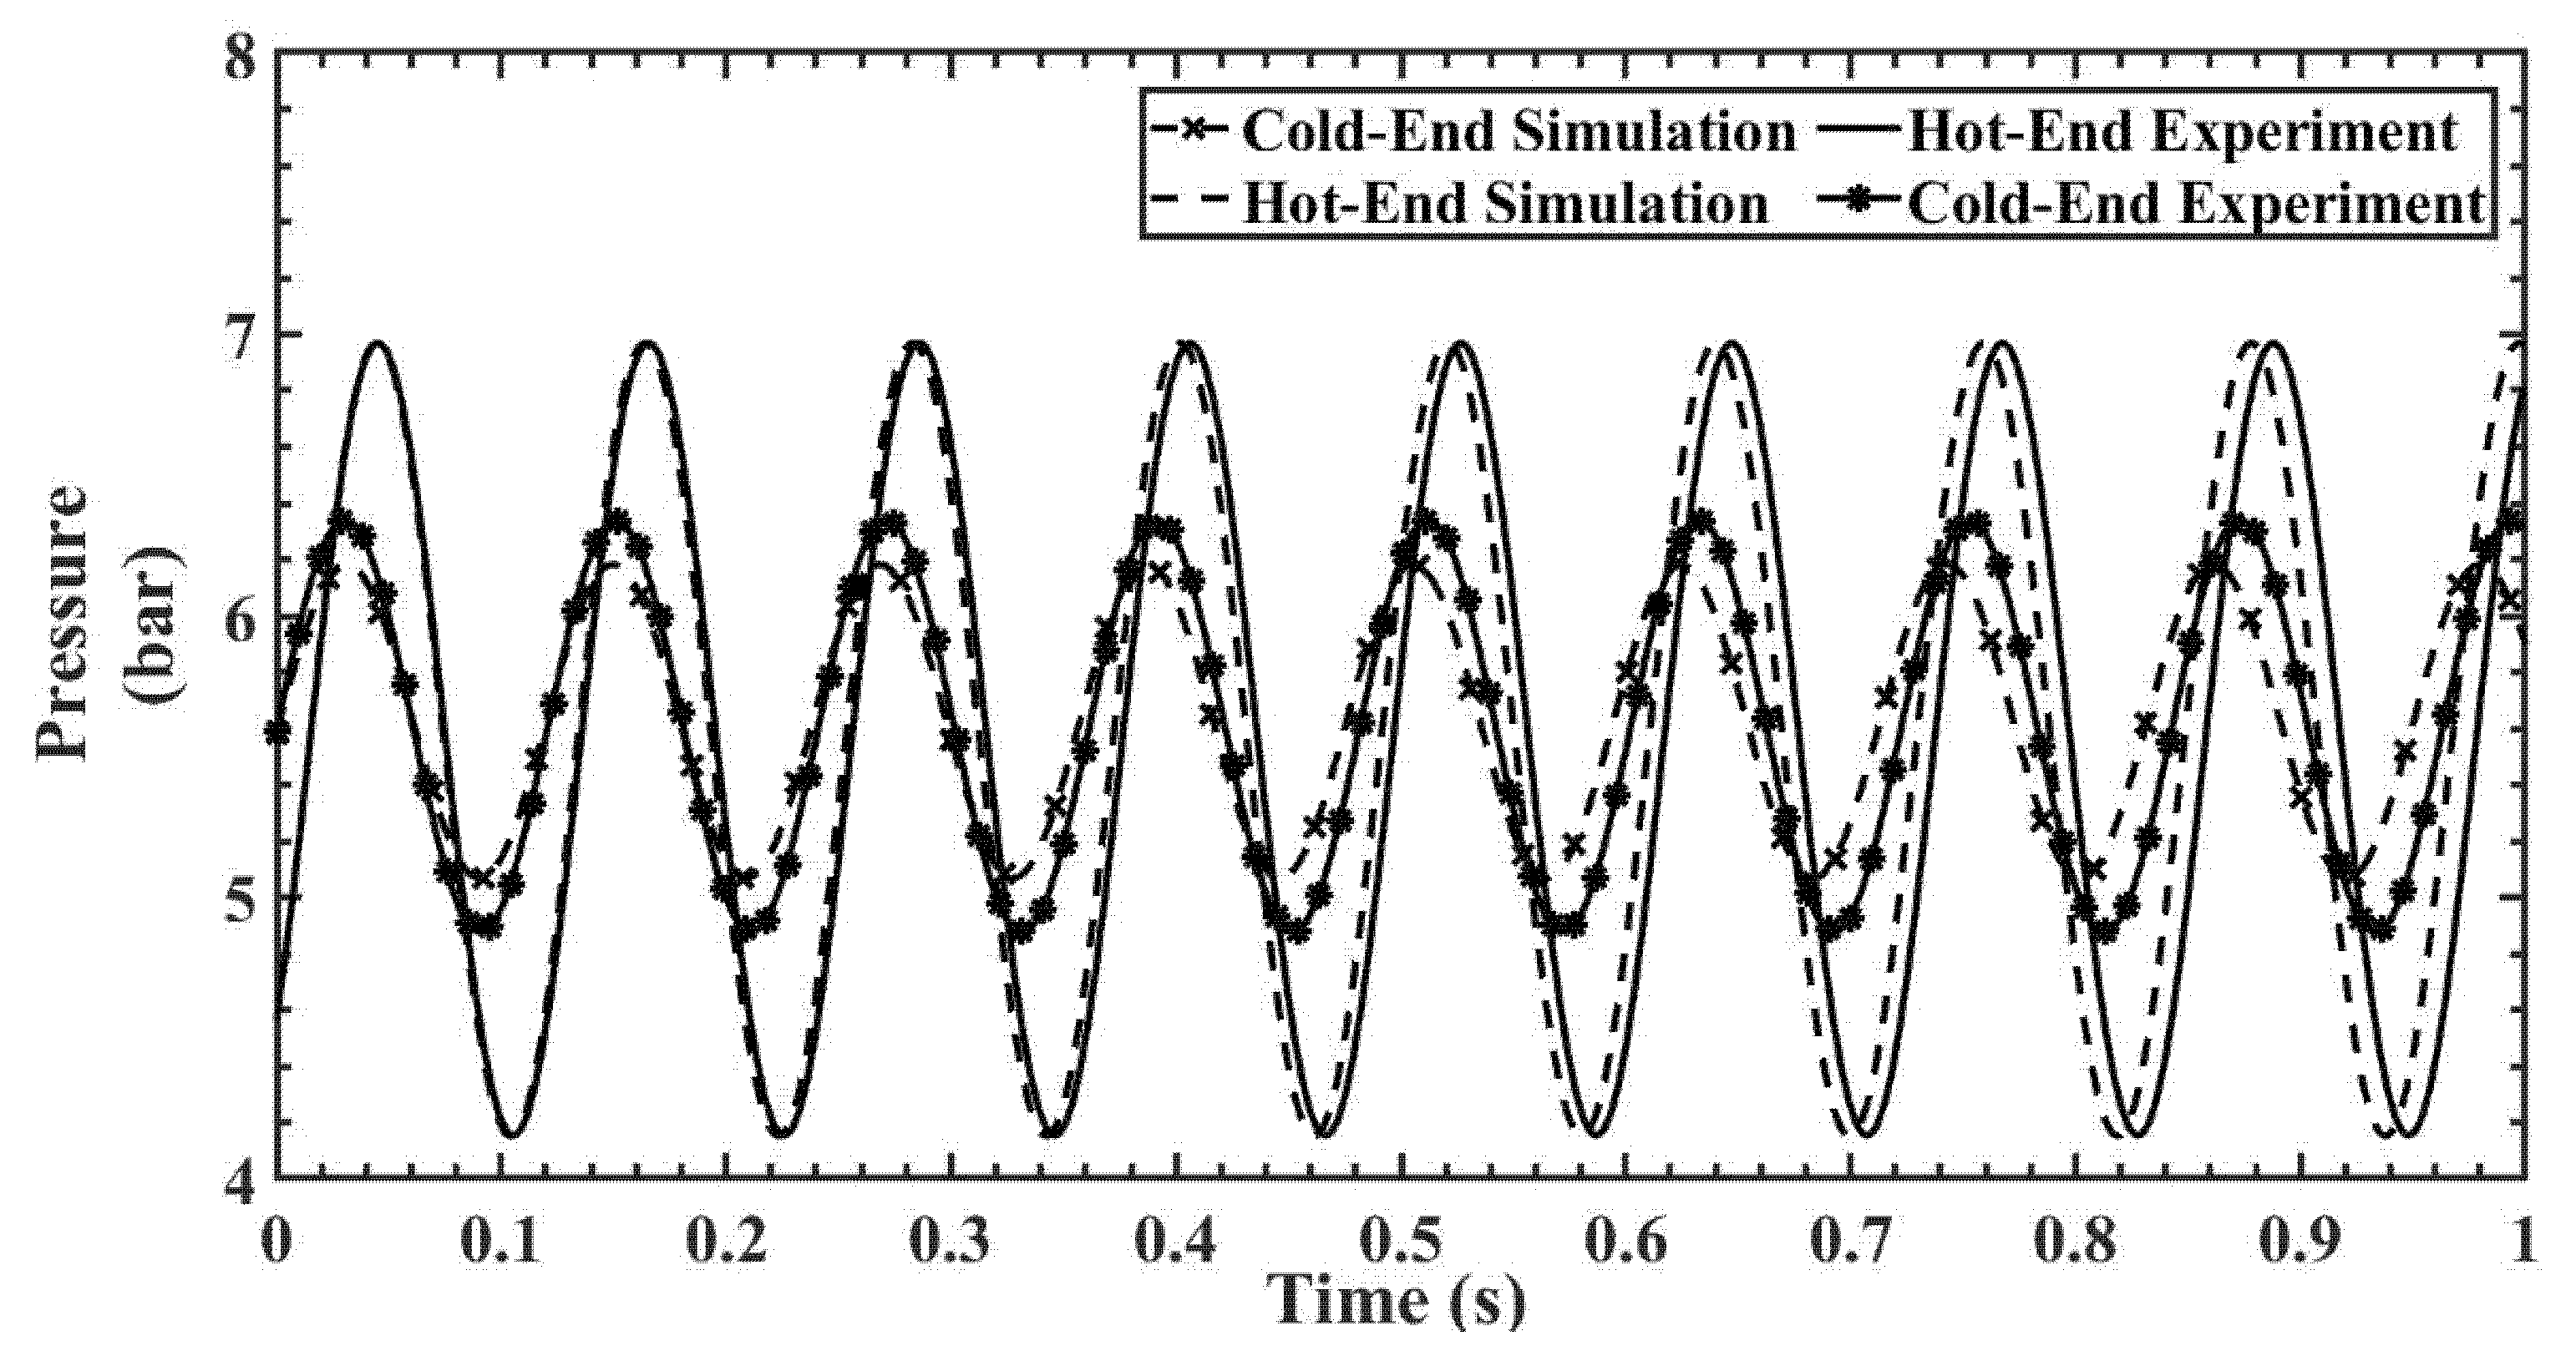
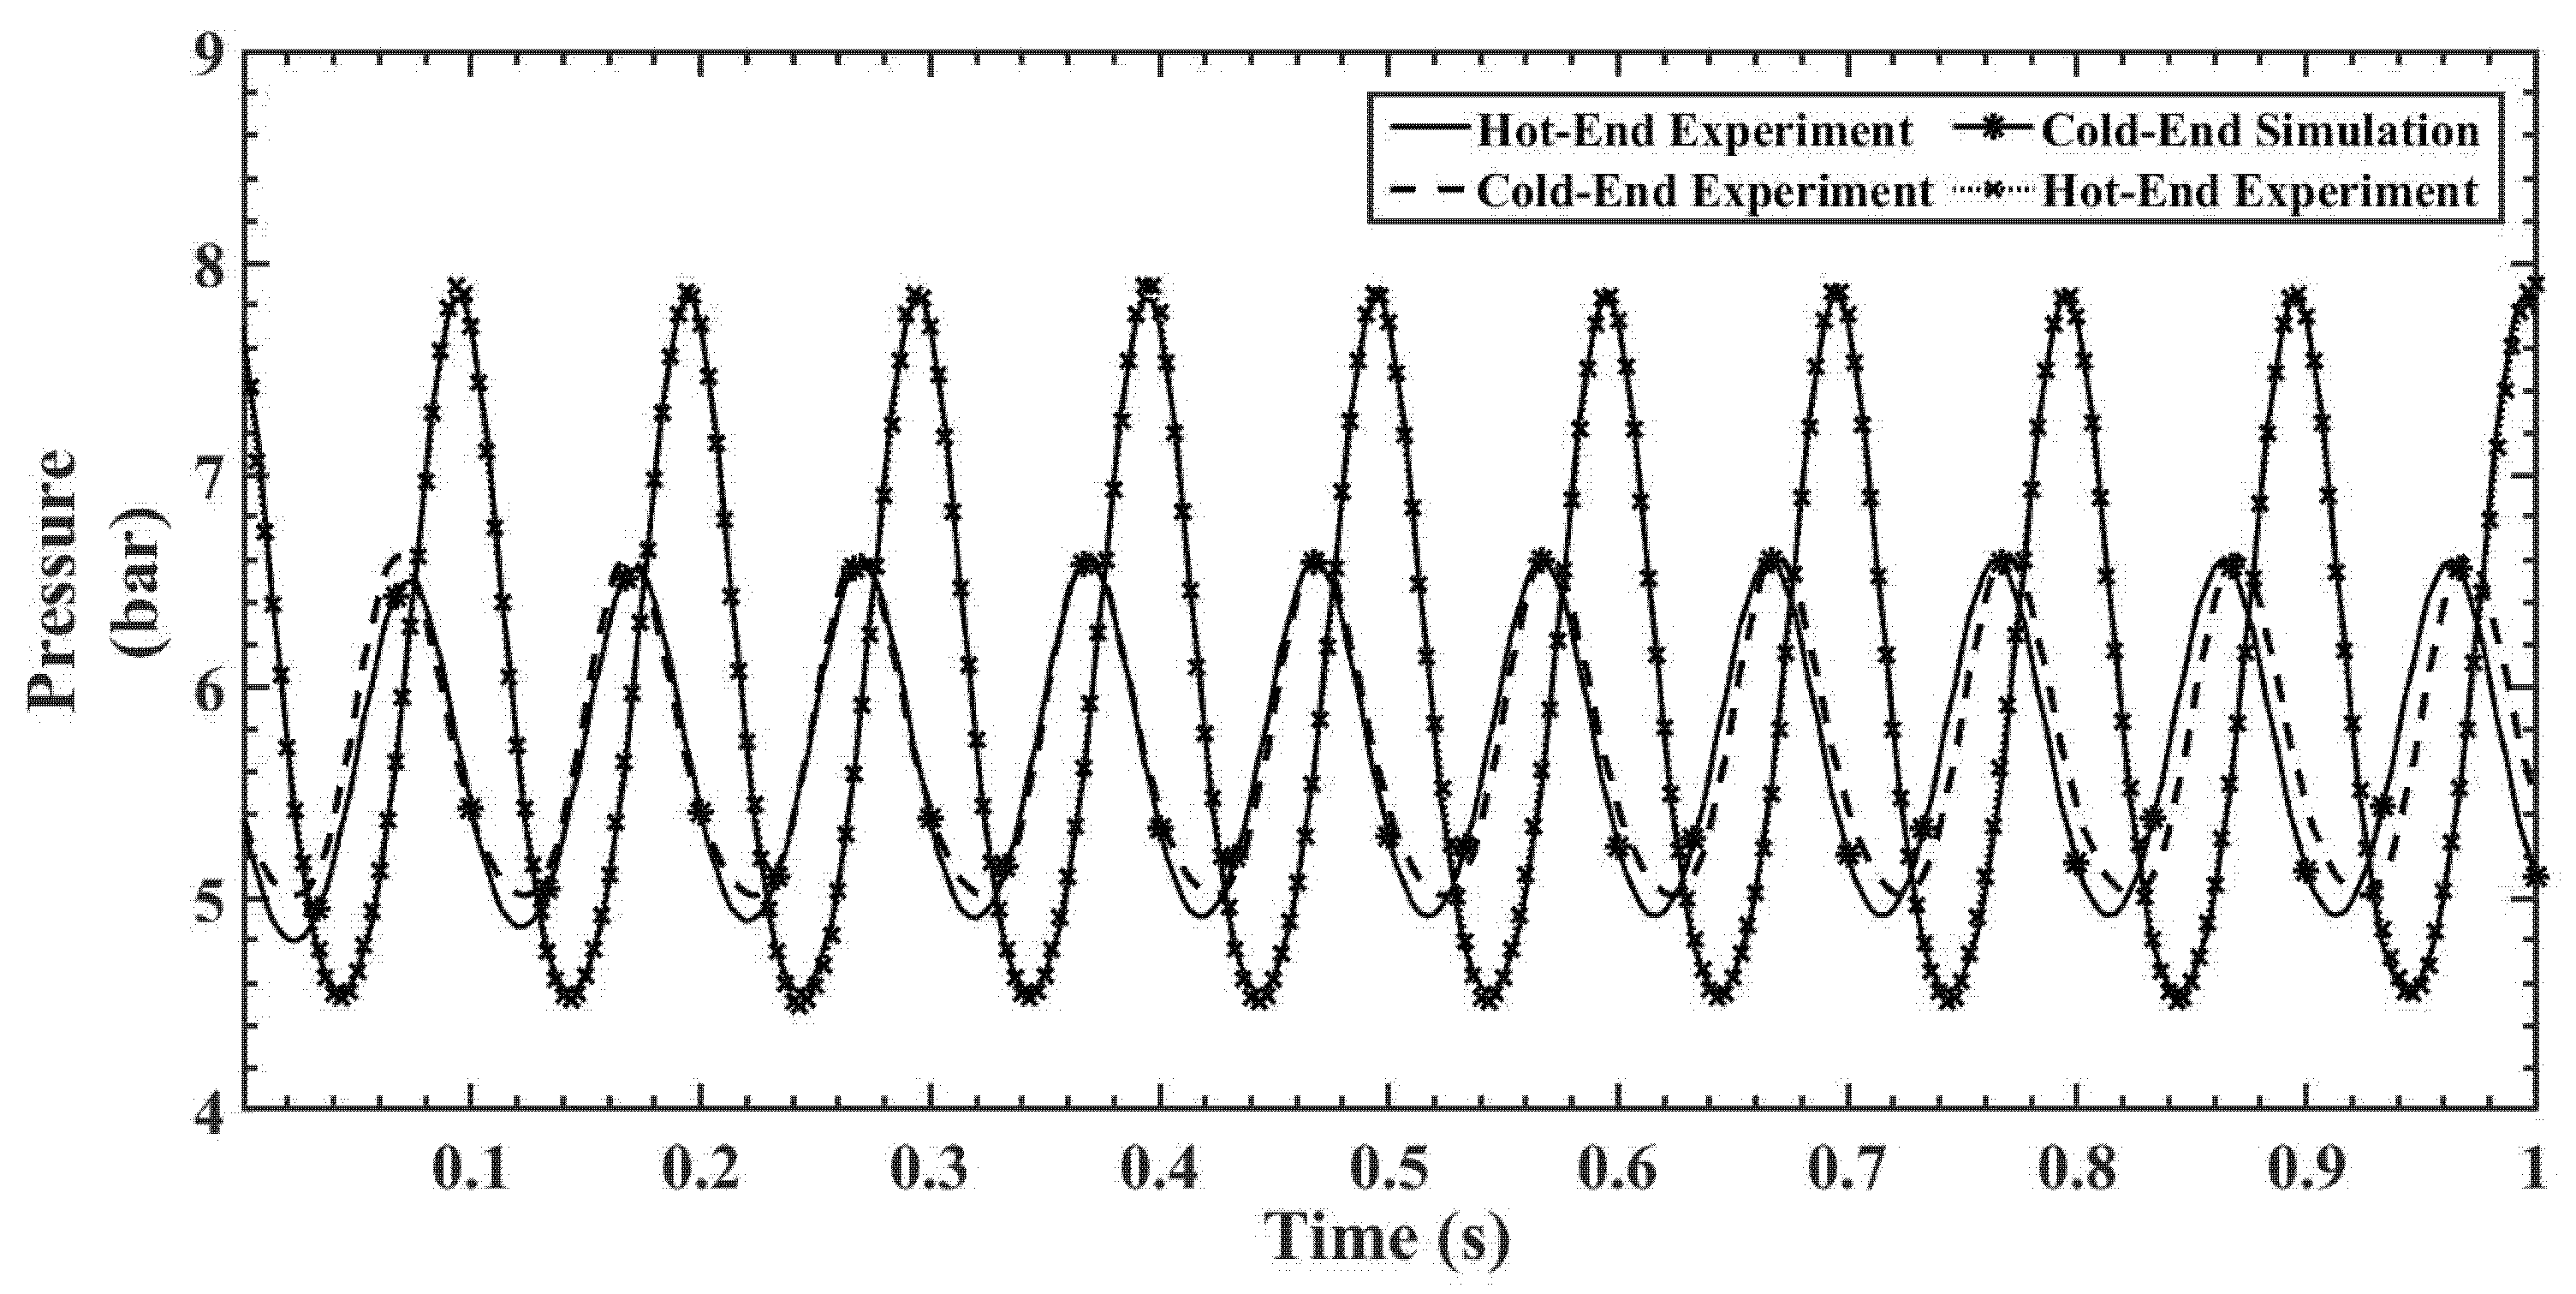
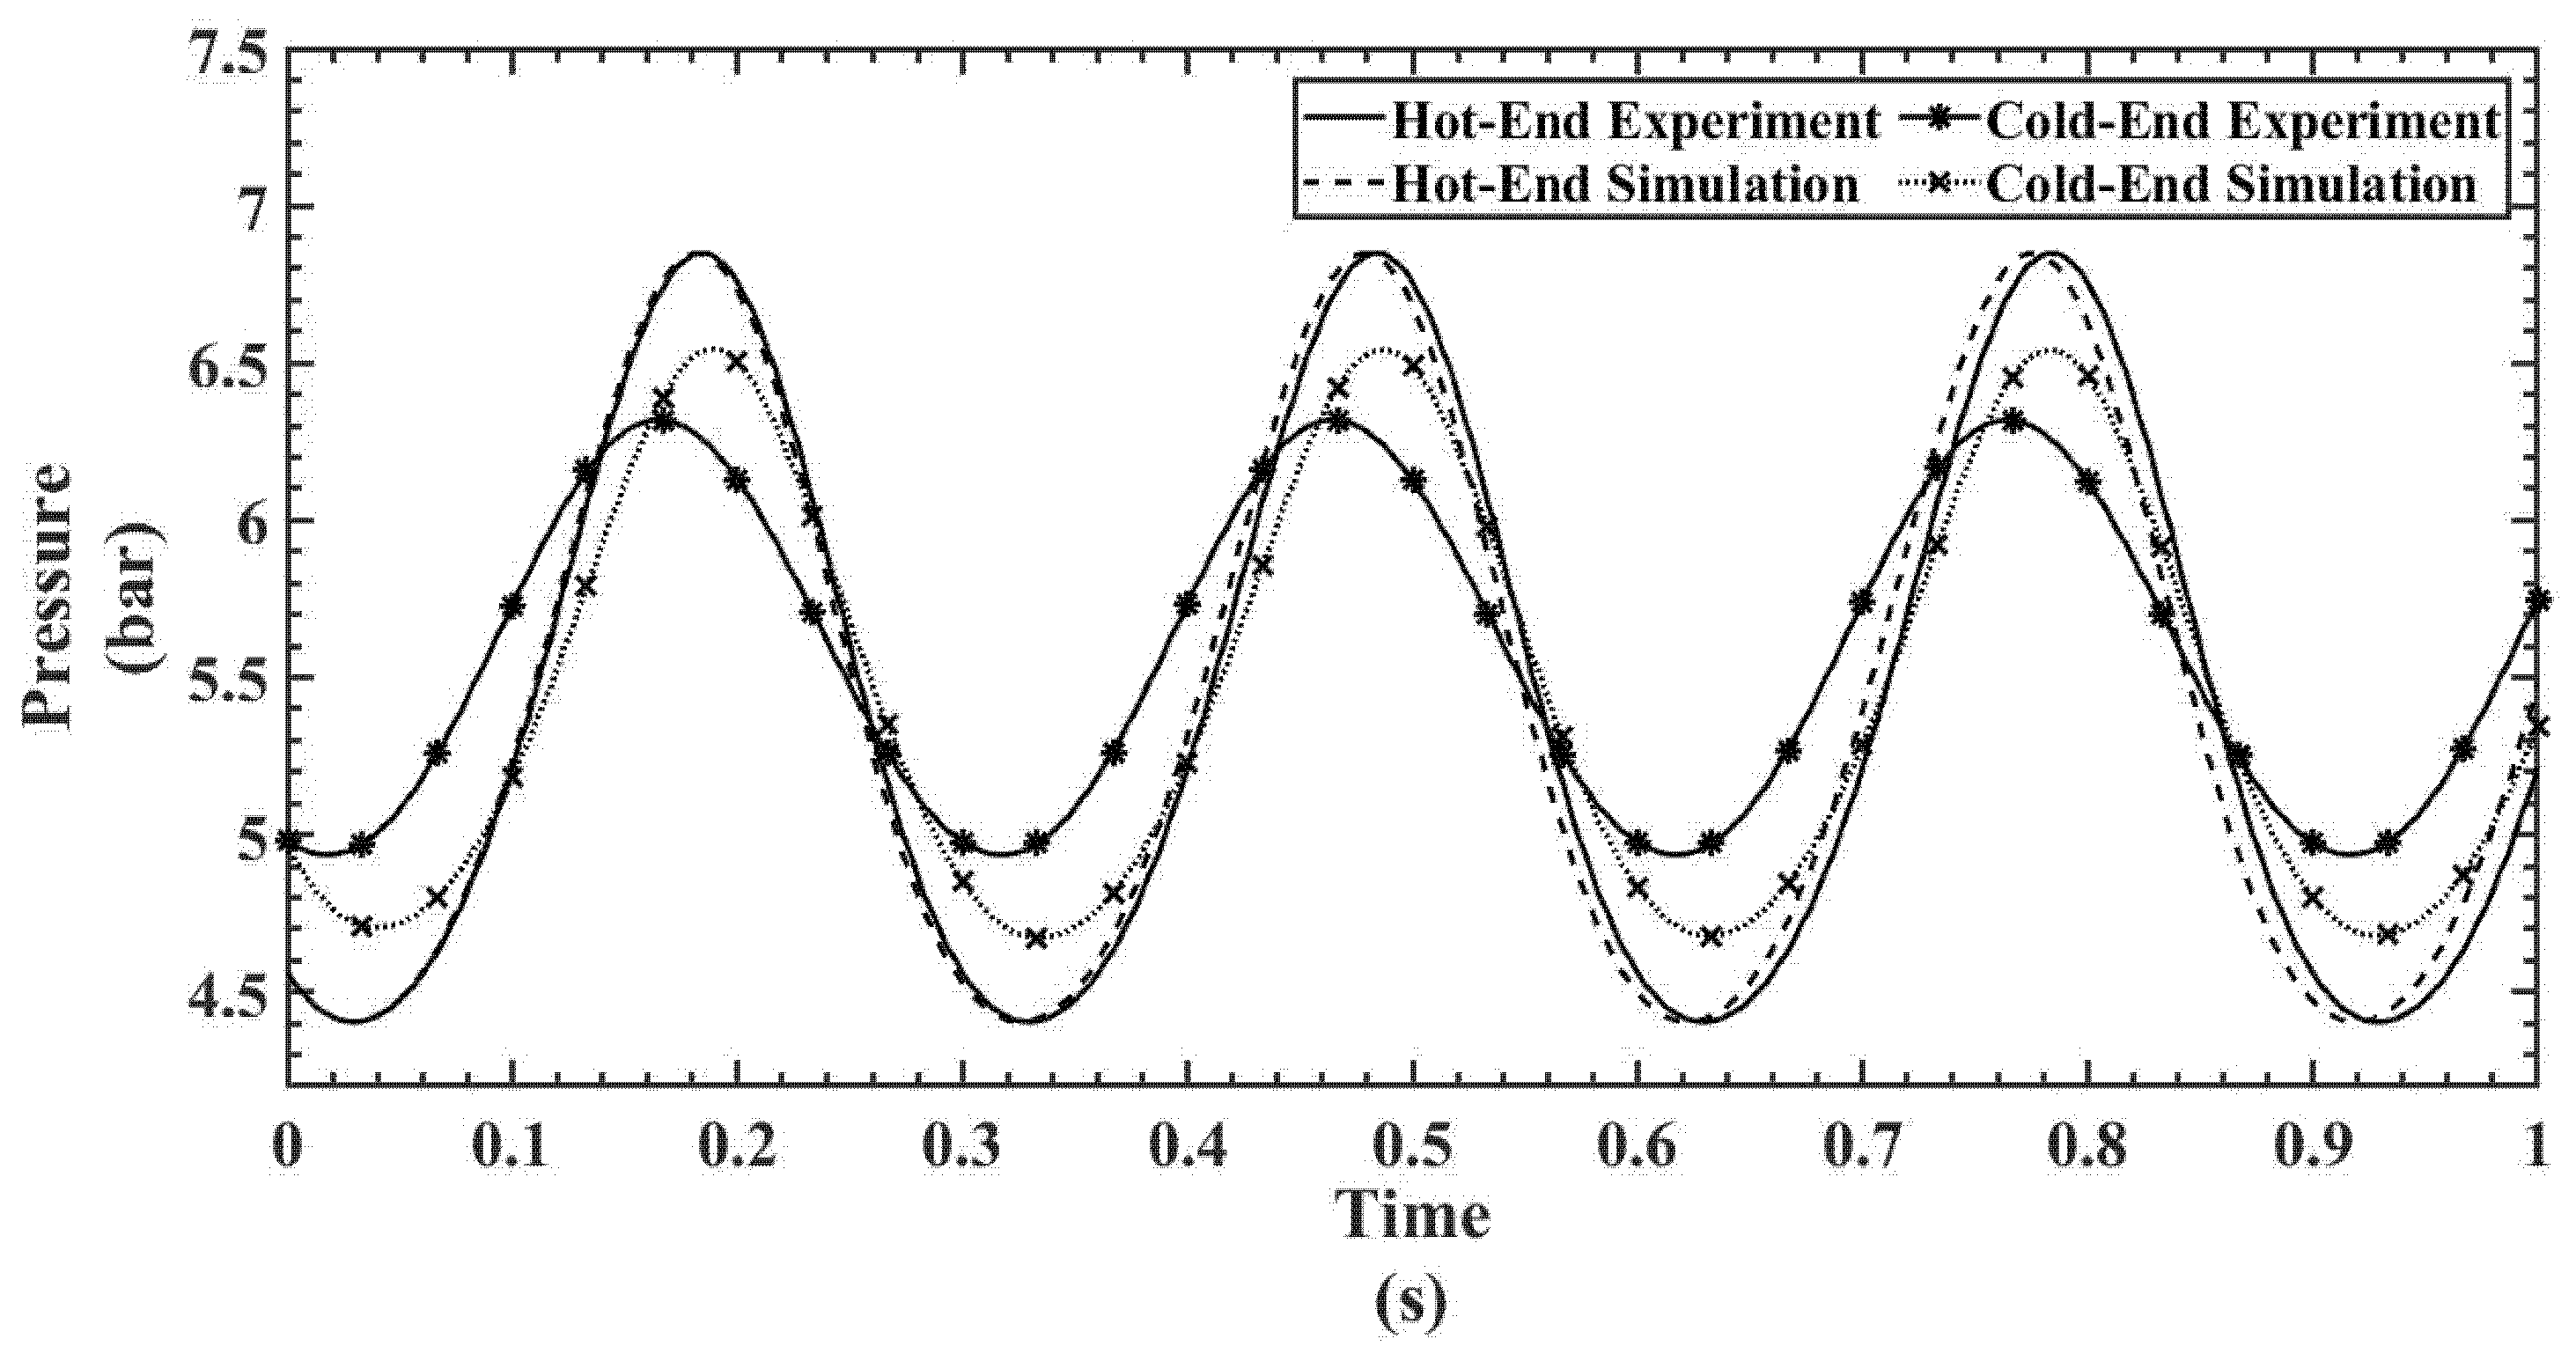
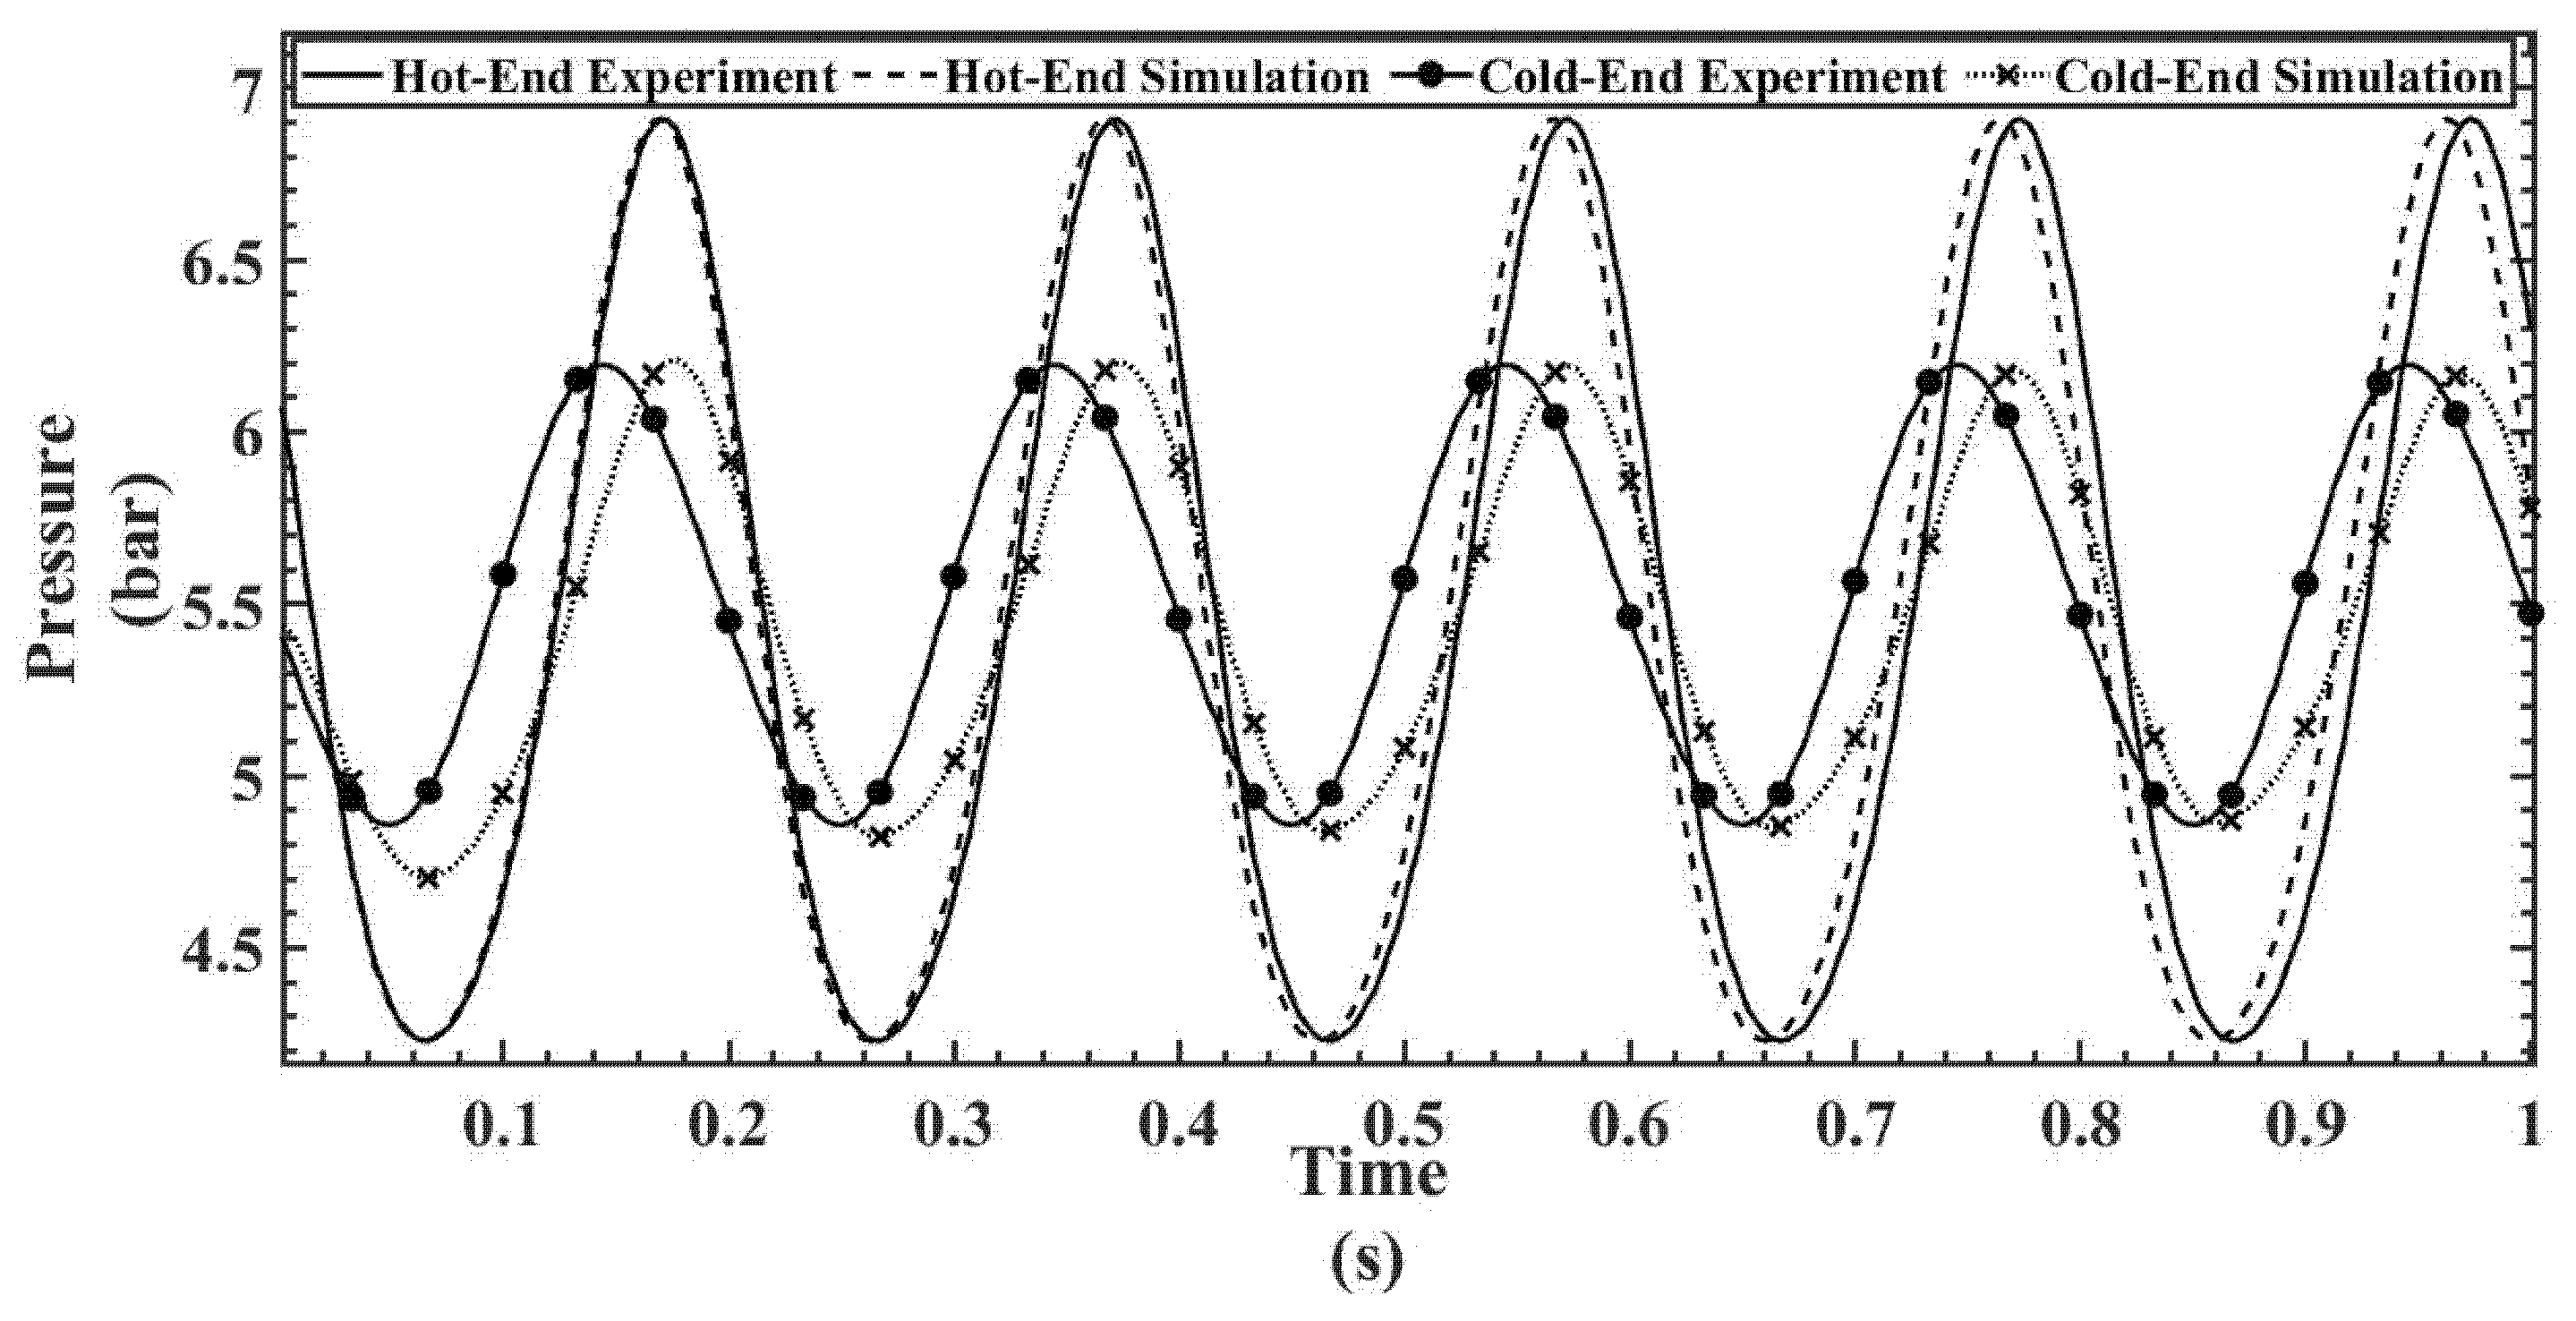
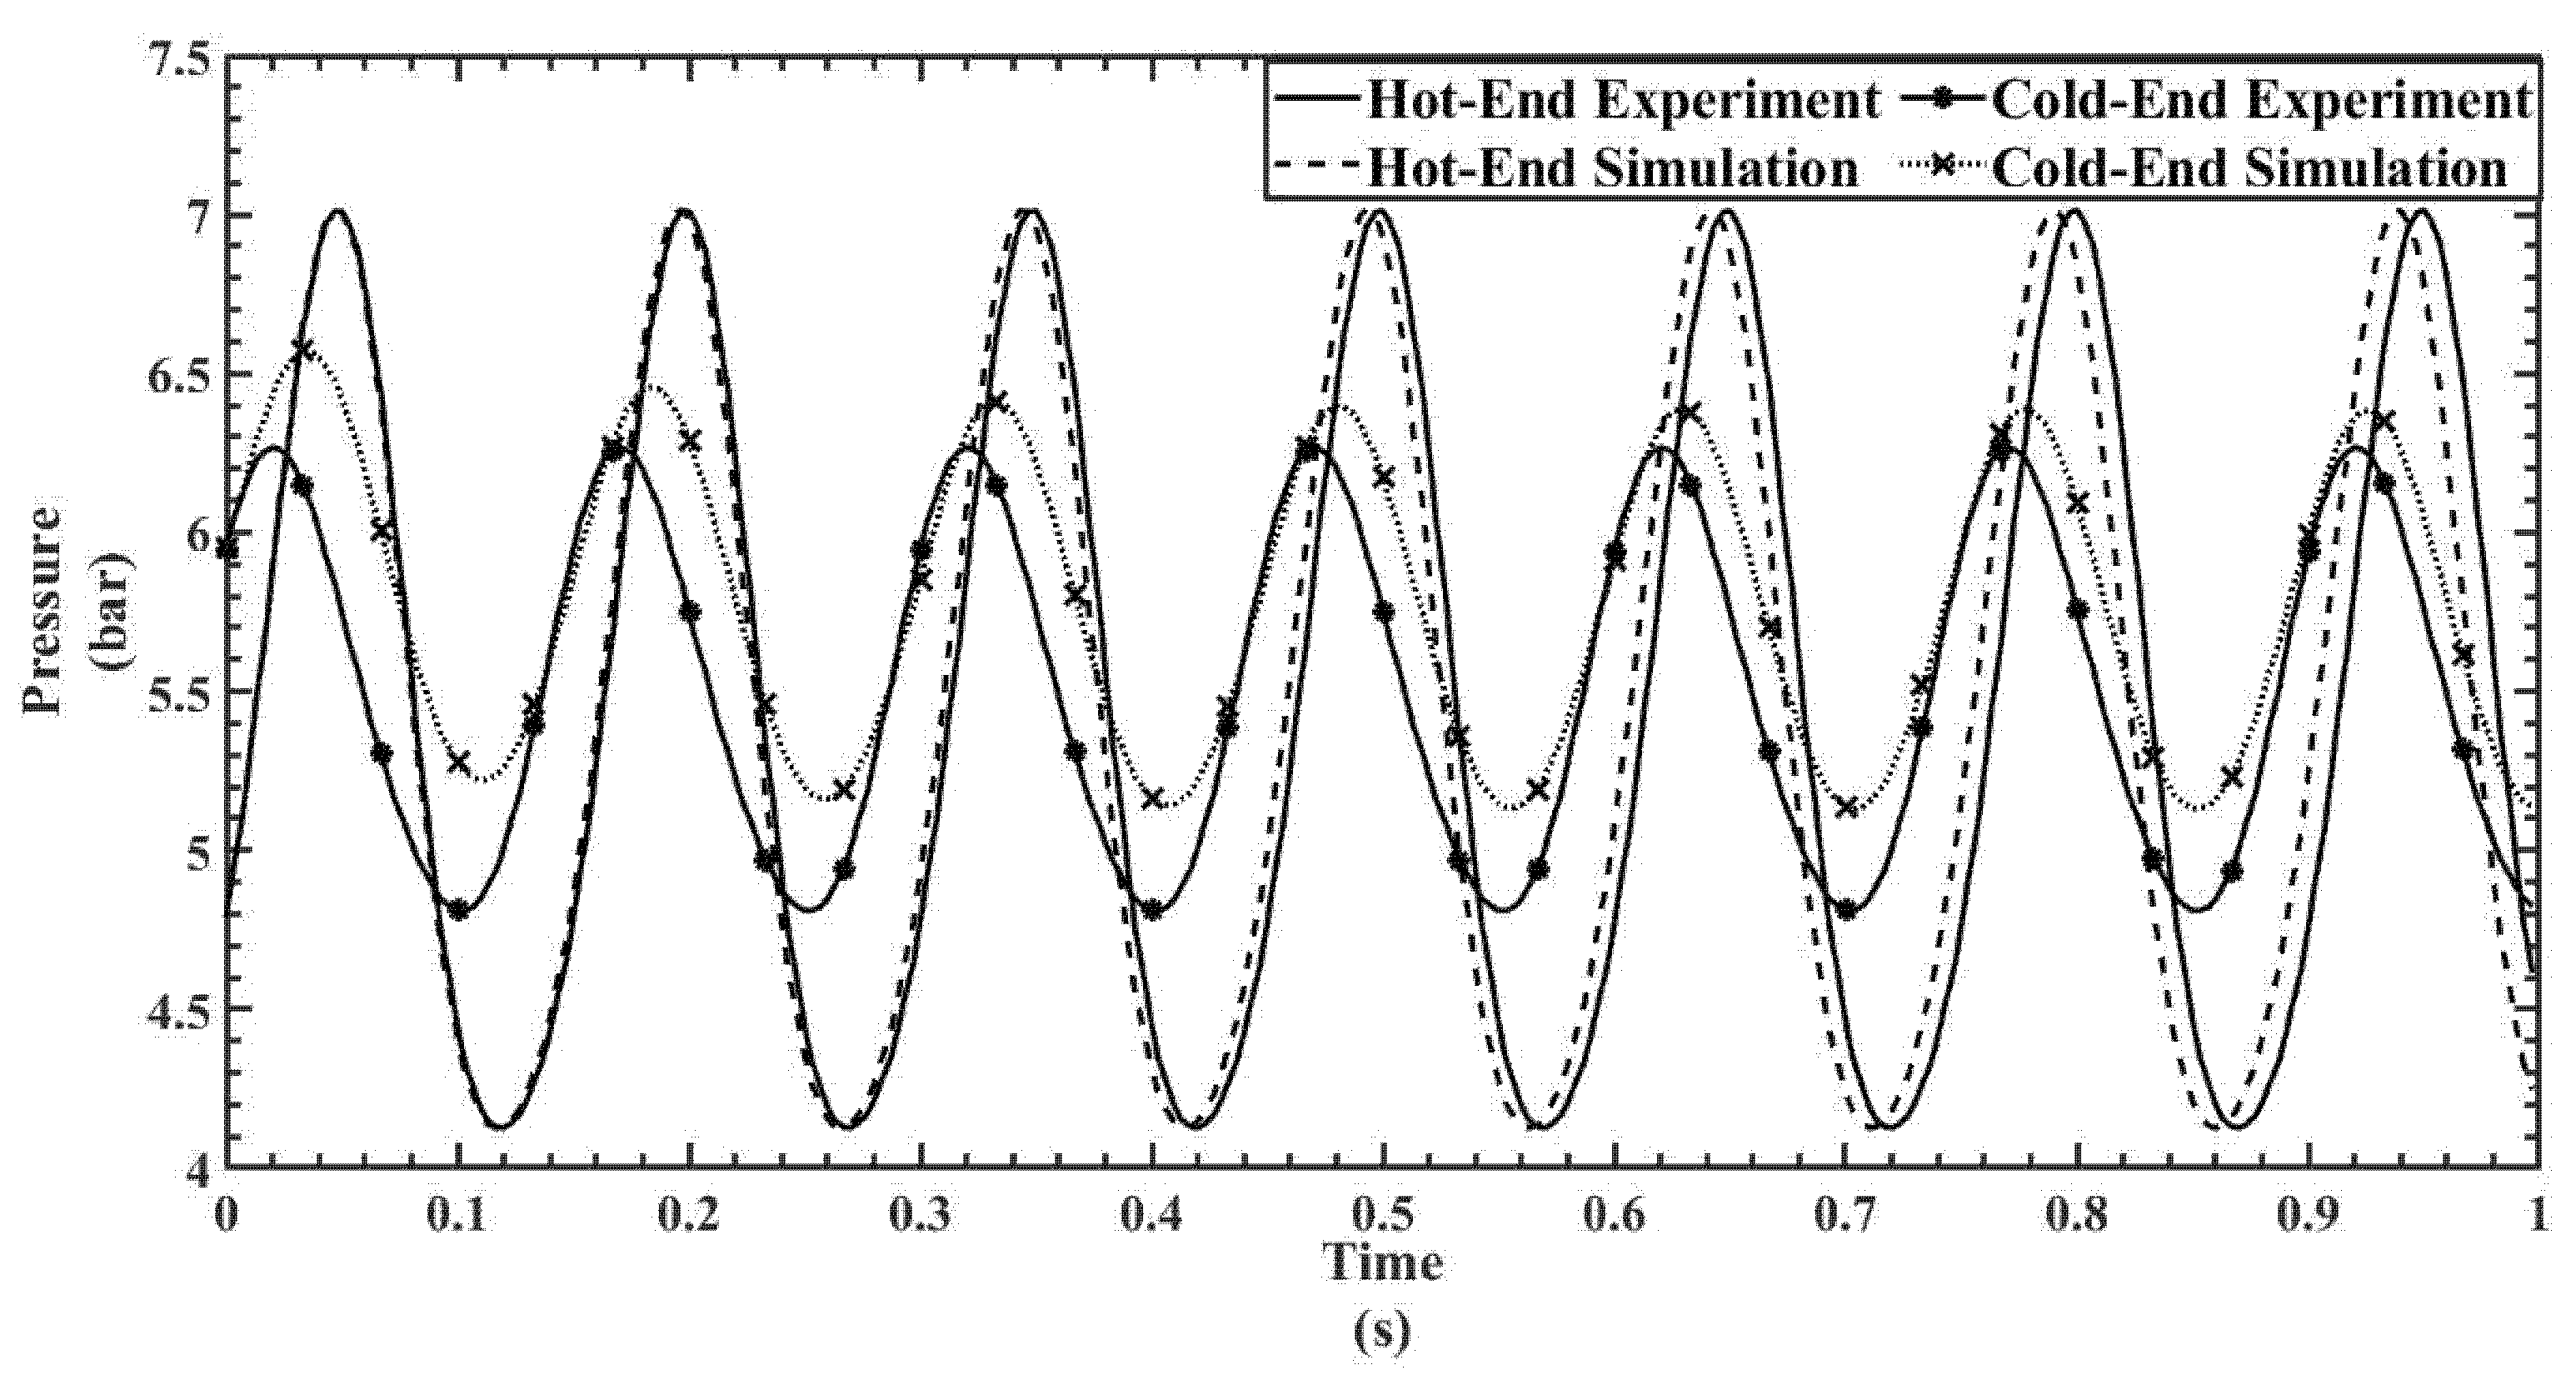
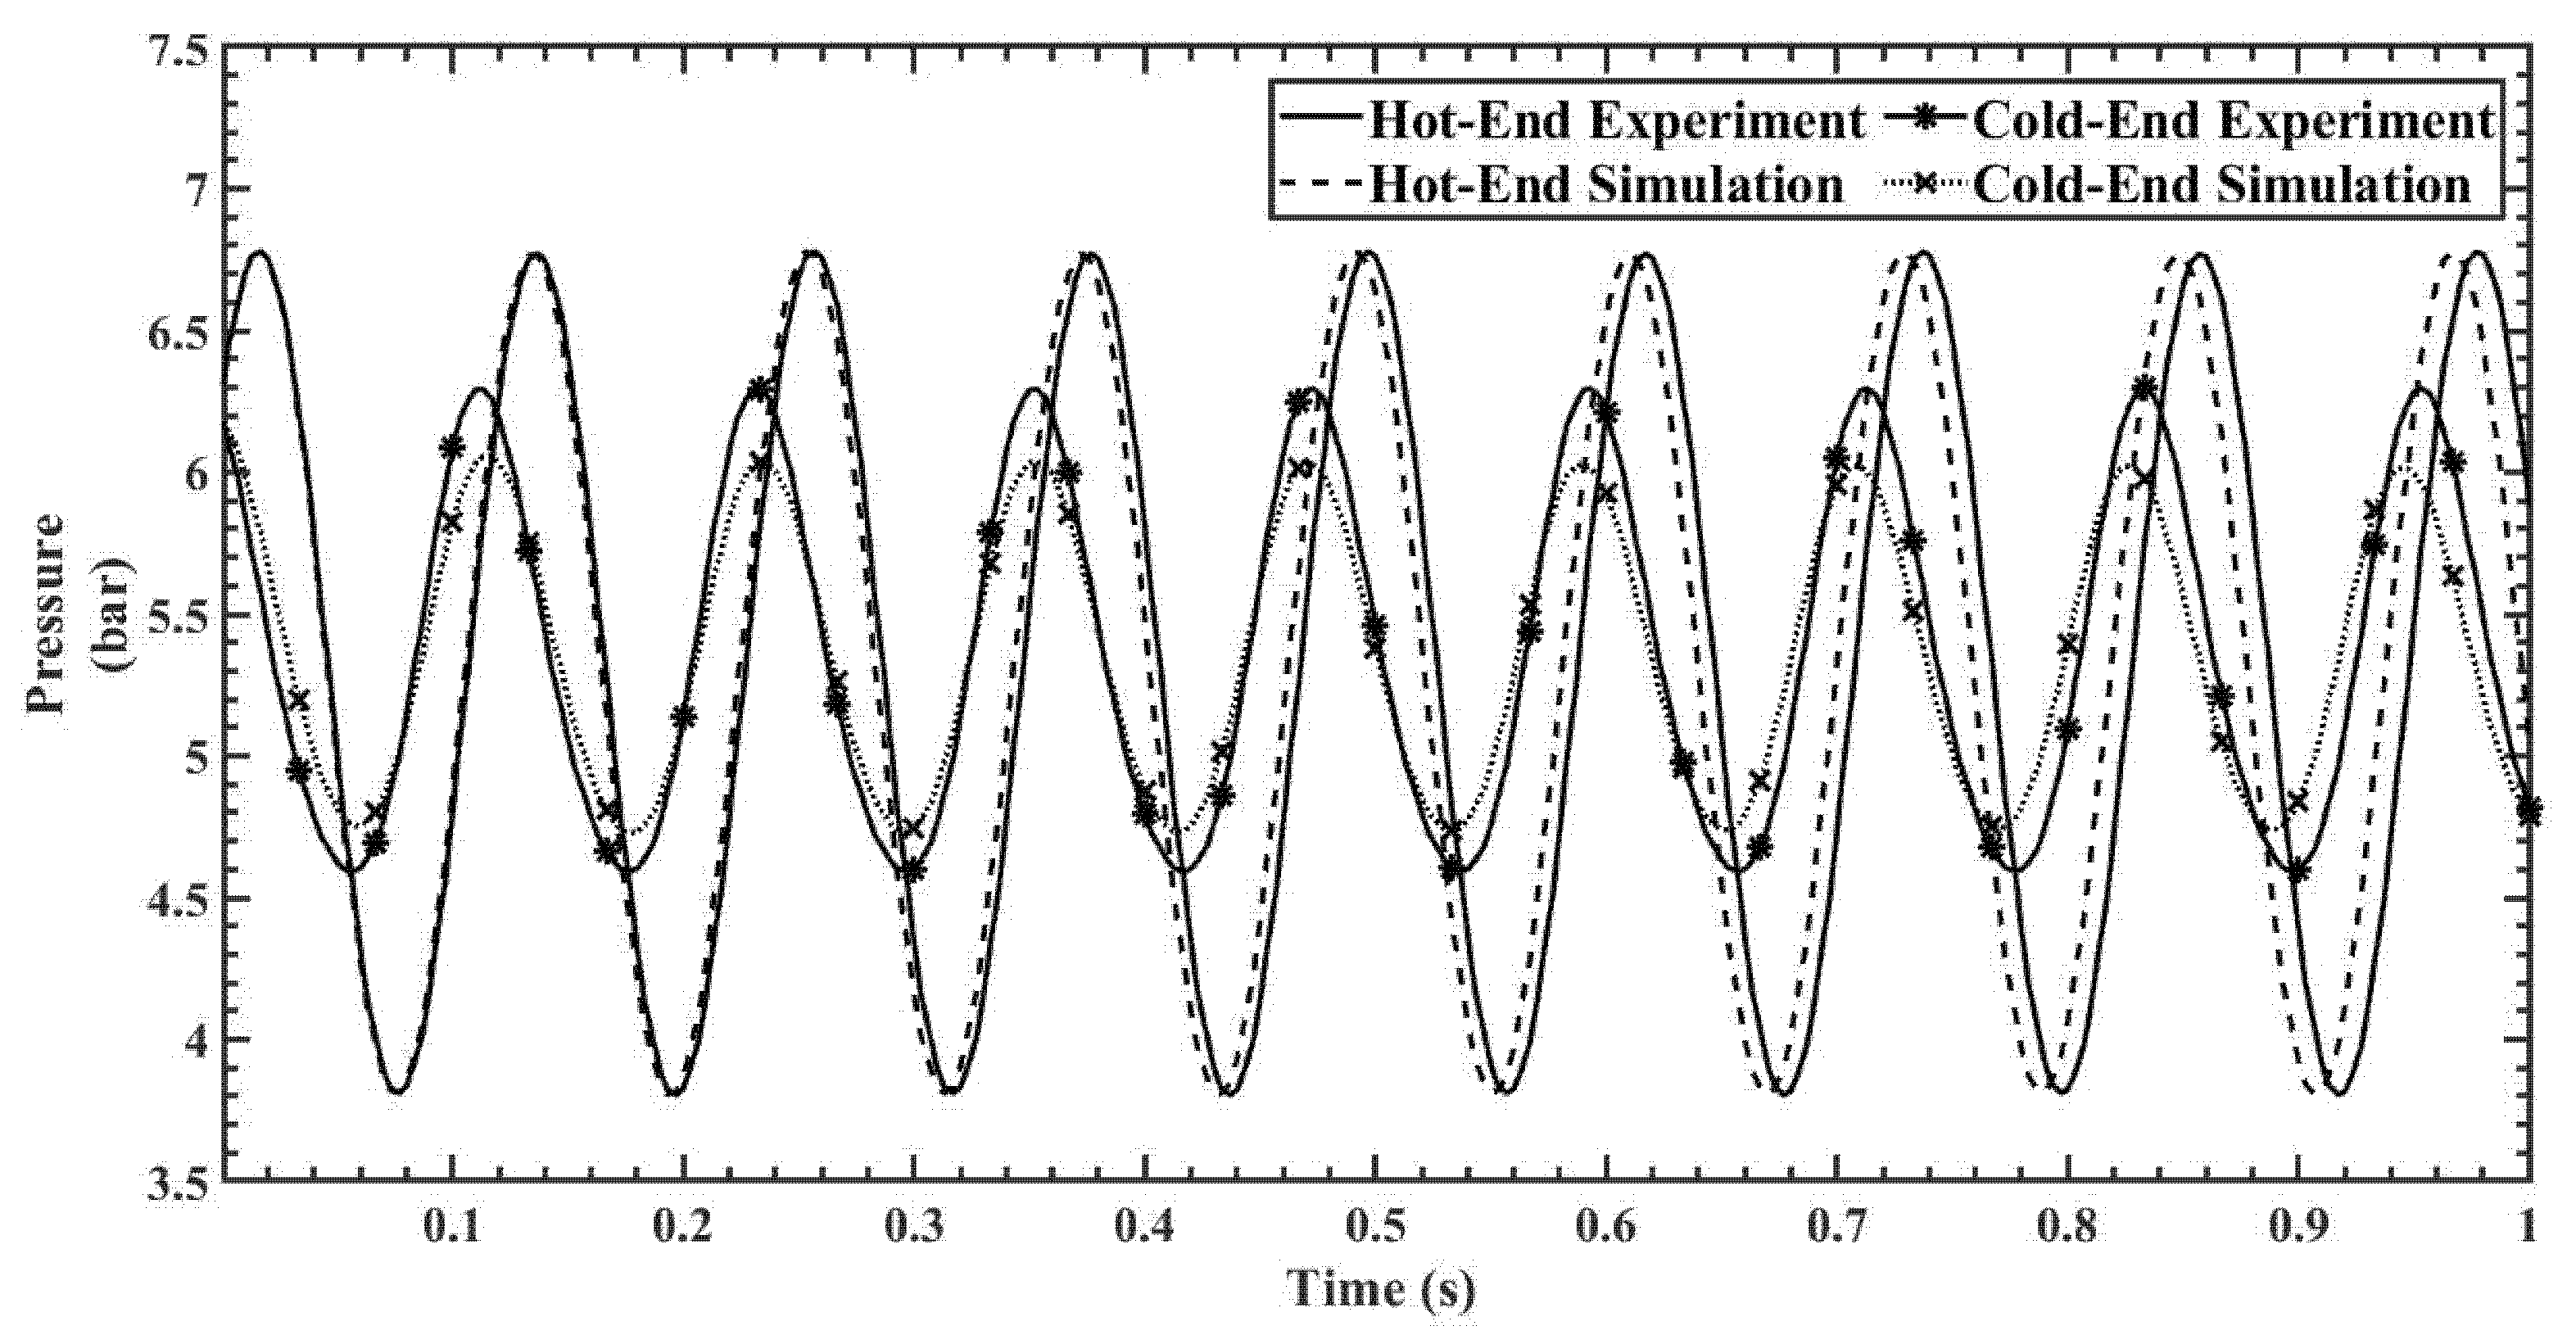
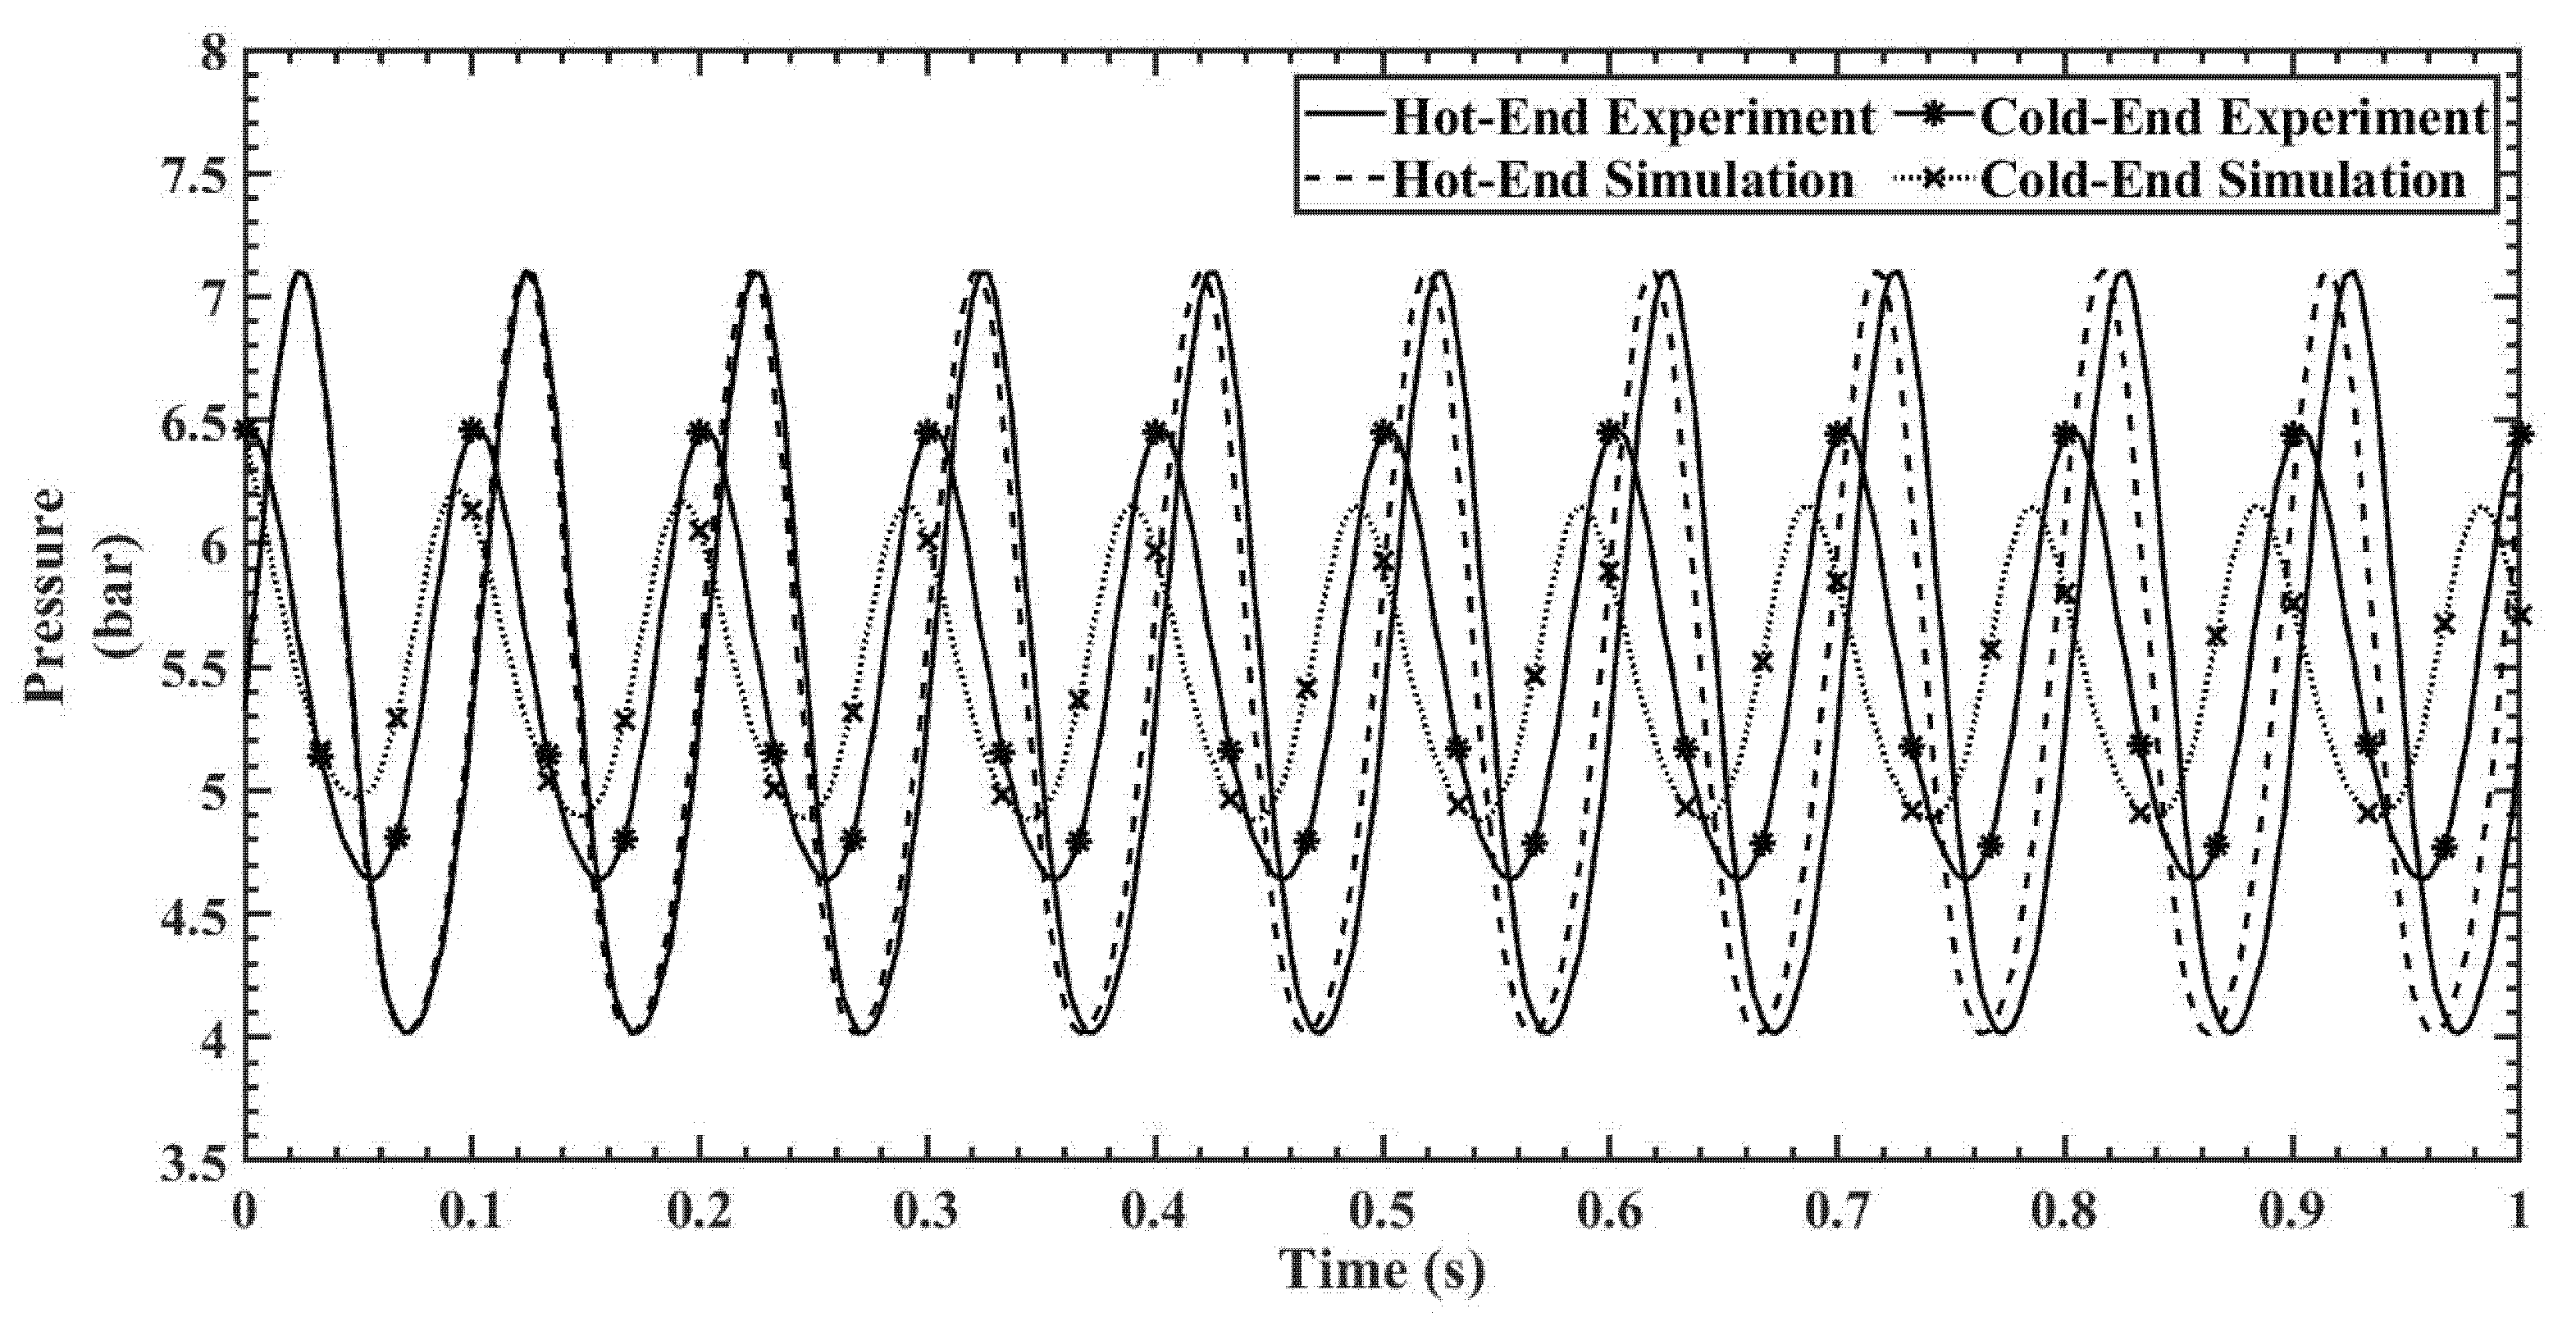
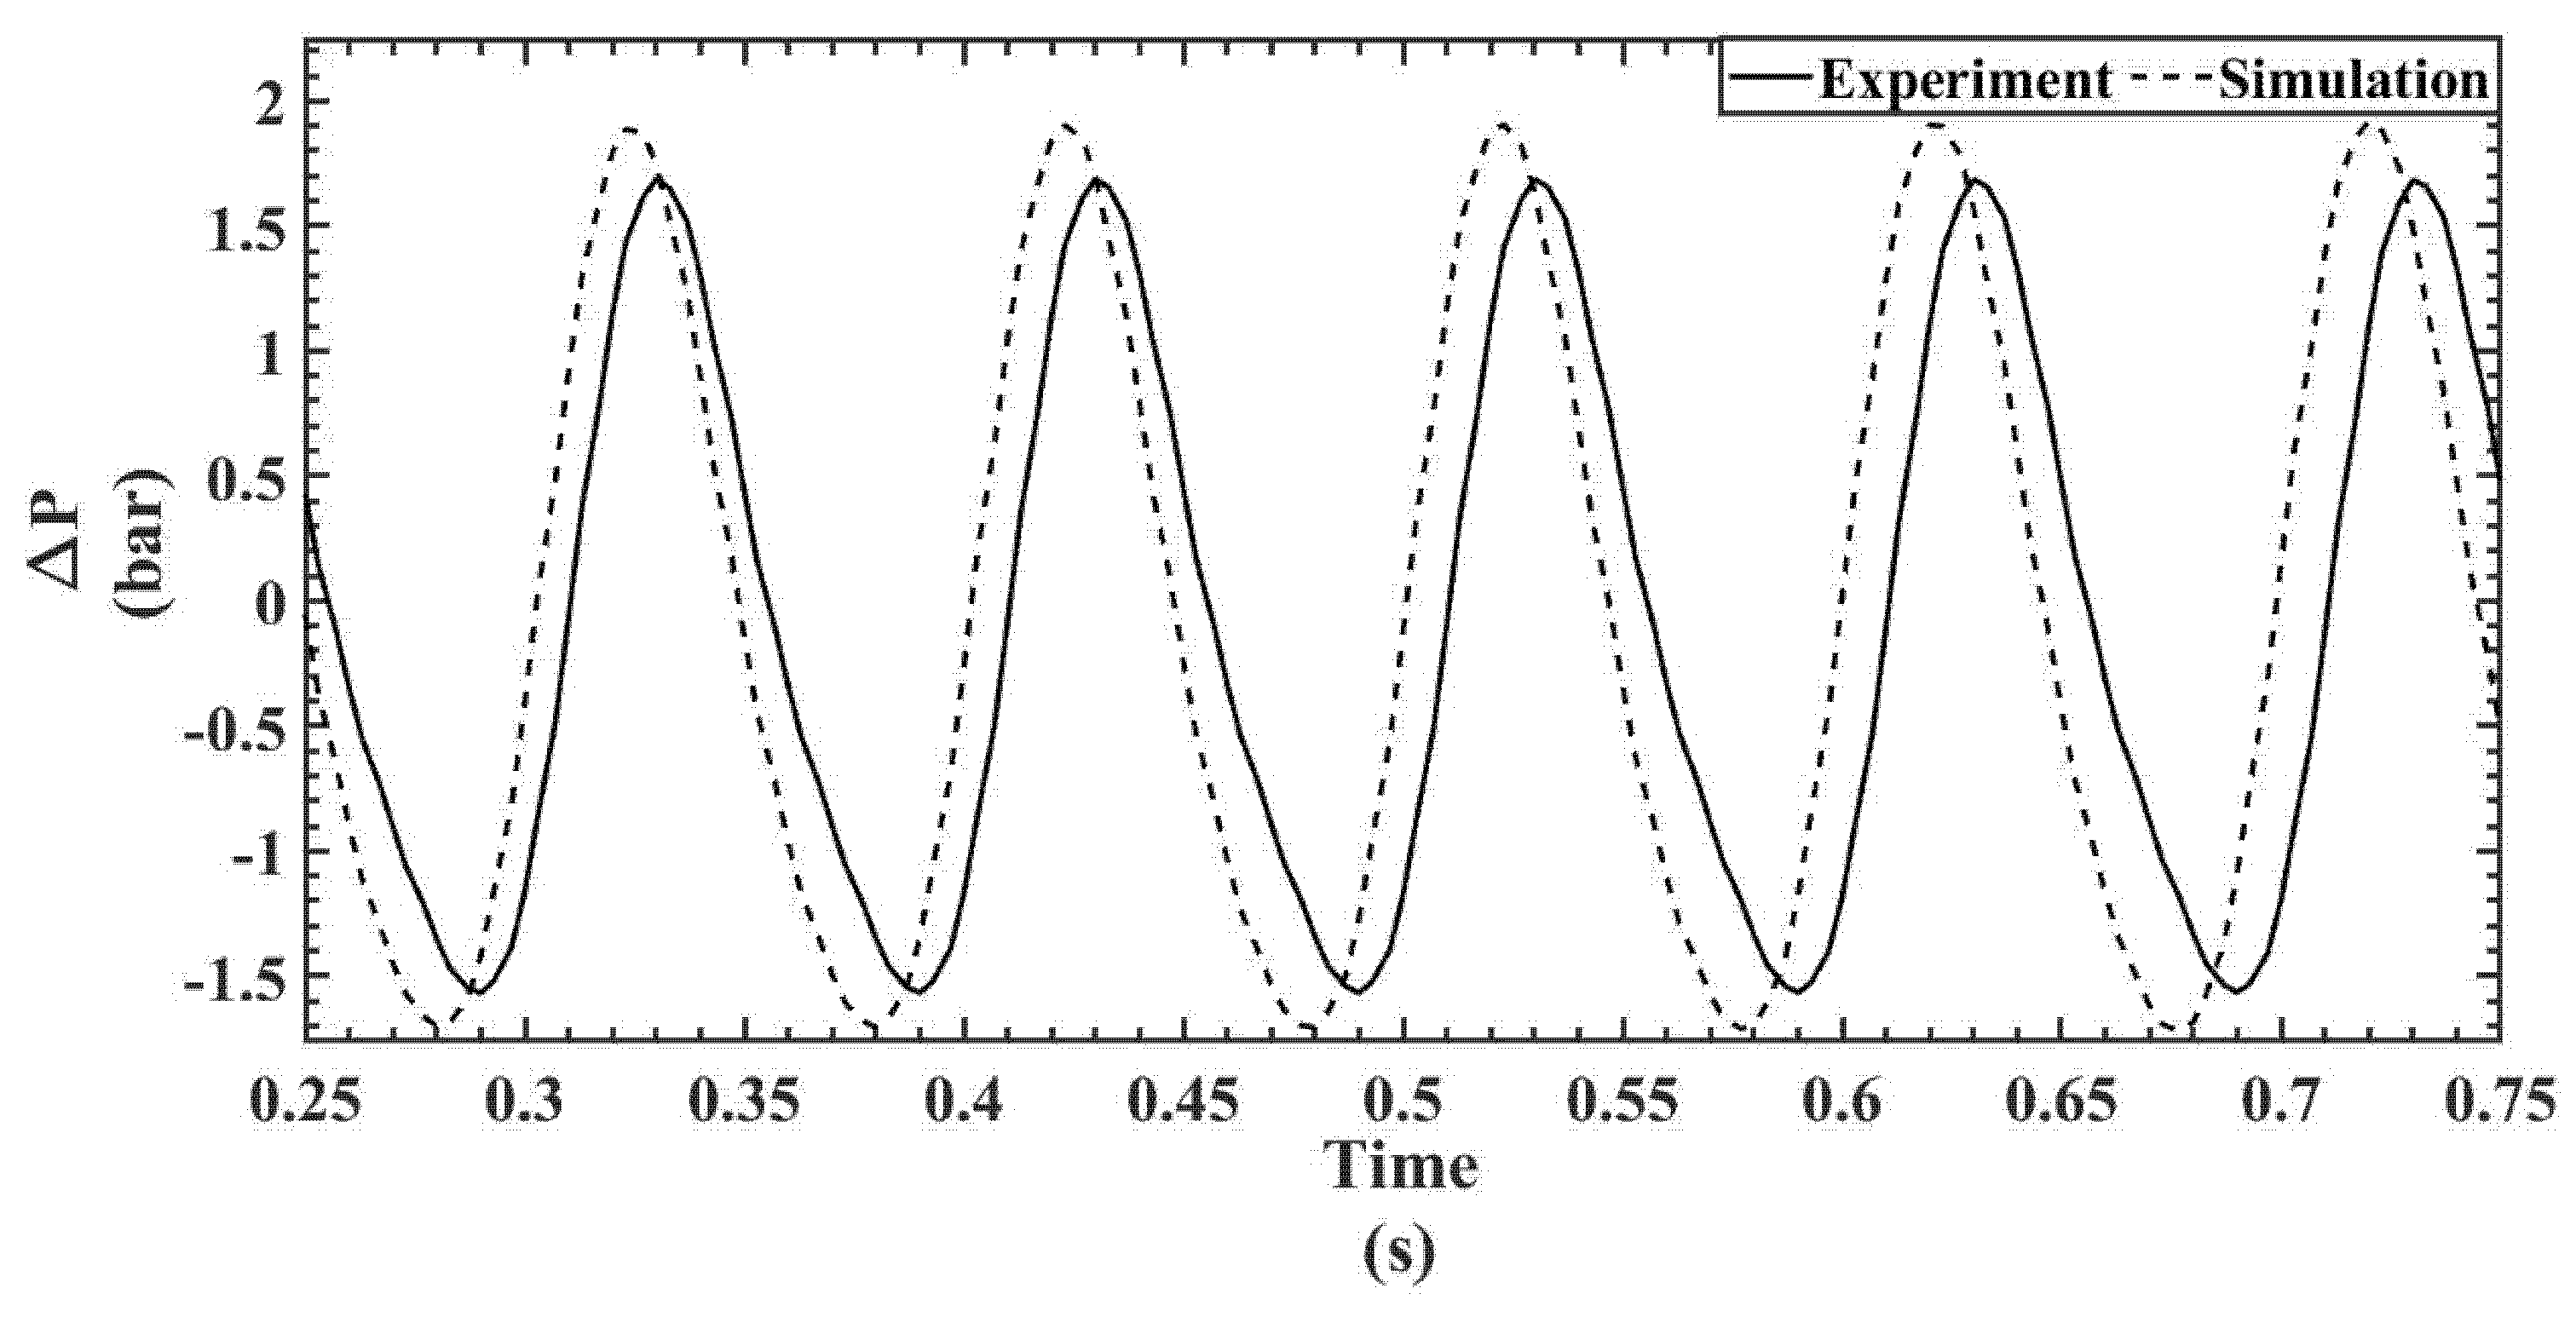
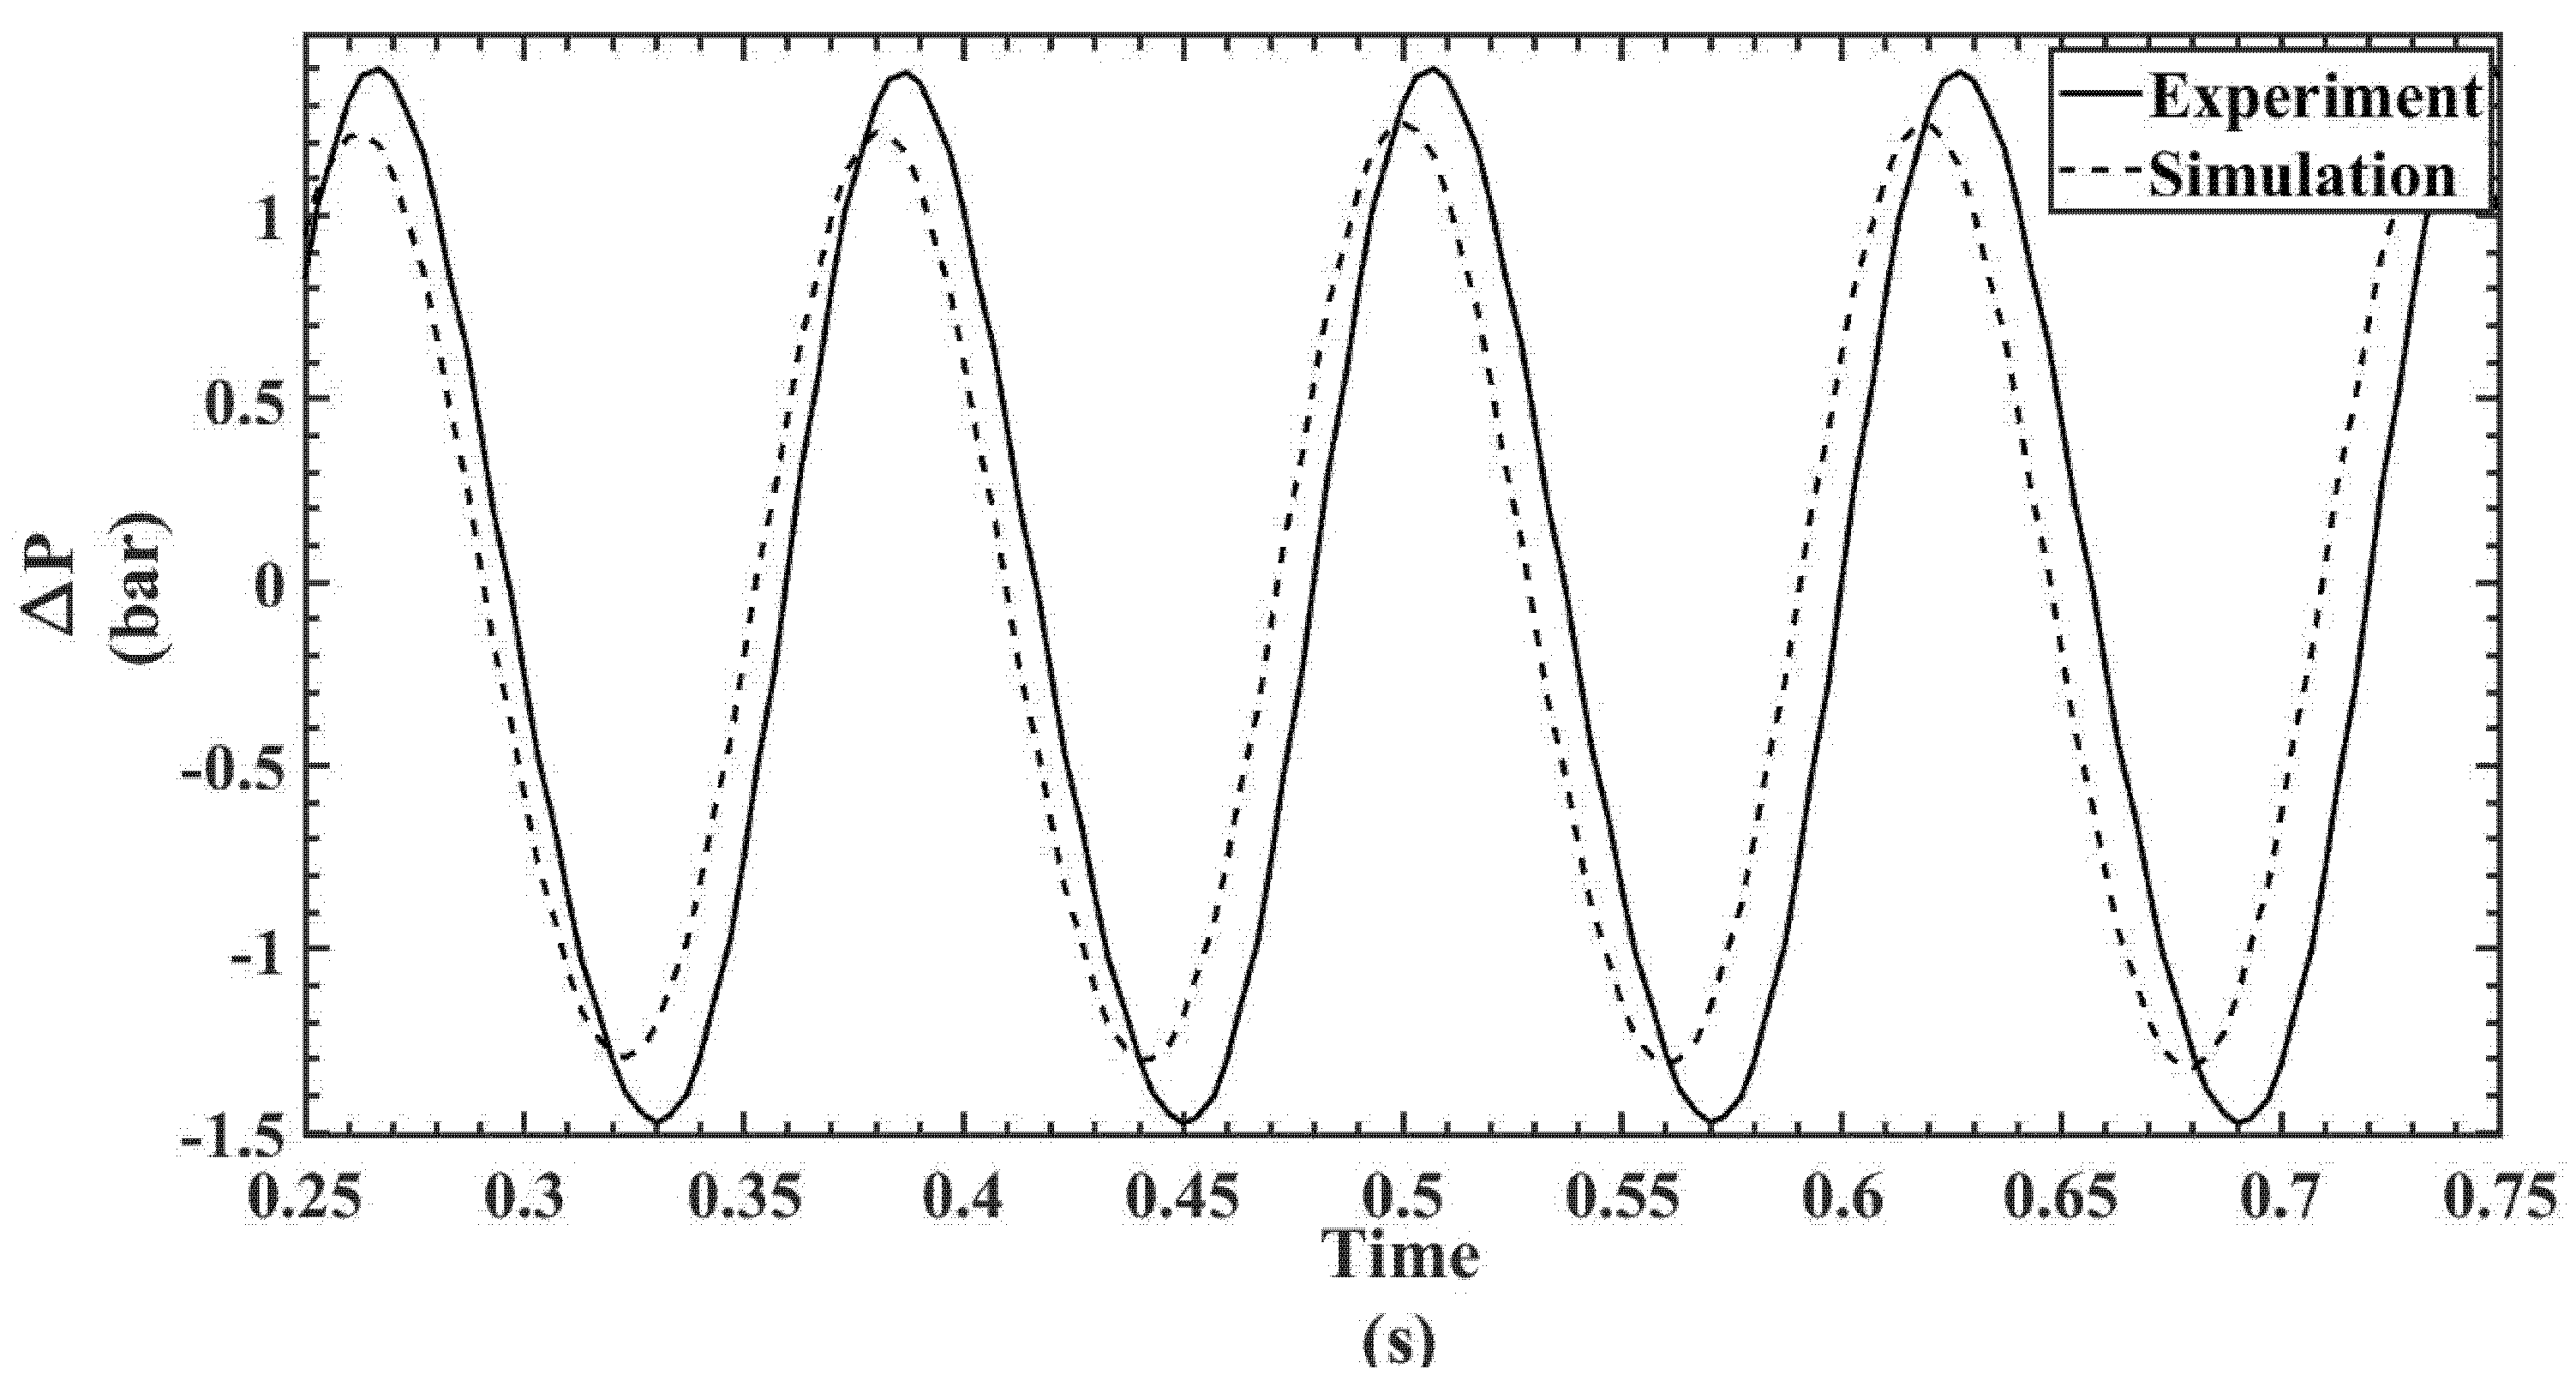
4.1. Hot- and Cold-Section Pressure Characteristics
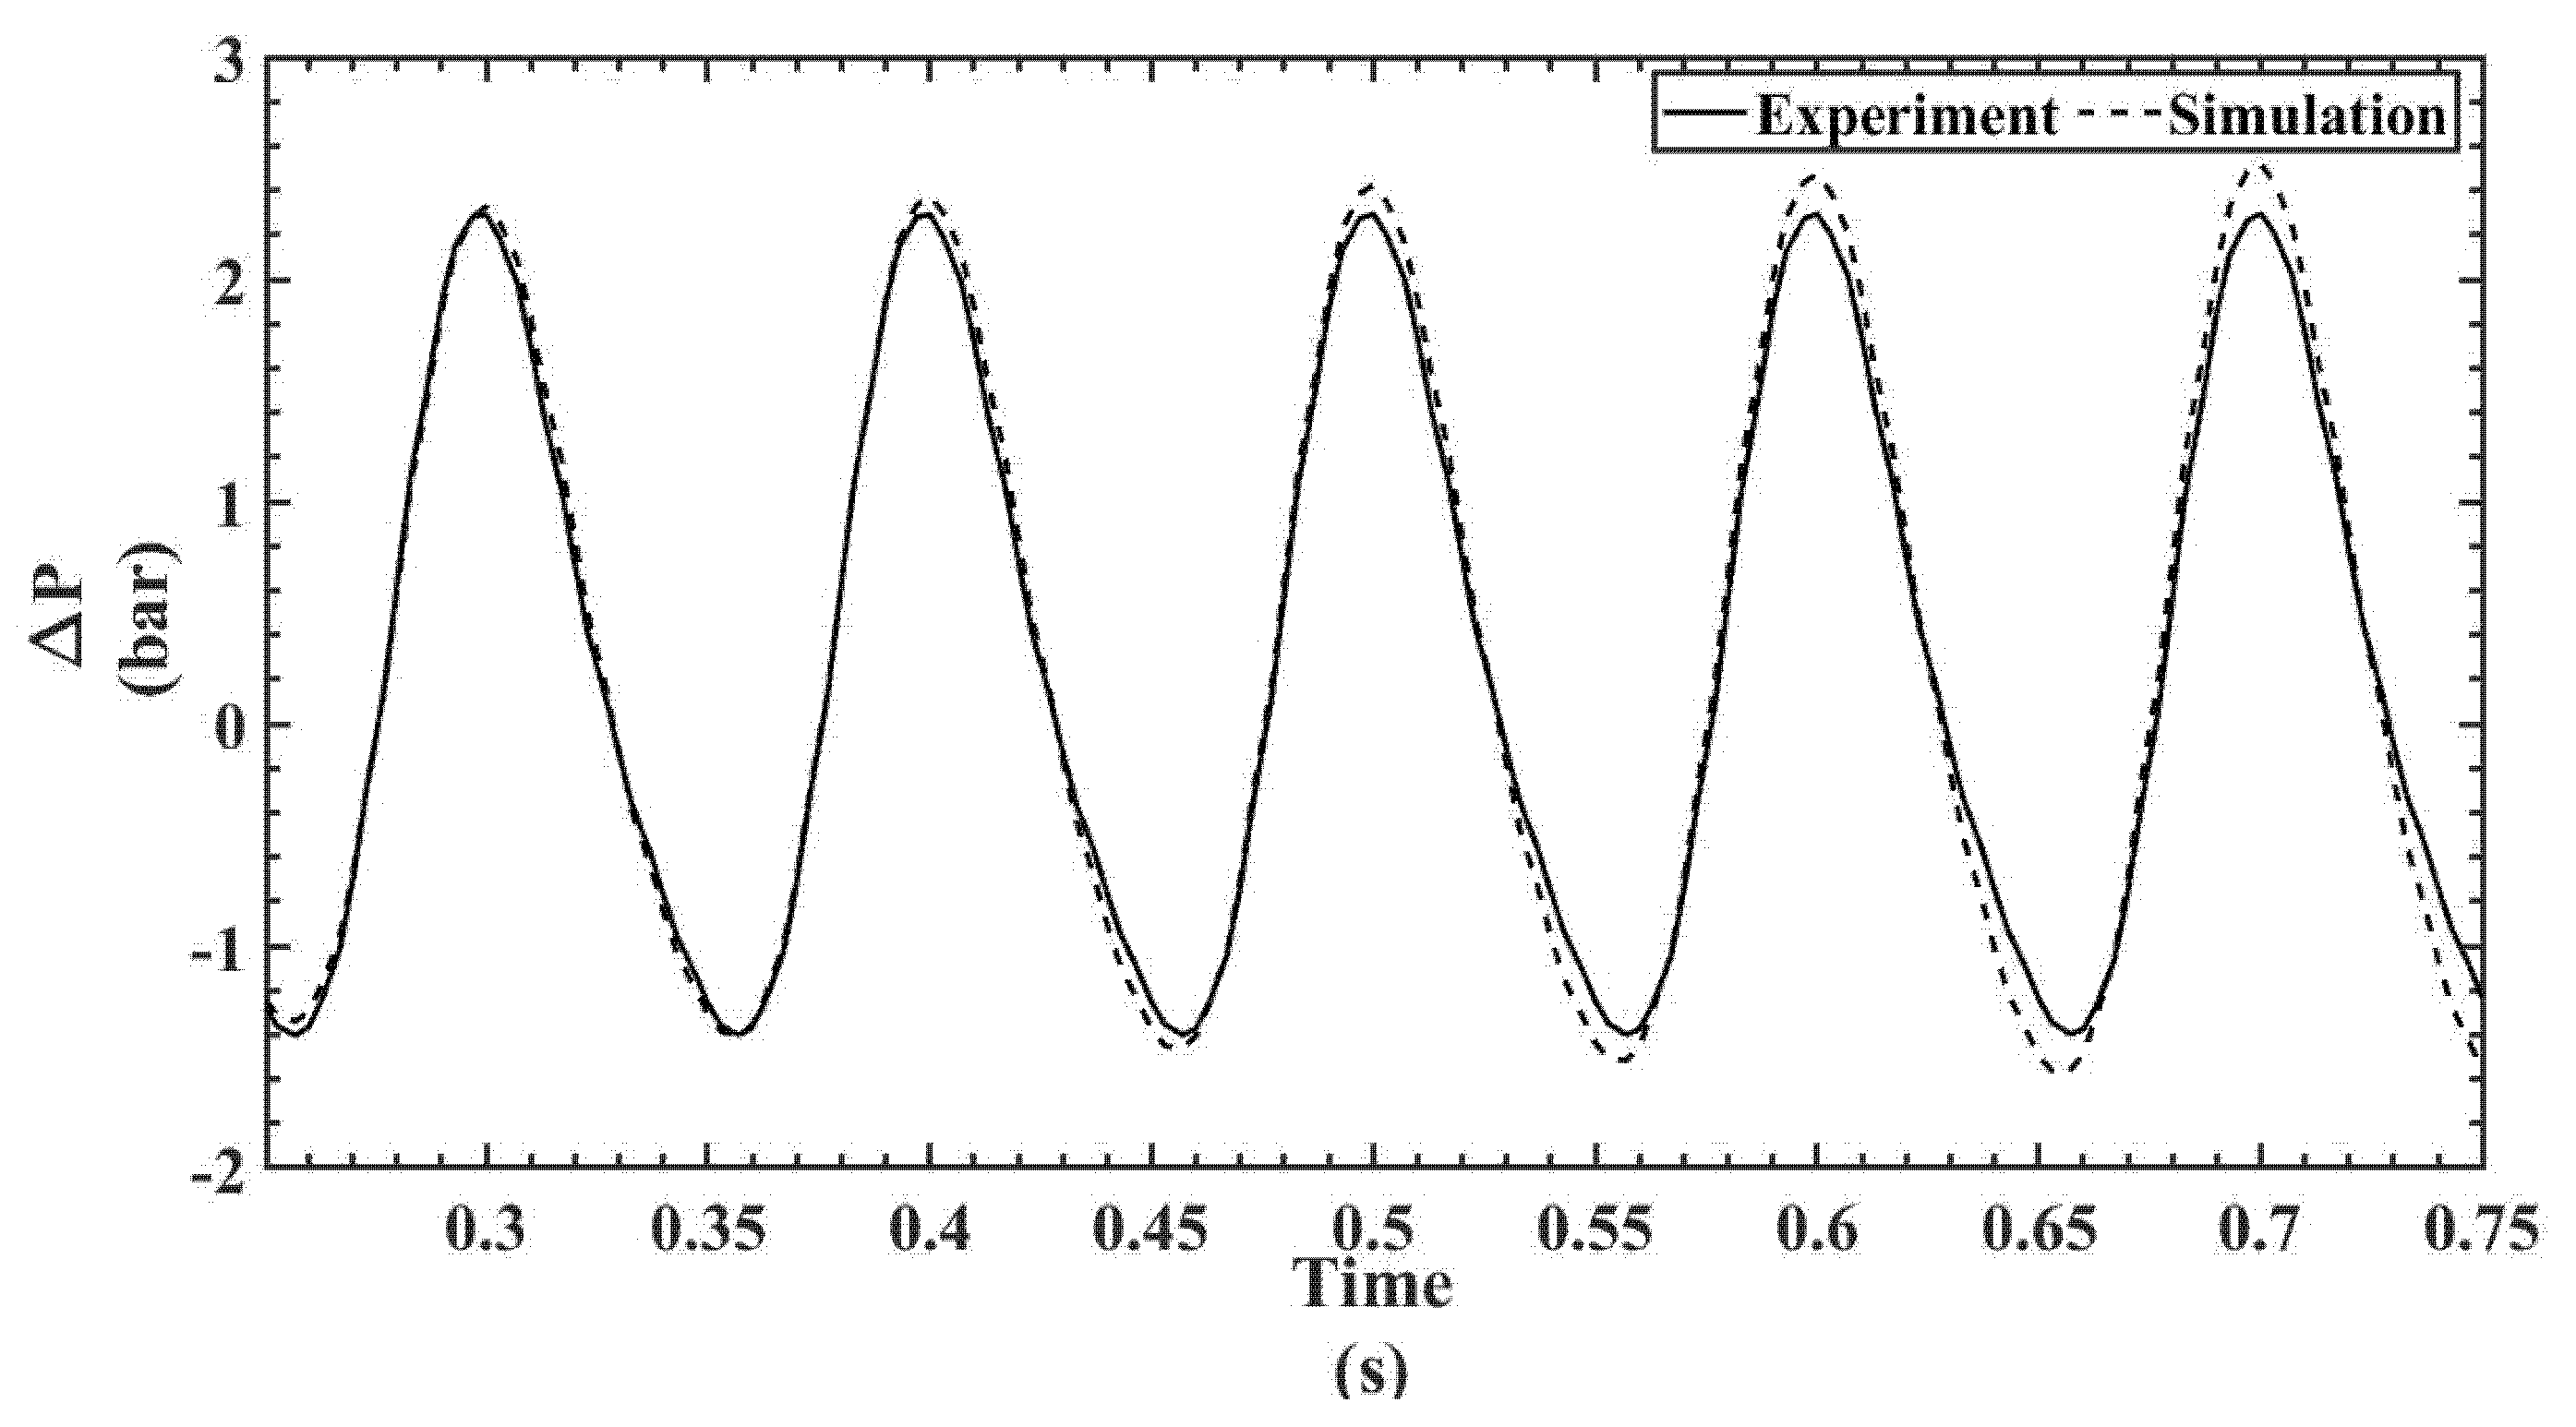
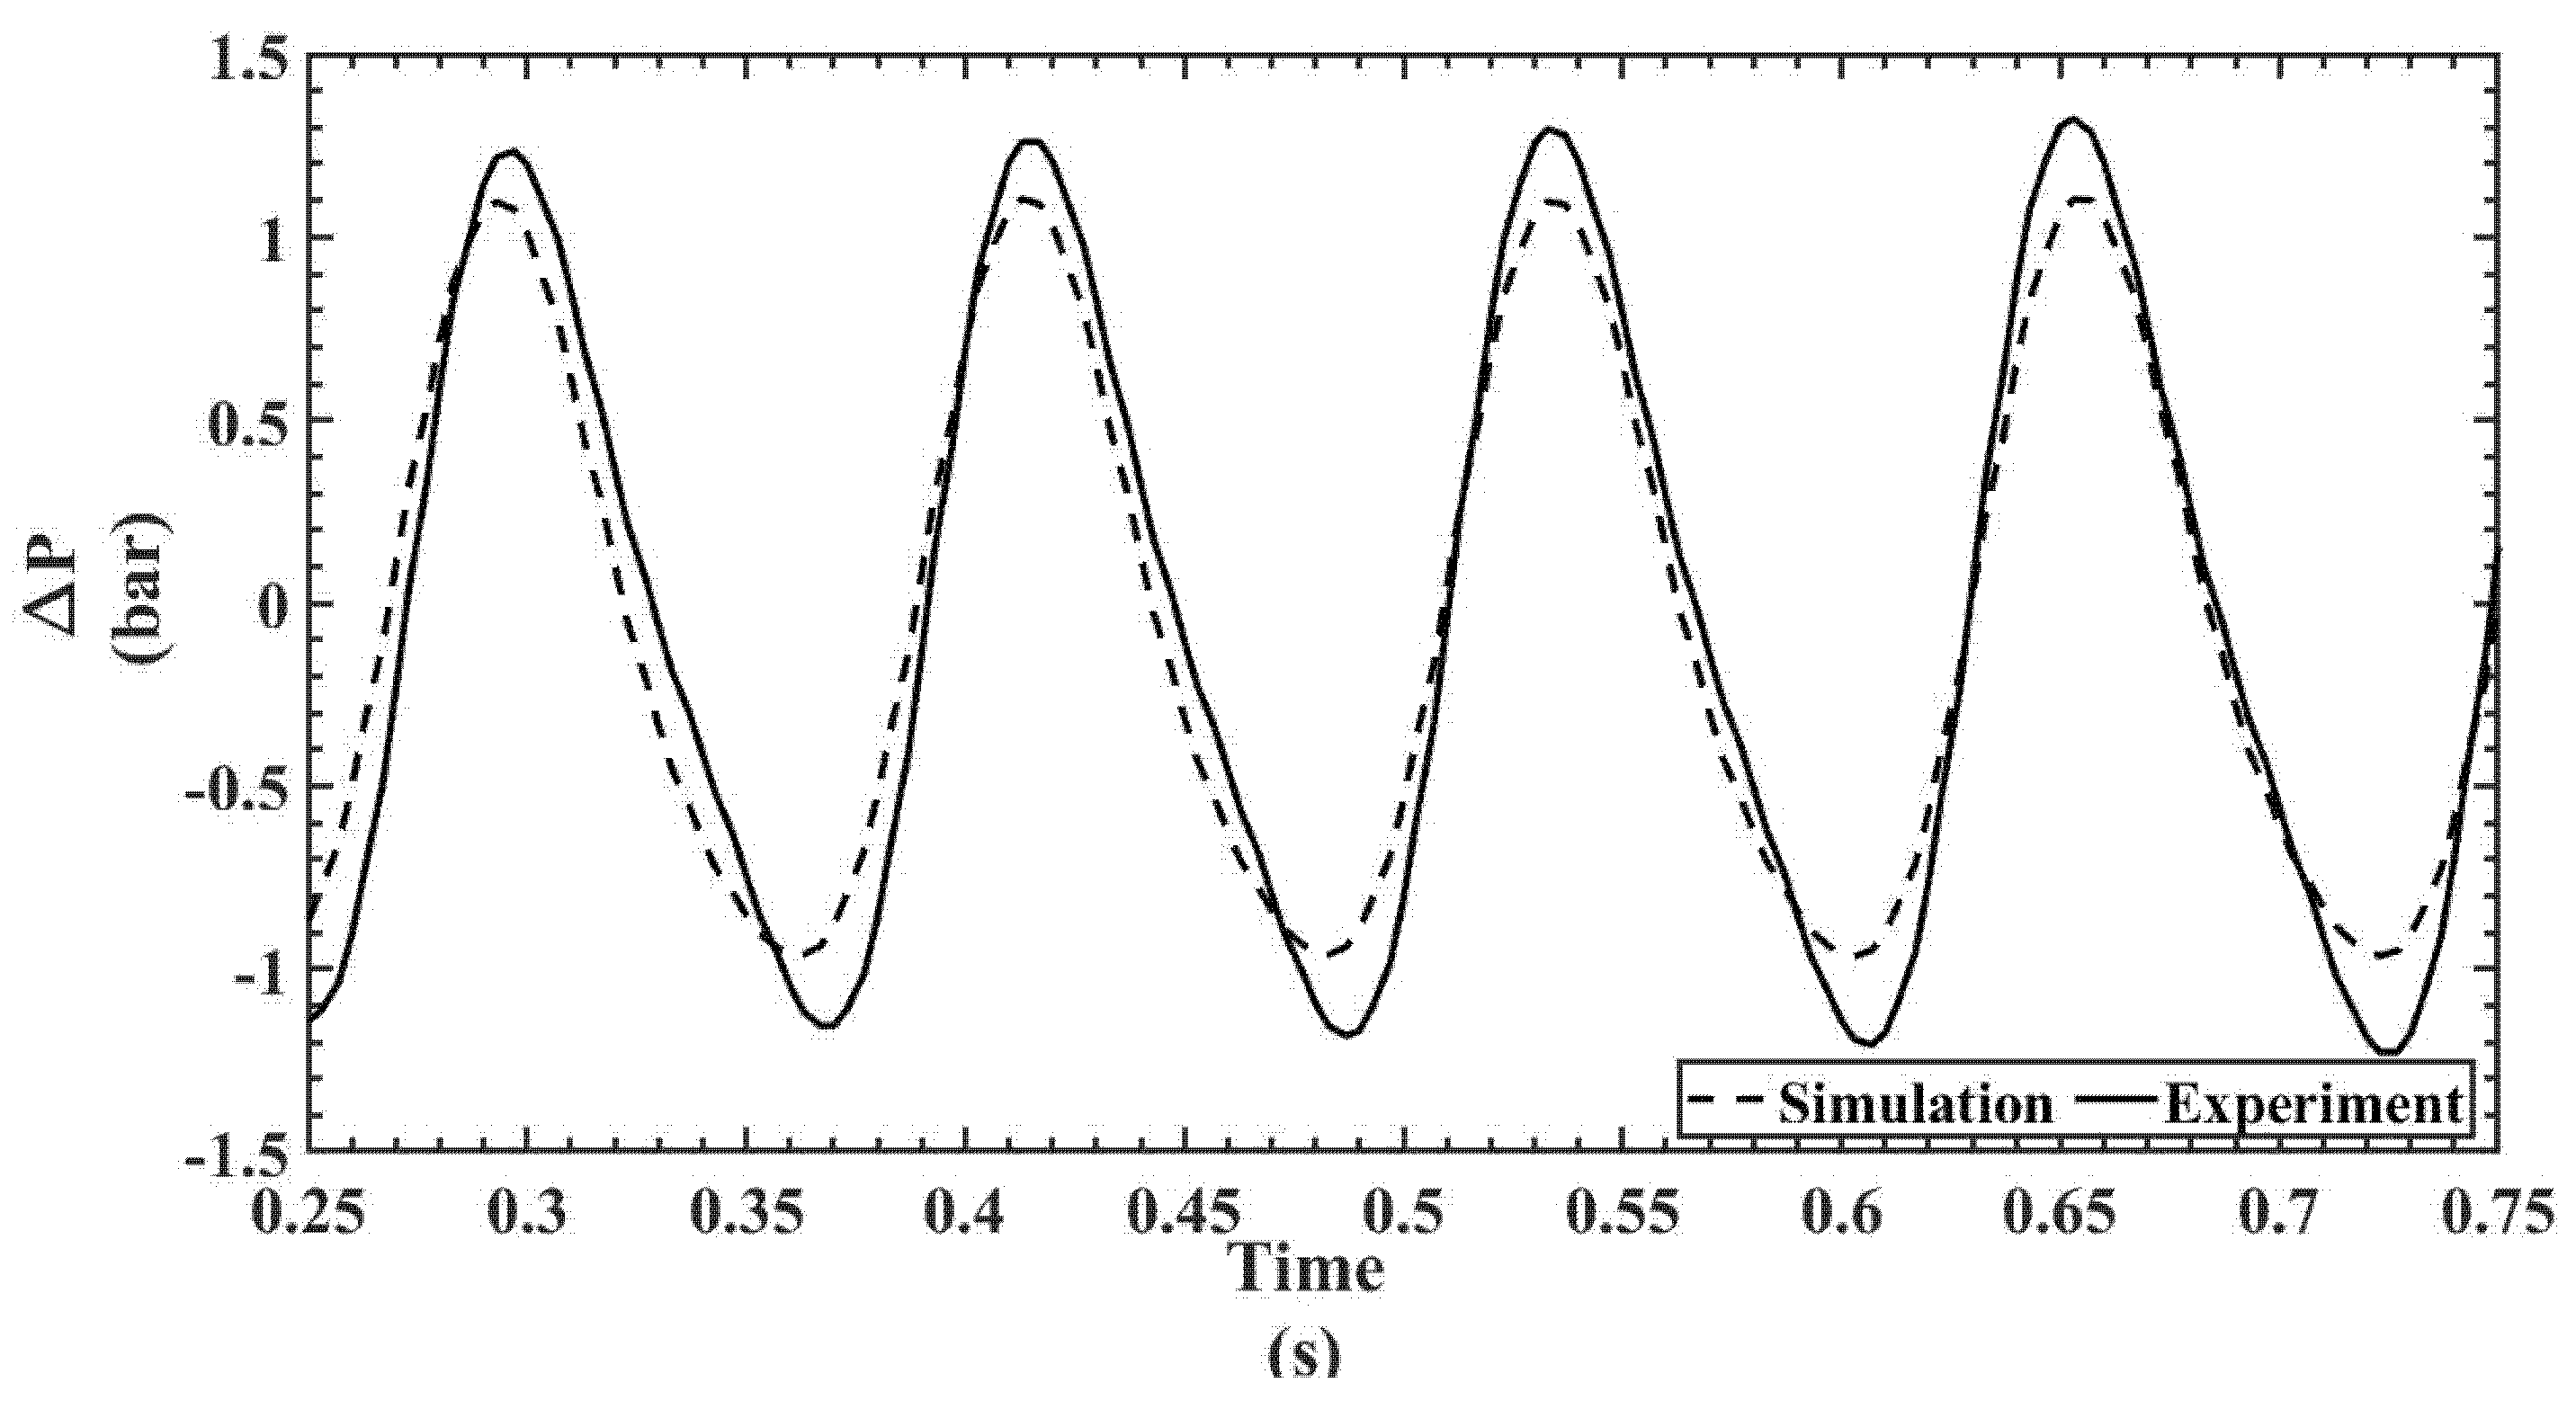
4.2. Temporal Pressure Drop Characteristics
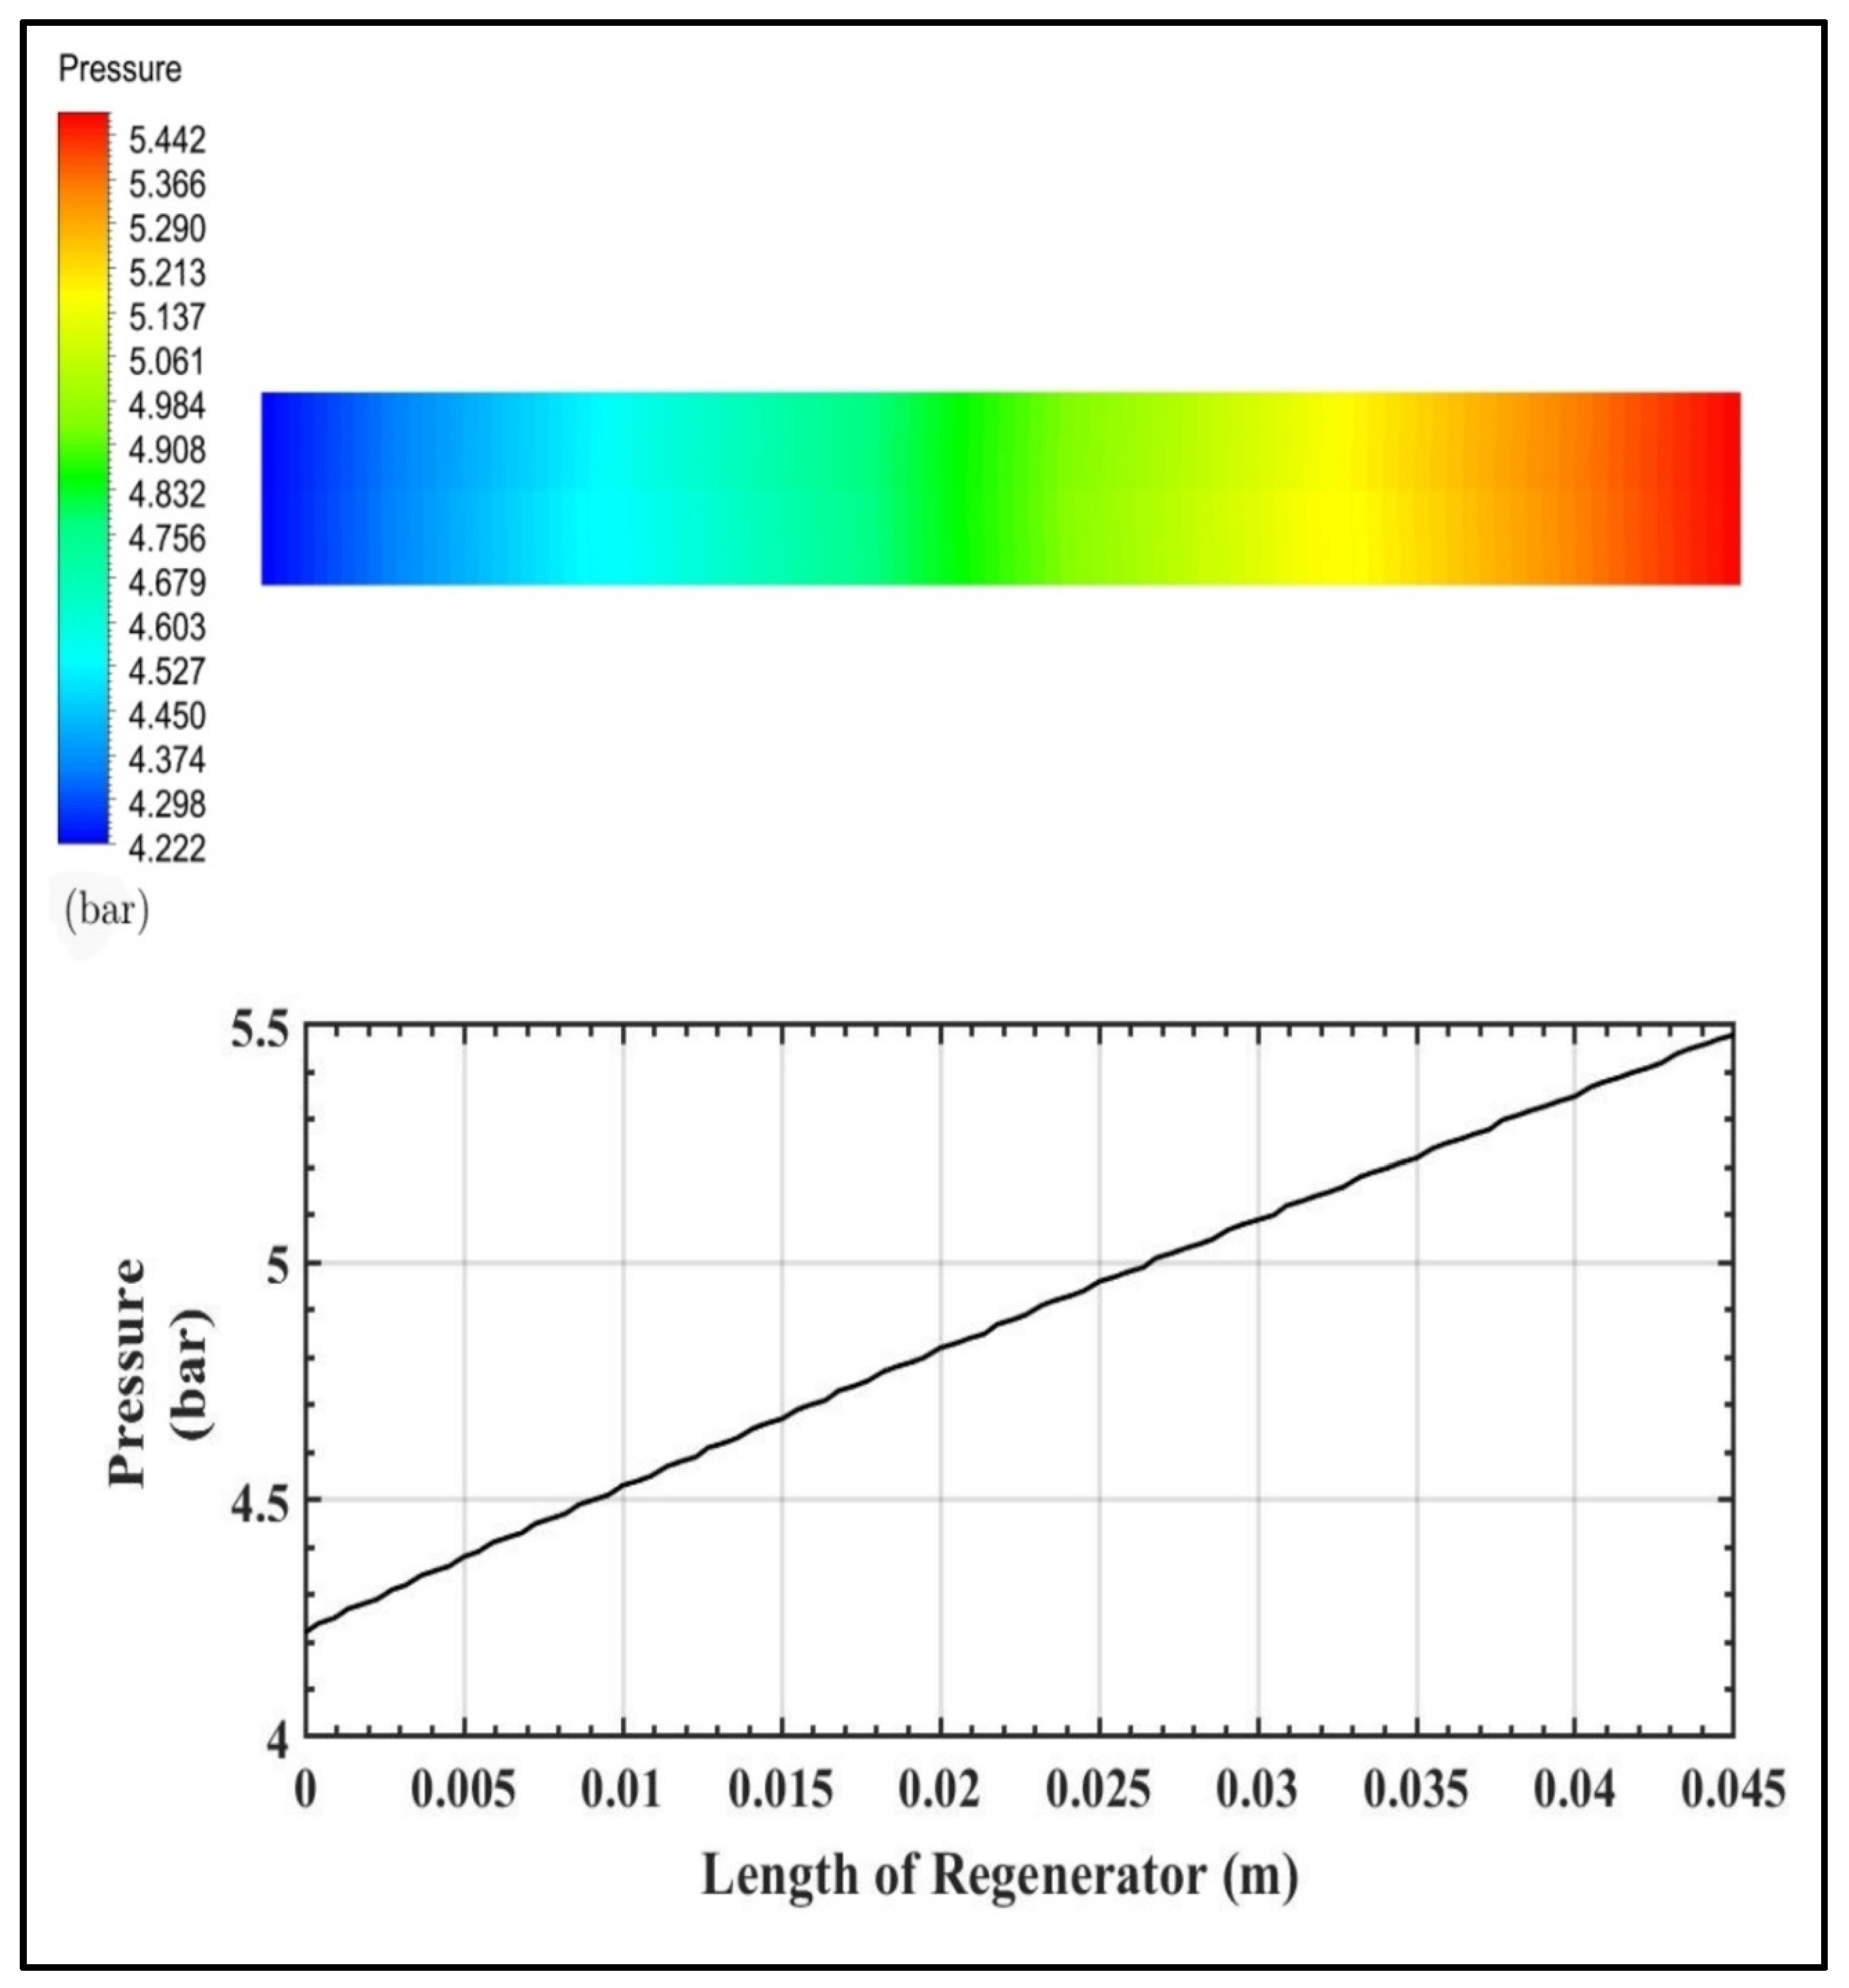
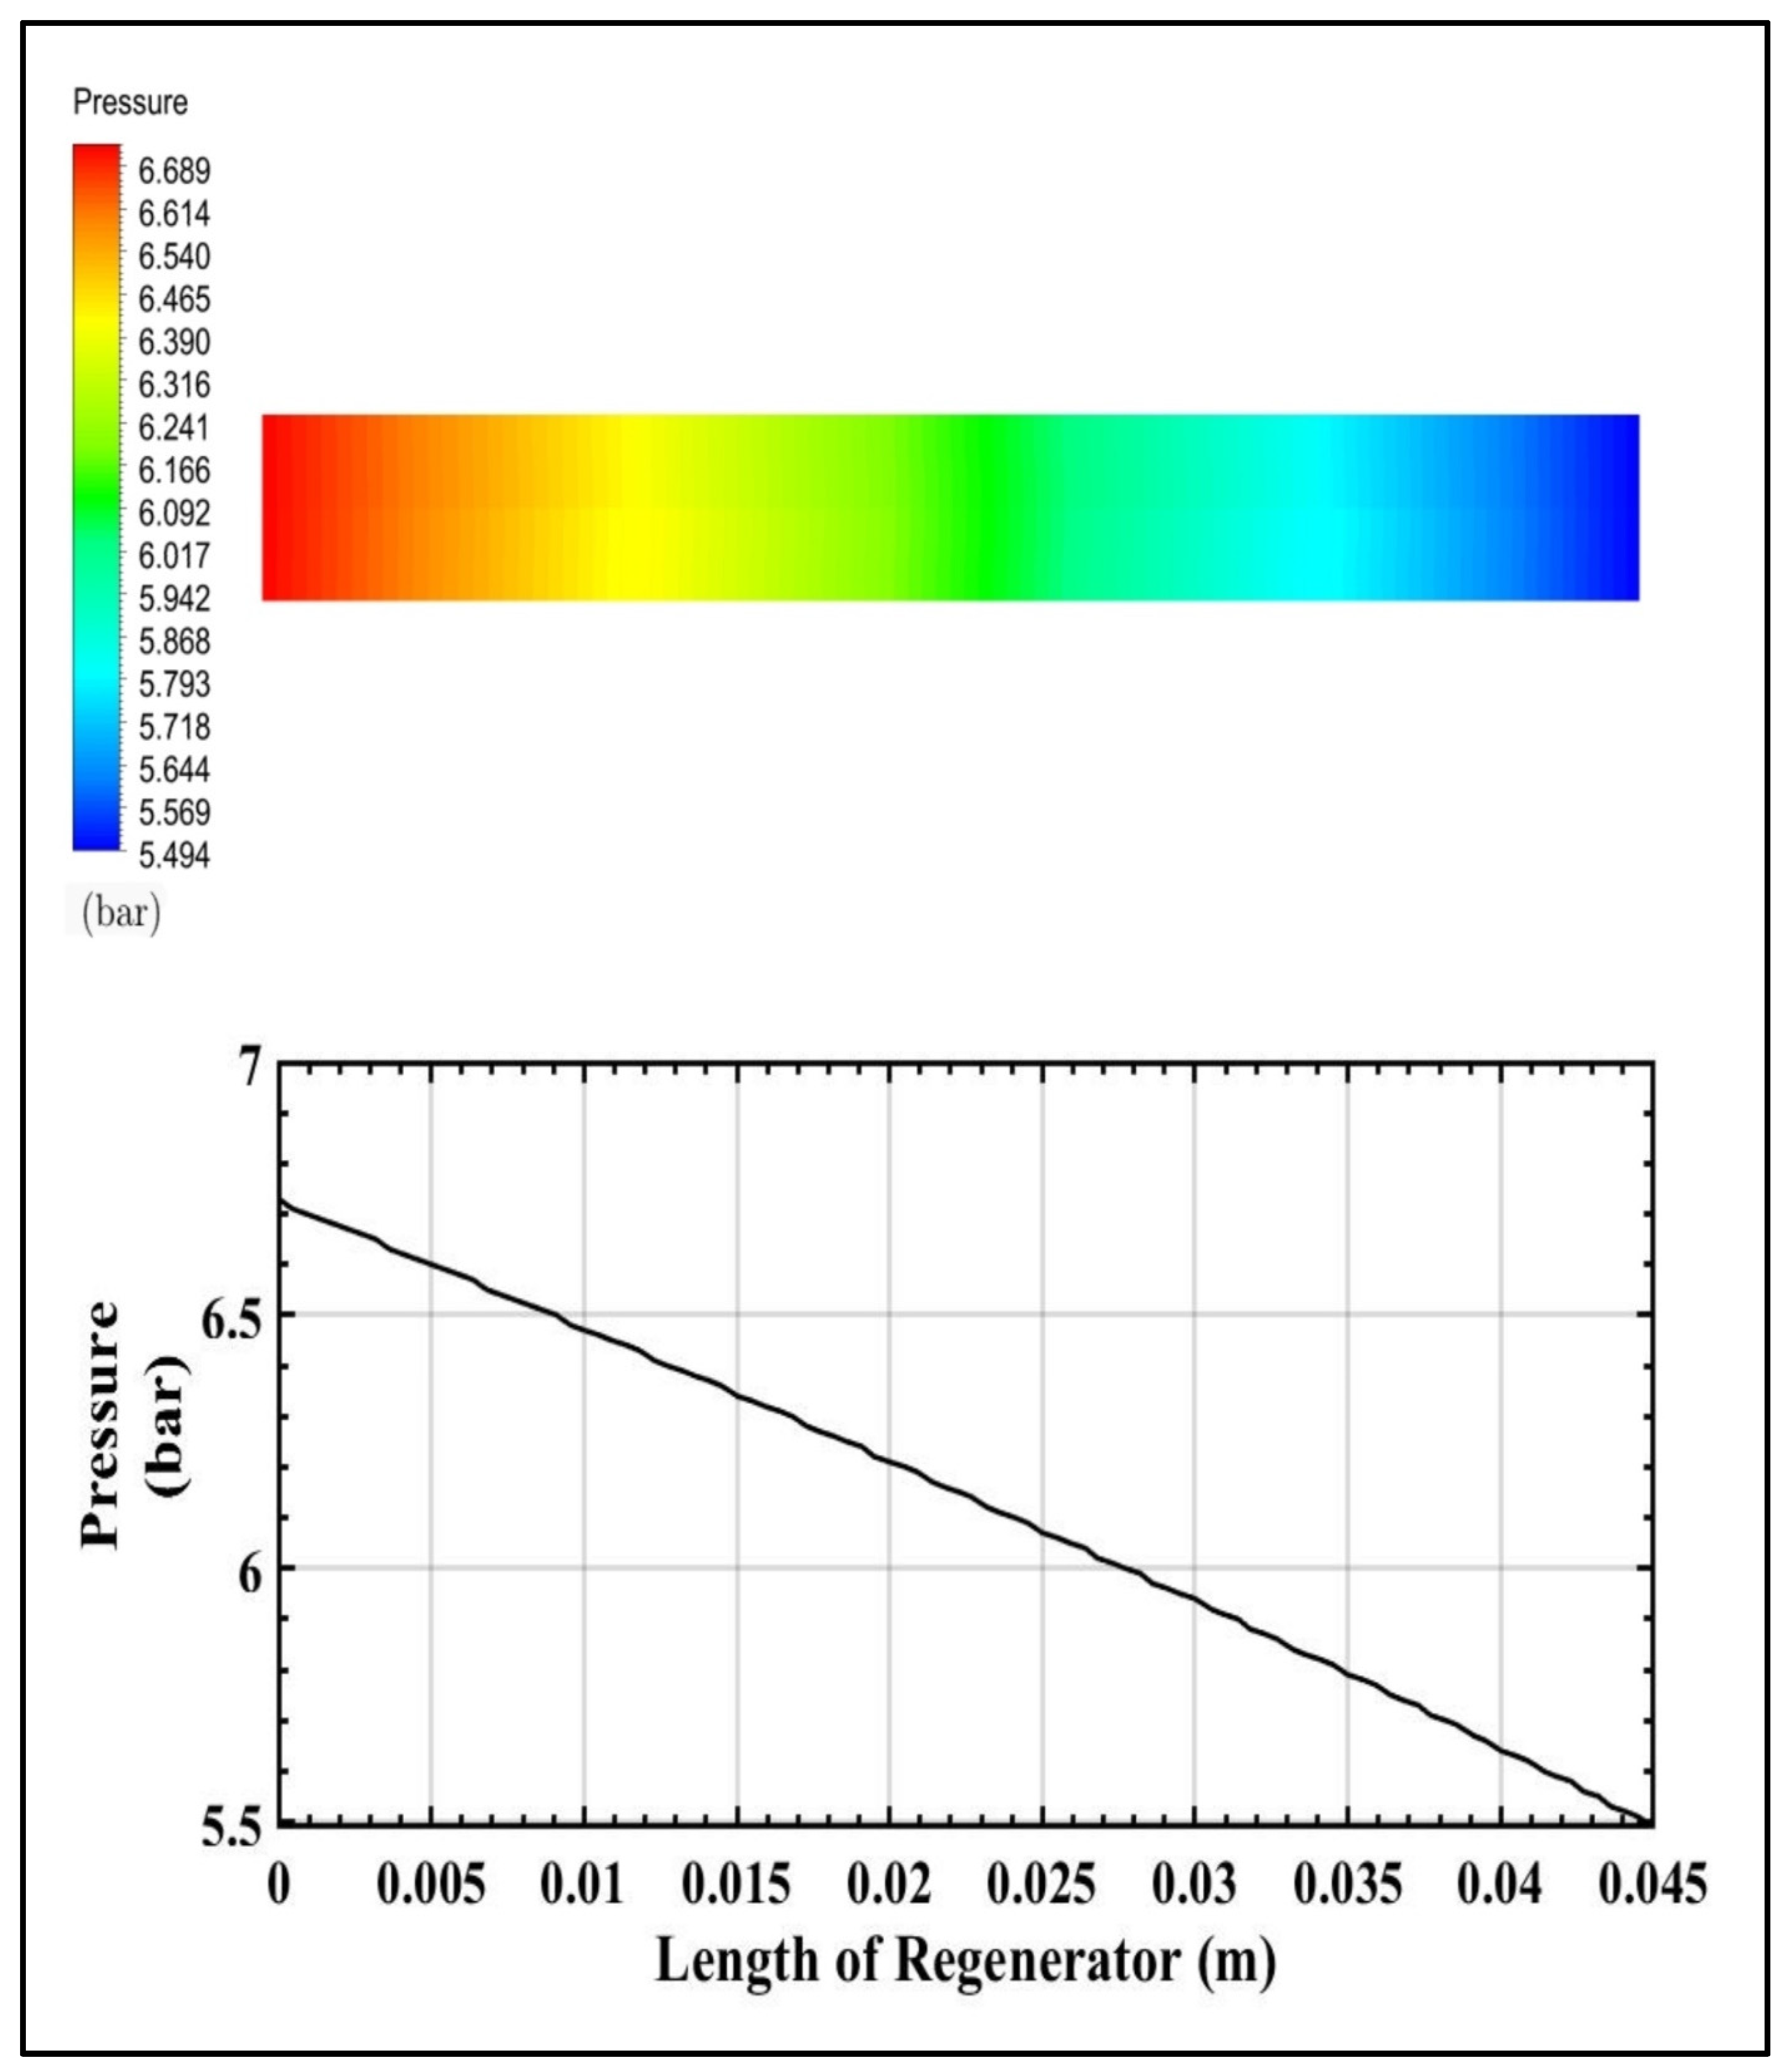
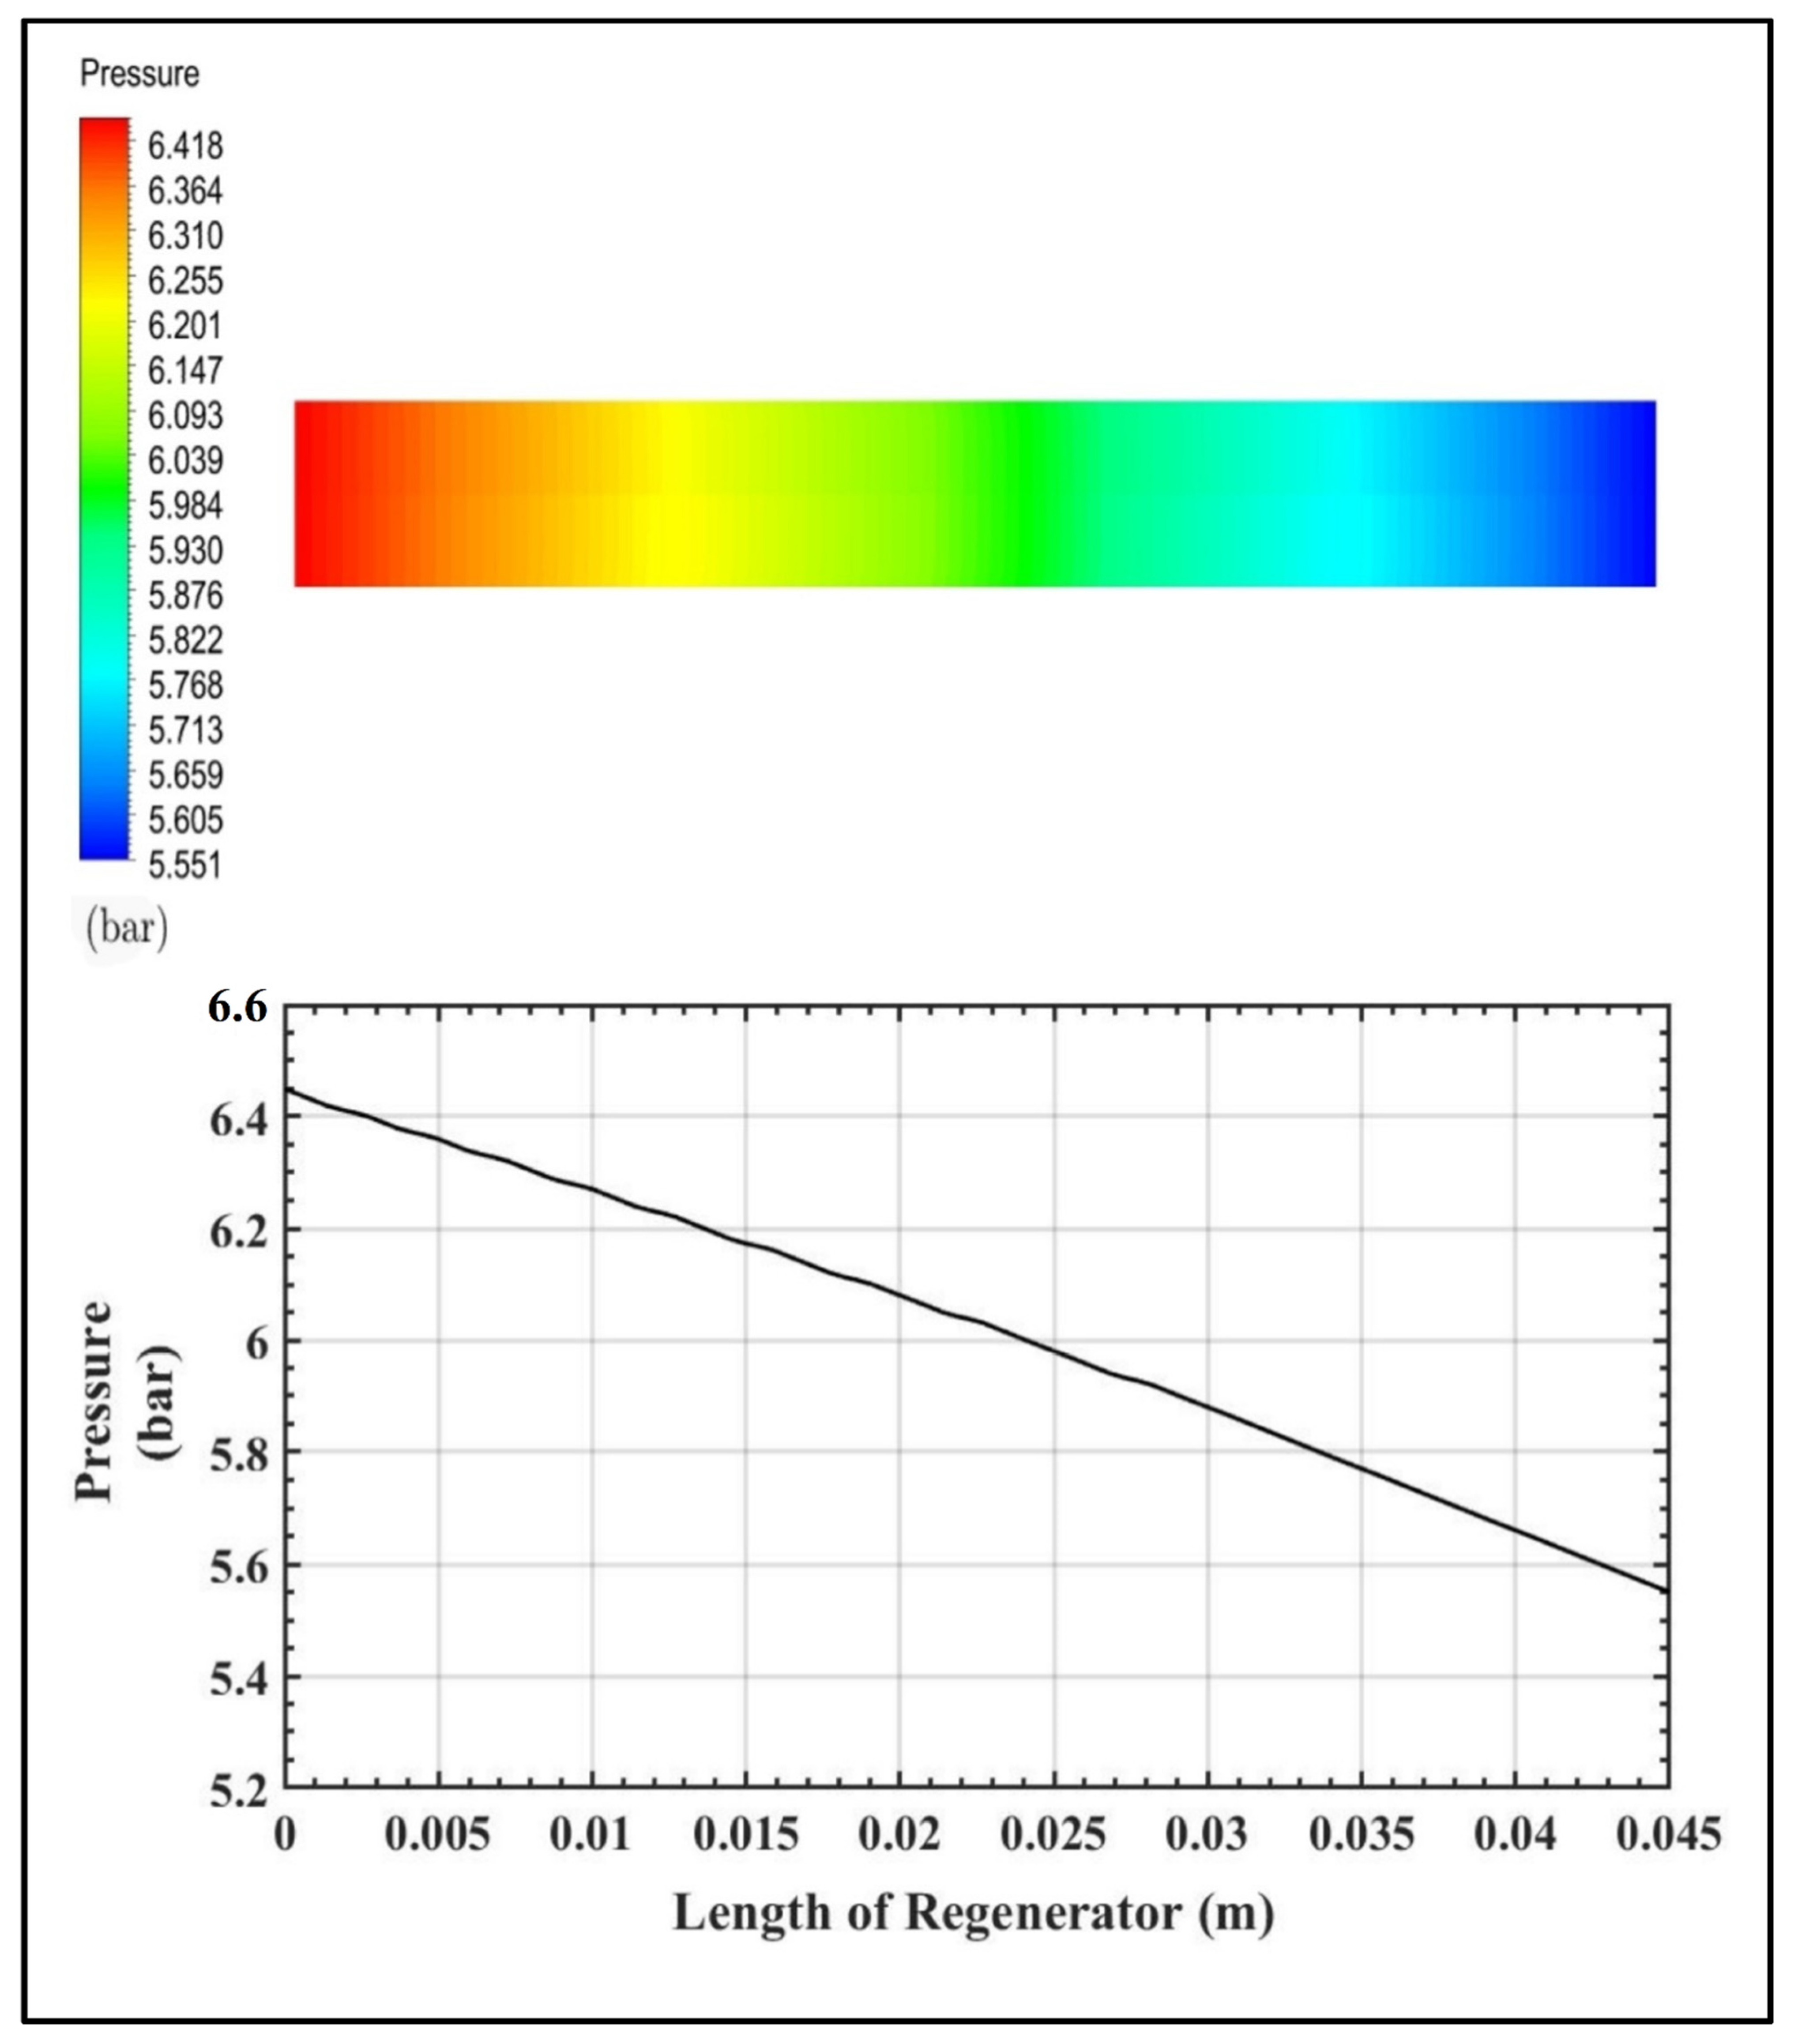
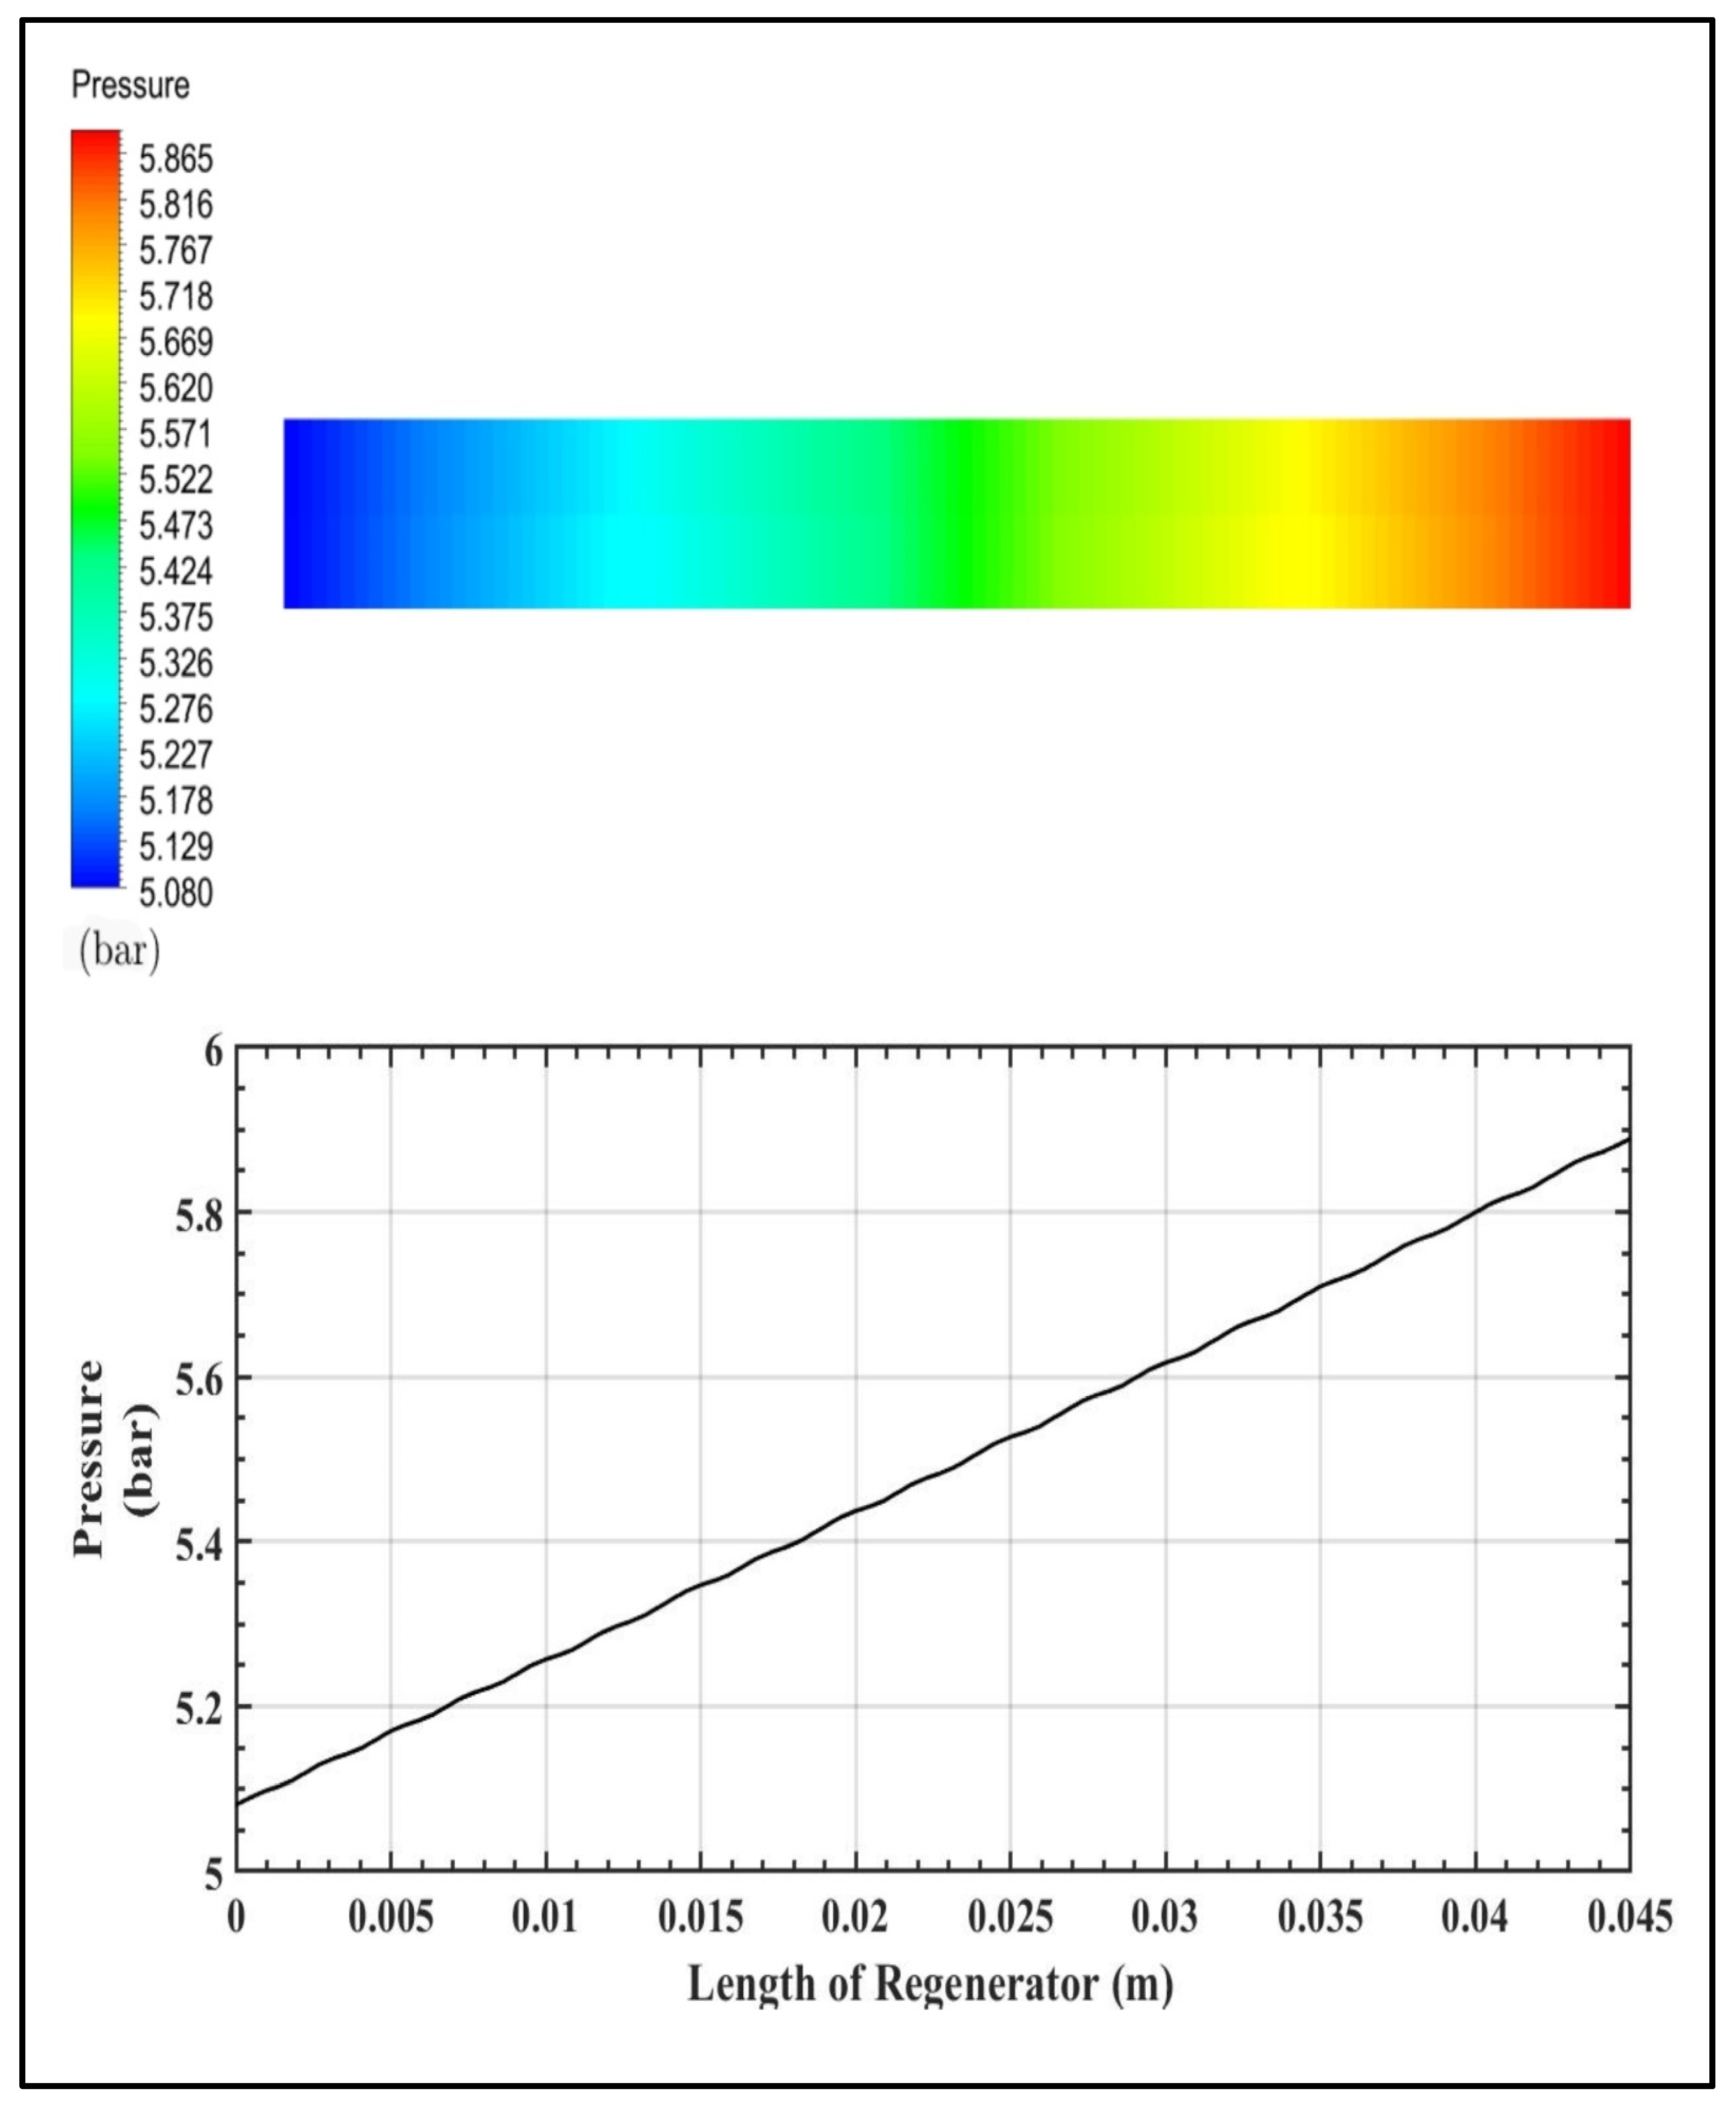
4.3. Pressure Variation Characteristics inside the Regenerator
4.4. Cause of Numerical Errors and Validity of Solution
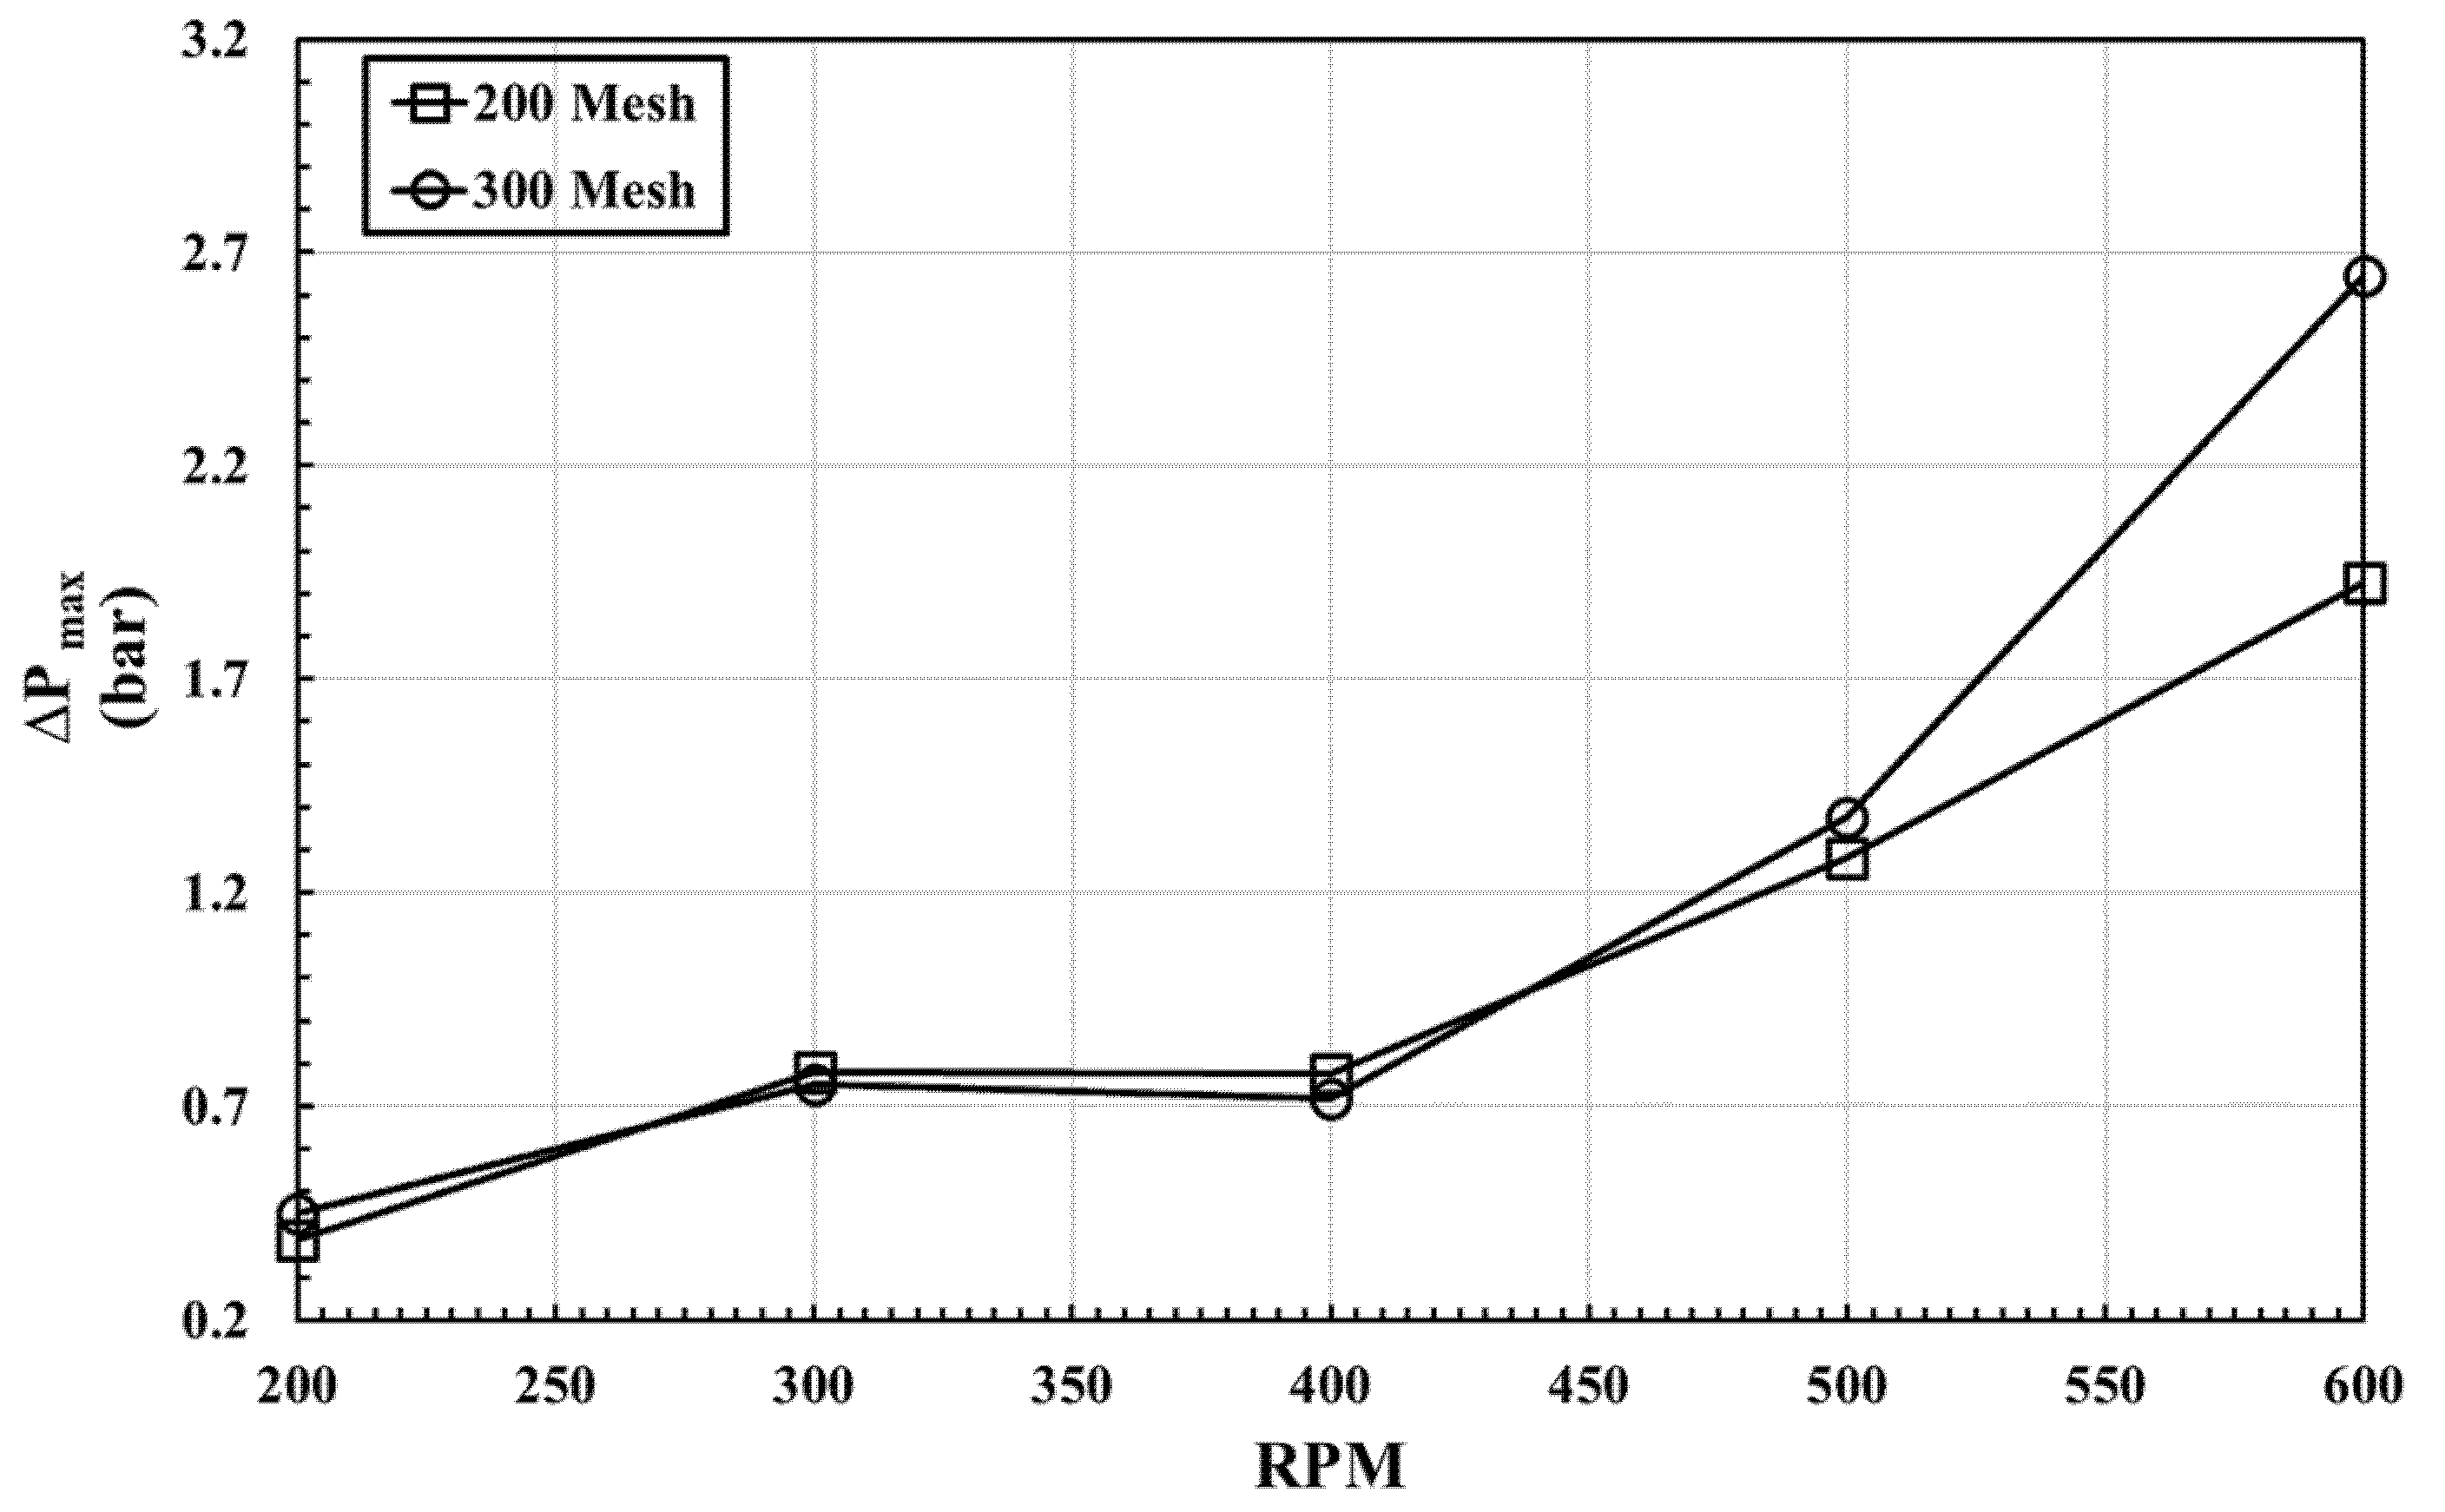
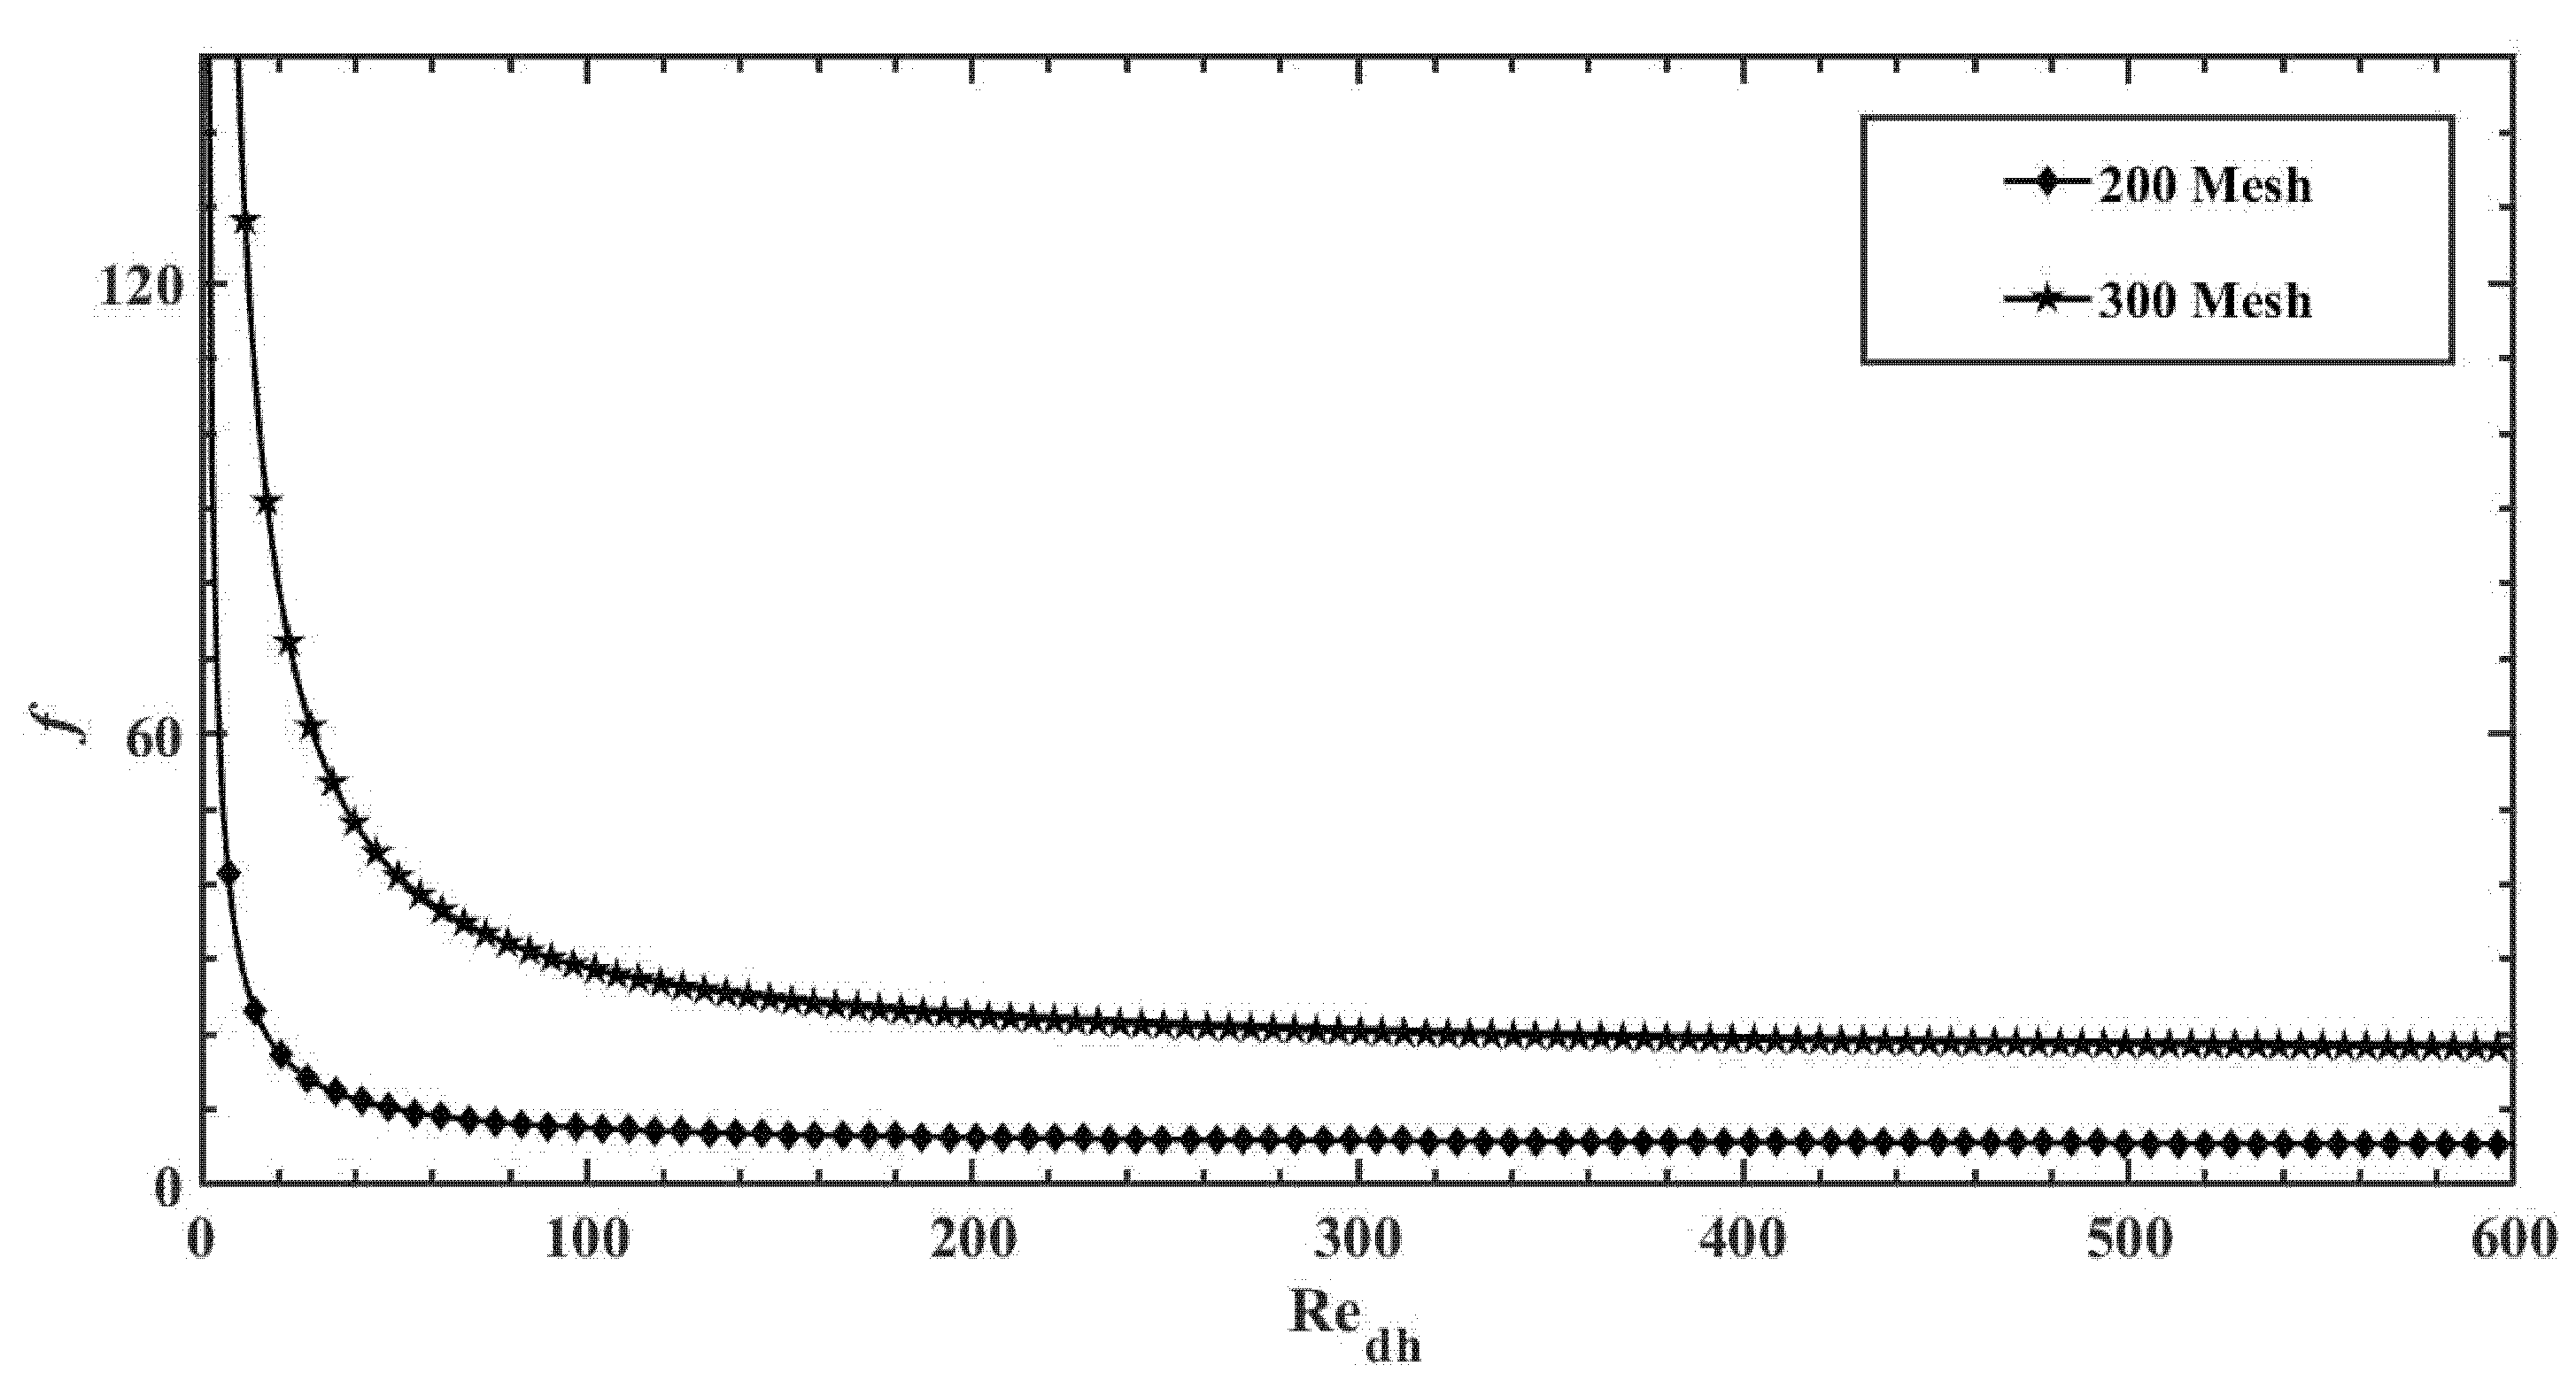
4.5. Friction Factor Characteristics
5. Conclusions
Author Contributions
Funding
Conflicts of Interest
References
- Davey, G.; Orlowska, A.H. Miniature Stirling Cycle Cooler. Cryogenics 1987, 27, 148–151. [Google Scholar] [CrossRef]
- Hsu, C.T.; Fu, H.; Cheng, P. On Pressure-Velocity Correlation of Steady and Oscillating Flows in Regenerators Made of Wire Screens. J. Fluids Eng. Trans. ASME 1999, 121, 52–56. [Google Scholar] [CrossRef]
- Guo, Z.; Kim, S.Y.; Sung, H.J. Pulsating Flow and Heat Transfer in a Pipe Partially Filled with a Porous Medium. Int. J. Heat Mass Transf. 1997, 40, 4209–4218. [Google Scholar] [CrossRef]
- Nam, K.; Jeong, S. Novel Flow Analysis of Regenerator under Oscillating Flow with Pulsating Pressure. Cryogenics 2005, 45, 368–379. [Google Scholar] [CrossRef]
- Choi, S.; Nam, K.; Jeong, S. Investigation on the Pressure Drop Characteristics of Cryocooler Regenerators under Oscillating Flow and Pulsating Pressure Conditions. Cryogenics 2004, 44, 203–210. [Google Scholar] [CrossRef]
- Nam, K.; Jeong, S. Investigation of Oscillating Flow Friction Factor for Cryocooler Regenerator Considering Cryogenic Temperature Effect. Cryogenics 2005, 45, 733–738. [Google Scholar] [CrossRef]
- Leong, K.C.; Jin, L.W. Characteristics of Oscillating Flow through a Channel Filled with Open-Cell Metal Foam. Int. J. Heat Fluid Flow 2006, 27, 144–153. [Google Scholar] [CrossRef]
- Radebaugh, R.; Huang, Y.; O’Gallagher, A.; Gary, J. Calculated Regenerator Performance at 4 K with Helium-4 and Helium-3. AIP Conf. Proc. 2008, 985, 225–234. [Google Scholar]
- Kim, S.M.; Ghiaasiaan, S.M. Numerical Modeling of Laminar Pulsating Flow in Porous Media. J. Fluids Eng. Trans. ASME 2009, 131, 0412031–0412039. [Google Scholar] [CrossRef]
- Tao, Y.B.; Liu, Y.W.; Gao, F.; Chen, X.Y.; He, Y.L. Numerical Analysis on Pressure Drop and Heat Transfer Performance of Mesh Regenerators Used in Cryocoolers. Cryogenics 2009, 49, 497–503. [Google Scholar] [CrossRef]
- Teitel, M. Using Computational Fluid Dynamics Simulations to Determine Pressure Drops on Woven Screens. Biosyst. Eng. 2010, 105, 172–179. [Google Scholar] [CrossRef]
- Miguel, A.F. Airflow through Porous Screens: From Theory to Practical Considerations. Energy Build. 1998, 28, 63–69. [Google Scholar] [CrossRef]
- Cheadle, M.J.; Nellis, G.F.; Klein, S.A. Regenerator Friction Factor and Nusselt Number Information Derived from CFD Analysis. Cryocoolers 2011, 16, 397–404. [Google Scholar]
- Costa, S.C.; Barrutia, H.; Esnaola, J.A.; Tutar, M. Numerical Study of the Pressure Drop Phenomena in Wound Woven Wire Matrix of a Stirling Regenerator. Energy Convers. Manag. 2013, 67, 57–65. [Google Scholar] [CrossRef]
- Costa, S.C.; Tutar, M.; Barreno, I.; Esnaola, J.A.; Barrutia, H.; García, D.; González, M.A.; Prieto, J.I. Experimental and Numerical Flow Investigation of Stirling Engine Regenerator. Energy 2014, 72, 800–812. [Google Scholar] [CrossRef]
- Costa, S.C.; Barreno, I.; Tutar, M.; Esnaola, J.A.; Barrutia, H. The Thermal Non-Equilibrium Porous Media Modelling for CFD Study of Woven Wire Matrix of a Stirling Regenerator. Energy Convers. Manag. 2015, 89, 473–483. [Google Scholar] [CrossRef]
- Trevizoli, P.V.; Peixer, G.F.; Barbosa, J.R. Thermal-Hydraulic Evaluation of Oscillating-Flow Regenerators Using Water: Experimental Analysis of Packed Beds of Spheres. Int. J. Heat Mass Transf. 2016, 99, 918–930. [Google Scholar] [CrossRef]
- Trevizoli, P.; Liu, Y.; Tura, A.; Rowe, A.; Barbosa, J. Experimental Assessment of the Thermal-Hydraulic Performance of Packed-Sphere Oscillating-Flow Regenerators Using Water. Exp. Therm. Fluid Sci. 2014, 57, 324–334. [Google Scholar] [CrossRef]
- Boroujerdi, A.A.; Esmaeili, M. Characterization of the Frictional Losses and Heat Transfer of Oscillatory Viscous Flow through Wire-Mesh Regenerators. Alex. Eng. J. 2015, 54, 787–794. [Google Scholar] [CrossRef] [Green Version]
- Sadrameli, S.M. Mathematical Models for the Simulation of Thermal Regenerators: A State-of-the-Art Review. Renew. Sustain. Energy Rev. 2016, 58, 462–476. [Google Scholar] [CrossRef]
- Poshtkouhian Badi, A.; Beheshti, H. Numerical Study of a Miniature Scale Pulse Tube Cryocooler: The Effects of Operating Conditions. Sci. Technol. Built Environ. 2016, 22, 619–627. [Google Scholar] [CrossRef]
- Alfarawi, S.; AL-Dadah, R.; Mahmoud, S. Potentiality of New Miniature-Channels Stirling Regenerator. Energy Convers. Manag. 2017, 133, 264–274. [Google Scholar] [CrossRef]
- Peng, W.; Xu, M.; Huai, X.; Liu, Z.; Lü, X. Performance Evaluation of Oscillating Flow Regenerators Filled with Particles, Wire Screens and High Porosity Open-Cell Foams. Appl. Therm. Eng. 2017, 112, 1612–1625. [Google Scholar] [CrossRef]
- Sowale, A.; Odofin, S. Regenerator Losses in a Free Piston Stirling Engine. In Proceedings of the 2016 International Conference on Leadership, Innovation and Entrepreneurship (ICLIE), Atlantis, United Arab Emirates, 20–22 April 2016; pp. 47–55. [Google Scholar]
- Mohammadi, M.A.; Jafarian, A. CFD Simulation to Investigate Hydrodynamics of Oscillating Flow in a Beta-Type Stirling Engine. Energy 2018, 153, 287–300. [Google Scholar] [CrossRef]
- Chen, Y.; Luo, E.; Dai, W. Heat Transfer Characteristics of Oscillating Flow Regenerator Filled with Circular Tubes or Parallel Plates. Cryogenics 2007, 47, 40–48. [Google Scholar] [CrossRef]
- Chi, C.; Mou, J.; Lin, M.; Hong, G. CFD Simulation and Investigation on the Operating Mechanism of a Beta-Type Free Piston Stirling Engine. Appl. Therm. Eng. 2020, 166, 114751. [Google Scholar] [CrossRef]
- İPCİ, D. Investigation on Hydrodynamic Characteristics of a Stirling Regenerator Matrix Using Porous Media Approach: A CFD Study. Int. J. Automot. Eng. Technol. 2020, 9, 171–177. [Google Scholar] [CrossRef]
- Jeong, S.; Nam, K.; Jung, J. Regenerator Characterization under Oscillating Flow and Pulsating Pressure. Cryocoolers 2003, 12, 531–537. [Google Scholar]
- Almtireen, N.; Brandner, J.J.; Korvink, J.G. Numerical Thermal Analysis and 2-D CFD Evaluation Model for an Ideal Cryogenic Regenerator. Micromachines 2020, 11, 361. [Google Scholar] [CrossRef] [Green Version]
- Miyabe, H.; Hamaguchi, K.; Takahashi, K. An Approach to the Design of Stirling Engine Regenerator Matrix Using Packs of Wire Gauzes. In Proceeding of the 17th Intersociety Energy Conversion Engineering Conference, Los Angeles, CA, USA, 8–12 August 1982. [Google Scholar]
- Tanaka, M.; Yamashita, I.; Chisaka, F. Flow and Heat Transfer Characteristics of Stirling Engine Regenerator in Oscillating Flow. Trans. Jpn. Soc. Mech. Eng. Ser. II 1990, 33, 283–289. [Google Scholar] [CrossRef] [Green Version]
- Zhao, T.S.; Cheng, P. Oscillatory Pressure Drops through a Woven-Screen Packed Column Subjected to a Cyclic Flow. Cryogenics 1996, 36, 333–341. [Google Scholar] [CrossRef]
- Gedeon, D.; Wood, J.G. Oscillating-Flow Regenerator Test Rig: Hardware and Theory with Derived Correlations for Screens and Felts; NASA-Lewis Contractor Report 198422; NTRS: Chicago, IL, USA, 1996.
- Pamuk, M.T.; Özdemir, M. Friction Factor, Permeability and Inertial Coefficient of Oscillating Flow through Porous Media of Packed Balls. Exp. Therm. Fluid Sci. 2012, 38, 134–139. [Google Scholar] [CrossRef]
- Xiao, G.; Peng, H.; Fan, H.; Sultan, U.; Ni, M. International Journal of Heat and Mass Transfer Characteristics of Steady and Oscillating Flows through Regenerator. Int. J. Heat Mass Transf. 2017, 108, 309–321. [Google Scholar] [CrossRef]
- Ni, M.; Peng, H.; Sultan, U.; Luo, K.; Xiao, G. A Quantitative Method to Describe the Flow Characteristics of an Oscillating Flow Including Porous Media. Int. J. Heat Mass Transf. 2018, 119, 860–866. [Google Scholar] [CrossRef]
- Ergun, S. Fluid Flow through Packed Columns. Chem. Eng. Prog. 1952, 48, 89–94. [Google Scholar]
- Subhankar, G.; Senthilkumar, S.; Dewanshu, D.; Bharanitharan, K.J. A Numerical Approach to Study the Steady State Heat Transfer Characteristics of an Annular Porous Heat Exchanger. In Proceedings of the IOP Conference Series: Materials Science and Engineering, Chennai, India, 16–17 September 2020; Volume 912, p. 042030. [Google Scholar]
- Das, M.K.; Mukherjee, P.P.; Muralidhar, K. Equations Governing Flow and Transport in Porous Media. In Modeling Transport Phenomena in Porous Media with Applications; Springer: Berlin/Heidelberg, Germany, 2018. [Google Scholar]
- Kandelousi, M.S.; Ganji, D.D. Flow and Heat Transfer in Porous Media. In Hydrothermal Analysis in Engineering Using Control Volume Finite Element Method; Elsevier: Amsterdam, The Netherlands, 2015; pp. 177–210. [Google Scholar]
- Versteeg, H.K.; Malalasekera, W. An Introduction to Computational Fluid Dynamics: The Finite Volume Method; Pearson Prentice Hall: London, UK, 2007. [Google Scholar]


| Author | Regenerator Matrix | Friction Factor | Validity | Comment |
|---|---|---|---|---|
| Miyabe et al., 1982 [31] | Woven screen | 0.586 < ϵ < 0.840 5 < Re < 1000 Fluid—N2 | Only applicable for steady flow | |
| Tanaka et al., 1990 [32] | Woven screen, sponge metal, and sintered metal | 0.645 < ϵ < 0.729 Fluid—Air | ||
| Zhao and Cheng 1996 [33] | Woven screen | 0.01 < < 0.13 0.602 < ϵ < 0.662 Fluid—Air | The friction factor for an oscillating flow is 4 to 5 times higher than that for a steady flow | |
| Gedeon and Wood 1996 [34] | Woven screen | 0.6232 < ϵ < 0.7102 Fluid—N2, He | No difference if Va < 20 | |
| Pamuk and Mustafa 2011 [35] | Packed balls | Increasing porosity reduces the maximum friction factor | ||
| Xiao et al., 2017 [36] | Woven screen | 0.665 < ϵ < 0.78 | Only applicable for this experiment range | |
| Mingjiang et al., 2017 [37] | Wire screen (100 mesh to 400 mesh) | denotes the cycle averaged friction factor | 0.00309 < < 0.220 3150 < < 13100 |
| No. of Mesh Screens | Wire Diameter () | Wire Center Pitch () | Porosity | Cross-Section Area (10−5 m2) | Hydraulic Diameter () | Outer Diameter (m) | Regenerator Length (m) |
|---|---|---|---|---|---|---|---|
| 200 | 39.07 | 125.031 | 0.7489 | 1.3927 | 73.37 | 0.005 | 0.045 |
| 300 | 40.70 | 85.339 | 0.5849 | 1.4598 | 78.92 | 0.005 | 0.045 |
| Mesh | |||||
|---|---|---|---|---|---|
| 200 | 39.07 | 0.7489 | 0.8218 | 2.345 × 10¹⁰ | 6.835 × 1004 |
| 300 | 40.70 | 0.5849 | 0.8727 | 1.022 × 10¹¹ | 2.043 × 1005 |
Publisher’s Note: MDPI stays neutral with regard to jurisdictional claims in published maps and institutional affiliations. |
© 2022 by the authors. Licensee MDPI, Basel, Switzerland. This article is an open access article distributed under the terms and conditions of the Creative Commons Attribution (CC BY) license (https://creativecommons.org/licenses/by/4.0/).
Share and Cite
Bharanitharan, K.J.; Senthilkumar, S.; Chen, K.-L.; Luo, K.-Y.; Kang, S.-W. Correlations Based on Numerical Validation of Oscillating Flow Regenerator. Processes 2022, 10, 1400. https://doi.org/10.3390/pr10071400
Bharanitharan KJ, Senthilkumar S, Chen K-L, Luo K-Y, Kang S-W. Correlations Based on Numerical Validation of Oscillating Flow Regenerator. Processes. 2022; 10(7):1400. https://doi.org/10.3390/pr10071400
Chicago/Turabian StyleBharanitharan, Kuruchanvalasu Jambulingam, Sundararaj Senthilkumar, Kuan-Lin Chen, Kuan-Yu Luo, and Shung-Wen Kang. 2022. "Correlations Based on Numerical Validation of Oscillating Flow Regenerator" Processes 10, no. 7: 1400. https://doi.org/10.3390/pr10071400