
Performance Identification of a Steam Boiler Burner via Acoustic Analysis


Abstract
:1. Introduction
2. Materials and Methods
Experimental Setup
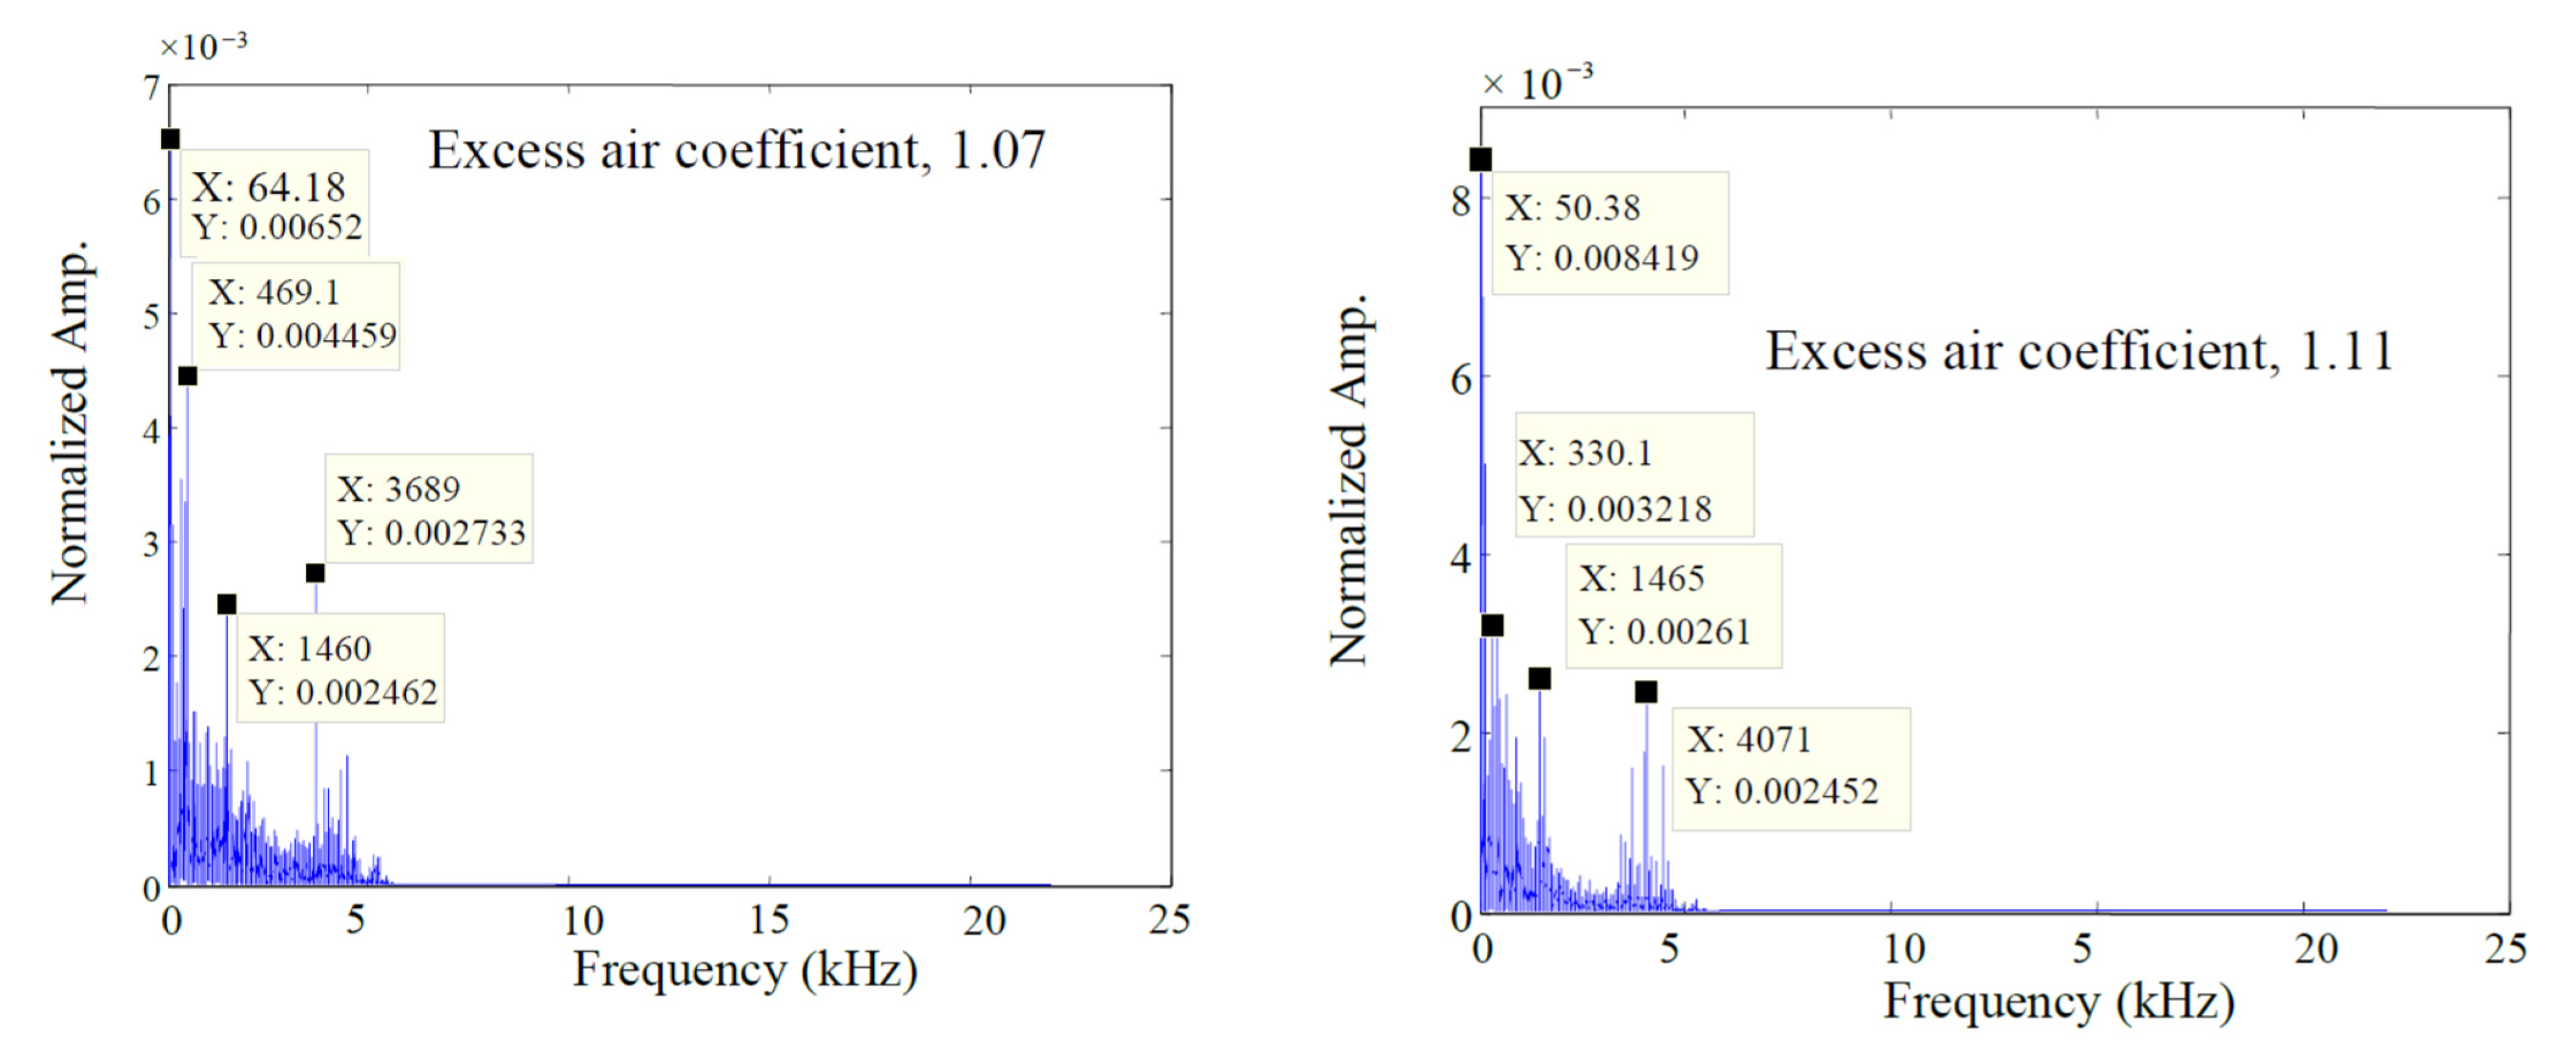
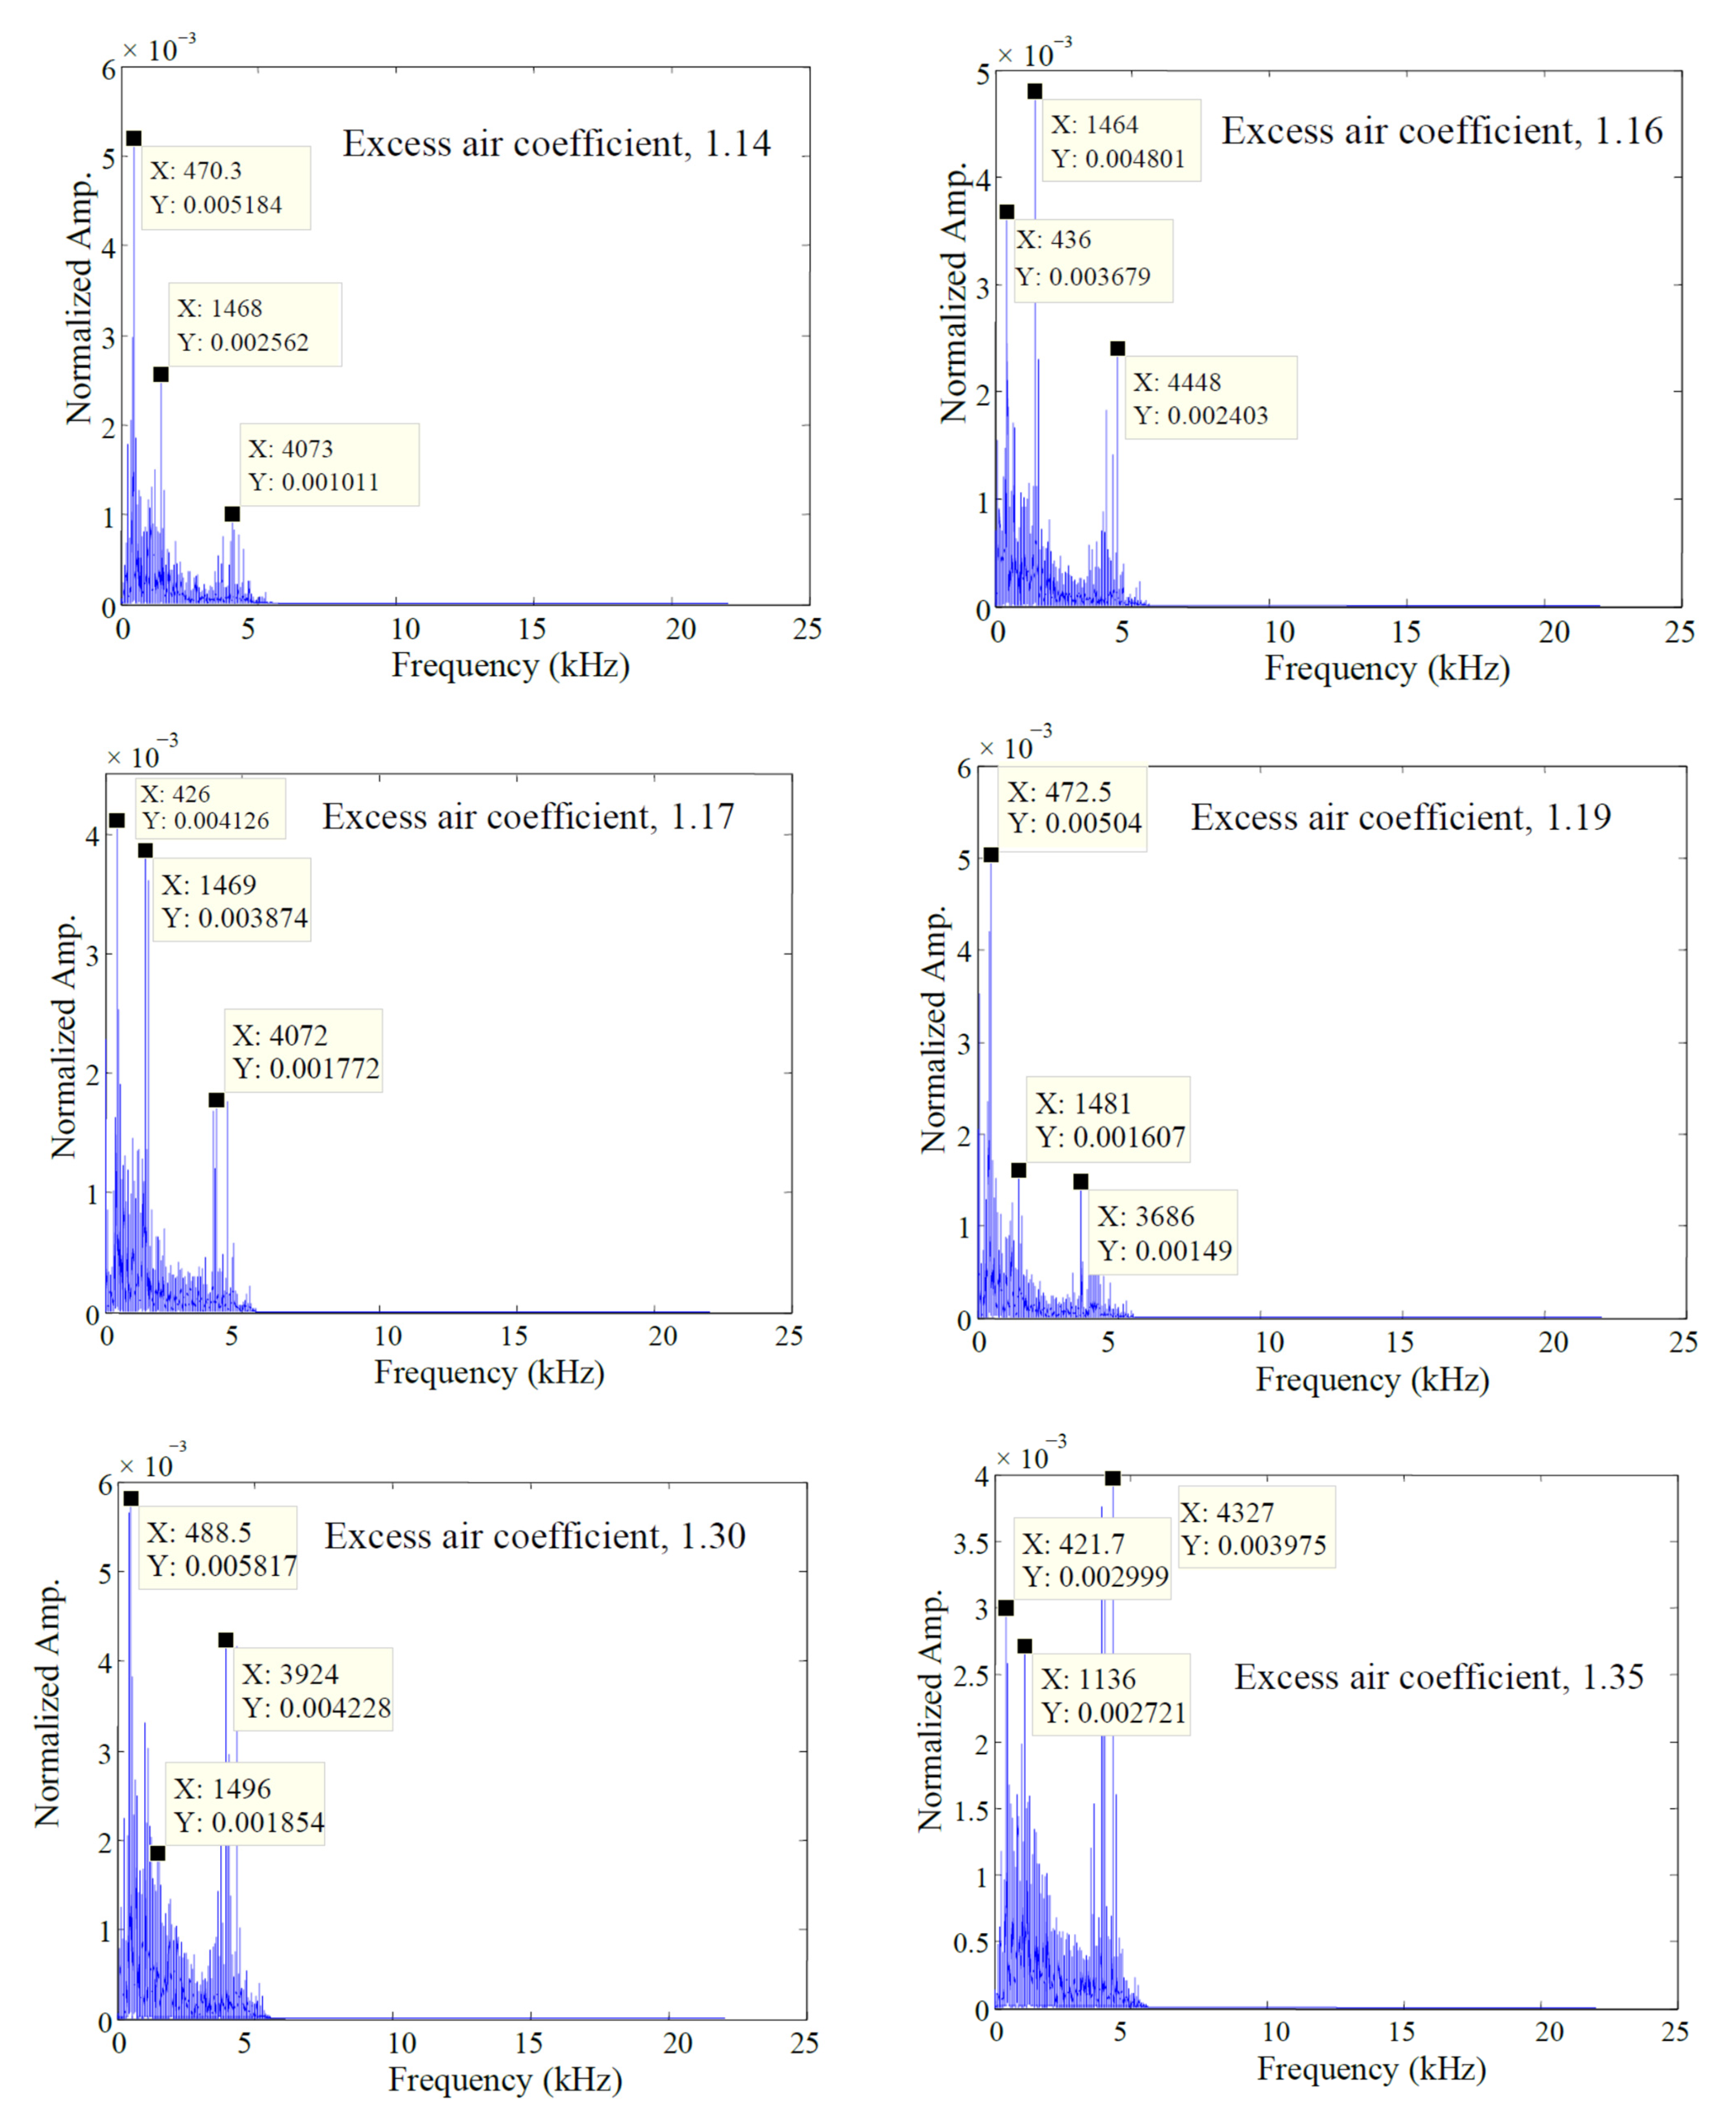
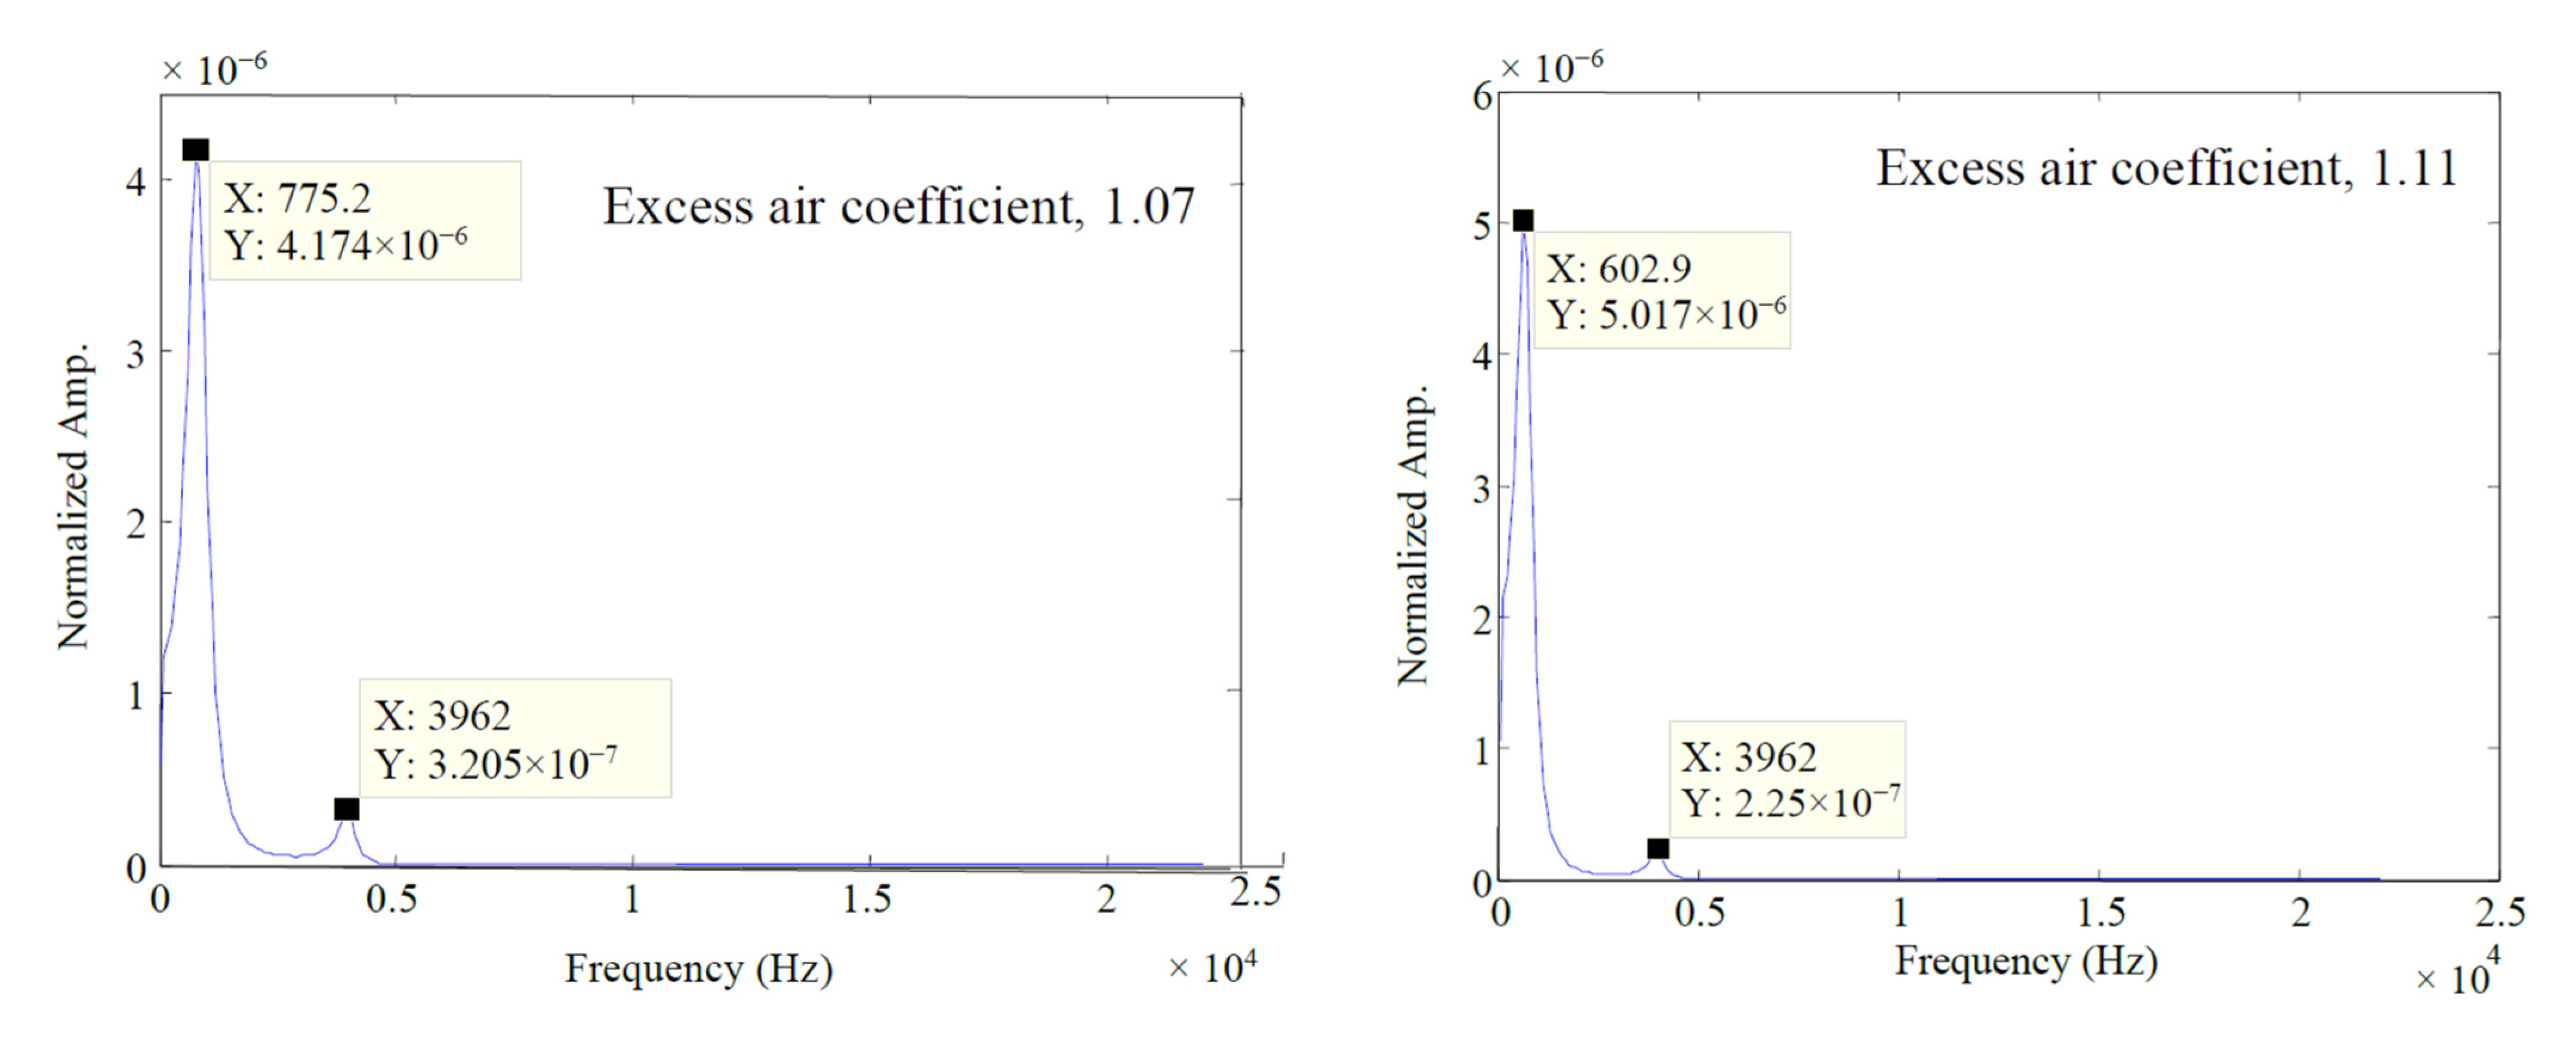
3. Results
4. Discussion
5. Conclusions
Author Contributions
Funding
Institutional Review Board Statement
Informed Consent Statement
Data Availability Statement
Conflicts of Interest
Nomenclature
| Time series | |
| Fourier transform | |
| Sampling frequency | |
| Frequency | |
| Angular frequency | |
| Autocorrelation function |
References
- Wang, X.; Makis, V. Autoregressive model-based gear shaft fault diagnosis using the Kolmogorov–Smirnov test. J. Sound Vib. 2009, 327, 413–423. [Google Scholar] [CrossRef]
- Ettefagh, M.M.; Sadeghi, M.H.; Rezaee, M.; Chitsaz, S. Latent component-based gear tooth fault detection filter using advanced parametric modeling. Mech. Syst. Signal Process. 2009, 23, 2260–2286. [Google Scholar] [CrossRef]
- Ettefagh, M.M.; Sadeghi, M.H.; Rezaee, M.; Khoshbakhti, R.; Akbarpour, R. Application of a new parametric model-based filter to knock intensity measurement. Measurement 2010, 43, 353–362. [Google Scholar] [CrossRef]
- Kar, C.; Mohanty, A.R. Multistage gearbox condition monitoring using motor current signature analysis and Kolmogorov–Smirnov test. J. Sound Vib. 2006, 290, 337–368. [Google Scholar] [CrossRef]
- Sun, X.; Chen, T.; Marquez, H.J. Efficient model-based leak detection in boiler steam-water systems. Comput. Chem. Eng. 2002, 26, 1643–1647. [Google Scholar] [CrossRef] [Green Version]
- Sun, X.; Marquez, H.J.; Chen, T.; Riaz, M. An improved PCA method with application to boiler leak detection. ISA Trans. 2005, 44, 379–397. [Google Scholar] [CrossRef]
- Özdemir, L. Performance Identification of Steam Heating Systems by Acoustic Analyses. Master’s Thesis, Akdeniz University, Antalya, Turkey, 2013. [Google Scholar]
- Chen, W.; Jin, D.; Cui, W.; Huang, S. Characteristics of gliding arc plasma and its application in swirl flame static instability control. Processes 2020, 8, 684. [Google Scholar] [CrossRef]
- Elattar, H.F.; Specht, E.; Fouda, A.; Rubaiee, S.; Al-Zahrani, A.; Nada, S.A. Swirled Jet Flame Simulation and Flow Visualization Inside Rotary Kiln—CFD with PDF Approach. Processes 2020, 8, 159. [Google Scholar] [CrossRef] [Green Version]
- Gangisetty, G.; Jayachandran, A.T.; Sverbilov, V.Y.; Zubrilin, I.; Matveev, S. Review paper on thermo-acoustic instabilities in a gas turbine burners–Flashback avoidance. J. Phys. Conf. Ser. 2019, 1276, 012051. [Google Scholar] [CrossRef] [Green Version]
- Beita, J.; Talibi, M.; Sadasivuni, S.; Balachandran, R. Thermoacoustic Instability Considerations for High Hydrogen Combustion in Lean Premixed Gas Turbine Combustors: A Review. Hydrogen 2021, 2, 33–57. [Google Scholar] [CrossRef]
- Hou, S.-S.; Chung, D.-H.; Lin, T.-H. Experimental and numerical investigation of jet flow and flames with acoustic modulation. Int. J. Heat Mass Transf. 2015, 83, 562–574. [Google Scholar] [CrossRef]
- Kraus, C.; Harth, S.; Bockhorn, H. Experimental investigation of combustion instabilities in lean swirl-stabilized partially-premixed flames in single- and multiple-burner setup. Int. J. Spray Combust. Dyn. 2016, 8, 4–26. [Google Scholar] [CrossRef] [Green Version]
- Laera, D.; Camporeale, S.M. A Weakly Nonlinear Approach Based on a Distributed Flame Describing Function to Study the Combustion Dynamics of a Full-Scale Lean-Premixed Swirled Burner. J. Eng. Gas Turbines Power 2017, 139, 091501. [Google Scholar] [CrossRef]
- Berger, F.M.; Hummel, T.; Hertweck, M.; Kaufmann, J.; Schuermans, B.; Sattelmayer, T. High-Frequency Thermoacoustic Modulation Mechanisms in Swirl-Stabilized Gas Turbine Combustors—Part I: Experimental Investigation of Local Flame Response. J. Eng. Gas Turbines Power 2017, 139, 071501. [Google Scholar] [CrossRef]
- Weng, F.; Li, S.; Zhong, D.; Zhu, M. Investigation of self-sustained beating oscillations in a Rijke burner. Combust. Flame 2016, 166, 181–191. [Google Scholar] [CrossRef]
- Kim, D.; Park, Y.; You, D.; Huh, K.Y. Analysis of thermoacoustic instability with corresponding eigenfrequencies in a large scale industrial oil furnace. J. Mech. Sci. Technol. 2016, 30, 4979–4988. [Google Scholar] [CrossRef]
- Kraus, C.; Selle, L.; Poinsot, T.; Arndt, C.M.; Bockhorn, H. Influence of Heat Transfer and Material Temperature on Combustion Instabilities in a Swirl Burner. J. Eng. Gas Turbines Power 2017, 139, 051503. [Google Scholar] [CrossRef] [Green Version]
- Grimm, F.; Ohno, D.; Noll, B.; Aigner, M.; Ewert, R.; Dierke, J. Broadband Combustion Noise Simulation of the PRECCINSTA Burner Based on Stochastic Sound Sources. J. Eng. Gas Turbines Power 2017, 139, 011505. [Google Scholar] [CrossRef] [Green Version]
- Bothien, M.R.; Noiray, N.; Schuermans, B. Analysis of Azimuthal Thermo-acoustic Modes in Annular Gas Turbine Combustion Chambers. J. Eng. Gas Turbines Power 2015, 137, 061505. [Google Scholar] [CrossRef]
- Yang, F.; Guo, Z.; Fu, X.; Yu, D. Computation of acoustic transfer matrices of swirl burner with finite element and acoustic network method. J. Low Freq. Noise Vib. Act. Control 2015, 34, 169–184. [Google Scholar] [CrossRef] [Green Version]
- Song, H.; Lin, Y.; Han, X.; Yang, D.; Zhang, C.; Sung, C.-J. The thermoacoustic instability in a stratified swirl burner and its passive control by using a slope confinement. Energy 2020, 195, 116956. [Google Scholar] [CrossRef]
- Vicuña, C.M.; Höweler, C. A method for reduction of Acoustic Emission (AE) data with application in machine failure detection and diagnosis. Mech. Syst. Signal Process. 2017, 97, 44–58. [Google Scholar] [CrossRef]
- Baofu, L.; Upadhyaya, B.R.; Perez, R.B. Structural integrity monitoring of steam generator tubing using transient acoustic signal analysis. IEEE Trans. Nucl. Sci. 2005, 52, 484–493. [Google Scholar] [CrossRef]
- Ramezani, M.G.; Hasanian, M.; Golchinfar, B.; Saboonchi, H.; Zonta, D.; Huang, H. Automatic boiler tube leak detection with deep bidirectional LSTM neural networks of acoustic emission signals. In Proceedings of the Sensors and Smart Structures Technologies for Civil, Mechanical, and Aerospace Systems, Online Only, 27 April–9 May 2020. [Google Scholar]
- Duong, B.P.; Kim, J.; Kim, C.-H.; Kim, J.-M. Deep Learning Object-Impulse Detection for Enhancing Leakage Detection of a Boiler Tube Using Acoustic Emission Signal. Appl. Sci. 2019, 9, 4368. [Google Scholar] [CrossRef] [Green Version]
- Zhang, S.; Shen, G.; An, L. Leakage location on water-cooling wall in power plant boiler based on acoustic array and a spherical interpolation algorithm. Appl. Therm. Eng. 2019, 152, 551–558. [Google Scholar] [CrossRef]
- Şeker, M.; Tokmakçi, M.; Asyali, M.H.; Seğmen, H. Examining EEG signals with parametric and non-parametric analyses methods in migraine patients during pregnancy. In Proceedings of the 2010 15th National Biomedical Engineering Meeting, Antalya, Turkey, 21–24 April 2010; IEEE: Piscataway Township, NJ, USA, 2010; pp. 1–4. [Google Scholar]
- Stoica, P.; Moses, R.L. Spectral Analysis of Signals; Prentice Hall: Hoboken, NJ, USA, 2005. [Google Scholar]


| Measurement | 1 | 2 | 3 | 4 | 5 | 6 | 7 | 8 |
|---|---|---|---|---|---|---|---|---|
| λ | 1.07 | 1.11 | 1.14 | 1.16 | 1.17 | 1.19 | 1.30 | 1.35 |
| O2% | 1.3 | 2.0 | 2.5 | 2.9 | 3.1 | 3.3 | 4.8 | 5.5 |
| CO2% | 11.26 | 10.86 | 10.57 | 10.34 | 10.23 | 10.11 | 9.26 | 8.86 |
| CO% | 199 | 81 | 14 | 7 | 4 | 5 | 0 | 0 |
| Efficiency % | 93.8 | 93.8 | 93.6 | 93.5 | 93.4 | 93.5 | 93.0 | 92.6 |
| Measurement | 1 | 2 | 3 | 4 | 5 | 6 | 7 | 8 |
|---|---|---|---|---|---|---|---|---|
| λ | 1.07 | 1.11 | 1.14 | 1.16 | 1.17 | 1.19 | 1.30 | 1.35 |
| x1 | 775.1 | 602.9 | 689.1 | 1034.0 | 947.5 | 516.8 | 947.5 | 1120.0 |
| x2 | 3962 | 3962 | 3704 | 3962 | 3962 | 3962 | 4048 | 4048 |
| y1/y2 | 13.02 | 22.29 | 22.77 | 14.87 | 2.25 | 2.84 | 8.55 | 4.28 |
Publisher’s Note: MDPI stays neutral with regard to jurisdictional claims in published maps and institutional affiliations. |
© 2022 by the authors. Licensee MDPI, Basel, Switzerland. This article is an open access article distributed under the terms and conditions of the Creative Commons Attribution (CC BY) license (https://creativecommons.org/licenses/by/4.0/).
Share and Cite
Kurşun, K.; Özdemir, L.; Ersoy, H. Performance Identification of a Steam Boiler Burner via Acoustic Analysis. Processes 2022, 10, 1223. https://doi.org/10.3390/pr10061223
Kurşun K, Özdemir L, Ersoy H. Performance Identification of a Steam Boiler Burner via Acoustic Analysis. Processes. 2022; 10(6):1223. https://doi.org/10.3390/pr10061223
Chicago/Turabian StyleKurşun, Kayra, Levent Özdemir, and Hakan Ersoy. 2022. "Performance Identification of a Steam Boiler Burner via Acoustic Analysis" Processes 10, no. 6: 1223. https://doi.org/10.3390/pr10061223