
Thermochemical Analysis of a Packed-Bed Reactor Using Finite Elements with FlexPDE and COMSOL Multiphysics

 ,
,  , , and
Abstract
: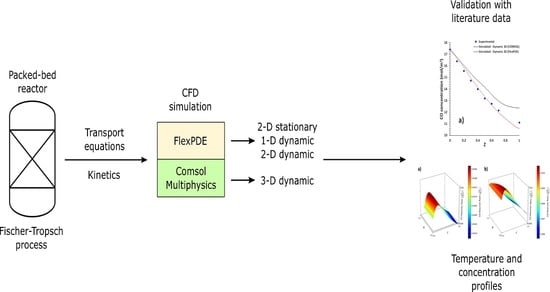
1. Introduction
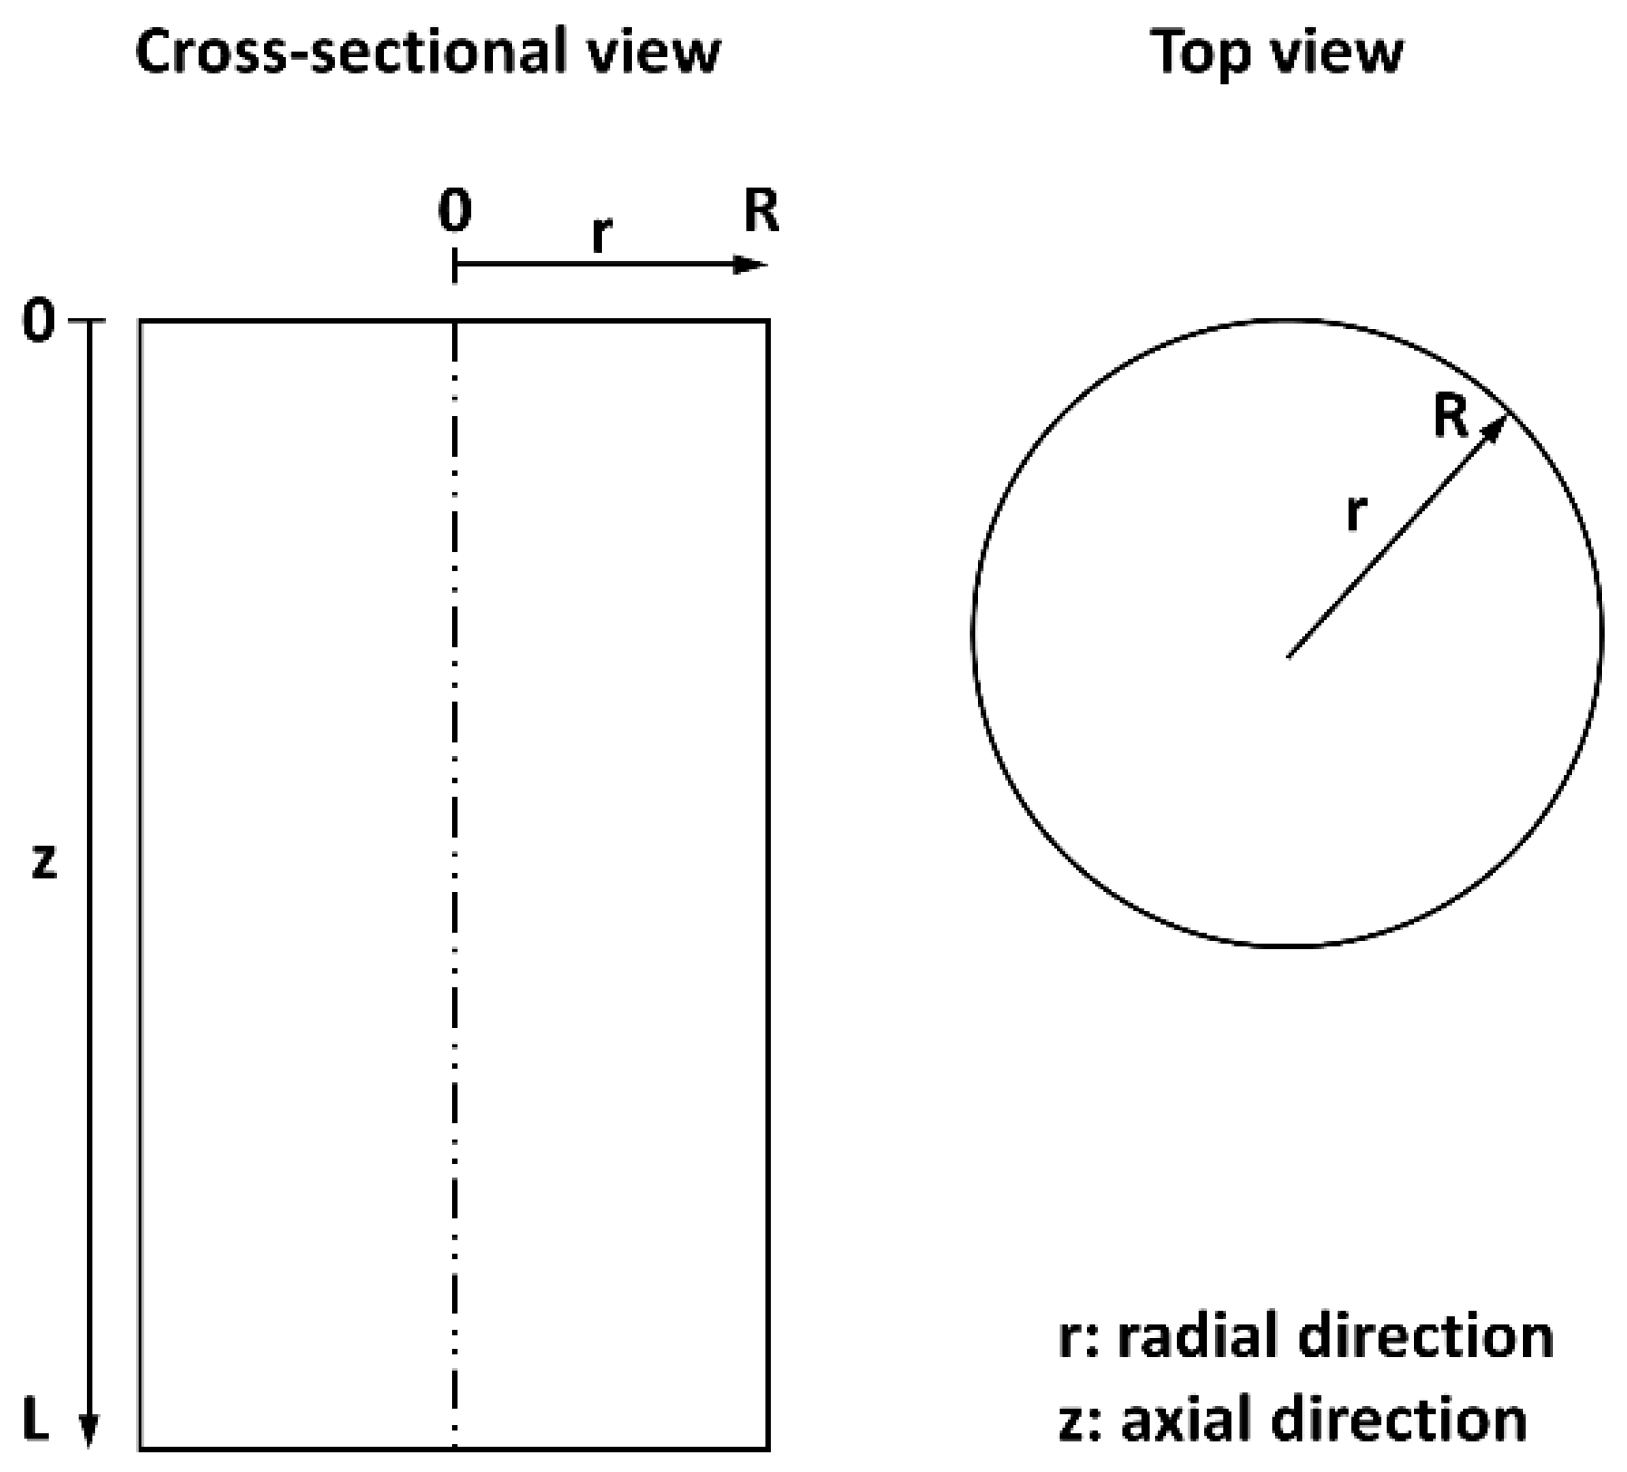
2. Model Description
2.1. 2-D Stationary Model
2.2. 1-D Dynamic Model
2.3. 2-D Dynamic Model
2.4. 3-D Dynamic Model
3. Results and Discussion
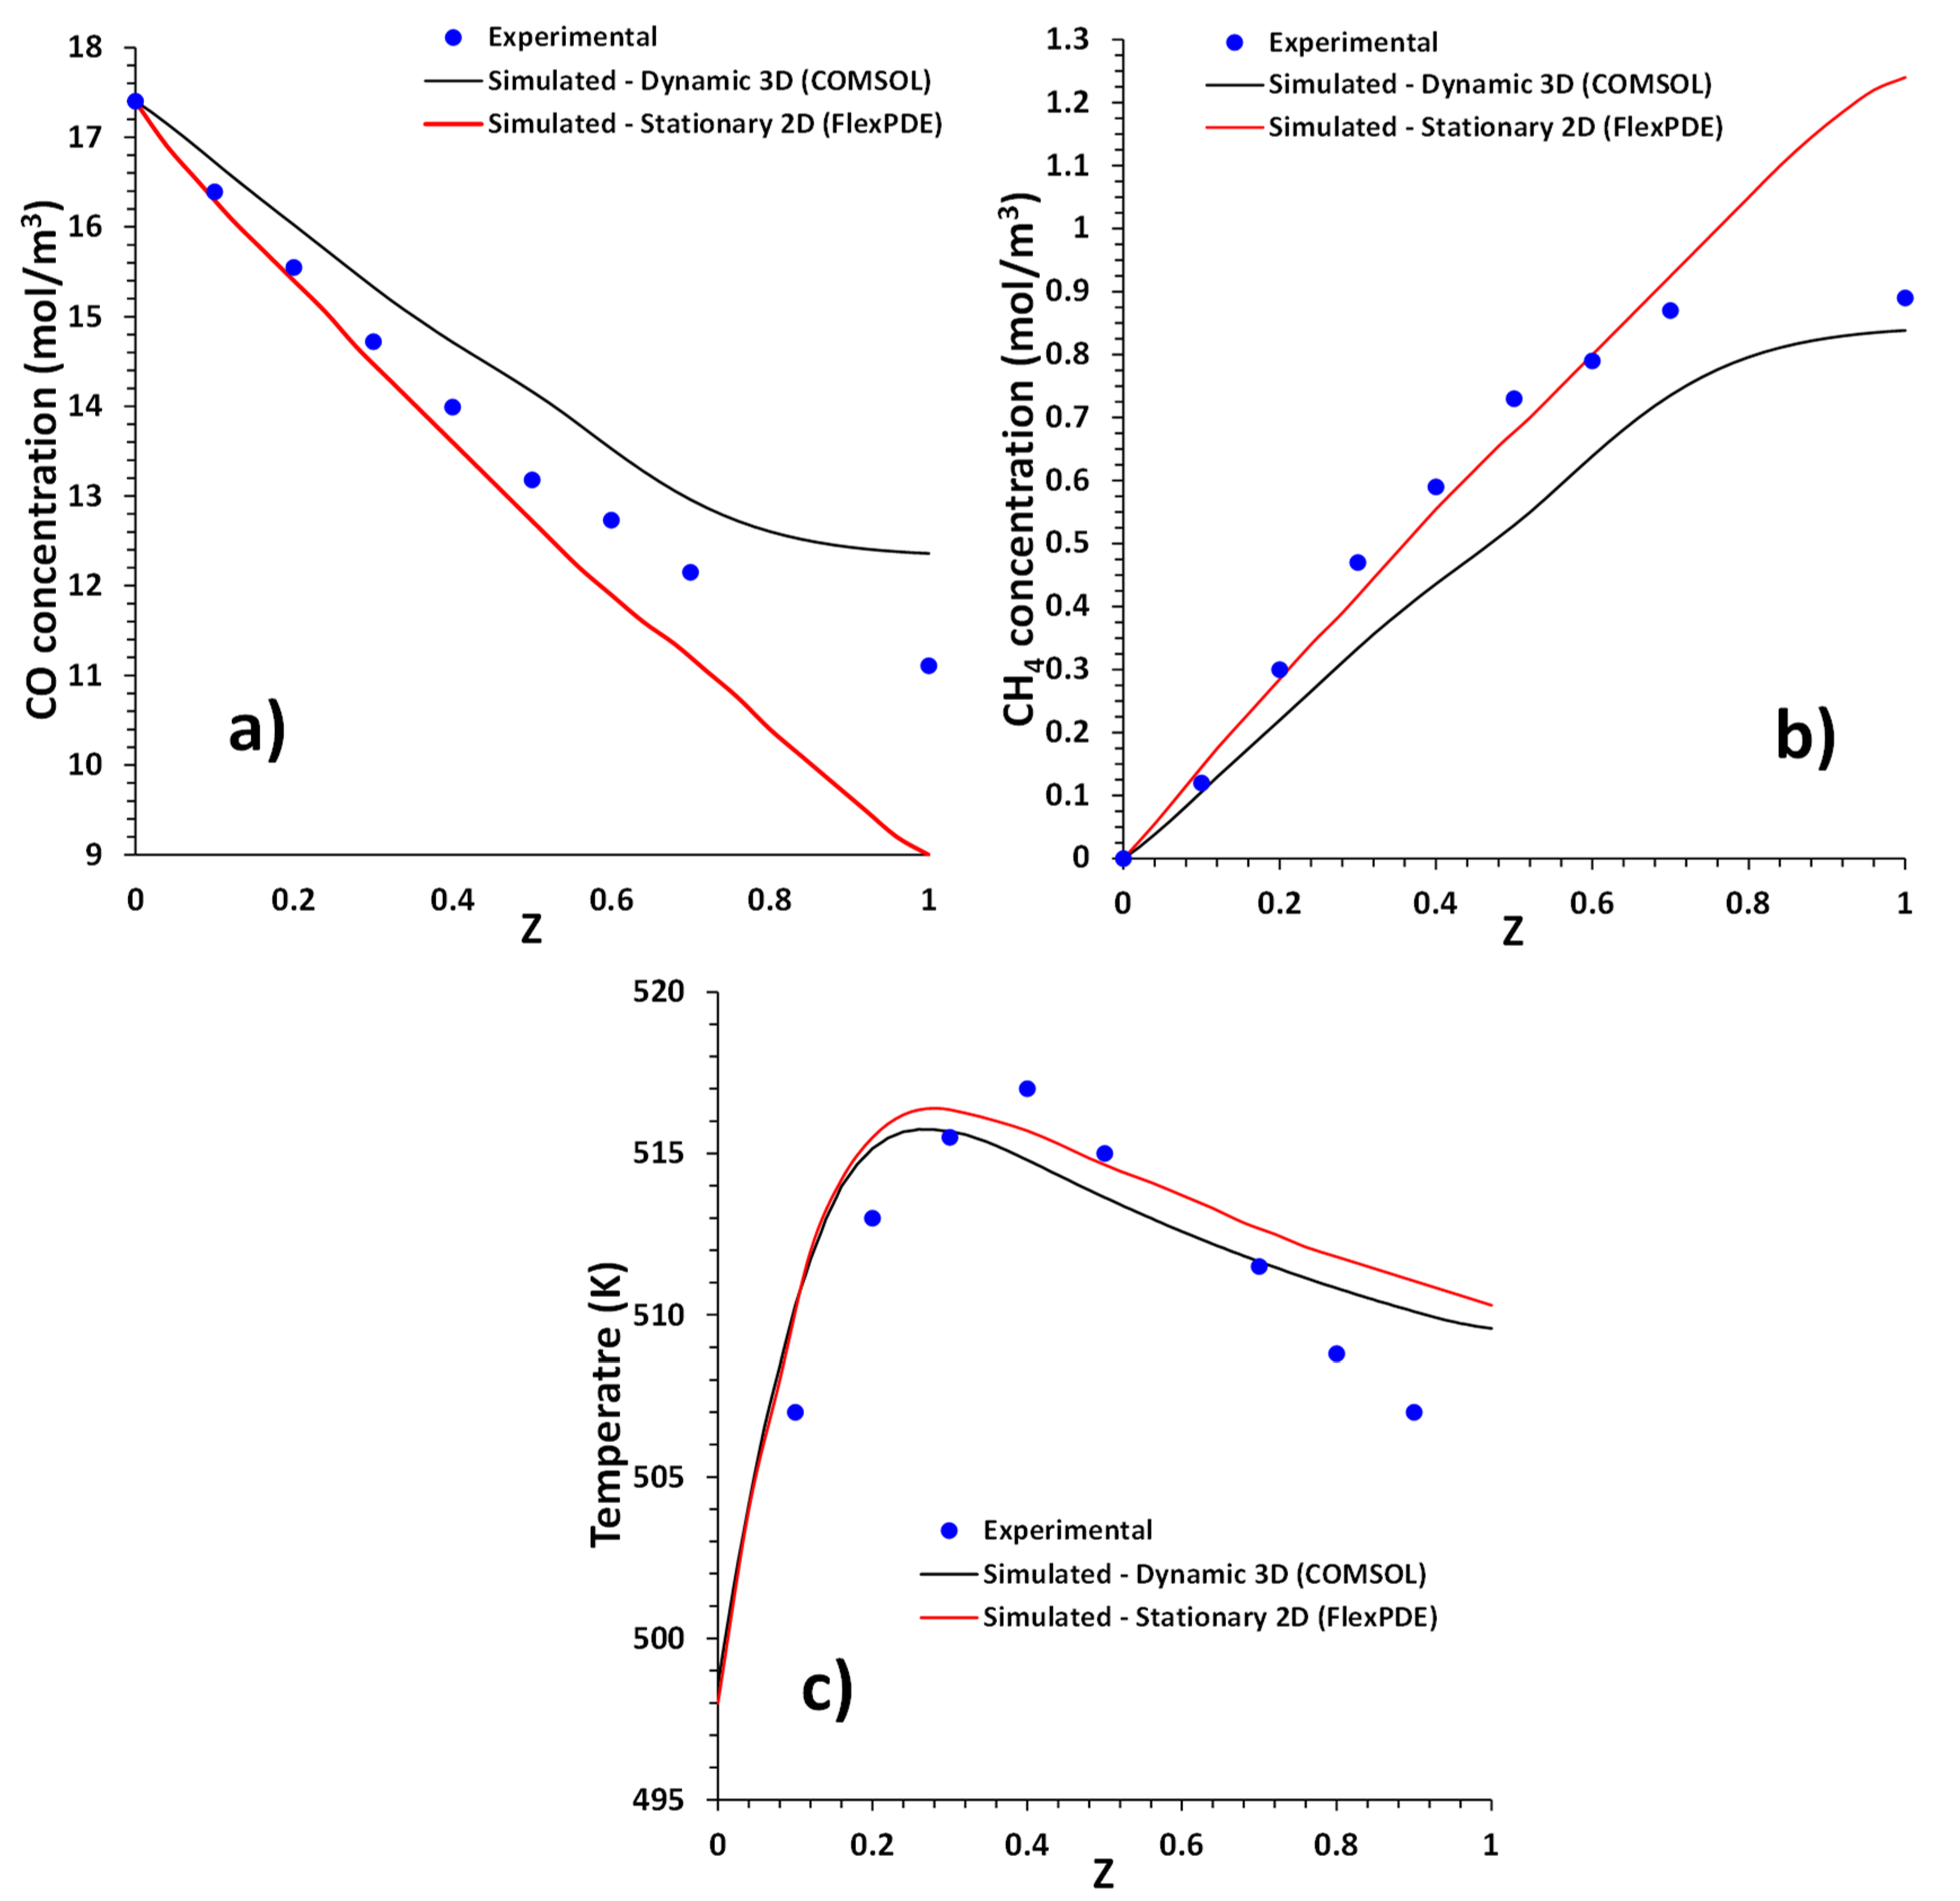
3.1. Analysis and Validation of the 2-D Stationary Model and the 3-D Dynamic Model
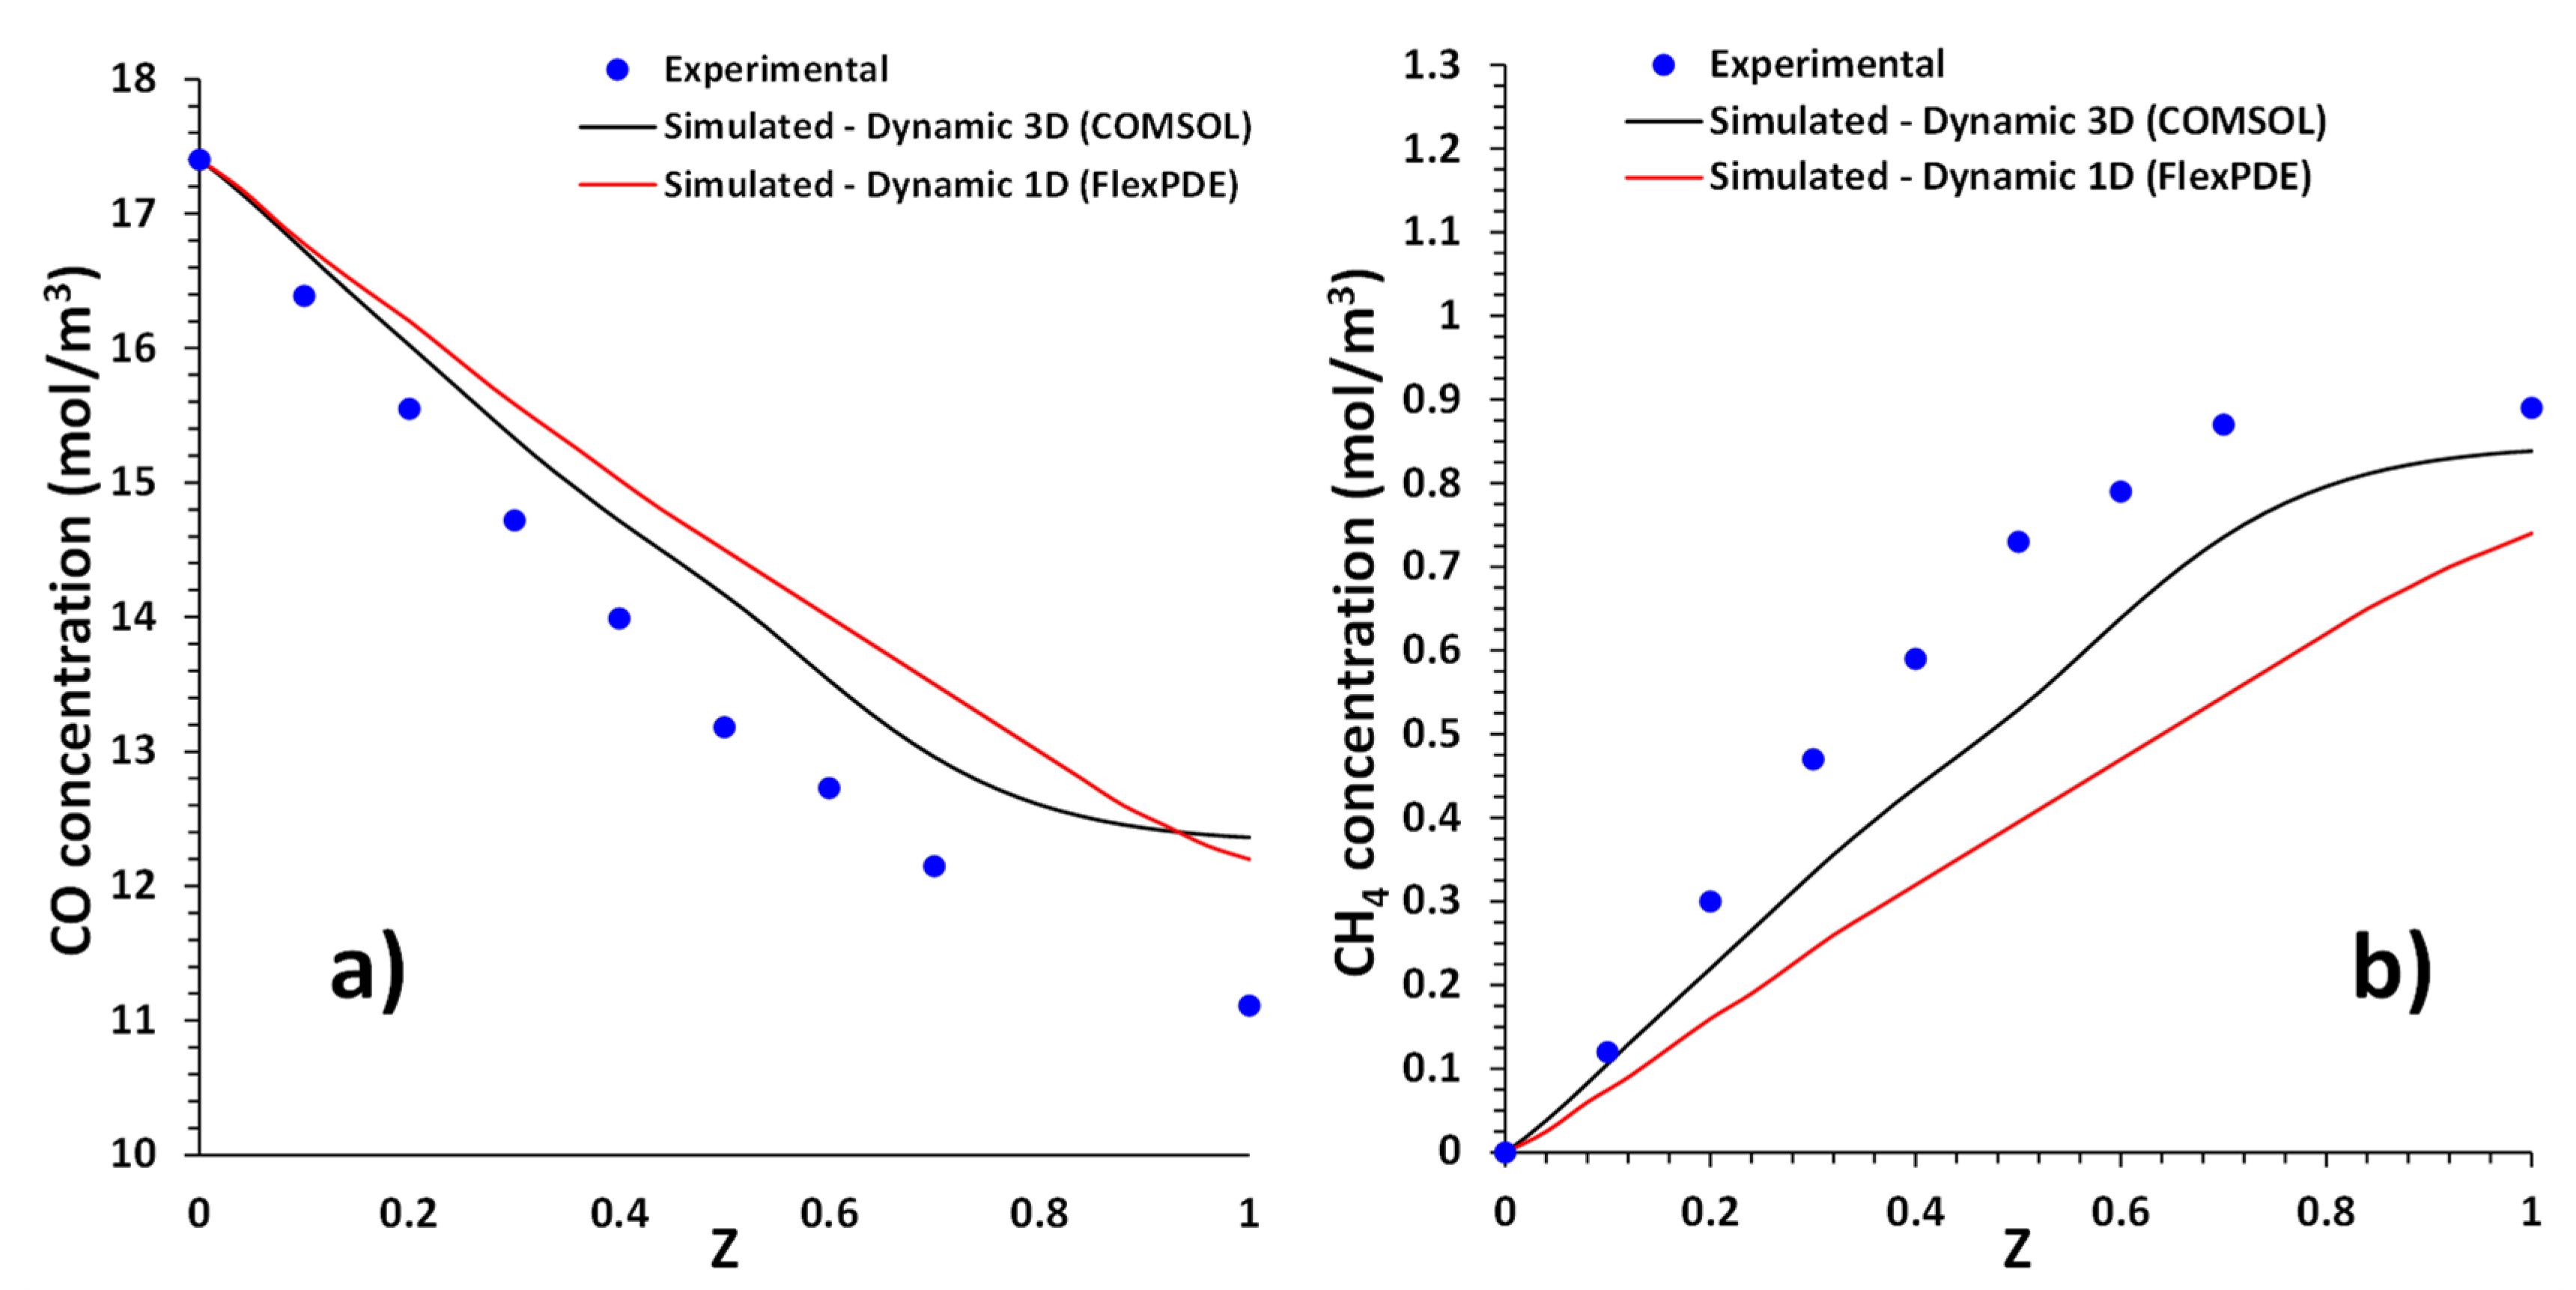
3.2. Analysis and Validation of the 1-D Dynamic Model and the 3-D Dynamic Model
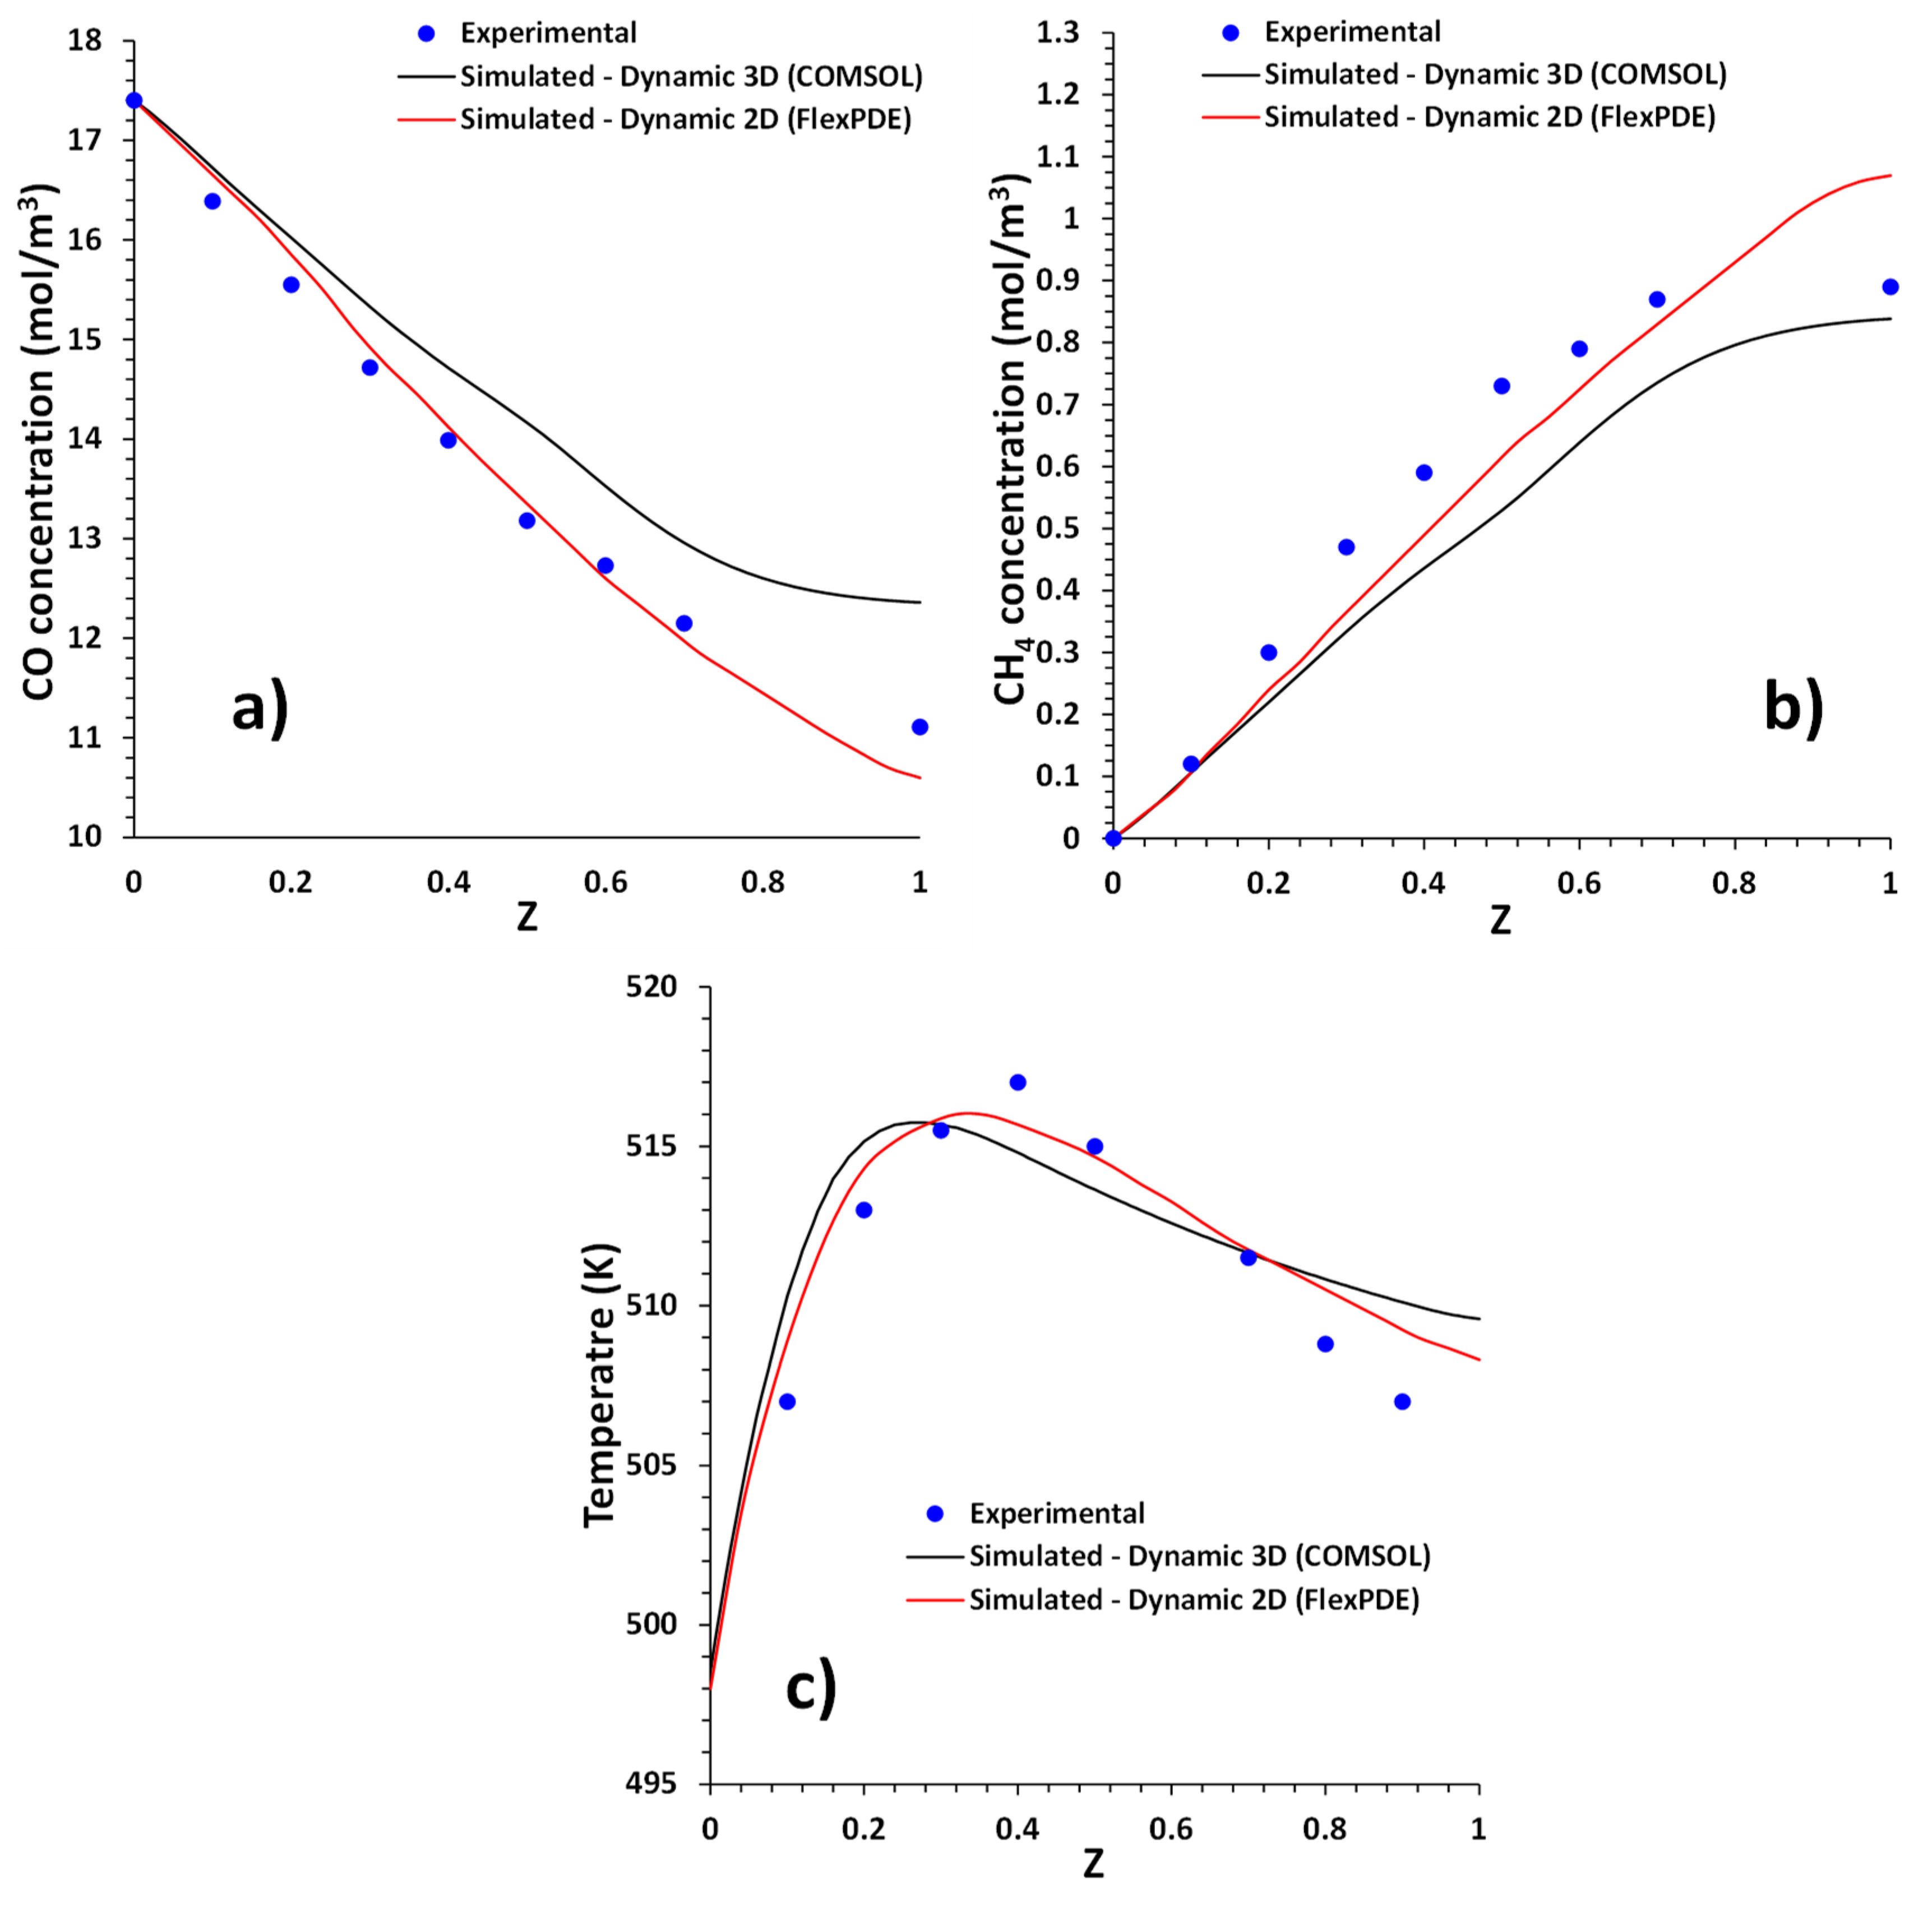
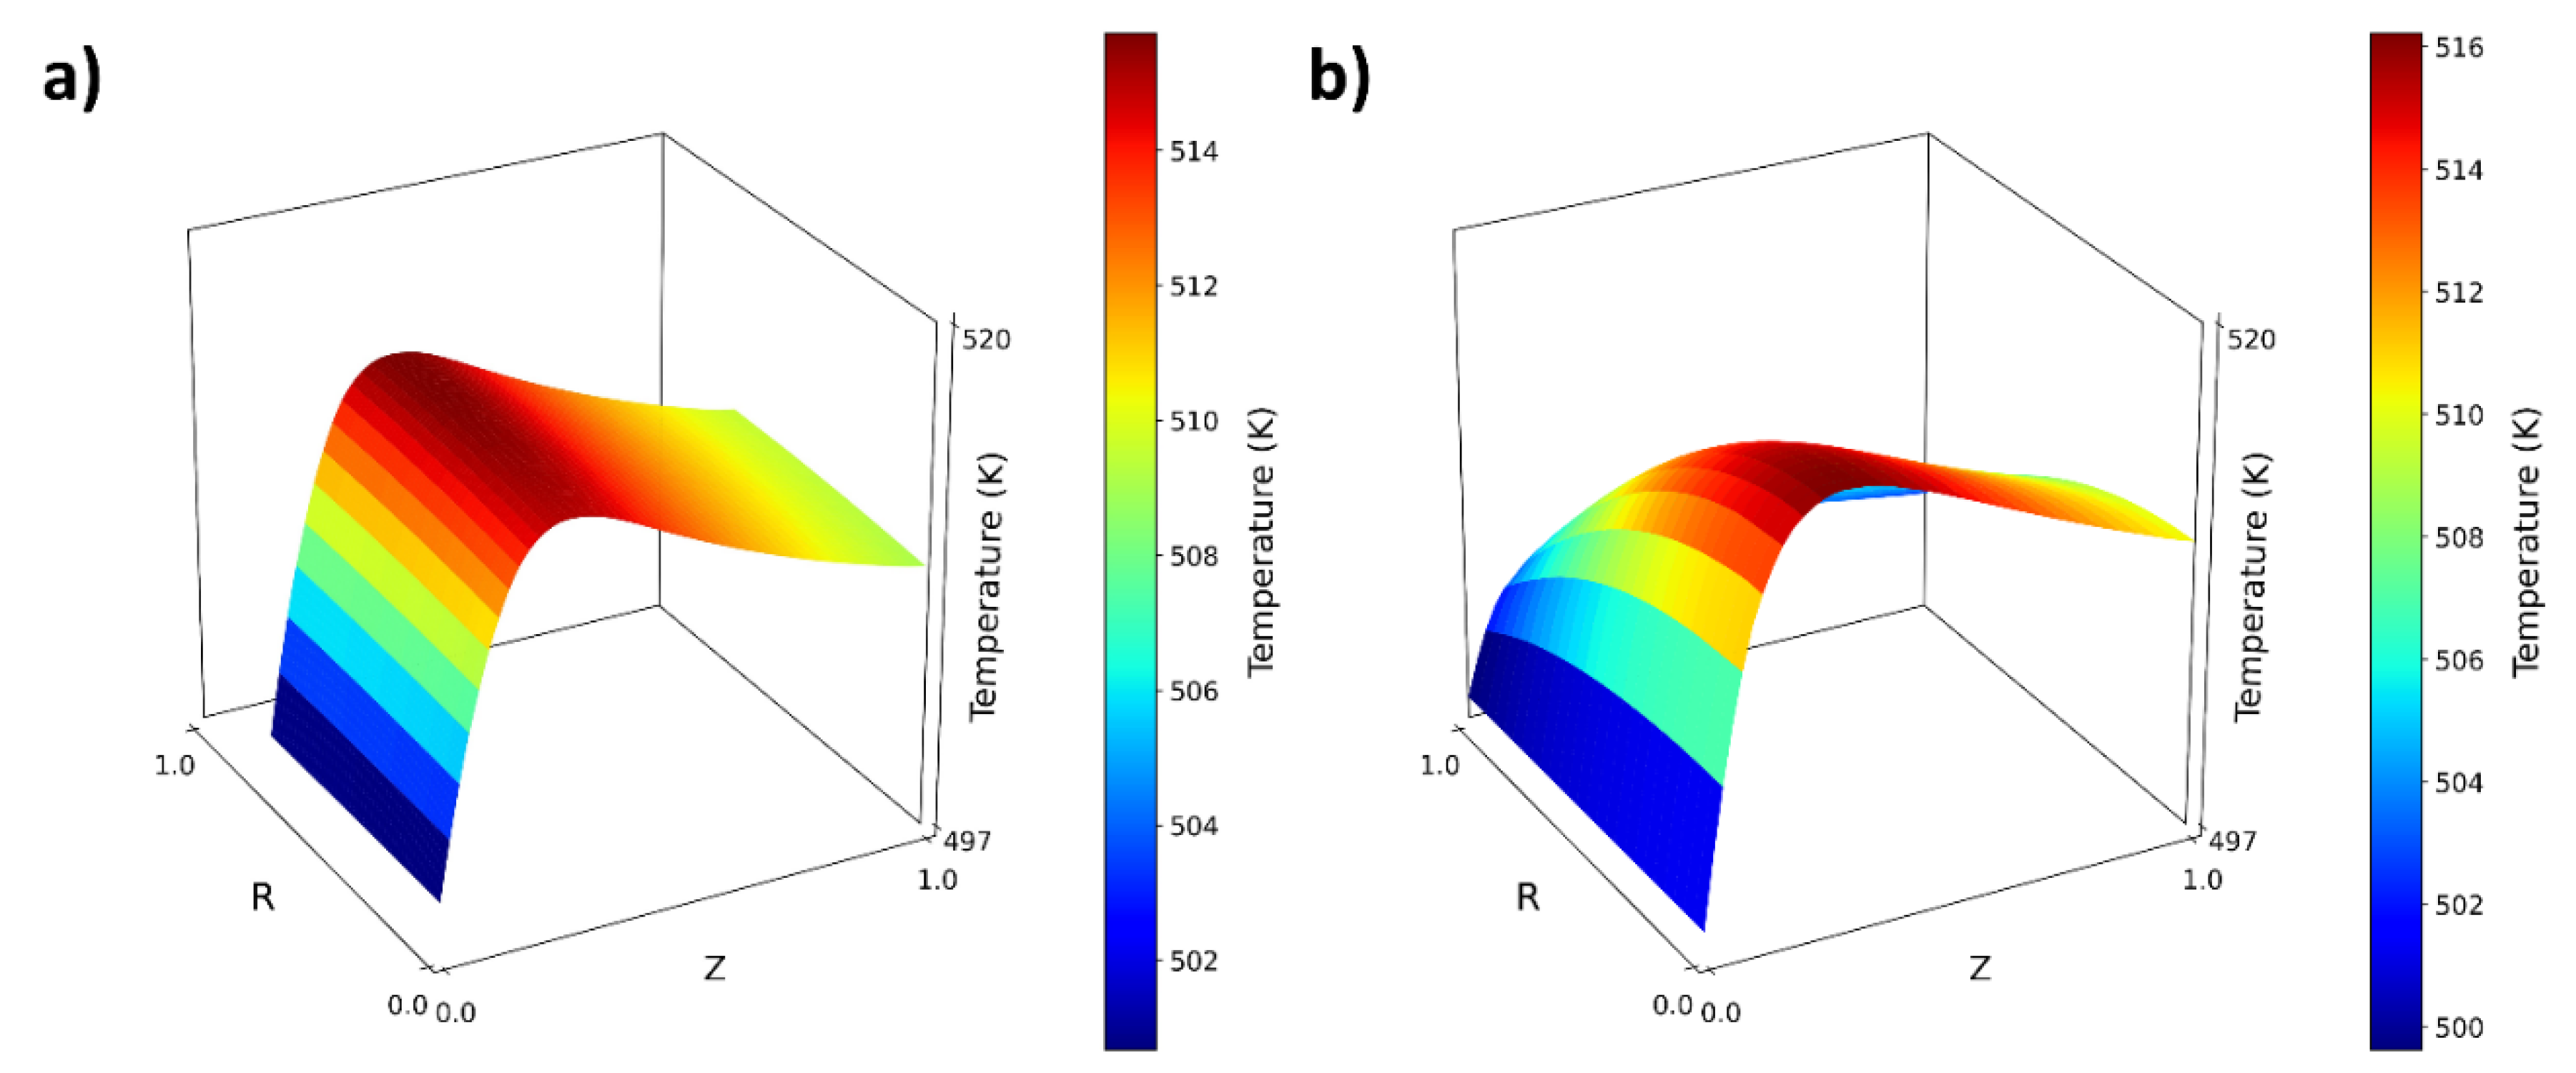
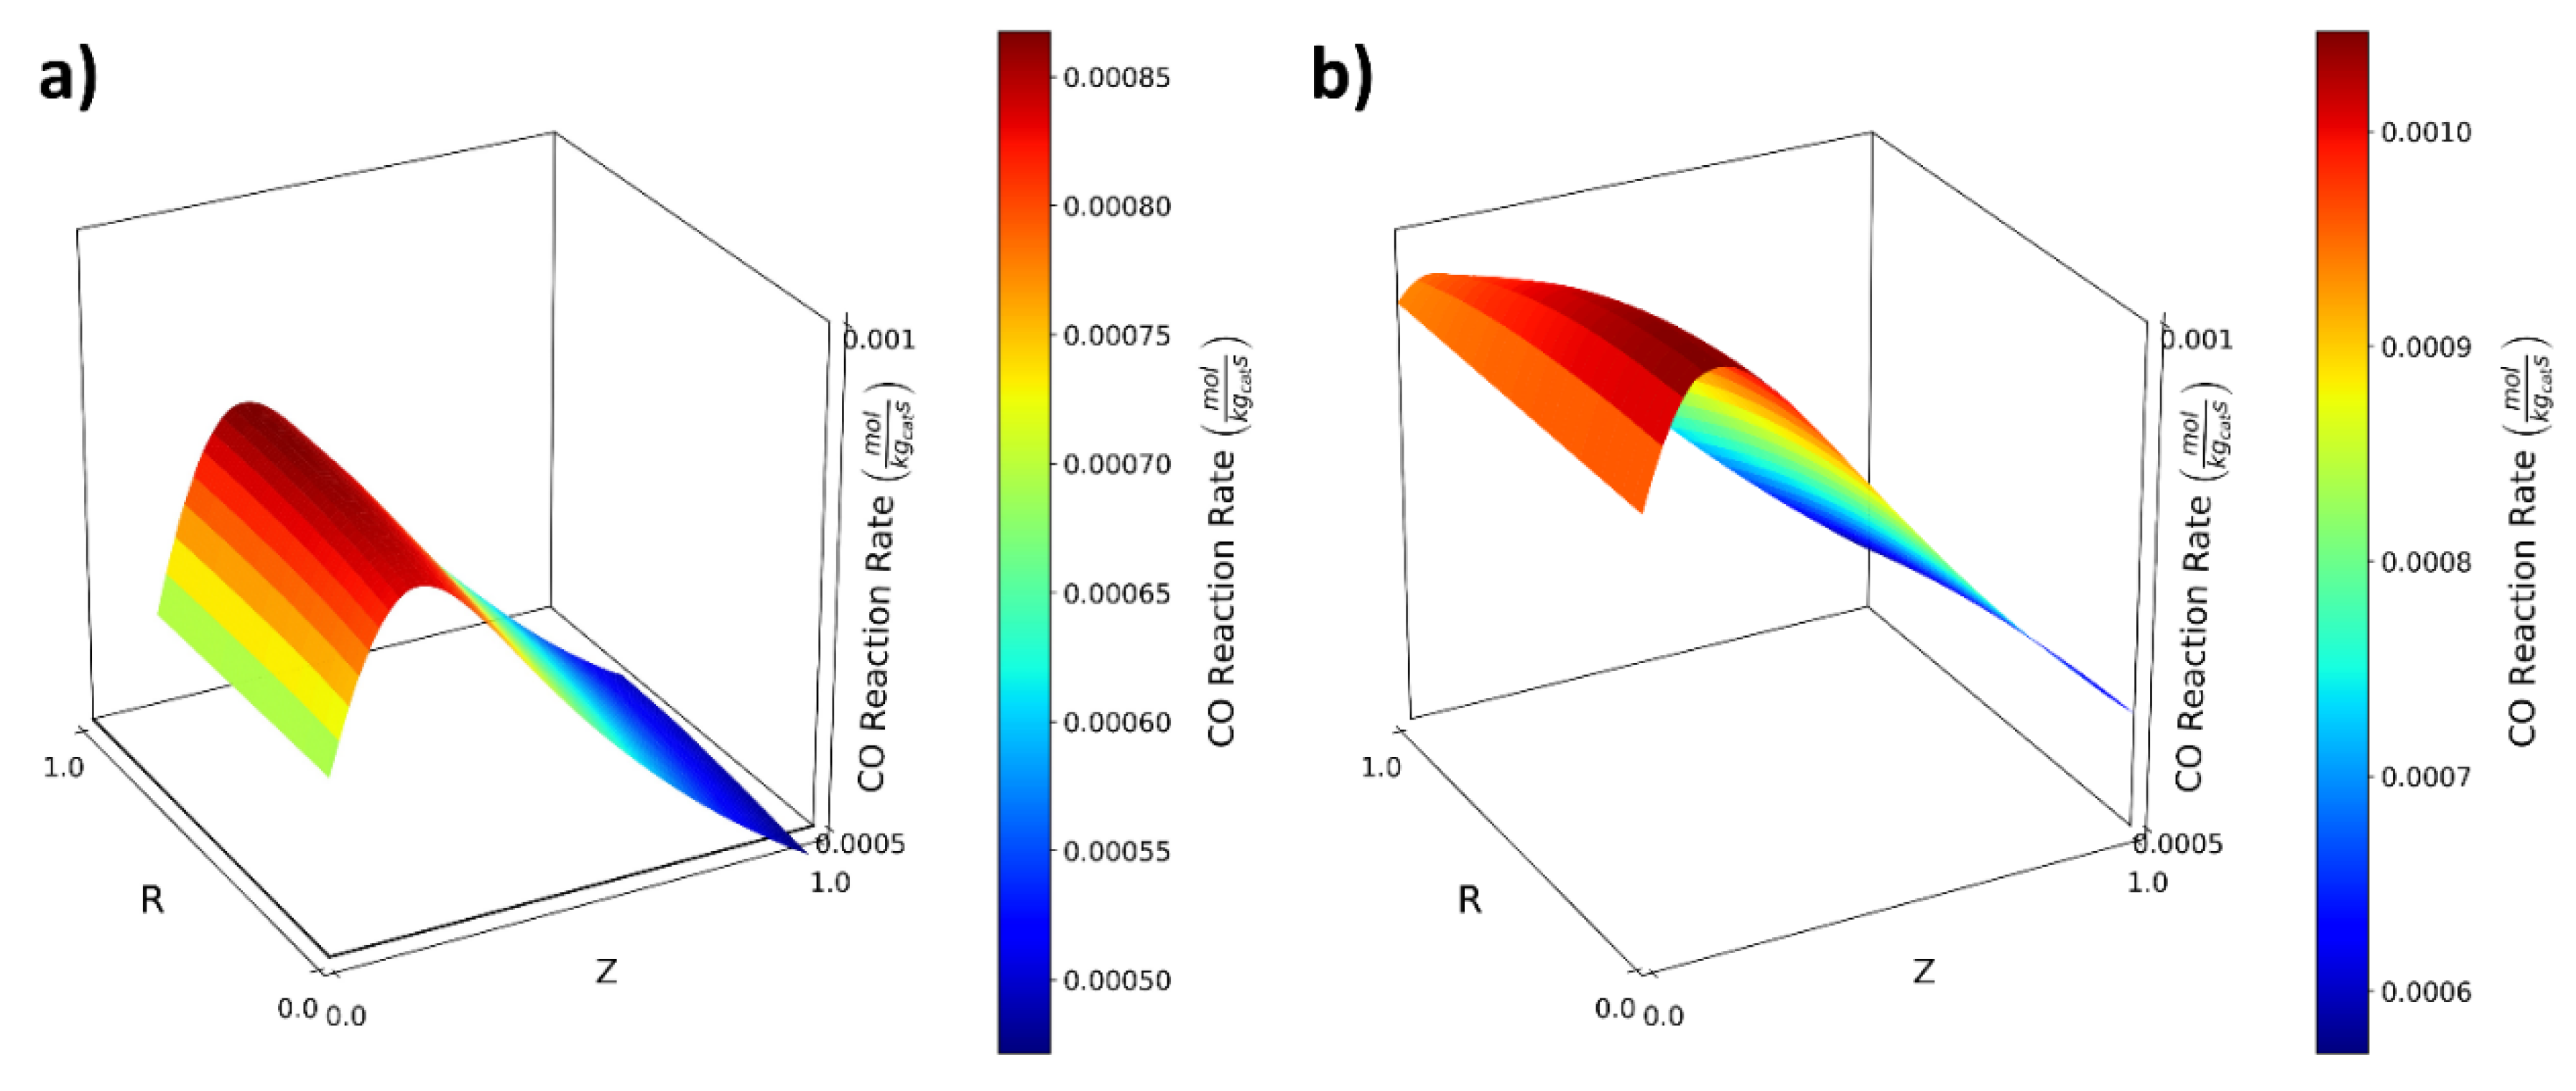
3.3. Analysis and Validation of the 2-D Dynamic Model and the 3-D Dynamic Model
4. Conclusions
Supplementary Materials
Author Contributions
Funding
Data Availability Statement
Acknowledgments
Conflicts of Interest
Nomenclature
| A′i | Modified exponential factor for species i in the Arrhenius expression | |
| av | External surface area per unit volume of the bed | |
| Ci | Concentration of species i in the fluid phase | mol/m3 |
| C0i | Initial concentration of the species i | mol/m3 |
| Csi | Concentration of species i in the solid phase | mol/m3 |
| Cosi | Initial concentration on the surface | mol/m3 |
| cpg | Heat capacity of the fluid phase | J/(kgK) |
| cps | Heat capacity of the fluid phase | J/(kgK) |
| dp | Equivalent particle diameter, | m |
| dt | Tube diameter | m |
| Ei | Activation energy for species i | J/mol |
| ∆Hi | Enthalpy of reaction | J |
| hc | Coefficient of heat transfer between solid and fluid phase | W/m3K |
| kc | Mass transfer coefficient between solid and fluid phase | m/s |
| kp | Reaction constant for the Ficher-Tropsch polymerization | |
| kt | Reaction constant for the determination of Ficher-Tropsch | |
| L | Bed length | m |
| Nu | Nusselt number | |
| Nuw | Nusselt number | |
| P | Pressure | MPa |
| Po | Initial Pressure | MPa |
| Pi | Partial pressure for species i | MPa |
| Peh | Peclet number of heat | |
| Peºh | Molecular Peclet number of heat based on particle diameter | |
| Pehv | Radial effective heat peclet number based on particle diameter | |
| Pehz | Axial effective heat peclet number based on particle diameter | |
| Pe′hv | Radial effective Peclet number of heat based on bed dimensions | |
| Pe′hz | Axial effective Peclet number of heat based on bed dimensions | |
| Pemv | Radial effective Peclet number of mass based on particle diameter | |
| Pemz | Effective axial Peclet number of mass based on particle diameter | |
| Pe′mr | Radial effective Peclet number of mass based on bed dimensions | |
| Pe′mz | Radial effective Peclet number of mass based on bed dimensions | |
| Pr | Prandlt number | |
| R | Internal radius of tube | m |
| R0 | External radius of tube | m |
| R′ | Ratio of the internal radius of the tube to the particle diameter | |
| Rep | Reynolds number based on particle diameter | |
| Rt | Radius of tube | m |
| r | Radial coordinate | m |
| r′ | Dimensionless Radial coordinate | |
| rn | Reaction rate of formation of n alkanes | |
| rvi | Reaction rate of species i | mol/(kgcat s) |
| (-∆H)rv | Total heat generation by reaction | W/kg cat |
| Sn | Selectivity of n-alkanes | |
| Sc | Schmidt number | |
| Sh | Sherwood number | |
| T | Fluid temperature | K |
| T0 | Initial fluid temperature | K |
| Ts | Solid Temperature | K |
| Tos | Solid initial temperature | K |
| Tc | Cooling liquid temperature | K |
| Tw | Wall temperature | K |
| t | Time | h |
| U | Total Heat Transfer Coefficient for one dimension, | W/(m2K) |
| Uc | Total Heat Transfer Coefficient | W/(m2K) |
| u | Velocity, m/s | |
| u0 | Average speed | m/s |
| Vp | Volume of the particle | m |
| X | Axial dimensionless coordinate z/L in the graphs | |
| Y | Radial dimensionless r/R coordinate in graphs | |
| yi | Dimensionless concentration of species i, Ci/Cio | |
| z | Axial coordinate | m |
| z′ | Dimensionless Axial coordinate z/L | |
| Greek Letters | ||
| α | Probability constant for the alkane chain to grow | |
| αw | Heat Transfer coefficient through the wall | |
| βi | Deactivation coefficient for species i | 1/h |
| γ | C2/C3 ratio | |
| ε | Local porosity | |
| ε0 | Average porosity | |
| εp | Porosity of the catalyst particle | |
| η | Effectiveness Factor | |
| λ0c | Thermal conductivity due to conduction | W/(mK) |
| λfc | Thermal conductivity due to convection | W/(mK) |
| λcr | Mean radial thermal conductivity of the bed | W/(mK) |
| λcz | Mean axial thermal conductivity of the bed | W/(mK) |
| λf | Thermal conductivity of the fluid phase | W/(mK) |
| λp | Thermal conductivity through the particle | W/(mK) |
| λw | Thermal conductivity of the bed wall | W/(mK) |
| μg | Fluid Viscosity | Ns/m2 |
| θ | Adimensional Temperature T/To | |
| θc | Dimensionless temperature of the cooling fluid Tc/To | |
| ρb | Density of the catalyst based on the volume of the bed | kg/m3 |
| ρg | Density of the fluid phase | kg/m3 |
| ρρ | Density of the catalyst particle | kg/m3 |
References
- Perry, R.; Green, D.; Maloney, J. Perry’s Chemical Engineers’ Handbook, 7th ed.; McGraw-Hill: Madrid, Spain, 2001; ISBN 84-481-3008-1. [Google Scholar]
- Cocco, R.; Karri, S.; Knowlton, T. Introduction to Fluidization. Chem. Eng. Prog. 2014, 110, 21–29. [Google Scholar]
- Fratalocchi, L.; Groppi, G.; Visconti, C.G.; Lietti, L.; Tronconi, E. Packed-POCS with Skin: A Novel Concept for the Intensification of Non-Adiabatic Catalytic Processes Demonstrated in the Case of the Fischer-Tropsch Synthesis. Catal. Today 2022, 383, 15–20. [Google Scholar] [CrossRef]
- Merino, D.; Sanz, O.; Montes, M. Effect of the Thermal Conductivity and Catalyst Layer Thickness on the Fischer-Tropsch Synthesis Selectivity Using Structured Catalysts. Chem. Eng. J. 2017, 327, 1033–1042. [Google Scholar] [CrossRef]
- Calverley, E.M.; Witt, P.M.; Sweeney, J.D. Reactor Runaway Due to Statistically Driven Axial Activity Variations in Graded Catalyst Beds: Loading from Pre-Measured Single Tube Aliquots. Chem. Eng. Sci. 2013, 90, 170–178. [Google Scholar] [CrossRef]
- Philippe, R.; Lacroix, M.; Dreibine, L.; Pham-Huu, C.; Edouard, D.; Savin, S.; Luck, F.; Schweich, D. Effect of Structure and Thermal Properties of a Fischer–Tropsch Catalyst in a Fixed Bed. Catal. Today 2009, 147, S305–S312. [Google Scholar] [CrossRef]
- Shah, Z.; Kumam, P.; Ullah, A.; Khan, S.N.; Selim, M.M. Mesoscopic Simulation for Magnetized Nanofluid Flow within a Permeable 3D Tank. IEEE Access 2021, 9, 135234–135244. [Google Scholar] [CrossRef]
- Visconti, C.G.; Tronconi, E.; Lietti, L.; Groppi, G.; Forzatti, P.; Cristiani, C.; Zennaro, R.; Rossini, S. An Experimental Investigation of Fischer–Tropsch Synthesis over Washcoated Metallic Structured Supports. Appl. Catal. A Gen. 2009, 370, 93–101. [Google Scholar] [CrossRef]
- Asalieva, E.; Gryaznov, K.; Kulchakovskaya, E.; Ermolaev, I.; Sineva, L.; Mordkovich, V. Fischer–Tropsch Synthesis on Cobalt-Based Catalysts with Different Thermally Conductive Additives. Appl. Catal. A Gen. 2015, 505, 260–266. [Google Scholar] [CrossRef]
- Fratalocchi, L.; Visconti, C.G.; Groppi, G.; Lietti, L.; Tronconi, E. Intensifying Heat Transfer in Fischer-Tropsch Tubular Reactors through the Adoption of Conductive Packed Foams. Chem. Eng. J. 2018, 349, 829–837. [Google Scholar] [CrossRef]
- Chandra, V.; Vogels, D.; Peters, E.A.J.F.; Kuipers, J.A.M. A Multi-Scale Model for the Fischer-Tropsch Synthesis in a Wall-Cooled Packed Bed Reactor. Chem. Eng. J. 2021, 410, 128245. [Google Scholar] [CrossRef]
- Dixon, A.G.; Van Dongeren, J.H. The Influence of the Tube and Particle Diameters at Constant Ratio on Heat Transfer in Packed Beds. Chem. Eng. Process. Process Intensif. 1998, 37, 23–32. [Google Scholar] [CrossRef]
- Mohammad, N.; Chukwudoro, C.; Bepari, S.; Basha, O.; Aravamudhan, S.; Kuila, D. Scale-up of High-Pressure F-T Synthesis in 3D Printed Stainless Steel Microchannel Microreactors: Experiments and Modeling. Catal. Today 2021, 397–399, 182–196. [Google Scholar] [CrossRef]
- Abusrafa, A.E.; Challiwala, M.S.; Wilhite, B.A.; Elbashir, N.O. Thermal Assessment of a Micro Fibrous Fischer Tropsch Fixed Bed Reactor Using Computational Fluid Dynamics. Processes 2020, 8, 1213. [Google Scholar] [CrossRef]
- Chabot, G.; Guilet, R.; Cognet, P.; Gourdon, C. A Mathematical Modeling of Catalytic Milli-Fixed Bed Reactor for Fischer–Tropsch Synthesis: Influence of Tube Diameter on Fischer Tropsch Selectivity and Thermal Behavior. Chem. Eng. Sci. 2015, 127, 72–83. [Google Scholar] [CrossRef]
- Na, J.; Kshetrimayum, K.S.; Lee, U.; Han, C. Multi-Objective Optimization of Microchannel Reactor for Fischer-Tropsch Synthesis Using Computational Fluid Dynamics and Genetic Algorithm. Chem. Eng. J. 2017, 313, 1521–1534. [Google Scholar] [CrossRef]
- Pavlišič, A.; Ceglar, R.; Pohar, A.; Likozar, B. Comparison of Computational Fluid Dynamics (CFD) and Pressure Drop Correlations in Laminar Flow Regime for Packed Bed Reactors and Columns. Powder Technol. 2018, 328, 130–139. [Google Scholar] [CrossRef]
- Amiri, L.; Ghoreishi-Madiseh, S.A.; Hassani, F.P.; Sasmito, A.P. Estimating Pressure Drop and Ergun/Forchheimer Parameters of Flow through Packed Bed of Spheres with Large Particle Diameters. Powder Technol. 2019, 356, 310–324. [Google Scholar] [CrossRef]
- Khan, S.; Selim, M.M.; Gepreel, K.A.; Ullah, A.; Ikramullah; Ayaz, M.; Mashwani, W.K.; Khan, E. An Analytical Investigation of the Mixed Convective Casson Fluid Flow Past a Yawed Cylinder with Heat Transfer Analysis. Open Phys. 2021, 19, 341–351. [Google Scholar] [CrossRef]
- Rai, A.; Anand, M.; Farooqui, S.A.; Sibi, M.G.; Sinha, A.K. Kinetics and Computational Fluid Dynamics Study for Fischer–Tropsch Synthesis in Microchannel and Fixed-Bed Reactors. React. Chem. Eng. 2018, 3, 319–332. [Google Scholar] [CrossRef]
- Oñate, W.; Maldonado, S.; Taco, S.; Caiza, G. Computational Fluid Dynamic Simulation with Experimental Validation in Turbine Pipeline. Int. J. Recent Technol. Eng. 2019, 8, 927–931. [Google Scholar]
- Deutschmann, O. Modeling of the Interactions Between Catalytic Surfaces and Gas-Phase. Catal. Lett. 2014, 145, 272–289. [Google Scholar] [CrossRef]
- Pessoa, D.R.; Finkler, A.T.J.; Machado, A.V.L.; Mitchell, D.A.; de Lima Luz, L.F. CFD Simulation of a Packed-Bed Solid-State Fermentation Bioreactor. Appl. Math. Model. 2019, 70, 439–458. [Google Scholar] [CrossRef]
- Skaare, S. Reaction and Heat Transfer in a Wall-Cooled Fixed Bed Reactor, University of Trondheim, The Norwegian Institute of Technology, Laboratory of Industrial Chemistry, [Thesis Submitted for the Doctor of Engineering Degree]. 1993. Available online: http://www.fischer-tropsch.org/DOE/DOE_reports/95717546/de95717546_toc.htm (accessed on 17 May 2022).
- Rodemerck, U.; Holeňa, M.; Wagner, E.; Smejkal, Q.; Barkschat, A.; Baerns, M. Catalyst Development for CO2 Hydrogenation to Fuels. ChemCatChem 2013, 5, 1948–1955. [Google Scholar] [CrossRef]
- Yates, I.C.; Satterfield, C.N. Intrinsic Kinetics of the Fischer-Tropsch Synthesis on a Cobalt Catalyst. Energy Fuels 2002, 5, 168–173. [Google Scholar] [CrossRef]
- Introduction to the Porous Media Flow Module User’s Guide, COMSOL Multiphysics® v. 5.5; COMSOL AB: Stockholm, Sweden, 2019; pp. 6–38.
- Vervloet, D.; Kapteijn, F.; Nijenhuis, J.; Van Ommen, J.R. Fischer–Tropsch Reaction–Diffusion in a Cobalt Catalyst Particle: Aspects of Activity and Selectivity for a Variable Chain Growth Probability. Catal. Sci. Technol. 2012, 2, 1221–1233. [Google Scholar] [CrossRef]
- Shin, M.S.; Park, N.; Park, M.J.; Jun, K.W.; Ha, K.S. Computational Fluid Dynamics Model of a Modular Multichannel Reactor for Fischer–Tropsch Synthesis: Maximum Utilization of Catalytic Bed by Microchannel Heat Exchangers. Chem. Eng. J. 2013, 234, 23–32. [Google Scholar] [CrossRef]
- Guettel, R.; Turek, T. Comparison of Different Reactor Types for Low Temperature Fischer–Tropsch Synthesis: A Simulation Study. Chem. Eng. Sci. 2009, 64, 955–964. [Google Scholar] [CrossRef]
- Moazami, N.; Wyszynski, M.L.; Mahmoudi, H.; Tsolakis, A.; Zou, Z.; Panahifar, P.; Rahbar, K. Modelling of a Fixed Bed Reactor for Fischer–Tropsch Synthesis of Simulated N2-Rich Syngas over Co/SiO2: Hydrocarbon Production. Fuel 2015, 154, 140–151. [Google Scholar] [CrossRef]
- Irani, M.; Alizadehdakhel, A.; Pour, A.N.; Proulx, P.; Tavassoli, A. An Investigation on the Performance of a FTS Fixed-Bed Reactor Using CFD Methods. Int. Commun. Heat Mass Transf. 2011, 38, 1119–1124. [Google Scholar] [CrossRef]
- Kuncharam, B.V.R.; Dixon, A.G. Multi-Scale Two-Dimensional Packed Bed Reactor Model for Industrial Steam Methane Reforming. Fuel Process. Technol. 2020, 200, 106314. [Google Scholar] [CrossRef]
- Mandić, M.; Dikić, V.; Petkovska, M.; Todić, B.; Bukur, D.B.; Nikačević, N.M. Dynamic Analysis of Millimetre-Scale Fixed Bed Reactors for Fischer-Tropsch Synthesis. Chem. Eng. Sci. 2018, 192, 434–447. [Google Scholar] [CrossRef]


| Properties | Value |
|---|---|
| L (m) | 1.5 |
| R (m) | 12.5 × 10⁻³ |
| Ro (m) | 17.5 × 10⁻³ |
| 0.89 × 10³ | |
| 1.59 × 10³ | |
| 0.44 | |
| 0.485 | |
| (m) | 3.3 × 10⁻³ |
| 965 | |
| 0.4 | |
| 430 | |
| 18.0 |
| Fluid Properties | Dimensionless Numbers | Masic Peclets | Kinetic Parameters | ||||
| To (K) | 498 | Rep | 119 | 1/Pe′mzCO | 0.00111 | KCO | 1.2 |
| PT (MPa) | 1 | Pr | 0.57 | 1/Pe′mzH2 | 0.00112 | ECO | 110 |
| PN2 (Mpa) | 0.77 | ScCO | 0.8945 | 1/Pe′mzCH4 | 0.00111 | ECH4 | 140 |
| uo (m/s) | 0.16 | ScH2 | 0.2451 | 1/Pe′mrCO | 2.54486 | A′CO | 0.0041 |
| CoN2 (mol/m3) | 186 | ScCH4 | 0.8155 | 1/Pe′mr H2 | 2.74323 | A′CH4 | 0.0006 |
| CoCO (mol/m3) | 17.4 | 1/Pe′mrCH4 | 2.55211 | βCO | 0.0043 | ||
| CoH2 (mol/m3) | 38.2 | βCH4 | 0.0097 | ||||
| Physical properties of gas mixture | Distribution parameters | Caloric Peclets | Thermal conductivity | ||||
| ρg (kg/m3) | 5.77 | α | 0.69 | 1/Pe′hz | 0.00196 | λcr (W/(mK)) | 0.6172 |
| Cpg (J/(kg/K) | 1333 | γ | 0.88 | 1/Pe′hr | 4.81445 | Uc (W/(m2K)) | 525.12 |
| μg (Ns/m2) | 2.56 × 10⁻⁵ | ||||||
| λg (W/(mK)) | 0.05972 | ||||||
Publisher’s Note: MDPI stays neutral with regard to jurisdictional claims in published maps and institutional affiliations. |
© 2022 by the authors. Licensee MDPI, Basel, Switzerland. This article is an open access article distributed under the terms and conditions of the Creative Commons Attribution (CC BY) license (https://creativecommons.org/licenses/by/4.0/).
Share and Cite
Taco-Vasquez, S.; Ron, C.A.; Murillo, H.A.; Chico, A.; Arauz, P.G. Thermochemical Analysis of a Packed-Bed Reactor Using Finite Elements with FlexPDE and COMSOL Multiphysics. Processes 2022, 10, 1144. https://doi.org/10.3390/pr10061144
Taco-Vasquez S, Ron CA, Murillo HA, Chico A, Arauz PG. Thermochemical Analysis of a Packed-Bed Reactor Using Finite Elements with FlexPDE and COMSOL Multiphysics. Processes. 2022; 10(6):1144. https://doi.org/10.3390/pr10061144
Chicago/Turabian StyleTaco-Vasquez, Sebastian, César A. Ron, Herman A. Murillo, Andrés Chico, and Paul G. Arauz. 2022. "Thermochemical Analysis of a Packed-Bed Reactor Using Finite Elements with FlexPDE and COMSOL Multiphysics" Processes 10, no. 6: 1144. https://doi.org/10.3390/pr10061144