Article

Performance Optimization on 3D Diffuser of Volute Pump Using Kriging Model

1
Research Center of Fluid Machinery Engineering and Technology, Jiangsu University, Zhenjiang 212013, China
2
Wenling Research Institute of Fluid Machinery, Jiangsu University, Taizhou 317522, China
3
Jiangsu Aerospace Hydraulic Equipment Co., Ltd., Yangzhou 225699, China
*
Author to whom correspondence should be addressed.
Processes 2022, 10(6), 1076; https://doi.org/10.3390/pr10061076
Submission received: 9 May 2022 / Revised: 25 May 2022 / Accepted: 25 May 2022 / Published: 27 May 2022
(This article belongs to the Special Issue Design and Optimization Method of Pumps)

Abstract

:
In order to enhance the hydraulic performance of the volute pump, the Kriging model and genetic algorithm (GA) were used to optimize the 3D diffuser of the volute pump, and the hydraulic performance of the optimized model was compared and analyzed with the original model. The volute pump diffuser model was parameterized by BladeGen software. A total of 14 parameters such as the distance between the leading and trailing edges and the central axis, and the inlet and outlet vane angle were selected as design variables, and the efficiency under the design condition was taken as the optimization objective. A total of 70 sets of sample data were randomly selected in the design space to train and test the Kriging model. The optimal solution was obtained by GA. The shape and inner flow of the optimized diffuser were compared with those of the original diffuser. The research results showed that the Kriging model can effectively establish the high-precision mathematical function between the design variables and the optimization objective, and the R2 value is 0.95356, which meets the engineering needs. The optimized geometry model demonstrated a significant change, the vane leading edge became thinner, and the wrap angle increased. After optimization, the hydraulic performance of the volute pump under design and part-load conditions were greatly improved, the efficiency under design conditions increased by 2.65%, and the head increased by 0.83 m. Furthermore, the inner flow condition improved, the large area of low-speed and vortex disappeared, the pressure distribution in the diffuser was more reasonable, and the pressure gradient variation decreased.

1. Introduction

As a general machine, the pump assumes an important and fundamental function in modern production, and this is supported by the literature. Sakran et al. [1] systematically summarized the studies related to the effect of blade number on pump performance. Arun Shankar et al. [2] focused on the energy-saving effect of variable frequency drives (VFD) applied in pump systems. Liu et al. [3] summarized the published research results related to performance prediction and geometry optimization in pump-as-turbine. Al-Obaidi [4] used numerical methods to investigate the effect of different guide vanes on the flow field structure and axial pump performance under unsteady flow. Bai et al. [5] numerically investigated the effect of pressure fluctuations and unsteady flow patterns in the pump flow channel of three configurations with different numbers of diffuser vanes. Yang et al. [6] analyzed the fluid-dynamical analyses of unsteady flow in the first stage of a 12 multistage pump-turbine where hump instability occurs.
The hydraulic volute pump plays a key role as the core equipment in the high head, high flow, long-distance water-transfer project. At the same time, large-scale water transfer projects, as an important part of the national water infrastructure, also put forward higher requirements for the performance of the volute pump. Among them, good operational stability and high operating efficiency is indispensable. The design of an efficient pump hydraulic model is heavily dependent on the engineering experience of the designer. For relatively inexperienced engineering designers, the optimal design of the hydraulic model is a key step in improving the efficiency of the model. Li et al. [7] summarized the common methods used in turbomachinery aerodynamics optimization, which are also commonly used in the field of pump hydraulic optimization and can be divided into three main categories: design of experiments (DOE), surrogate models, and intelligent algorithms. DOE mostly adopted Taguchi experimental designs by selecting enough representative points in the design space to analyze the influence of parameters on performance. Intelligent algorithms mainly included genetic algorithms (GA), particle swarm algorithms (PSO), gravitational search algorithms (GSA), etc., combined with the DOE method to seek the optimal solution directly in the design space. The main elements and advantages and disadvantages of each method are listed in Table 1.
The surrogate model approach is a common method in modern optimization. Its main concept is to use an approximate mathematical model instead of a complex and time-consuming numerical computation process. Cho et al. [8] used an artificial neural network (ANN) model to optimize the operating conditions of a new explosive waste treatment method to reduce NOx emissions. Zhang et al. [9] established an effective optimization framework for aerodynamic shape design based on the multi-fidelity deep neural network (MFDNN) model, which can significantly improve optimization efficiency and outperform the single-fidelity method. The Kriging model is a common surrogate model and has also been studied by many scholars. Keshtegar et al. [10] compared the accuracy of four methods, Kriging, response surface method (RSM), multivariate adaptive regression (MARS), and M5 model tree (M5 Tree), in solar radiation estimation. The periodic Kriging model was found to be superior to the other three models. Ren et al. [11] proposed two active learning approaches combined Kriging and ANN models for reliability analysis, and the proposed methods can effectively assess, compared to a single typical surrogate model, the reliability of high and rare event problems with low computational cost. Hasanipanah et al. [12] investigated the accuracy and agreement of Kriging’s nonlinear interpolation strategy for shear strength estimation at rock joints.
The application of the surrogate model approach in pump optimization design can effectively reduce the number of sampling points, shorten the computation time, and improve optimization efficiency. Tong et al. [13] compared the optimization prediction accuracy of the hydraulic loss model and three surrogate models for a ten-stage centrifugal pump and confirmed that the surrogate model was more accurate. De Donno et al. [14] proposed an open-source software-based surrogate optimization process to compare the effectiveness of Kriging and ANN models in pump optimization and validated it with an Ercoftac centrifugal pump. Ma et al. [15] used a machine-learning-based surrogate model to improve the hydraulic performance of a two-vane pump for wastewater treatment. Jaiswal et al. [16] selected the blade angle as the design variable, the shaft power, and head as the optimization objectives, and used a hybrid surrogate model for multi-objective optimization of the centrifugal pump impeller. Chen et al. [17] proposed an inverse design and optimization method based on an adaptive proper orthogonal decomposition (APOD) hybrid model that reduces the cost of numerical computation and improves the accuracy of flow field prediction. Gan et al. [18] performed a multi-objective optimization of the inlet pipe of an inline pump based on genetic algorithm (GA) and ANN model to improve the inlet flow conditions of the inline pump.
As a key hydraulic component, the diffuser plays an important role in the volute pump. Posa et al. [19] investigated the effect of different operating conditions and different diffuser vane angles on pressure pulsation by large eddy simulation (LES). In a study by Yang et al. [20] for a large vertical centrifugal pump, matching optimization of the diffuser and volute had been performed using a variety of surrogate models to reduce the operating energy consumption, with the efficiency under the design conditions as the optimization objective. Lai et al. [21] studied the energy loss in a single-stage centrifugal pump for different diffuser outlet diameters. Wang et al. [22] experimentally investigated the influence of the clocking effect on the performance of centrifugal pumps. In the existing literature, there are relatively few studies on surrogate model optimization, specifically for the diffuser of volute pumps. Therefore, optimization of the volute pump diffuser using the surrogate model approach will facilitate further improvement of pump performance.
In this paper, a high-precision nonlinear mathematical function was established between the geometric parameters of the diffuser and the pump efficiency based on the Kriging model, and the optimal combination of parameters was obtained using an optimization-seeking algorithm. A comparative analysis of the hydraulic model performance, inner flow, and energy loss before and after optimization was conducted to explore the effect of different diffuser vane shapes on the performance of volute pumps.

2. Numerical Calculation of Hydraulic Model and Experimental Verification

2.1. Hydraulic Model

The pump model was a vertical single-stage single-suction with a diffuser volute centrifugal pump with design flow Qd = 920 m3/h, head H = 21 m, speed n = 1250 r/min, and specific speed ns = 235. Where the specific speed was calculated from Equation (1).
n s = 3.65 n Q d 1 / 2 H 3 / 4
The 3D modeling of the computational domain including the inlet and outlet pipe was completed by UG NX software, as shown in Figure 1. The volute outlet was located at the side and the cross-section was circular. The number of impeller blades was Zim = 6 and the number of diffuser vanes was Zdi = 8. The remaining design specifics are shown in Table 2.

2.2. Grid Sensitivity Analysis and Numerical Calculation

TurboGrid was used to build the impeller and diffuser mesh. Due to the complex structure of the volute, a hybrid mesh was generated for it with ICEM software, the key walls, such as the spacer tongue, were refined, and all walls were set with boundary layer meshes.
A total of 5 sets of independent meshes with element counts of 2.7 million, 5.02 million, 6.76 million, 9.6 million, and 11.7 million were generated. The results of efficiency and head calculation for the 5 sets of meshes are shown in Figure 2, in which the efficiency curve fluctuates, but the magnitude is not significant and the head curve does not increase significantly after the count of elements reaches 6.76 million. After comprehensive consideration, the third set of meshes was used for subsequent calculations. Part of the mesh is shown in Figure 3, and the number of elements in each domain is shown in Table 3.
The numerical calculation of the pump model was performed using ANSYS CFX software, and the RNG k-ε turbulence model was used to close the N-S equations for solution. In the steady numerical calculation, the inlet boundary condition was the total pressure of 1 atm and the outlet boundary condition was the mass flow rate. The intersection between the impeller and the inlet pipe, and the impeller and the diffuser in the dynamic and static domain were set to Frozen rotor, and the wall was set to smooth. The convergence residual RMS was 10−5, and the maximum number of computational iteration steps was 500.

2.3. Experimental Verification

The comparison of the performance curves obtained from the numerical calculation and the experimental results is shown in Figure 4. The trend of the calculated curve and the test curve was very similar; the calculated efficiency was 87.55% under the design condition and the test efficiency was 87.12%, with a difference of 0.43%. This indicates that the numerical calculation results were accurate.

3. Optimization Process and Setting

3.1. The Kriging Model and Optimization Process

The Kriging model is an interpolation model which originated from geostatistics. The idea was first proposed by Krige [23], a South African mining engineer, in 1951, and then further promoted and applied by Professor Sacks et al. [24] in 1989. It has become a representative agent model in modern optimization methods. Its good ability to approximate nonlinear functions has allowed it to also be used in many applications in pump optimization design. The mathematical expression is shown as Equation (2).
y = i = 1 k β i f i ( x ) + Z ( x )
where f i ( x ) is the basis function of the regression model, β i is the regression coefficient, and Z ( x ) is a stationary stochastic process with mean 0 and covariance as follows:
C o v [ Z ( x i ) , Z ( x j ) ] = σ 2 R ( x i , x j )
where σ 2 is the variance of Z ( x ) , and R ( x i , x j ) is the correlation function between x i and x j . In this paper, the Gaussian function was chosen as the correlation function.
The overall optimization process in this paper is shown in Figure 5. Firstly, the optimization objective, design variables, and their range were determined. Next, multiple sets of data were randomly selected from the design space and divided into two parts, one for model training and the other for model testing, without duplication between the two parts. In the next step, R2 was calculated based on the training and testing results, and if it met the accuracy requirements, the optimal value of the model was found using the optimization-seeking algorithm and the data were recorded; otherwise, the data were sampled again to train the model. The above process was repeated several times, and finally, the optimal result was selected as the optimization result output, and the process was finished.

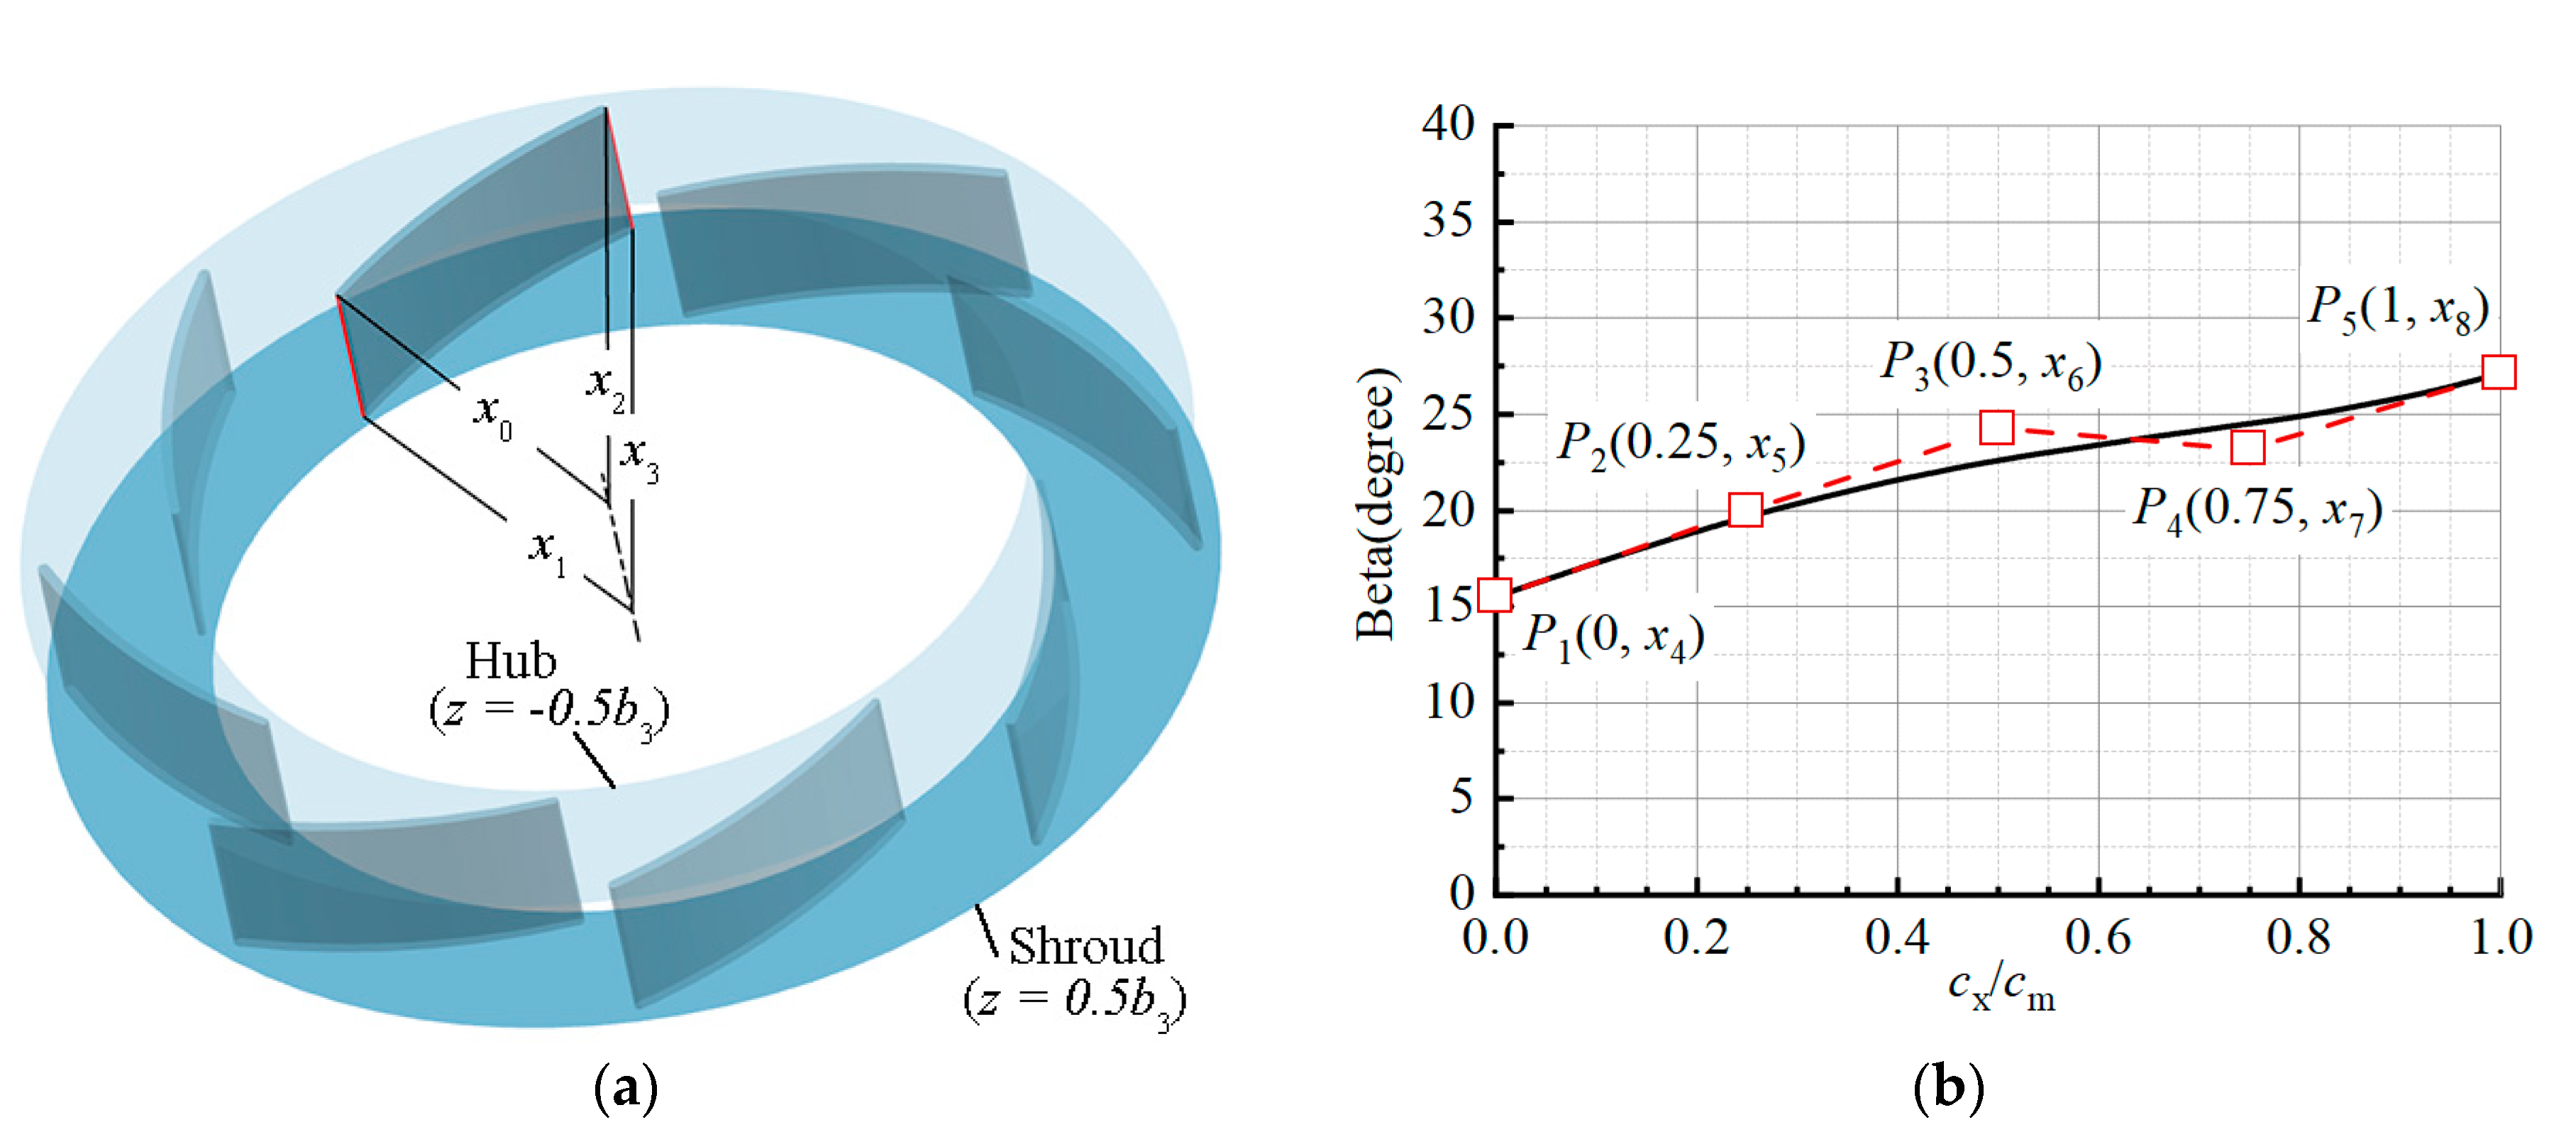
3.2. Optimization Objectives, Design Variables, and Ranges

Hydraulic efficiency is an important energy consumption characterization of the model. Obtaining an efficient hydraulic model, especially for design conditions, is the main goal of pump optimization design. In this paper, the maximum hydraulic efficiency of the model under the design conditions was taken as the optimization objective, which was calculated as follows:
η Q d = ρ g H Q d T ω
where, T is the impeller torque, ω is the impeller angular velocity, H is the model head, and the calculation formula is
H = p 2 t o t p 1 t o t ρ g
where, p 2 t o t is the total pressure at the outlet of the pump, and p 1 t o t is total pressure at the inlet of the pump.
BladeGen was used to complete the parameterization of the diffuser model. In BladeGen, the vane angle curves in the hub plane and shroud plane were fitted with 4th-order Bessel curves to achieve parametric control of the diffuser vane geometry. According to engineering experience, the vane angle, as well as the leading and trailing edges, had a large impact on the performance. A total of 14 design variables, numbered x0x13, were chosen to achieve fine control of the vane shape when combined with the BladeGen software parametric modeling method. Among these variables, x0 and x1 were the distances from the intersection of the leading edge of the diffuser vane with the hub plane and the shroud plane to the central axis of the diffuser, respectively, and x2 and x3 were the distances from the intersection of the trailing edge of the diffuser vane with the hub plane and the shroud plane to the central axis of the diffuser, respectively, as shown in Figure 6a. Variables x4x8 showed the y-coordinate values of the 5 Bezier curve control points in the hub plane, as shown in Figure 6b. Variables x9x13 showed the y-coordinate values of the 5 Bezier curve control points in the shroud plane, with the same graph as the hub plane. The x-coordinates of each Bessel curve control point were evenly distributed and fixed, and the upper and lower boundaries of each design variable are listed in Table 4.

3.3. Samples and Optimization of Process Parameter Setting

A total of 70 sets of data were randomly selected in the design space, of which the first 50 sets were used to train the Kriging model and the remaining 20 sets were used to test. All of them automatically called 3D modeling, meshing, and numerical calculation software to complete the numerical calculation to obtain the corresponding efficiency. Some of the data are listed in Table 5. The series of sampling, training, and testing processes were repeated a total of 50 times. The R2 criterion was greater than or equal to 0.95. After the model was trained to the standard, the GA was used to find the best, and the number of populations of the algorithm was set to 80 and the number of iterations was set to 300.

4. Discussion of Results

4.1. Surrogate Model Check and Comparison of Diffuser Vane Geometry

The R2 analysis method was used to evaluate the prediction accuracy of the model. The evaluation results are shown in Figure 7. It can be seen that the predicted value had good consistency with the actual value, the prediction accuracy was high, and the R2 value was 0.95356, which meets the engineering application standard. The R2 calculation formula is as follows:
R 2 = 1 i = 1 n ( y ^ i y i ) 2 i = 1 n ( y i y ¯ ) 2
where y ^ i is the predicted value, y i is the actual value, y ¯ is the average value, and n is the number of test points.
Table 6 shows the values of each design variable before and after optimization. All of them changed significantly except for x4 and x12. The vane inlet angle x4 in the hub plane and the vane inlet angle x9 in the shroud plane were no longer consistent. Meanwhile, the leading edge on the hub plane was closer to the center axis (x0 < x1) than on the shroud plane, indicating that the vane became twisted, which was also reflected in the optimized diffuser vane 3D model in Figure 8. The hub plane and the shroud plane vane outlet angle x8, x13 was still relatively consistent. It can also be seen in Figure 8 that the hub plane and the shroud plane vane wrap angle were no longer the same, the shroud plane wrap angle was larger and the optimized model leading edge was thinner than the original model. These changes resulted in less diffusion in the flow path between the diffuser vanes and a tighter inner flow.

4.2. Hydraulic Performance Curve Analysis

Figure 9 demonstrates the hydraulic performance curves of the optimized model compared with the original model in all working conditions. The efficiency under design conditions and part-load conditions was greatly improved. The efficiency was improved by 3.36% and 3.4% under 0.6 Qd and 0.8 Qd conditions, respectively, by 2.65% under design conditions, and the high efficiency area was widened. Meanwhile, the efficiency decreased under the over-load condition 1.1 Qd, but only by 1.69%, so the efficiency of the optimized model can still be considered to have substantial improvement. Similarly, the model head also had a substantial increase under the design condition and part-load condition. Head under the design condition was increased by 0.83 m, while the high flow condition was slightly reduced. The model power decreased under the part-load condition and the design condition and over-load condition were consistent with the original model, indicating that the optimized model had better hydraulic performance and lower energy consumption, which ultimately achieved the goal of optimization.

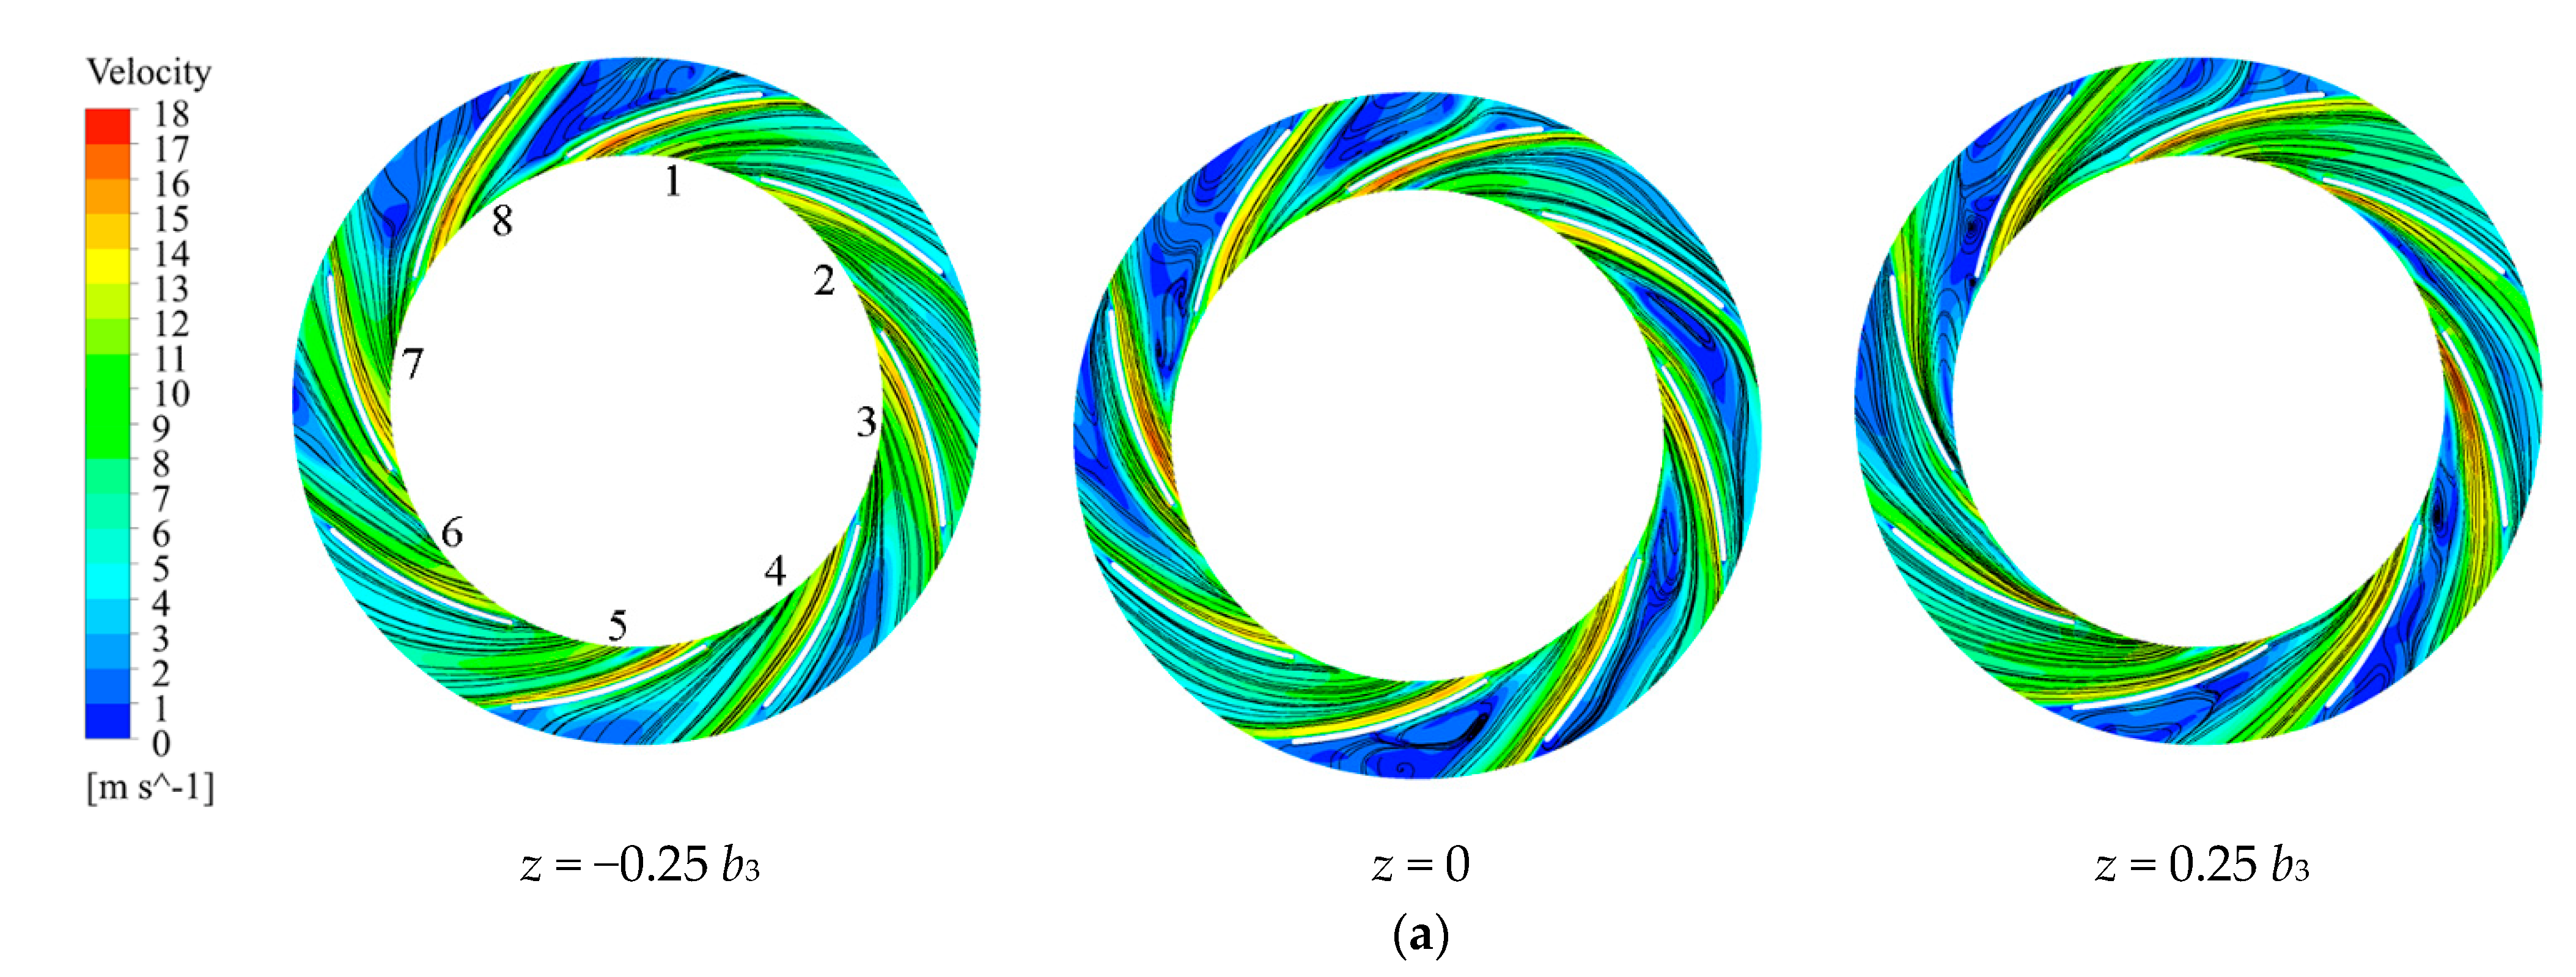
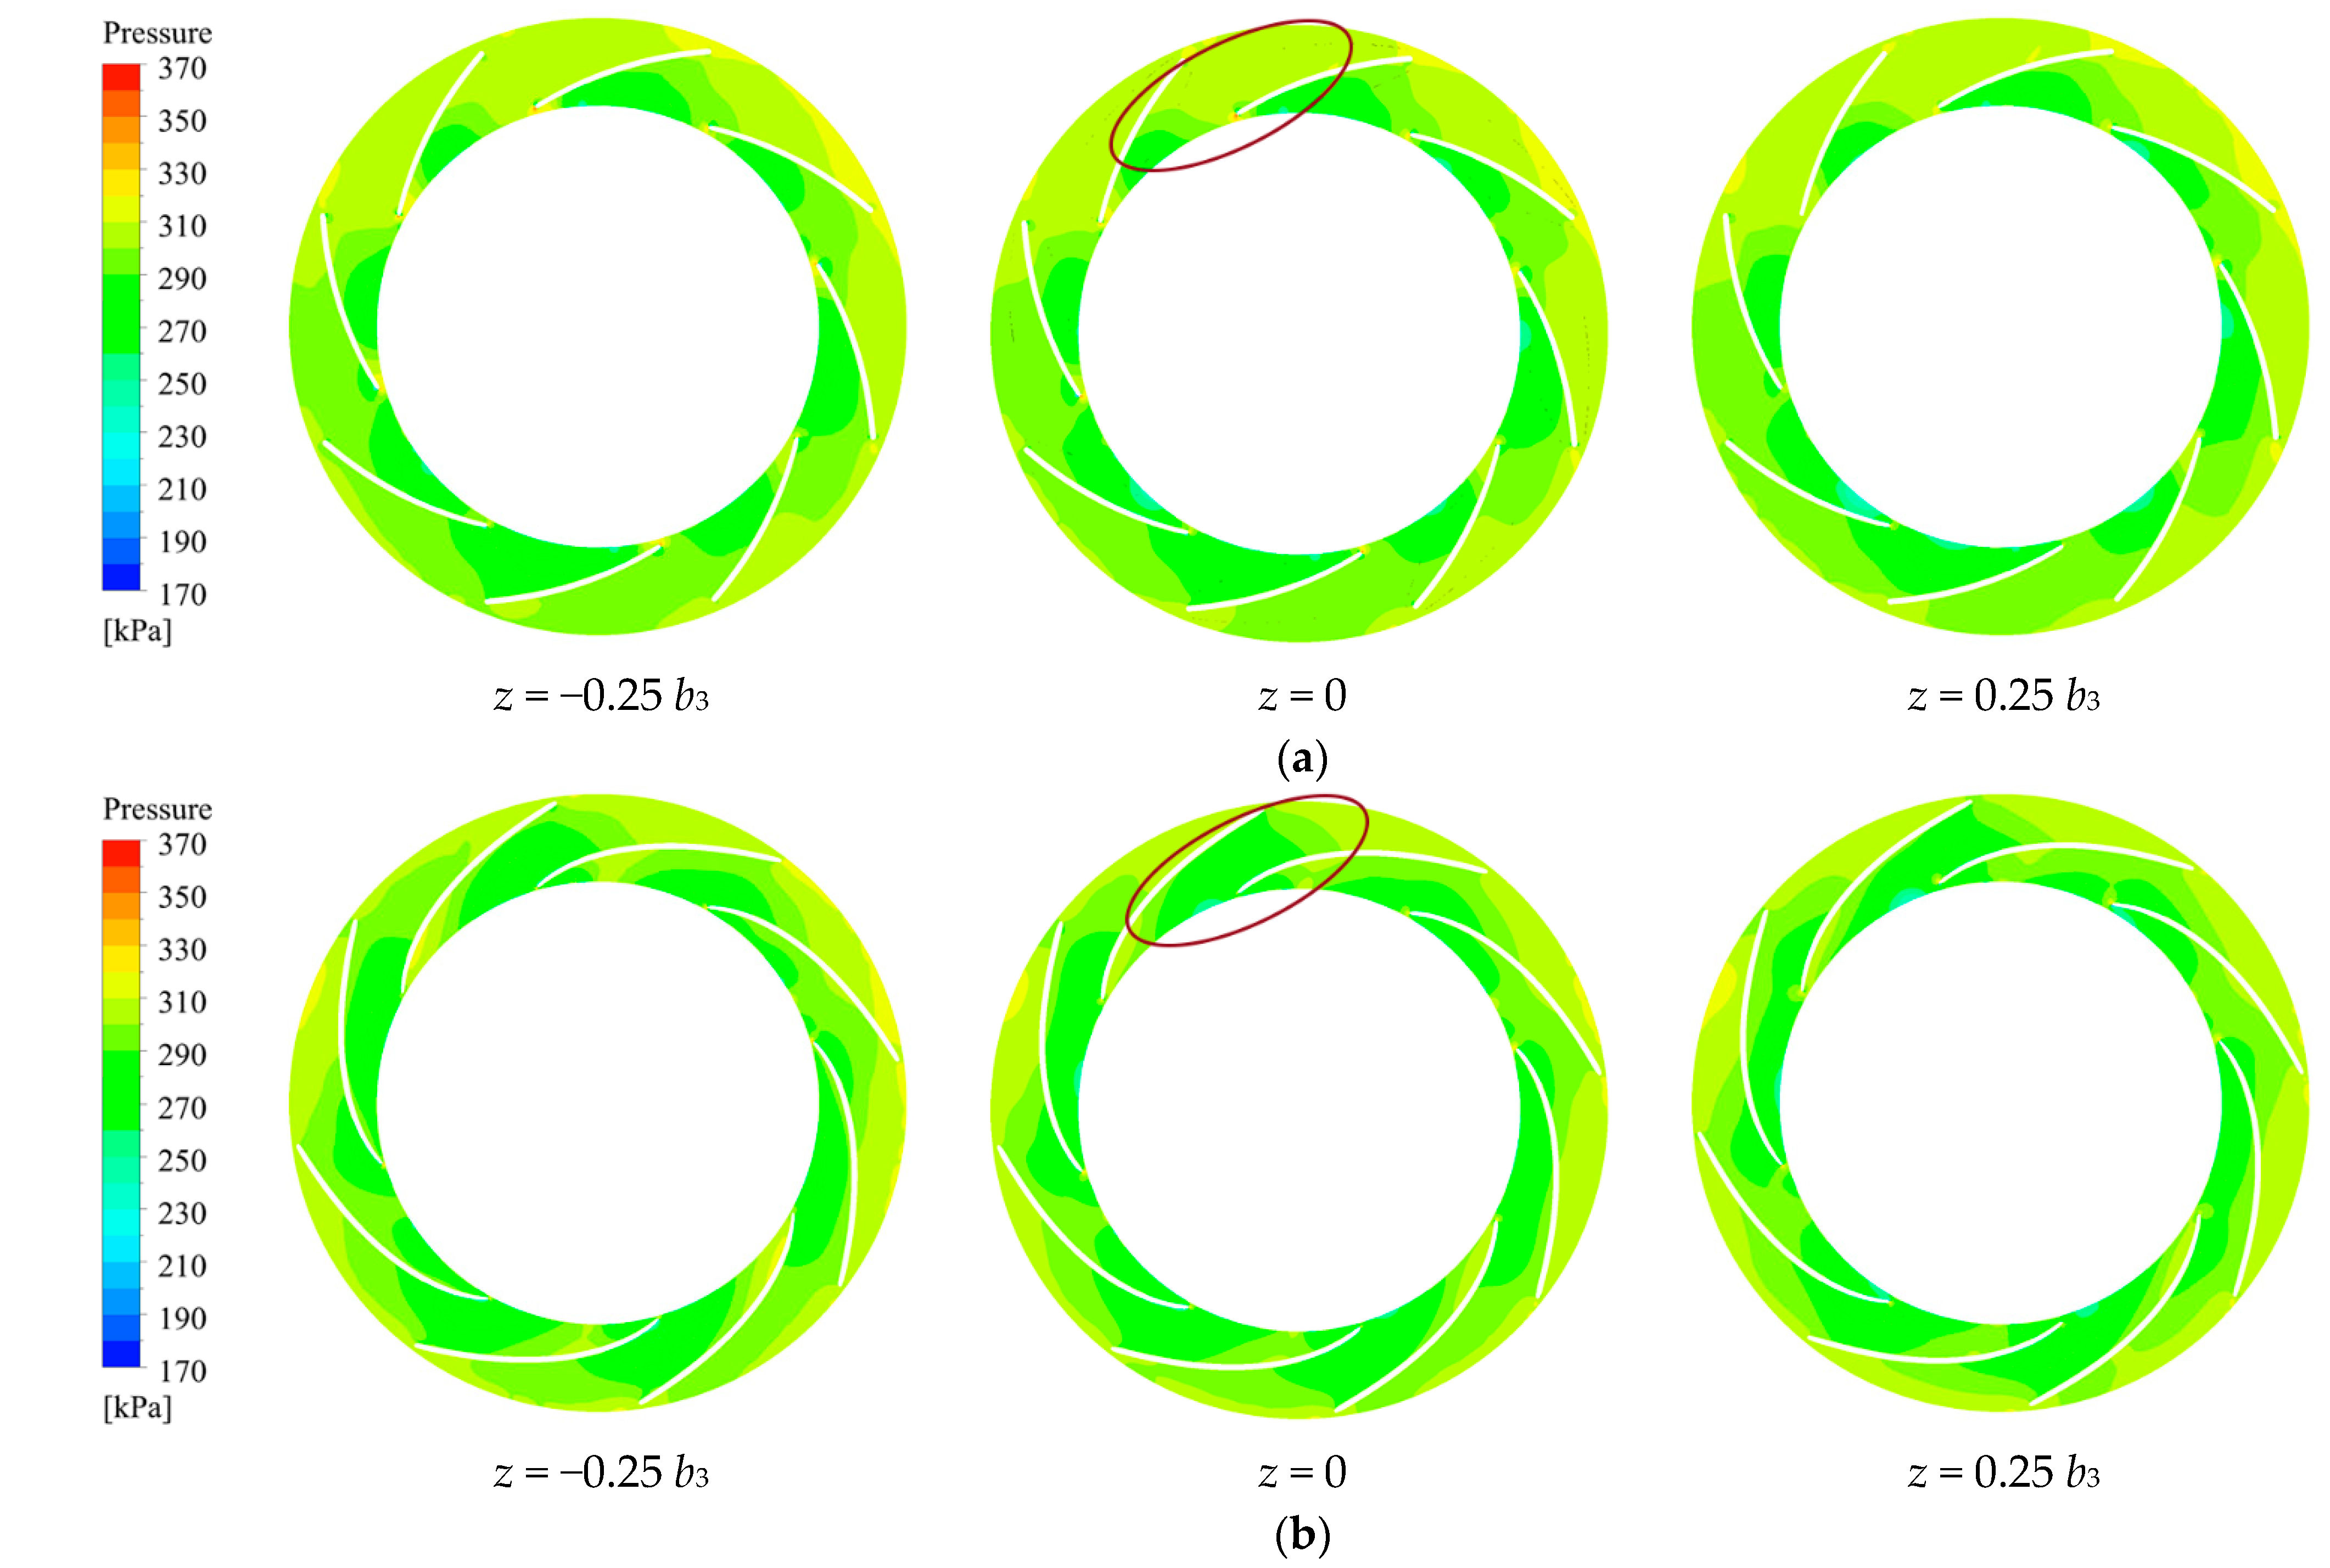
4.3. Inner Flow Analysis

Figure 10 showed the velocity distribution and streamlines within the diffuser in different z-planes, respectively. For the convenience of description, the flow paths between the diffuser vanes were numbered from one to eight in a clockwise direction, respectively. It can be seen that the original model (Figure 10a) had a wide range of low-speed areas and vortex areas in the flow path, and these vortices blocked the flow path and seriously affected the performance. In the z = −0.25 b3 plane, the low-speed area was mainly distributed in the middle and outside of runners three and seven, outside of runner four, in most of runner eight, and there were also small low-speed areas outside of runner six. Most of these low-speed areas were near the back of the vane where the streamlines began to spread out and the flow separation phenomenon occurred. In runner eight, where the flow separation was most severe, the annular streamlines on the outside indicate that a vortex had developed in this area. The situation in the z = 0 plane was more severe, except for the runner five, which was good, the rest of the runners near the back side of the vane had a wide range of flow separation and vortex phenomenon. The streamlines on the outside of runners one and two turned at a large angle and extended along the outer circle of the diffuser, indicating that the flow in the volute on the outside of the diffuser was also not optimistic. The z = 0.25 b3 plane was slightly better than the z = 0 plane, the streamlines in runners one and five were more satisfactory, while the rest of the runners also had flow separation and vortex phenomenon. These low-speed areas had a common feature, their locations were located in the runner near the back side of the vane.
Compared to the original model, the streamlines between the diffuser vanes of the optimized model (Figure 10b) were improved significantly. The large low-speed area almost disappeared, only two vortices affecting three planes were outside of runners seven and three near the back of the vane, and a small low-speed area outside of runner four near the back of the vane also affected three planes. All other low-speed areas did not affect all planes and were small enough to have little effect on the streamlines. Overall, compared with the original model, the optimized model had a tighter streamline between the diffuser vanes, and there was no large range of low-speed areas blocking the flow paths. These inner flow changes resulted in improved hydraulic performance in the diffuser.
Figure 11 shows the pressure distribution in the diffuser in different z-planes. The pressure distribution between different planes was slightly different, but the difference was not significant. The pressure distribution grew gradually throughout the flow channel from inside to outside in the original model, with the blade working surface pressure being greater than the back, and the leading edge seeming high-pressure point due to direct fluid impact. Comparing the optimized model (Figure 11b) with the original model (Figure 11a), the pressure gradient variation in the diffuser of the optimized model was reduced, which was beneficial to pressure recovery and reduced energy loss. The point with high pressure disappeared because the vane leading edge became thinner and the intensity of direct impact by fluid was reduced.
Based on the content of this paper, the collaborative optimization design of a hydraulic model for multiple operating conditions can be a further research direction to improve the current situation where the performance of the optimized model decreases under the over-load condition. Additionally, further research into the unsteady performance of the optimized model, considering the pressure fluctuation strength as the optimization objective to improve the operational stability of the volute pump, is recommended.

5. Conclusions

In this paper, 14 parameters from the 3D diffuser of the volute pump were selected as design variables, and the model efficiency under design conditions was taken as the optimization objective. The diffuser was optimized based on the Kriging model and GA, and the hydraulic performance of the volute pump before and after optimization was compared and analyzed. The following conclusions were obtained:
(1)
The Kriging model can effectively establish the high-precision nonlinear mathematical relationship between the selected 14 design variables and the optimization objectives with an R2 value of 0.95356, which can meet the engineering needs.
(2)
The hydraulic performance of the optimized model under design conditions and part-load conditions was greatly improved, the efficiency under design conditions was increased by 2.65%, and the head was increased by 0.83m under the premise that the power was relatively the same.
(3)
The inner flow of the optimized model was significantly improved under the design condition, the large low-speed area and vortex area disappeared, and the pressure gradient change was reduced, which reduced the energy loss.

Author Contributions

Conceptualization, J.P. and W.W.; methodology, Z.H. and W.W.; software, Z.H. and W.W.; validation, C.H.; formal analysis, Z.H.; data curation, Z.H.; writing—original draft preparation, Z.H.; writing—review and editing, J.P. and W.W. All authors have read and agreed to the published version of the manuscript.

Funding

This research was funded by the Natural Science Foundation of Jiangsu Province (Grant No. 8 BK20190851), the Natural Science Foundation of China (Grant No. 51879121), and Primary Research & 9 Development Plan of Jiangsu Province (Grant No. BE2019009-1).

Conflicts of Interest

The authors declare no conflict of interest.

Nomenclature

Qd (m3/h)Design flow rate
H (m)Pump head
H (%)Pump efficiency
n (r/min)Rotational speed
nsSpecific speed
ZimNumber of impeller blades
ZdiNumber of diffuser vanes
Dj (mm)Impeller inlet diameter
D2 (mm)Impeller outlet diameter
b2 (mm)Impeller outlet width
β1 (degree)Impeller inlet blade angle
β2 (degree)Impeller outlet blade angle
φ (degree)Wrap angle of impeller blade
D3 (mm)Diffuser inlet diameter
D4 (mm)Diffuser outlet diameter
b3 (mm)Diffuser width
b5 (mm)Volute inlet width
D5 (mm)Volute base circle diameter
D6 (mm)Volute outlet diameter
T (N)Impeller torque
Ω (rad/s)Impeller angular velocity
ρ (kg/m3)Water density
p1tot (Pa)Total pressure at inlet of the pump
p2tot (Pa)Total pressure at outlet of the pump

References

  1. Sakran, H.K.; Abdul Aziz, M.S.; Abdullah, M.Z.; Khor, C.Y. Effects of Blade Number on the Centrifugal Pump Performance: A Review. Arab. J. Sci. Eng. 2022, 1–17. [Google Scholar] [CrossRef]
  2. Arun Shankar, V.K.; Umashankar, S.; Paramasivam, S.; Hanigovszki, N. A Comprehensive Review on Energy Efficiency Enhancement Initiatives in Centrifugal Pumping System. Appl. Energy 2016, 181, 495–513. [Google Scholar] [CrossRef]
  3. Liu, M.; Tan, L.; Cao, S. Performance Prediction and Geometry Optimization for Application of Pump as Turbine: A Review. Front. Energy Res. 2022, 9, 818118. [Google Scholar] [CrossRef]
  4. Al-Obaidi, A.R. Influence of Guide Vanes on the Flow Fields and Performance of Axial Pump under Unsteady Flow Conditions: Numerical Study. JMES 2020, 14, 6570–6593. [Google Scholar] [CrossRef]
  5. Bai, L.; Zhou, L.; Han, C.; Zhu, Y.; Shi, W. Numerical Study of Pressure Fluctuation and Unsteady Flow in a Centrifugal Pump. Processes 2019, 7, 354. [Google Scholar] [CrossRef] [Green Version]
  6. Yang, J.; Pavesi, G.; Liu, X.; Xie, T.; Liu, J. Unsteady Flow Characteristics Regarding Hump Instability in the First Stage of a Multistage Pump-Turbine in Pump Mode. Renew. Energy 2018, 127, 377–385. [Google Scholar] [CrossRef]
  7. Li, Z.; Zheng, X. Review of Design Optimization Methods for Turbomachinery Aerodynamics. Prog. Aerosp. Sci. 2017, 93, 1–23. [Google Scholar] [CrossRef]
  8. Cho, S.; Kim, M.; Lyu, B.; Moon, I. Optimization of an Explosive Waste Incinerator via an Artificial Neural Network Surrogate Model. Chem. Eng. J. 2021, 407, 126659. [Google Scholar] [CrossRef]
  9. Zhang, X.; Xie, F.; Ji, T.; Zhu, Z.; Zheng, Y. Multi-Fidelity Deep Neural Network Surrogate Model for Aerodynamic Shape Optimization. Comput. Methods Appl. Mech. Eng. 2021, 373, 113485. [Google Scholar] [CrossRef]
  10. Keshtegar, B.; Mert, C.; Kisi, O. Comparison of Four Heuristic Regression Techniques in Solar Radiation Modeling: Kriging Method vs RSM, MARS and M5 Model Tree. Renew. Sustain. Energy Rev. 2018, 81, 330–341. [Google Scholar] [CrossRef]
  11. Ren, C.; Aoues, Y.; Lemosse, D.; Souza De Cursi, E. Ensemble of Surrogates Combining Kriging and Artificial Neural Networks for Reliability Analysis with Local Goodness Measurement. Struct. Saf. 2022, 96, 102186. [Google Scholar] [CrossRef]
  12. Hasanipanah, M.; Meng, D.; Keshtegar, B.; Trung, N.-T.; Thai, D.-K. Nonlinear Models Based on Enhanced Kriging Interpolation for Prediction of Rock Joint Shear Strength. Neural Comput. Appl. 2021, 33, 4205–4215. [Google Scholar] [CrossRef]
  13. Tong, S.; Zhao, H.; Liu, H.; Yu, Y.; Li, J.; Cong, F. Multi-Objective Optimization of Multistage Centrifugal Pump Based on Surrogate Model. J. Fluids Eng. 2019, 142, 011101. [Google Scholar] [CrossRef]
  14. De Donno, R.; Ghidoni, A.; Noventa, G.; Rebay, S. Shape Optimization of the ERCOFTAC Centrifugal Pump Impeller Using Open-Source Software. Optim. Eng. 2019, 20, 929–953. [Google Scholar] [CrossRef]
  15. Ma, S.-B.; Kim, S.; Kim, J.-H. Optimization Design of a Two-Vane Pump for Wastewater Treatment Using Machine-Learning-Based Surrogate Modeling. Processes 2020, 8, 1170. [Google Scholar] [CrossRef]
  16. Jaiswal, A.K.; Siddique, M.H.; Paul, A.R.; Samad, A. Surrogate-Based Design Optimization of a Centrifugal Pump Impeller. Eng. Optim. 2021, 1–18. [Google Scholar] [CrossRef]
  17. Chen, X.B.; Zhang, R.H.; Yang, W.F. Inverse Design and Optimization of Low Specific Speed Centrifugal Pump Blade Based on Adaptive POD Hybrid Model. J. Appl. Fluid Mech. 2022, 15, 453–464. [Google Scholar] [CrossRef]
  18. Gan, X.; Pei, J.; Yuan, S.; Wang, W.; Tang, Y. Multi-Objective Optimization on Inlet Pipe of a Vertical Inline Pump Based on Genetic Algorithm and Artificial Neural Network. In Proceedings of the Volume 1: Flow Manipulation and Active Control; Bio-Inspired Fluid Mechanics; Boundary Layer and High-Speed Flows; Fluids Engineering Education; Transport Phenomena in Energy Conversion and Mixing; Turbulent Flows; Vortex Dynamics; DNS/LES and Hybrid RANS/LES Methods; Fluid Structure Interaction; Fluid Dynamics of Wind Energy; Bubble, Droplet, and Aerosol Dynamics, Montreal, QC, Canada, 15–20 July 2018; American Society of Mechanical Engineers: New York, NY, USA, 2018; p. V001T06A003. [Google Scholar]
  19. Posa, A.; Lippolis, A. Effect of Working Conditions and Diffuser Setting Angle on Pressure Fluctuations within a Centrifugal Pump. Int. J. Heat Fluid Flow 2019, 75, 44–60. [Google Scholar] [CrossRef]
  20. Yang, G.; Zhao, X.; Zhang, D.; Geng, L.; Yang, X.; Gao, X. Hydraulic Components’ Matching Optimization Design and Entropy Production Analysis in a Large Vertical Centrifugal Pump. J. Mech. Sci. Technol. 2021, 35, 5033–5048. [Google Scholar] [CrossRef]
  21. Lai, F.; Zhu, X.; Li, G.; Zhu, L.; Wang, F. Numerical Research on the Energy Loss of a Single-Stage Centrifugal Pump with Different Vaned Diffuser Outlet Diameters. Energy Procedia 2019, 158, 5523–5528. [Google Scholar] [CrossRef]
  22. Wang, W.; Pei, J.; Yuan, S.; Yin, T. Experimental Investigation on Clocking Effect of Vaned Diffuser on Performance Characteristics and Pressure Pulsations in a Centrifugal Pump. Exp. Therm. Fluid Sci. 2018, 90, 286–298. [Google Scholar] [CrossRef]
  23. Krige, D.G. A Statistical Approach to Some Basic Mine Valuation Problems on the Witwatersrand. J. Chem. Metall. Min. Eng. Soc. S. Afr. 1951, 52, 119–139. [Google Scholar]
  24. Sacks, J.; Welch, W.J.; Mitchell, T.J.; Wynn, H.P. Design and Analysisi of Computer Experiments. Stat. Sci. 1989, 4, 409–423. [Google Scholar]
Figure 1. Computational domain of the volute pump.
Processes 10 01076 g001
Figure 2. Results of grid sensitivity analysis.
Processes 10 01076 g002
Figure 3. Mesh of the calculation domain: overall (a), the volute and impeller (b), the diffuser (c).
Processes 10 01076 g003
Figure 4. Comparison of calculated results with experimental results.
Processes 10 01076 g004
Figure 5. The process of optimization.
Processes 10 01076 g005
Figure 6. Schematic diagram of design variables: x0x3 (a), x4x8 (b).
Processes 10 01076 g006
Figure 7. R2 analysis of efficiency.
Processes 10 01076 g007
Figure 8. Comparison of 3D diffuser vanes.
Processes 10 01076 g008
Figure 9. Comparison of hydraulic performance.
Processes 10 01076 g009
Figure 10. Comparison of different z-plane speeds and streamlines before (a) and after (b) optimization.
Processes 10 01076 g010aProcesses 10 01076 g010b
Figure 11. Comparison of different z-plane pressures before (a) and after (b) optimization.
Processes 10 01076 g011
Table 1. Comparison of the advantages and disadvantages of different optimization methods.
MethodsContentsAdvantagesDisadvantages
Design of experimentsTaguchi experimental designShort optimization period,
easy to obtain optimal solution
The design parameters are limited and the resulting solution is not optimal
Surrogate modelsArtificial neural network
Kriging model
Response surface method
Short optimization period and low consumption of computational resourcesThere are errors between the surrogate model and the actual
Intelligent algorithmsGenetic algorithms
Particle swarm algorithms
Gravitational search algorithms
Multiple design parametersLong optimization period and high consumption of computational resources
Table 2. Design specifics of the volute pump.
Design ParametersSymbolValue
Impeller inlet diameterDj (mm)270
Impeller outlet diameterD2 (mm)360
Impeller outlet widthb2 (mm)70.5
Impeller inlet blade angleβ1 (degree)24
Impeller outlet blade angleβ2 (degree)22
Wrap angle of impeller bladeφ (degree)136
Diffuser inlet diameterD3 (mm)365
Diffuser outlet diameterD4 (mm)505
Diffuser widthb3 (mm)72
Volute inlet widthb5 (mm)72
Volute base circle diameterD5 (mm)440
Volute outlet diameterD6 (mm)350
Table 3. Number of elements in each domain.
DomainNumber of Elements (×104)
Inlet pipe36.5
Impeller217.3
Diffuser207.7
Volute189.3
Outlet pipe25.5
Table 4. Design variable boundaries.
Variablesx0x1x2x3x4x5x6x7x8x9x10x11x12x13
Upper Bound0.190.190.2520.25230404040303040404030
Lower Bounds0.1840.1840.2420.24215101010221510101022
Table 5. Partial sample data.
No.123456667686970
x00.18870.18630.18950.18750.18990.187080.184990.185870.187330.18673
x10.18530.18690.18650.187430.18590.186810.18740.187750.187380.1873
x20.24950.25150.244170.2520.248830.25050.2520.2520.251170.24917
x30.244170.251830.250830.249560.246830.2520.249630.24870.2520.25066
x423.2528.2526.753015.2522.2526.753027.2530
x524.512.515.511.9326.512.7515.4110.3417.1513
x635.514.512.511.522.526.514.51011.318.5
x734.510.526.510.530.513.521.51018.510
x822.422.1325.3324.526.132225.7323.7323.3123.66
x928.7519.2515.2522.7517.7522.2520.2521.2921.4419.5
x1026.528.521.514.7619.526.7520.9121.3725.1321.79
x1110.526.514.517.4325.529.5224.8616.521.7618.96
x1229.515.537.517.2219.516.6414.8215.9921.513.53
x1324.2729.8729.3328.2623.7329.0727.3226.82828.27
η (%)84.786.4984.8287.584.6584.9885.6387.7285.8486.55
Table 6. Comparison of design variables of diffuser.
Variablesx0x1x2x3x4x5x6x7x8x9x10x11x12x13
Before0.187740.187740.24840.248415.5319.9724.2423.227.1515.5319.9724.2423.227.15
After0.184260.189860.251710.2516916.1511.2811.5610.1422.1729.5911.8610.3123.3522.58
Publisher’s Note: MDPI stays neutral with regard to jurisdictional claims in published maps and institutional affiliations.

