Article

Heat-Integration of Solar-Heated Membrane Distillation and Fuel Cell for Desalination System Based on the Dynamic Optimization Approach

by
Yu-Hsin Liu
,
Vincentius Surya Kurnia Adi
* and
Shing-Yi Suen
Department of Chemical Engineering, National Chung Hsing University, Taichung 40227, Taiwan
*
Author to whom correspondence should be addressed.
Processes 2022, 10(4), 663; https://doi.org/10.3390/pr10040663
Submission received: 28 January 2022 / Revised: 17 March 2022 / Accepted: 22 March 2022 / Published: 29 March 2022
(This article belongs to the Special Issue Design and Optimization in Process Engineering)

Abstract

:
The heat integration feasibility of the proton exchange membrane fuel cell (PEMFC) coupled with the solar-heated direct contact membrane distillation (DCMD) module is evaluated in this study. The additional waste heat from the PEMFC increases the DCMD system’s ability to produce fresh water and electricity. Two systems units to be assessed mainly include a flat plate solar collector, a heat storage tank with an internal heat exchanger, and the DCMD module with and without the PEMFC module. The importance of daily operation continuity is emphasized through a preliminary dynamic simulation and proper sizing of the solar-heated DCMD distillation. Sensitivity analysis is implemented to analyze the relationship between the essential variables and the daily freshwater production. The design variables of both configurations are rigorously optimized in terms of minimum unit production cost (UPC). The proposed heat integration feasibility is evaluated to obtain critical insights on the design strategy of the hybrid systems.

Graphical Abstract

1. Introduction

The desalination technology includes thermal distillation and membrane separation. Traditionally, the leading separation technologies are the multi-stage flash (MSF) and reverse osmosis (RO). Note that the separation methods above need high energy consumption and costs [1]. Membrane distillation (MD) is considered as the combination of the above technologies. Currently, there are many applications in MD technology for industrial and scientific fields, including the pharmaceutical industry, wastewater treatment, and desalination. MD technology is utilized mainly to separate the contaminants from liquid solutions and produce the high-purity permeates [2]. Therefore, MD gradually becomes an alternative to traditional distillation techniques. Its main advantages compared with conventional technology are (1) lower operating temperature and hydrostatic pressure, (2) non-volatile material removal rate is close to 100%, (3) low resistance for mass transfer between gas and liquid (high permeability), (4) low sensitivity to salt concentration, and (5) the membrane properties are not easily affected on the high osmotic pressure or concentration polarization [3].
MD is a non-isothermal separation process. By utilizing the microporous and hydrophobic surfaces, MD exploits the temperature gradient’s vapor pressure difference by the two sides of the membrane. Thus, it drives the vapor molecules to diffuse through the permeate side of the membrane. There are the potentials for MD systems to be combined with renewable energy such as solar energy [4,5,6] and/or industrial waste heat [7,8,9,10]. MD’s heat and mass transfer occurs from the feed side through its boundary layer across the membrane and then passes to the permeate side. As the heat and mass transfer happen simultaneously, the mass transfer affects the rate and heat transfer coefficient [11]. The design of MD must consider the flow state, structural uniformity, packing density, pressure drop, thermal stability, and recovery to ensure well flow conditions [12]. Significantly, the hollow fiber membrane module can achieve high permeation. At the same time, the structure is simple with good ductility, high packing density, and a large surface area per unit volume without any structural support. The feed can easily flow in the fiber’s pores, and the permeate is collected from the shell wall of the membrane. Thus, the hollow fiber membrane module is easier to use than those of frame or spiral one [13].
On the other hand, the fuel cell is an energy conversion device that generates electricity, heat, and water by electrochemical reaction. Hydrogen and oxygen are fed through an electrode without burning any fossil fuel. The proton exchange membrane fuel cell (PEMFC) has been widely applied due to its advantages: high power density, low operating temperature, fast power-up, and long life [14,15,16]. However, the PEMFC will produce almost equal waste heat and electricity during the steady-state operation, so its energy efficiency is usually limited to 50–60%. An additional cooling system is needed to remove the waste heat and maintain the PEMFC’s temperature uniformity [17]. Hasani and Rahbar [18] proposed an experimental study to evaluate the waste heat recovery system performance of the PEMFC. Lai et al. [9] proposed a hybrid PEMFC and direct contact membrane distillation (DCMD) module to simultaneously use the waste heat generated by a PEMFC for desalination. The operating parameters of the hybrid system were analyzed and optimized with a genetic algorithm. Unfortunately, the economic aspects were not addressed and there were no constraints implemented on maintaining the daily production continuity of the hybrid system.
There is the potential that the combination of a PEMFC with DCMD can be rigorously optimized to achieve the maximum energy gain. The combined hybrid system is also believed to be more efficient than a single PEMFC, although there is a concern about fuel cells as hydrogen is hazardous and flammable, thus sacrificing the safety of the desalination technology. Still, we are yet to see any failing industrial fuel cells due to the high safety standards. There is a lack of literature on PEMFC and DCMD design; however, many scholars explore the availability of renewable energy. Combining with renewable energy, i.e., solar power, its inherent disadvantage will depend on geographical location and environmental conditions. Therefore, the hybrid renewable energy system should be combined with an alternative continuous energy supply to provide stability [19].
In recent years, there has been very little literature on applying hybrid systems of PEMFC and DCMD instead of providing only electricity for a PEMFC. PEMFC and DCMD hybrid multi-generation systems can simultaneously produce freshwater and electricity. Ghobeity et al. [20] designed the solar electrothermic plant of combined heat and power generation system. The solar pond collects solar irradiation and is incorporated into the Rankine cycle. It has a turbine to generate electricity and uses reverse osmosis and efficient distillation for water production. The meteorological model is used to estimate the local solar irradiation for dynamic simulation. Subsequently, the heuristic global optimization method is used to obtain the maximum power and water production. Mohan et al. [21] proposed the solar generation system for cooling water, freshwater, and hot water production. Three different solar collectors, along with the local weather conditions, are considered for dynamic simulation. Note that the design of hybrid systems may be affected by environmental, energy availability, or technology. In this situation, it is necessary to optimize the combination size to improve its energy efficiency or decrease its cost. In addition, to conform with the actual operating conditions, that optimal design should also consider the ambient temperature, solar irradiation, or seawater temperature.
This work is intended to provide insights on improving traditional distillation technology with hybrid DCMD and PEMFC of a multi-generation system to produce freshwater and electricity. The heat integration feasibility of a proton exchange membrane fuel cell (PEMFC) coupled with solar-heated DCMD module will be studied in this work. It is expected that with the PEMFC integration, the overall system may benefit from higher throughput and some economic advantages. The novelty of rigorous dynamic optimization and daily production continuity constraints are introduced in the subsequent sections to ensure the operability of the optimal design.
This work is organized as follows: Section 2 is dedicated to the mathematical models and verifications of the corresponding unit operations in a PEMFC and DCMD. Section 3 describes the optimization procedure of the multi-generation systems. The case study and optimization results are discussed in Section 4. Finally, conclusions are given in the last section.

2. Mathematical Models of DCMD and PEMFC

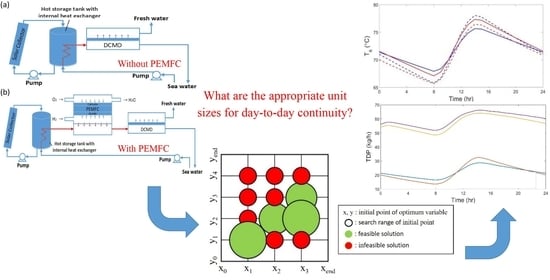
2.1. System Description

In this study, the membrane distillation systems of two heating methods were discussed. The one is the solar-heated membrane distillation system, and the other is the PEMFC coupled solar-heated membrane distillation system, as shown in Figure 1. There are two loops in both systems. The primary closed-loop consists of circulating working fluid, i.e., pure water, to collect heat from solar irradiation. The secondary open-loop consists of the seawater heated by the heat storage tank with an internal heat exchanger. Then, the heated seawater will enter the DCMD module for freshwater production, and the remaining undistilled concentrated seawater will be discharged into the sea. The second system is an improved design of the original configuration that adds the PEMFC in the secondary open-loop of the system. Due to the unstable supply of solar radiation, the seawater sometimes cannot reach the required temperature for entering the membrane. Therefore, the waste heat of the PEMFC is used for preheating to increase seawater temperature and water production. The location of the PEMFC is particularly chosen to be right before the DCMD module to ensure the controllability and quick action for the DCMD feed water inlet temperature. The mathematical model of each system unit includes the solar flat plate collector, the heat storage tank with internal heat exchanger, the hollow fiber DCMD module, and the PEMFC module. The following subsections will establish the mass balance and energy balance for each module.

2.1.1. Solar Collector

The solar flat plate collector is the primary source of thermal energy in this study. The heat from the solar radiation is absorbed and then transferred to the working fluid. The working fluid loops continuously through the collector following the circulation pump direction. The surface of the collector uses a transparent glass cover for solar radiation absorption. In contrast, the other parts use adiabatic materials to reduce heat loss. This work refers to the theoretical model and the parameters by Farahat et al. [22]. The parameters are shown in Table 1 and follow the assumptions: (i) The pressure drop in the wall of the collector is negligible, (ii) the temperature of working fluid is maintained below 100 °C to avoid boiling, and (iii) steady-state operation in the collector.
The Hottel–Whillier equation for the heat absorbed (Qsc) by the solar collector, considering the heat losses from the solar collector to the atmosphere, is
Q sc = A sc F r S   U sc T fi   T a
where Tfi and Ta are the temperatures of fluid into the collector and the ambient temperature, respectively. S and Fr are the radiation flux absorbed by the absorber area of the collector and the heat removal factor, which are defined as
S = η o I
F r = m f   C pf A sc   U sc 1   exp F sc   U sc   A sc m f   C pf
The Qsc by the working fluid is
Q sc =   m f C pf   T fo T fi

2.1.2. Heat Storage Tank with Internal Heat Exchanger

In this study, the heat storage tank is used to store the obtained solar heat energy and prolong the operation due to the unstable supply of solar radiation. The heat storage tank temperature (Ts) and internal heat exchanger outlet temperature (Tho) are computed according to the theoretical model and the parameters by Badescu [23]. Note that the corresponding parameters are shown in Table 1. It is assumed that the heat losses on the duct connecting the solar collector and the storage tank are neglected. The water is uniformly mixed in the closed-loop to simplify the model.
The energy balance of the water in the storage tank is
M s C pf d T s d t = Q sc Q s Q h
where Qsc is the heat flux transferred from the solar collector to the heat storage tank, which can be divided into two cases:
(1)
The collector outlet temperature (Tfo) is higher than the heat storage tank temperature (Ts).
(2)
The collector outlet temperature (Tfo) is lower than the heat storage tank temperature (Ts), which means the collector does not obtain any energy.
Q sc = m f   C pf   T fo T s ,   T fo     T s 0 ,   T fo   <   T s
Qs is the heat flux lost through the storage tank walls, defined as
Q s = U s A s T s T a
Qh is the heat flux provided to the seawater in the secondary circuit, defined as
Q h = m h C ph T ho T hi = U h A h T s T ho

2.1.3. The Hollow Fiber DCMD Module

This work refers to the theoretical model and the unidimensional hollow fiber direct contact membrane distillation module parameters by Cheng et al. [24]. The model considers the heat transfer, mass transfer, and transport behavior between the feed side, across the membrane, and the permeate side that follows the assumptions: (i) steady incompressible flow, (ii) feed is Newtonian fluid and unidirectional flow, (iii) the fibers are distributed regularly within the shell of the module, (iv) axial diffusion is negligible, and (v) heat loss to the ambient environment is negligible. For brevity and to avoid repetitions with the previous literature, the model details, the computational procedures, and the model verification with experimental data are provided in the Supplementary Materials.

2.1.4. The PEMFC Module

Proton exchange membrane fuel cells (PEMFCs) are electrochemistry modules that directly convert chemical energy into electrical and thermal energy. This work is according to the theoretical model and the parameters established by Hu et al. [16]. The model can calculate the fluid outlet temperature of the PEMFC (Tst). The parameters are shown in Table 1 and follow the assumptions: (i) at steady-state operation, the temperature and pressure distribution in the PEMFC are consistent, (ii) the vapor is saturated in the PEMFC, (iii) the generated water is in a liquid state at PEMFC working temperature, and (iv) the outlet temperature of the fluid is equal to the operating temperature of the fuel cell. Again, for the sake of brevity, the model details and the computational procedures are provided in the Supplementary Materials.

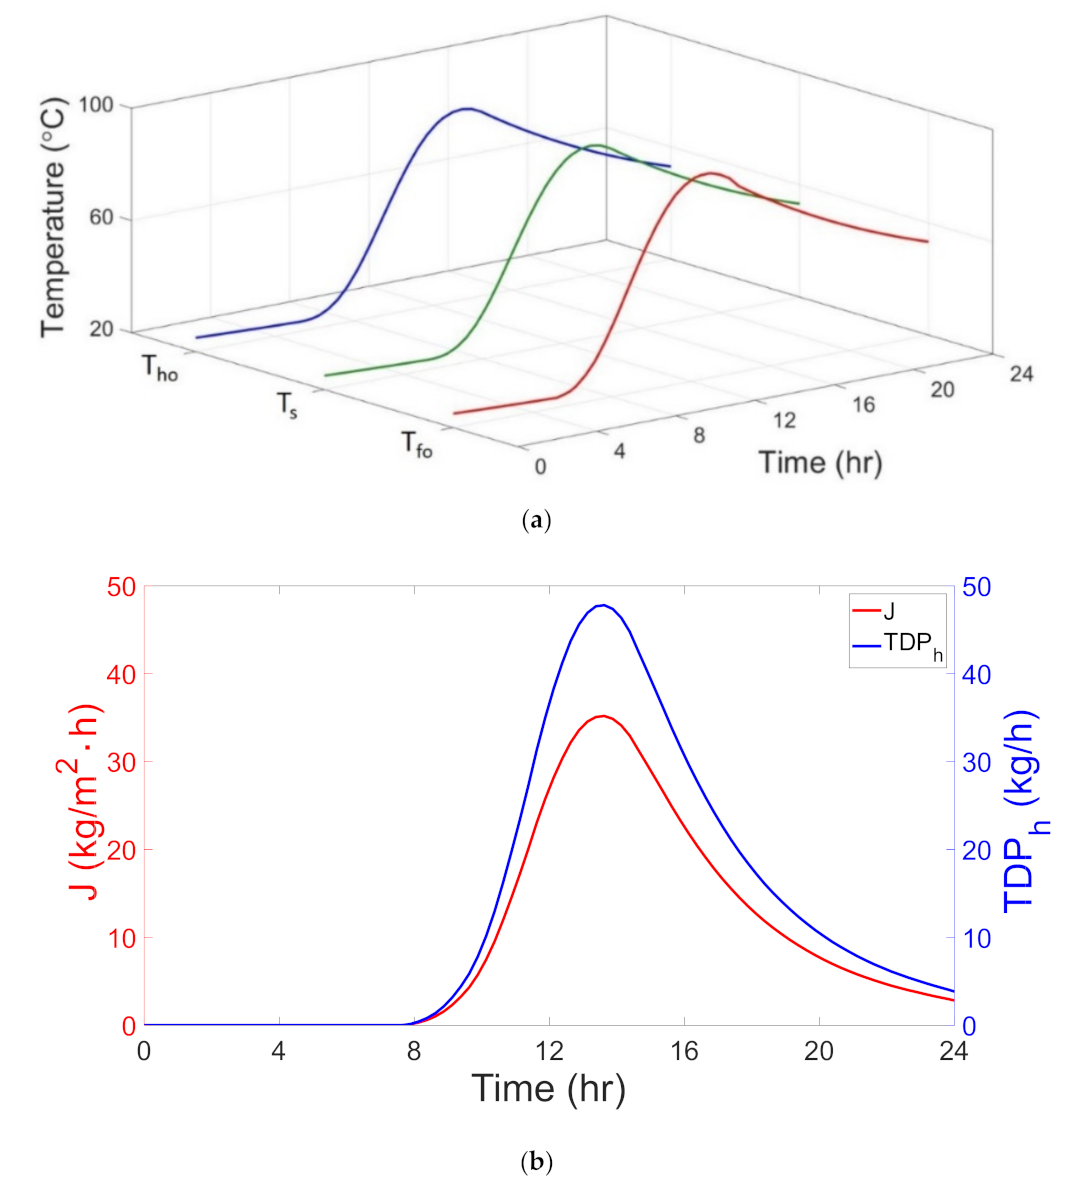
2.2. Preliminary Simulation Results

In this study, a preliminary simulation test for the solar-heated membrane distillation system is carried out. To simulate realistic operation conditions, environmental data of Taichung, Taiwan, are adopted in this study from Ho and Huang [25]. The data for each hour are averaged from the whole year data, as shown in Figure 2. The ambient temperature (Ta) and solar irradiation data (I) in Figure 2 are substituted into the established mathematical formula. The equipment size is set as design variables. The values of the operating conditions for simulation are shown in Table 2. The variation of solar collector outlet temperature (Tfo), the heat storage tank temperature (Ts), and the heat exchanger outlet temperature (Tho) are calculated at each time point in the day. The amount of water production in one day is estimated accordingly.
First, the initial water temperature of the heat storage tank is set to 25 °C at normal temperature, and Tfo is constrained to be less than 100 °C. The preliminary simulation results are shown in Figure 3a; Tfo can reach the highest temperature of 93 °C, and Tho is 87 °C. When the MD feed side inlet temperature is lower than 40 °C, the calculated J is 0 kg/m2·h, and the TDPh is 0 kg/h. When the MD feed side inlet temperature reaches the highest temperature, the calculated J is 35 kg/m2·h, and the TDPh is about 48 kg/h. The water production per day will be estimated to be 372.2 kg/day. The permeate flux (J) and water production (TDPh) results are shown in Figure 3b.
Note that the operating conditions for preliminary simulation are adopted arbitrarily. It is expected that the outlet water temperature of the heat storage tank cannot drop from the initial temperature at the beginning of the day to the temperature at the end of the day. Moreover, the solar collector outlet temperature should not be greater than 100 °C for successive days. Such unideal conditions may occur without the appropriate size of the corresponding units, as shown in Figure 4. Therefore, the following will describe the optimal design method of the system and verify with simulation to satisfy the operating temperature limits and continuity for day-to-day operation.

3. Design Optimization of PEMFC and DCMD Systems

In this study, the mathematical model of the two alternative systems is built for optimal design based on the previous unit models. The dynamic characteristics of solar irradiation are considered during different periods, and the ambient temperature is varied. The operational constraints are also embedded to achieve optimal results within a practical and operable design. The total distillate production (TDP) and the total annual cost (TAC) are subsequently calculated from the cost function of each unit. The unit production cost (UPC) is the objective function. The lowest UPC of the two systems using the Taichung area data will be evaluated.

3.1. Unit Cost Function

The economic cost analysis is estimated by the unit size of the system and the unit cost function. The TAC consists of the annual fixed cost (Pfixed) and the annual operating and maintenance cost (PO&M) in Equation (9), and the details are shown in Figure 5. The cost equation calculation follows Macedonio et al. [26]. The model follows the assumptions: (i) The solar collector, the heat storage tank, and the pump life (n) is expected to be 20 years, the membrane is 7 years, the PEMFC is 2 years, and the annual interest rate (i) is 5%, (ii) land cost is negligible, (iii) the instrumentation control of system and labor costs are negligible, and (iv) the seawater preprocessing is negligible.
TAC = p fixed + p O & M

3.1.1. Annual Fixed Cost

Annual fixed cost (pfixed) includes the purchase and installation cost of each unit. The cost is calculated by the total purchase cost (pcc) and amortization factor of equipment (a is the solar collector, heat storage tank, and pump; b is the membrane; c is the PEMFC) as shown in Equations (10) and (11):
p fixed = a × p sc   + p scr   + p te   + p pump + b × p mem + p mema + c × p fc
a ,   b ,   c = i 1 + i n 1 + i n 1
The cost of each unit equipment purchase is based on the cost data (p1) provided by the literature and adjusted with the cost index published by the Chemical Engineering Plant Cost Index (CEPCI) (p2), as in Equation (12):
p 2 = p 1 I 2 / I 1
where I1 and I2 are the cost index of referred literature at that time and nowadays. Note that the costs in the literature are adjusted to the current cost index (616 in February 2019) in this study for subsequent calculations.

Solar Collector

The cost is based on the estimated solar collector provided by Saffarini et al. [27], which is USD 160/m2. The cost index noticed in 2012 is 584.6, and the cost is adjusted to USD 168/m2 for February 2019, according to Equation (12). Due to that the systems are located in Taiwan, the subsidy method announced by the Ministry of Economic Affairs is implemented. The cover-type solar collector is subsidized for USD 75/m2. Thus, the solar collector cost is corrected to USD 93/m2. In addition, the installation cost of the solar collector is estimated to be 30% of the purchase cost, as calculated by Equations (13) and (14):
p sc = 93   A sc
p scr = 0 . 3   p sc

Heat Storage Tank with Internal Heat Exchanger

This unit is divided into two parts. Due to the fact that the working fluid is pure water, the general carbon steel material is selected for the heat storage tank. The cost is estimated to be USD 160/m2 in February 2019.
The cost of the heat exchanger is based on the model provided by Turton et al. [28], considering its size, pressure, and material and estimation by cost index adjustment as shown in Equations (15)–(20). The size range is 10–1000 m2, and the pressure is assumed less than 5 barg. The cost index noticed in 2014 is 521.9 for cheaper fixed shell and tube heat exchangers, which are also suitable for use at high temperatures. In terms of material, carbon steel is selected at the shell side for working fluid and titanium alloy at the tube side for seawater.
p tan k = 160 ( M s / 1000 )
C BM = C p 0 B 1 + B 2 F p F M
logC p 0 = k 1 + k 2 log A h + k 3 log A h 2
logF p = C 1 + C 2 log P + C 3 log P 2
p n = C BM 616 / 521 . 9
p te = p n + p tan k
where CBM is the bare module cost defined as the direct and indirect costs of purchase and installation. Fp and FM are the pressures and material factors. The constants in the formula are obtained from Turton et al. [28]. B1 and B2 are bare module cost factor constants; k1, k2, and k3 are size factor constants; C1, C2, and C3 are pressure factor constants. The constants are shown in Table 3.

The DCMD Module

The cost is based on the estimated DCMD module provided by Al-Obaidani et al. [3], USD 90/m2. The cost index noticed in 2008 is 575.4, and the cost is adjusted to USD 96/m2 in February 2019. In addition, the installation cost of the DCMD module is estimated to be double the purchase cost, as calculated by Equations (21) and (22):
p mem = 96   A mem
p mema = 2   p mem

The PEMFC Module

The cost is based on the estimated PEMFC module provided by Bezmalinović et al. [29], which is USD 2000/kW. The cost index noticed in 2013 is 567.3, and the cost is USD 2172/kW nowadays. The total power of the designed fuel cell is estimated as shown in Equation (23):
p fc = 2172   Q tot

Pump

This study selects the centrifugal pump with a high delivery rate, low price, and low head to transport the primary closed-loop working fluid and seawater. The cost is based on the model provided by Turton et al. [28], considering its size, pressure, and material and estimating it by cost index adjustment, as shown in Equations (15)–(20). The constants in the formula are obtained from Turton et al. [28], and the constants are shown in Table 4. The power range is 1–100 kW, and the pressure is assumed less than 10 barg. The power (Wpump) is estimated by the volume flow rate (Qv) and head (H) of the operation in Equation (24), assuming the efficiency of each pump (ηpump) is 80% and the head is 20 m. According to Peters et al. [30], the volume flow rate of the operation is 0.6 m3/h. In terms of material, carbon steel is selected at the primary closed loop for the working fluid and nickel alloy for the seawater side (FMb) [31].
W pump = 9 . 8   ×   Q v   ×   H η pump   ×   3600

3.1.2. Annual Operating and Maintenance Cost

The annual operating and maintenance costs (pO&M) only consider the replacement of a DCMD and PEMFC module, system maintenance, and utility cost, as shown in Equation (25), and that refers to Saffarini et al. [27].
p O & M = p memr   + p fcr   + p M   + p w + p elec + p H 2

The DCMD and PEMFC Replacement

The membrane replacement rate depends on seawater’s salt concentration. The annual replacement rate varies between 5% to 20% of the initial purchase cost. The membrane replacement rate is assumed 15% per year, as shown in Equation (26). The PEMFC needs to be replaced every three and a half years, where the annual replacement cost is estimated to be 0.3 times the initial purchase cost in Equation (27):
p memr = 0 . 15   p mem
p fcr = 0 . 3   p fc

Total Maintenance Cost

The annual maintenance cost of the system is estimated to be 0.5% of the annual fixed cost in Equation (28):
p M = 0 . 005   p fixed

Utility Cost

The utility cost includes the water, electricity, and gas costs that need to be calculated for the two systems in this study. In terms of water cost, the cooling water cost (pw) of the primary closed loop is related to the heat storage tank size of the system. According to Taiwan Water Corporation’s basic charge, the unit price of the water is USD 0.39/m3, incorporated in Equation (29). The seawater in the secondary circuit is taken from the sea of nature, which is zero-cost. In terms of electricity cost, both systems use solar energy as the heat source that only needs to consider the electricity cost of the pump (pelec). According to the Taiwan Power Company’s basic charge, the unit price of the electricity is USD 0.08/kWh. The calculation mode provided by Vogelesang [32] is based on its operating time (tpump), power consumption (Wpump), and unit power price, as shown in Equation (30). The PEMFC coupled solar-heated membrane distillation system uses hydrogen and oxygen to generate electricity. Thus, the power generated from the PEMFC can be supplied into the hybrid system. If there is excess power, it is sold at the unit price of USD 0.08/kWh. In terms of gas cost, according to Bezmalinović et al. [29], the unit price of hydrogen is USD 5/kg, and the cost is adjusted to USD 5.4/kg nowadays. The cost depends on the amount of reaction ( N an ,   H 2 re ) and the operation time (tfc), as formulated in Equation (31):
p w = 0 . 39 × M s / 1000
p elec = 365 × 0 . 08 × W pump × t pump
p H 2 = 5 . 4 N an ,   H 2 re   ×   t fc   ×   2 × 10 - 3
where 2 × 10⁻³ kg/mol is the unit conversion of hydrogen molecular weight.

3.2. Objective Function and Constraints

The objective function of the membrane distillation systems with two heating methods consists of the TAC and TDP, as shown in Equation (32). The optimized variables and the related constraints are shown in Equations (33)–(38). The operational constraints of a solar-heated membrane distillation system are as follows: (i) the solar collector outlet temperature (Tfo) must be lower than 100 °C at any time (n) to avoid boiling of the working fluid; (ii) the set temperature difference must be less than 1 °C; (iii) the temperature at the end of each day must be greater than the start of the day and the water production of the day must be greater than zero. The initial heat storage tank temperature cannot be fixed at the beginning and end of the day to ensure the continuity of day-to-day operation. The total operating time is H, and t ∈ [0, H]. In addition, the constraints of the PEMFC coupled solar-heated membrane distillation system include the above three conditions. The PEMFC temperature must be lower than 100 °C at any time period (n = 1, …, H) for safe working temperature.
UPC = TAC / TDP
For the first solar-heated membrane distillation system optimization model, the TDP is computed according to Equations (1)–(8) and all of the equations in Supplementary Materials [33,34,35]. The TAC is calculated based on Equations (9)–(31). The UPC is minimized as follows:
Obj = min f UPC
f = A sc ,   M s ,   T s ( 0 )
S . t . T fo ( n )   <   100   ° C   T s ( H ) T s 0 T s ( H ) T s 0     1   ° C   TDP   >   0  
As for the PEMFC coupled solar-heated membrane distillation system optimization model, it includes the same TDP and TAC calculations with the UPC is minimized as follows:
Obj = min f UPC
f = j fc ,   A sc ,   A fc ,   M s ,   T s ( 0 )
S . t . T fo ( n )   <   100   ° C   T s ( H ) T s 0 T s ( H ) T s 0     1   ° C   T st ( n )   <   100   ° C   TDP   >   0  

3.3. Optimal Design Method and Computational Strategy

This study uses the fmincon function and the sequential quadratic programming (SQP) algorithm in MATLAB to execute the optimization. The dynamic model is built in the SIMULINK platform to compute TDP and TAC for each different design parameter. Note that the optimization process is shown in Figure 6. The MATLAB default parameters setting is used for fmincon function. The computational works were carried out in a desktop server platform with Intel® Xeon® Silver 4216 CPU @ 2.10 GHz (two processors) and 768 GB RAM. All of the mathematical models were solved with MATLAB R2019a.
Before the optimization analysis, the initial values of the optimization variables and their calculation ranges are set accordingly. The fmincon function will subsequently substitute the initial iteration values of design parameters in Equations (1)–(31) and all of the equations in Supplementary Materials into the established dynamic model in SIMULINK. The TDP and TAC are calculated within the SIMULINK platform. The fmincon function minimizes the UPC objective function, as shown in Equations (32)–(38). The next iteration is carried out after the calculation reaches convergence in the SIMULINK platform. The above steps are repeated within the fmincon routine until the iteration UDP value is less than the step tolerance and finish the iteration.
However, the operational constraints are set in this study in the fmincon solver layer. If the results violate the constraints as shown in Equations (36)–(38), the TDP computed from SIMULINK will be overridden with the algorithm shown in Algorithms 1. If any operational constraint is violated, the water production TDP is given with a small value. UPC will be minimized for optimal design variables different to the initial values as the optimization algorithm is carried out. Note that fmincon is a local solver. Therefore, to determine the globality of the solution, several initial values are implemented with a full-range scan method to scan all the possible solutions (f), as shown in Figure 7. By comparing all the local best solutions in these ranges, the global minimum of UPC can be computed accordingly.
Algorithm 1. Conditional algorithm for operational constraints.
if Ts(end) ≥ Ts(0) & Ts(end) − Ts(0) ≤ 1
   if Tfo(n) < 100
     if Tst(n) < 100
       % Calculate the TDP from Equations (1)–(8) and all of the equations in Supplementary Materials.
      TDP = TDP;
    else
      TDP = 1 * 10 ^ −5;
   end
  else
     TDP = 1 * 10 ^ −5;
   End
else
   TDP = 1 * 10 ^ −5;
end

4. Results and Discussion

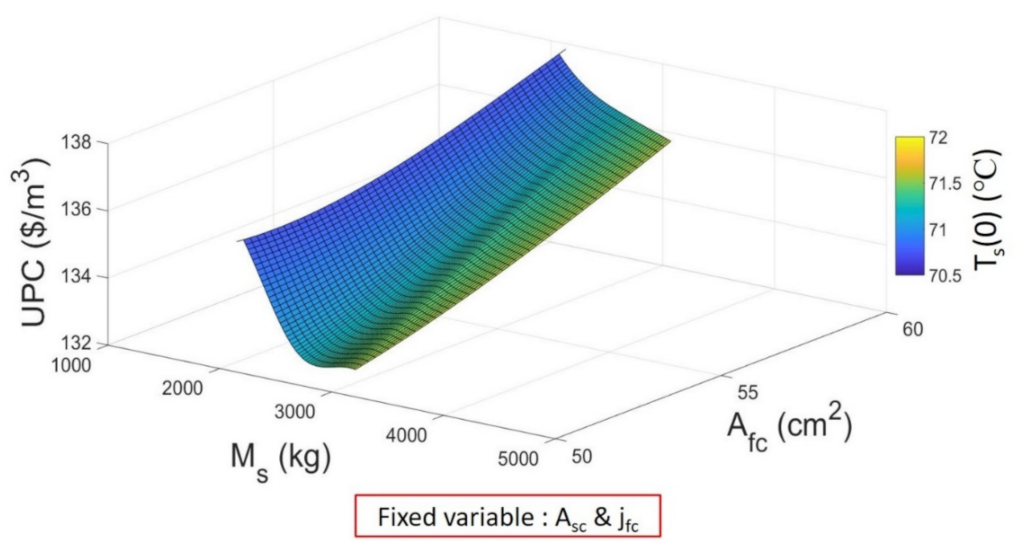
4.1. Sensitivity Analysis

A sensitivity analysis is implemented to rank the importance of the design variables and simultaneously reduce the dimensionality of the optimization procedure, as shown in Table 5. The sensitivity analysis simulates the one-day operation systems and evaluates the water production TDP for each variable of interest. In contrast, the other variables are fixed at their nominal values.
The increase or decrease effects on TDP for each variable change are shown in Figure 8. In this study, each variable of interest is varied by four times the initial values shown in Table 2. The result shows that mf has the most minor influence on water production compared with other solar-heated membrane distillation system parameters. Thus, mf is not considered as the optimization design variable. The result for the PEMFC coupled solar-heated membrane distillation system shows that the most influential is jfc and the least is Mst. Therefore, Mst is not considered as the optimization design variable. Note that mh impacts the water production, as shown in the sensitivity analysis result for the latter system, which corresponds to the flow of the primary feed source. If the flow rate is too fast, the preheating of seawater may be insufficient and lead to water production decrease as the inlet membrane temperature decreases. If the flow rate is too low, the preheated seawater temperature can be higher. Still, since the flow rate is too low, the expected water production will also be impacted. Therefore, mh is not considered as the optimization design variable. Thus, Asc, Ts(0), and Ms are selected for the original configuration. As for the second system, jfc, Afc, Asc, Ts(0), and Ms are chosen as the optimization variables for optimal design. The parameters excluded for optimization are shown in Table 6, and are fixed in the subsequent computation.

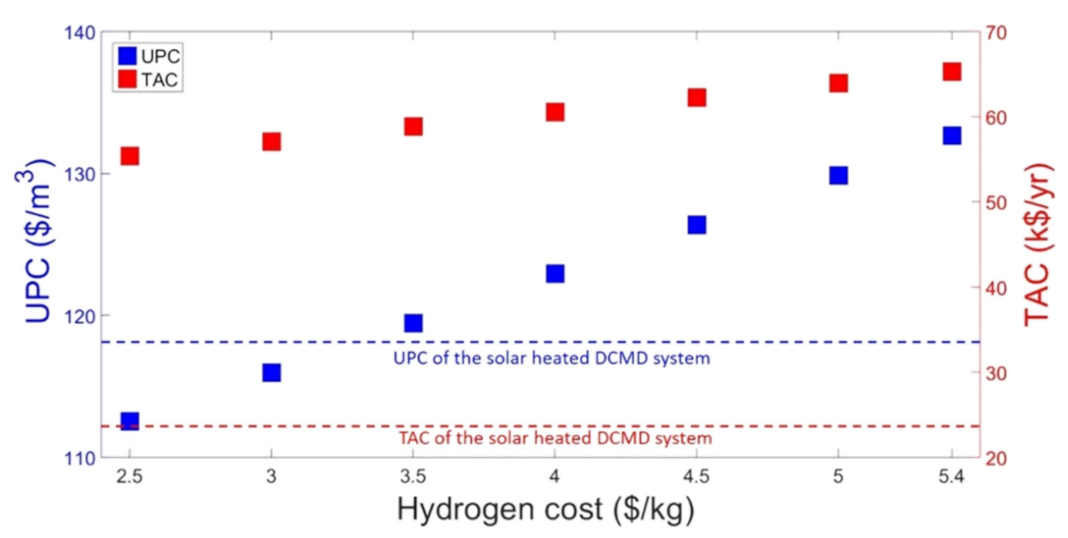
4.2. Optimization Results

In this study, the UPC is minimized and, subsequently, the corresponding TAC and TDP are analyzed. The operating conditions for the optimum design of the two systems in this study are shown in Table 7. The environmental data of Taichung, Taiwan, are adopted, as shown in Figure 2. The optimization procedure above is then implemented to compute the optimum design for both systems. Before the optimization is carried out, the initial points and calculation range of the optimization variables are set according to Table 8. Note that there are several initial points to ensure the globality of the solutions, as described in Figure 7.
The optimum result of the solar-heated membrane distillation system using fmincon is shown in Figure 9a. The initial variables set are as follows: Asc is 80 m2, Ms is 4145 kg, and Ts(0) is 70 °C. The lowest UPC is USD 118.55/m3, which corresponds to Asc at 80.09 m2, Ms of 4145 kg, and Ts(0) at 71.8 °C. The plane curve in Figure 9a is obtained from several runs of fmincon for visualization purposes, and, then, a full-range scan with fixed steps (see Table 9) is carried out to verify the fmincon result, and the results are shown in Figure 9b. Note that the blank area in the variable range means that the corresponding sizes cannot satisfy the operational constraints. Ms and Asc have an impact on the UPC with the Ts(0) variation. When Ts(0) increases, Ms and Asc are more significant and, consequently, the calculated UPC is lower. The optimum variable for Asc is 80 m2, Ms is 2645 kg, Ts(0) is 71 °C, and the lowest UPC is USD 119.78/m3 for the fixed steps approach. The optimum TAC is found to be USD 23,189/y using fmincon algorithm. It can be seen here that the lower TACs collocate with the low Ts(0). Thus, there is an optimum Ts(0) that can be suggested to design the corresponding hybrid system. The UPC results are similar to fmincon function and full-range scan method; however, the full-range scan method uses more significant calculation steps, hence less accuracy. It is noteworthy to mention that the UPC in this study is on the expensive side as the membrane area is fixed at 1.2 m2, which is arguably out of the economic scale for large-scale production [36]. It is expected that the UPC will be lower for a larger membrane area. Still, in this study, the membrane area is deliberately fixed to be consistent with the previous literature values [24] and as a reference basis for the subsequent optimization of other design parameters. Moreover, this study is primarily aimed at showcasing rigorous dynamic optimization and, at the same time, simultaneously introducing the daily production continuity constraints, ensuring the operability of the optimal design.
The partial results of the PEMFC coupled solar-heated membrane distillation system for fmincon are shown in Figure 10. Since there are five optimization variables, the optimization results only can present partial data. The initial points of the variables set are as follows: Asc is 80 m2, Ms is 3145 kg, Ts(0) is 70 °C, Afc is 30 cm2, and jfc is 1.8 A/cm2. The result shows that the lowest UPC is USD 132.65/m3 for Asc of 80.10 m2, Ms at 3145 kg, Ts(0) value of 71.57 °C, Afc of 50.07 cm2, and jfc of 1.87 A/cm2. The higher Ts(0) collocates with more significant Ms and the smaller Afc, potentially achieving the lowest UPC. The full-range scan result is omitted as the conclusion is similar to the first system. The TAC result of the PEMFC coupled solar-heated membrane distillation system with fmincon corresponds to USD 65,309/y.
On the other hand, one may want to find the extent of the throughput from both systems. The TDP result of the solar-heated membrane distillation system with fmincon is shown in Figure 11a. The TDP increases as the Ts(0) and Ms increases to a certain point at the similar Asc. If the Ms is too large, the downstream temperature from the internal heat exchanger would struggle to rise due to the heat storage tank’s heat capacity. This situation will lead to a lower TDP at the larger size of Ms. The TDP optimum is 195.59 m3/y.
The partial TDP results of the PEMFC coupled solar-heated membrane distillation system with fmincon are shown in Figure 11b, where Asc and jfc data are considered at 80 m2 and 1.8 A/cm2. Similar to the previous results, the higher Ts(0) collocates with the larger Afc. The TDP increases as the generated heat increases. The optimal TDP with fmincon algorithm is computed to be 492.34 m3/y.
The optimal results with fmincon and full-range scan methods are summarized in Table 9. Although the results of fmincon and full-range scans are similar, the fmincon can potentially find the lower UPC. By introducing the PEMFC, the required size of the heat storage tank is reduced as the waste heat from the PEMFC plays a role in increasing the TDP of the system, and the dependency on the solar loop is reduced.
The systems are simulated for a one-day operation to verify the operating temperature limits and continuity for day-to-day operation. The simulation results of both systems using different methods are shown in Figure 12a. Note that the Ts difference must be less than 1 °C, and the temperature at the end of each day (Ts(H)) must be greater than the start of the day (Ts(0)). Based on the simulation results in Figure 12a, each optimum result obviously has continuity for day-to-day operation. In addition, by comparing the minimum UPC of the two systems, the UPC of adding the fuel cell system is USD 14.15/m3 higher than the original configuration. The Ts profiles are almost similar for both systems, as Ts is related to the first loop, as shown in Figure 1. The waste heat of the PEMFC only affects the downstream temperature out of the heat storage tank. Hence, the TDP of adding the fuel cell system is 297.1 m3/y, more increased than the original configuration (2.5 times the original value, as shown in Figure 12b). This is the most apparent impact of the PEMFC addition, benefitting its stable heat supply for the entire operation. The TAC is USD 42,120/y higher than the original configuration (2.8 times the original value). The cost details from each unit of the two systems are shown in Table 10. The PEMFC cost is USD 17,149/y, and the hydrogen price is USD 18,463/y higher than the original configuration. With the addition of the PEMFC, it can supply the power of the pump in the system. Still, the excess electricity can be sold to increase revenue from the power production of the PEMFC.
Based on the cost breakdown in Table 10, the hydrogen price is the main reason behind the higher value of TAC than the original configuration. If the hydrogen price can be decreased, the UPC of the PEMFC coupled solar-heated membrane distillation system will also potentially be reduced. Consequently, the UPC and TAC of the PEMFC coupled solar-heated membrane distillation system are recalculated based on the different hydrogen prices, as shown in Figure 13. The result shows when the hydrogen price decreases from USD 5.4/kg to USD 3/kg, the UPC is USD 116/m3. Thus, if the hydrogen price decreases below USD 3/kg, the UPC of the PEMFC coupled solar-heated membrane distillation system will be more competitive than the original configuration.

5. Conclusions

In this work, the models of PEMFC and DCMD systems have been built and verified with the experimental data. The rigorous optimization procedure of the hybrid systems has been proposed accordingly. The feasibility of solar-heated membrane distillation and PEMFC coupled solar-heated membrane distillation systems is evaluated according to their UPC, TAC, and TDP. The PEMFC coupled with a solar-heated DCMD module system fails to effectively reduce its UPC due to the high price of hydrogen. Still, it shows that it can have a more sustainable heat source and increase the TDP from the original configuration. With the addition of the PEMFC, the required size for heat storage tanks could be smaller. According to TAC analysis, the PEMFC coupled solar-heated membrane distillation system is 2.8 times higher than the original system. If the hydrogen price can be less than USD 3/kg, the UPC of the PEMFC coupled solar-heated membrane distillation system will be more competitive than the original system. The potential exists to combine with the electrolytic cell to produce hydrogen independently from any waste/excess energy in the future. Hence, more costs can be saved for desalination with a multi-generation hybrid system.

Supplementary Materials

The following are available online at https://www.mdpi.com/article/10.3390/pr10040663/s1, Supplementary S1: The hollow fiber DCMD module, S2: The PEMFC module, S3: DCMD Module verification, Table S1: Specification of the membrane physical properties and parameters, Figure S1: The verification flux result for (a) different temperature; (b) different velocity at two temperatures (vp = 0.28 m/s, Tp, in = 15 ℃, Xfs = 0.035) and literature data.

Author Contributions

Y.-H.L.: Conceptualization, data curation, formal analysis, investigation, methodology, visualization, writing—original draft. V.S.K.A.: Conceptualization, formal analysis, investigation, methodology, resources, software, supervision, validation, writing—review and editing. S.-Y.S.: Supervision, writing—review and editing. All authors have read and agreed to the published version of the manuscript.

Funding

This research was partially funded by the Ministry of Science and Technology, Taiwan grant number MOST 106-2221-E-005-095-, MOST 107-2221-E-005-034-, the 105科技部補助大專校院延攬特殊優秀人才award, and partially funded by the National Chung-Hsing University grant number 10617003G 新進教師經費補助.

Institutional Review Board Statement

Not applicable.

Informed Consent Statement

Not applicable.

Data Availability Statement

The data presented in this study are available in Supplementary Materials.

Conflicts of Interest

All authors are aware of the submission and agree to its publication. The authors declare no conflict of interest.

Nomenclature

(Including Supplementary Materials)
Symbol
aAmortization factor of the solar collector (-)
AUnit area (m2)
bAmortization factor of the membrane (-)
cAmortization factor of the PEMFC (-)
CMembrane distillation coefficient (-)
CH2Hydrogen concentration of PEMFC (mol/cm3)
CkKnudsen-diffusion coefficient (-)
CmMolecular-diffusion coefficient (1/m)
CO2Oxygen concentration of PEMFC (mol/cm3)
CpPoiseuille-flow coefficient (m)
Cp,airAir specific heat (J/mol·K)
Cp,H2Hydrogen specific heat (J/mol·K)
Cp,N2Nitrogen specific heat (J/mol·K)
Cp,O2Oxygen specific heat (J/mol·K)
CpfFluid specific heat (J/kg·K)
Cpg,H2OGaseous water specific heat (J/mol·K)
CphSeawater specific heat (J/kg·K)
Cpl,H2OLiquid water specific heat (J/mol·K)
CpstPEMFC specific heat (J/kg·K)
dhHydraulic radius (m)
diFiber inside diameter (m)
doFiber outside diameter (m)
dsShell inside diameter (m)
DDiffusion coefficient (m2/s)
ENernstThe open circuit cell voltage (V)
FFaraday constant (s·A/mol)
FrHeat removal factor (-)
FscSolar collector efficiency factor (-)
hHeat transfer coefficient (W/m2·K)
HHead (m)
iAnnual interest rate (%)
ISolar irradiation (W/m2)
IstCurrent (A)
jfcCurrent density (A/cm2)
JPermeate flux (kg/m2·h)
JmAverage permeate flux (kg/m2·h)
kConductive coefficient (W/m·K)
kmgVapor conductive coefficient (W/m·K)
kmsSolid conductive coefficient (W/m·K)
LFibers length (m)
mclCooling water flow rate (kg/s)
mfThe primary circuit mass flow rate (kg/s)
mhSeawater mass flow rate (kg/s)
MMass (kg)
M_fFeed molecular weight (kg/mol)
M_pPermeate molecular weight (kg/mol)
M_sSalt molecular weight (kg/mol)
M_wWater molecular weight (kg/mol)
MsHeat storage tank mass (kg)
nEquipment life (y)
N   an ,   H 2   in Anode input hydrogen molar flow rate (mol/s)
N   an ,   H 2   out Anode output hydrogen molar flow rate (mol/s)
N an ,   H 2 re Anode reacted hydrogen molar flow rate (mol/s)
N   an ,   H 2 O   in Anode input gases are humidified to saturation (mol/s)
N   an ,   H 2 O   out Anode remaining of the output gases are humidified to saturation (mol/s)
N   ca ,   H 2 O   gen Cathode output generated water (mol/s)
N   ca ,   H 2 O   in Cathode input gases are humidified to saturation (mol/s)
N   ca ,   H 2 O   out Cathode remaining of the output gases are humidified to saturation (mol/s)
N   ca ,   N 2   out Cathode output nitrogen molar flow rate (mol/s)
N   ca ,   O 2   in Cathode input oxygen molar flow rate (mol/s)
N   ca ,   O 2   out Cathode output oxygen molar flow rate (mol/s)
N ca ,   O 2 re Cathode reacted oxygen molar flow rate (mol/s)
N   ca , air     in Cathode input air molar flow rate (mol/s)
NfFibers number (-)
NfcCell number (-)
pPrice (USD)
PPressure (Pa)
PamLog-mean air pressure at both sides of the membrane (-)
PanAnode inlet gases pressure (atm)
PcaCathode inlet gases pressure (atm)
pelecElectricity price (USD)
pfcrReplacement price of PEMFC (USD)
pfixedAnnual fixed cost (USD)
PH2Partial pressure of the anode hydrogen (kpa)
pmemaInstallation price of DCMD (USD)
pmemrReplacement price of DCMD (USD)
pO&MAnnual operating and maintenance costs (USD)
PO2Partial pressure of the cathode oxygen (kpa)
PrPrandtl number (-)
PsatSaturation vapor pressure (kpa)
pscrInstallation price of solar collector (USD)
PstPEMFC output voltage (W)
PwCooling water price (USD)
Pw, mVapor pressure when there is no dissolved substances in the water (Pa)
QHeat (W)
QambRate of heat loss to the atmosphere (W)
QclRate of heat removal by the coolant (W)
QinHeat flow rate of input reactant (gas) (W)
QoutHeat flow rate of output product (liquid water) (W)
QtotTotal power from the electrochemical reaction (W)
QvVolume flow rate of pump (m3/h)
RUniversal gas constant (Pa·m3/mol·K)
ReReynolds number (-)
RintResistance (Ω)
RkCorrelation of Knudsen-diffusion (m2·s·Pa/kg)
RmCorrelation of Molecular-diffusion (m2·s·Pa/kg)
RpCorrelation of Poiseuille-flow (m2·s·Pa/kg)
RtThermal resistance (K/W)
SRadiation absorbed flux by the absorber area (W/m2)
tOperating time (h)
tmMembrane thickness (cm)
TTemperature (K)
T an in Anode inlet gases temperature (K)
T ca in Cathode inlet gases temperature (K)
TaAmbient temperature (°C)
TACTotal Annual Cost (USD/y)
TDPTotal Distillate Production (m3/y)
TDPhWater production per hour (kg/h)
TfiThe solar collector inlet temperature (°C)
TfoThe solar collector outlet temperature (°C)
ThiThe heat exchanger inlet temperature (seawater temperature, °C)
ThoThe heat exchanger outlet temperature (°C)
UhInternal heat exchanger overall loss coefficient (W/m2·K)
UPCUnit Production Cost (USD/m3)
UsHeat storage tank in the environment overall heat loss coefficient (W/m2·K)
UscSolar collector overall heat loss coefficient (W/m2·K)
vVelocity (m/s)
vhAverage velocity of seawater (m/s)
VMolar volume (m3/mol)
VactActivation overpotential (V)
VfcThe PEMFC delivers electrical power to the load (V)
VohmOhmic overpotential (V)
WpumpPower of pump (kw)
XfsMolar fraction in liquid phase
zAxial coordinate of hollow fiber
Greek letters
∆HThe enthalpy of evaporation (J/kg)
∆HH2The enthalpy of combustion for hydrogen (J/mol)
αMembrane surface area coefficient (-)
δmMembrane thickness (m)
εPorosity (-)
ηoOptical efficiency coefficient (-)
ηpumpThe efficiency of pump (%)
λH2Input hydrogen flow rate factor (-)
λmMembrane water content of PEMFC (-)
λO2Input oxygen flow rate factor (-)
μSeawater kinetic viscosity (Pa·s)
μwViscosity of water vapor within the membrane (Pa·s)
ρfFeed density (kg/m3)
ρsSalt density (kg/m3)
ρwWater density (kg/m3)
φPacking density (-)
Subscripts
fMD feed side
fcFuel cell
fmFeed side of the membrane
hInternal heat exchanger
mAcross the membrane
memDCMD module
pMD permeate side
pmPermeate side of the membrane
pumpPump
sHeat storage tank
scSolar collector
stPEMFC
teHeat storage tank with internal heat exchanger

References

  1. Khayet, M. Solar desalination by membrane distillation: Dispersion in energy consumption analysis and water production costs (a review). Desalination 2013, 308, 89–101. [Google Scholar] [CrossRef]
  2. Alkhudhiri, A.; Darwish, N.; Hilal, N. Membrane distillation: A comprehensive review. Desalination 2012, 287, 2–18. [Google Scholar] [CrossRef]
  3. Al-Obaidani, S.; Curcio, E.; Macedonio, F.; Diprofio, G.; Alhinai, H.; Drioli, E. Potential of membrane distillation in seawater desalination: Thermal efficiency, sensitivity study and cost estimation. J. Membr. Sci. 2008, 323, 85–98. [Google Scholar] [CrossRef]
  4. Zwijnenberg, H.J.; Koops, G.; Wessling, M. Solar driven membrane pervaporation for desalination processes. J. Membr. Sci. 2005, 250, 235–246. [Google Scholar] [CrossRef]
  5. Wang, X.; Zhang, L.; Yang, H.; Chen, H. Feasibility research of potable water production via solar-heated hollow fiber membrane distillation system. Desalination 2009, 247, 403–411. [Google Scholar] [CrossRef]
  6. Qtaishat, M.R.; Banat, F. Desalination by solar powered membrane distillation systems. Desalination 2013, 308, 186–197. [Google Scholar] [CrossRef]
  7. Elminshawy, N.A.; Siddiqui, F.R.; Sultan, G.I. Development of a desalination system driven by solar energy and low grade waste heat. Energy Convers. Manag. 2015, 103, 28–35. [Google Scholar] [CrossRef]
  8. Lokare, O.; Tavakkoli, S.; Rodriguez, G.; Khanna, V.; Vidic, R.D. Integrating membrane distillation with waste heat from natural gas compressor stations for produced water treatment in Pennsylvania. Desalination 2017, 413, 144–153. [Google Scholar] [CrossRef] [Green Version]
  9. Lai, X.; Long, R.; Liu, Z.; Liu, W. A hybrid system using direct contact membrane distillation for water production to harvest waste heat from the proton exchange membrane fuel cell. Energy 2018, 147, 578–586. [Google Scholar] [CrossRef]
  10. Bai, B.; Yang, X.; Tian, R.; Wang, X.; Wang, H. A high efficiency solar steam generation system with using residual heat to enhance steam escape. Desalination 2020, 491, 114382. [Google Scholar] [CrossRef]
  11. Phattaranawik, J.; Jiraratananon, R.; Fane, A.G. Heat transport and membrane distillation coefficients in direct contact membrane distillation. J. Membr. Sci. 2003, 212, 177–193. [Google Scholar] [CrossRef]
  12. El-Bourawi, M.S.; Ding, Z.; Ma, R.; Khayet, M. A framework for better understanding membrane distillation separation process. J. Membr. Sci. 2006, 285, 4–29. [Google Scholar] [CrossRef]
  13. Sun, C.; Kosar, W.; Zhang, Y.; Feng, X. Vacuum membrane distillation for desalination of water using hollow fiber membranes. J. Membr. Sci. 2014, 455, 131–142. [Google Scholar] [CrossRef]
  14. Pathapati, P.; Xue, X.; Tang, J. A new dynamic model for predicting transient phenomena in a PEM fuel cell system. Renew. Energy 2005, 30, 1–22. [Google Scholar] [CrossRef]
  15. Ramousse, J.; Lottin, O.; Didierjean, S.; Maillet, D. Heat sources in proton exchange membrane (PEM) fuel cells. J. Power Sources 2009, 192, 435–441. [Google Scholar] [CrossRef]
  16. Hu, P.; Cao, G.Y.; Zhu, X.J.; Hu, M. Coolant circuit modeling and temperature fuzzy control of proton exchange membrane fuel cells. Int. J. Hydrog. Energy 2010, 35, 9110–9123. [Google Scholar] [CrossRef]
  17. Zhao, P.; Wang, J.; Gao, L.; Dai, Y. Parametric analysis of a hybrid power system using organic Rankine cycle to recover waste heat from proton exchange membrane fuel cell. Int. J. Hydrog. Energy 2011, 37, 3382–3391. [Google Scholar] [CrossRef]
  18. Hasani, M.; Rahbar, N. Application of thermoelectric cooler as a power generator in waste heat recovery from a PEM fuel cell —An experimental study. Int. J. Hydrog. Energy 2015, 40, 15040–15051. [Google Scholar] [CrossRef]
  19. Chauhan, A.; Saini, R.P. A review on integrated renewable energy system based power generation for stand-alone applications: Configurations, storage options, sizing methodologies and control. Renew. Sustain. Energy Rev. 2014, 38, 99–120. [Google Scholar] [CrossRef]
  20. Ghobeity, A.; Noone, C.J.; Papanicolas, C.N.; Mitsos, A. Optimal time-invariant operation of a power and water cogeneration solar-thermal plant. Sol. Energy 2011, 85, 2295–2320. [Google Scholar] [CrossRef]
  21. Mohan, G.; Kumar, U.; Pokhrel, M.K.; Martin, A. A novel solar thermal polygeneration system for sustainable production of cooling, clean water and domestic hot water in United Arab Emirates: Dynamic simulation and economic evaluation. Appl. Energy 2016, 167, 173–188. [Google Scholar] [CrossRef]
  22. Farahat, S.; Sarhaddi, F.; Ajam, H. Exergetic optimization of flat plate solar collectors. Renew. Energy 2009, 34, 1169–1174. [Google Scholar] [CrossRef]
  23. Badescu, V. Optimal control of flow in solar collector systems with fully mixed water storage tanks. Energy Convers. Manag. 2008, 49, 169–184. [Google Scholar] [CrossRef]
  24. Cheng, L.-H.; Wu, P.-C.; Chen, J. Modeling and optimization of hollow fiber DCMD module for desalination. J. Membr. Sci. 2008, 318, 154–166. [Google Scholar] [CrossRef]
  25. Ho, M.C.; Huang, K.T. The Development and Research on Hourly Typical Meteorological Years (TMY3) for Building Energy Simulation Analysis of Taiwan; Architecture and Building Research Institute in Ministry of the Interior: Taipei, Taiwan, 2013.
  26. Macedonio, F.; Curcio, E.; Drioli, E. Integrated membrane systems for seawater desalination: Energetic and exergetic analysis, economic evaluation, experimental study. Desalination 2007, 203, 260–276. [Google Scholar] [CrossRef]
  27. Saffarini, R.B.; Summers, E.K.; Arafat, H.A. Economic evaluation of stand-alone solar powered membrane distillation systems. Desalination 2012, 299, 55–62. [Google Scholar] [CrossRef]
  28. Turton, R.; Bailie, R.C.; Whiting, W.B.; Shaeiwitz, J.A.; Bhattacharyya, D. Analysis, Synthesis and Design of Chemical Processes, 4th ed.; Prentice Hall: Upper Saddle River, NJ, USA, 2012. [Google Scholar]
  29. Bezmalinović, D.; Barbir, F.; Tolj, I. Techno-economic analysis of PEM fuel cells role in photovoltaic-based systems for the remote base stations. Int. J. Hydrog. Energy 2013, 38, 417–425. [Google Scholar] [CrossRef] [Green Version]
  30. Peter, M.S.; Timmerhaus, K.D.; West, R.E. Plant Design and Economics for Chemical Engineers, 5th ed.; Mc Graw Hill: Boston Burr Ridge, IL, USA, 2002. [Google Scholar]
  31. Todd, B. Nickel-containing materials in marine and related environments. Nickel Metall. 1986, 2, 121–137. [Google Scholar]
  32. Vogelesang, H. An introduction to energy consumption in pumps. World Pumps 2008, 2008, 28–31. [Google Scholar] [CrossRef]
  33. Mengual, J.; Khayet, M.; Godino, M. Heat and mass transfer in vacuum membrane distillation. Int. J. Heat Mass Transf. 2004, 47, 865–875. [Google Scholar] [CrossRef]
  34. Ding, Z.; Ma, R.; Fane, A. A new model for mass transfer in direct contact membrane distillation. Desalination 2003, 151, 217–227. [Google Scholar] [CrossRef]
  35. Martínez, L.; Rodríguez-Maroto, J.M. On transport resistances in direct contact membrane distillation. J. Membr. Sci. 2007, 295, 28–39. [Google Scholar] [CrossRef]
  36. Jia, X.; Klemeš, J.J.; Varbanov, P.S.; Wan Alwi, S.R. Analyzing the energy consumption, GHG emission, and cost of seawater desalination in China. Energies 2019, 12, 463. [Google Scholar] [CrossRef] [Green Version]
Figure 1. Schematic diagram of (a) the solar-heated membrane distillation system and (b) the PEMFC coupled solar-heated membrane distillation system.
Processes 10 00663 g001
Figure 2. The environmental data of the Taichung area.
Processes 10 00663 g002
Figure 3. (a) The temperature variation of Tfo, Ts, and Tho; (b) the permeate flux and water production variation in one day.
Processes 10 00663 g003
Figure 4. The solar collector outlet temperature for 7 successive days.
Processes 10 00663 g004
Figure 5. The costs for economical cost analysis.
Processes 10 00663 g005
Figure 6. Flow chart of optimization with MATLAB fmincon.
Processes 10 00663 g006
Figure 7. Grid initial values strategy for ensuring solution globality (full-range scan method).
Processes 10 00663 g007
Figure 8. The changes of each parameter for both systems in the sensitivity analysis.
Processes 10 00663 g008
Figure 9. The UPC for the optimization variables of the solar-heated membrane distillation system with (a) fmincon and (b) full-range scan.
Processes 10 00663 g009
Figure 10. The UPC for the optimization variables of the PEMFC coupled solar-heated membrane distillation system with fmincon (Asc and jfc are fixed).
Processes 10 00663 g010
Figure 11. The TDP for the optimization variables of (a) the solar-heated membrane distillation system and (b) the PEMFC coupled solar-heated membrane distillation system (Asc and jfc are fixed) with fmincon.
Processes 10 00663 g011
Figure 12. (a). The heat storage tank temperature of both systems and (b) the daily water production profile with different methods.
Processes 10 00663 g012
Figure 13. The relationship of the hydrogen price to the UPC and the TAC of the PEMFC coupled solar-heated membrane distillation system.
Processes 10 00663 g013
Table 1. Characteristics of two kinds of membrane distillation systems.
Parameter DescriptionSymbolValueUnit
SolarCollector [22]
Fluid specific heat (pure water)Cpf4180J/(kg·K)
Collector efficiency factorFsc0.9-
Collector overall heat loss coefficientUsc4.7W/(m2·K)
Optical efficiency coefficientηo0.84-
Heat Storage Tank with Internal Heat Exchanger [23]
Internal heat exchanger areaAh20m2
Heat storage tank in the environment contact areaAs1.2m2
Seawater specific heatCph4080J/(kg·K)
Internal heat exchanger overall loss coefficientUh250W/(m2·K)
Heat storage tank in the environment overall loss coefficientUs1.2W/(m2·K)
Hollow Fiber DCMD Module [24]
Membrane area for heat transfer through feed side to membraneAf1m2
Knudsen-diffusion coefficientCk0.0015-
Molecular-diffusion coefficientCm5.1 × 1031/m
Poiseuille-flow coefficientCp1.297 × 10−10M
The fiber inside diameterdi0.3Mm
The fiber outside diameterdo0.424Mm
Vapor conductive coefficientkmg0.028W/(m·K)
Solid membrane conductive coefficientkms0.25W/(m·K)
The fibers lengthL0.34m
The fibers numberNf3000-
Membrane thicknessδm60μm
Porosityε75%
Packing densityφ60%
The viscosity of water vapor within the membraneμw1.08 × 10−5Pa·s
PEMFC [16]
Hydrogen specific heatCp,H228.944J/(mol·K)
Gaseous water specific heatCpg,H2O33.59J/(mol·K)
Liquid water specific heatCpl,H2O75.37J/(mol·K)
Oxygen specific heatCp,O229.696J/(mol·K)
The PEMFC specific heatCp,st4000J/(kg·K)
Faraday constantF96,484.6sA/mol
The enthalpy of combustion for hydrogen∆HH2285,500J/mol
The coolant inlet mass flow ratem0.1kg/s
Cell numberNfc112-
Anode inlet gases pressurePan2.9atm
Cathode inlet gases pressurePca3atm
Universal gas constantR8.314J/(mol·K)
Thermal resistanceRt0.145K/W
Anode inlet gases temperature T an in 323K
Cathode inlet gases temperature T ca in 323K
Membrane thicknesstm0.0178cm
Input hydrogen flow rate factorλH21.5-
Input oxygen flow rate factorλO22-
Membrane water contentλm14-
Table 2. The operating conditions of preliminary simulation for the solar-heated membrane distillation system.
Parameter DescriptionSymbolValueUnit
Solar collector areaAsc50m2
Membrane areaAm1.2m2
Heat storage tank sizeMs500kg
The primary circuit mass flow ratemf0.1kg/s
Seawater mass flow ratemh0.01kg/s
The initial water temperature of the heat storage tankTs(0)25°C
Seawater temperatureThi20°C
MD feed side outlet pressurePf(L)101.325kPa
MD permeate side inlet pressurePp(0)101.325kPa
MD permeate side outlet temperatureTp(L)25°C
MD feed side inlet velocityvf(0)0.457m/s
MD permeate side outlet velocityvp(L)0.229m/s
MD feed side inlet salt concentrationXfs(0)0.025kg salt/kg water
Table 3. The bare module cost constant factor of the heat exchanger.
SymbolB1B2k1k2k3c1, c2, c3FM
Value1.631.664.8306−0.85090.318704.6
Table 4. The bare module cost constant factor of the pump.
SymbolB1B2k1k2k3c1, c2, c3FMaFMb
Value1.891.353.38920.05360.1538014.4
Table 5. Sensitivity analysis parameter of two systems.
The Solar-Heated Membrane Distillation SystemThe PEMFC Coupled Solar-Heated Membrane Distillation System
Sensitivity Analysis ParameterSymbolSensitivity Analysis ParameterSymbol
Solar collector areaAscThe PEMFC active areaAfc
The primary circuit mass flow ratemfSolar collector areaAsc
Seawater mass flow ratemhThe PEMFC current densityjfc
Heat storage tank sizeMsThe primary circuit mass flow ratemf
The initial water temperature of the heat storage tankTs(0)Seawater mass flow ratemh
Heat storage tank sizeMs
The PEMFC massMst
The initial water temperature of the heat storage tankTs(0)
Table 6. The excluded parameters and their fixed values.
Parameter DescriptionSymbolValueUnit
The primary circuit mass flow ratemf0.1kg/s
Seawater mass flow ratemh0.01kg/s
The PEMFC massMst20kg
Table 7. The operating conditions for both systems.
Parameter DescriptionSymbolValueUnit
Membrane areaAm1.2m2
The primary circuit mass flow ratemf0.1kg/s
Seawater mass flow ratemh0.01kg/s
Seawater temperatureThi20°C
The PEMFC massMst20kg
MD feed side outlet pressurePf(L)101.325kPa
MD permeate side inlet pressurePp(0)101.325kPa
MD permeate side outlet temperatureTp L)25°C
MD feed side inlet velocityvf(0)0.457m/s
MD permeate side outlet velocityvp(L)0.229m/s
MD feed side inlet salt concentrationXfs(0)0.025kg salt/kg water
Table 8. The initial point and calculation range of optimization variable for both systems.
The Solar-Heated Membrane Distillation System
Optimal VariableInitial PointVariable Range (Upper-Lower Limit)
Asc[10, 20, …, 110, 120]
(10 steps)
10–120
Ts(0)[25, 30, …, 70, 75]
(5 steps)
25–80
Ms[1145, 1395, …, 4645, 4895]
(250 steps)
1000–5000
The PEMFC Coupled Solar-Heated Membrane Distillation System
Optimal VariableInitial PointVariable Range (Upper–Lower Limit)
jfc[0.9, 1.2, 1.5]
(0.3 steps)
0.8–1.6
Afc[60, 90, 120, 150]
(30 steps)
50–150
Asc[10, 20, …, 110, 120]
(10 steps)
10–120
Ts(0)[25, 30, …, 70, 75]
(5 steps)
25–80
Ms[1145, 1395, …, 4645, 4895]
(250 steps)
1000–5000
Table 9. The optimal results with different methods for both systems.
SystemThe Solar-Heated Membrane Distillation SystemThe PEMFC Coupled Solar-Heated Membrane Distillation System
Symbol (Unit)fminconFull-RangefminconFull-Range
Asc (m2)80.098080.1080
Ms (kg)4145264531453145
Ts(0) (°C)71.87171.670
Afc (cm2)50.07260
jfc (A/cm2)1.871.8
UPC (USD/m3)118.55119.78132.65140.05
TAC (USD/y)23,18923,16765,30971,926
TDP (m3/y)195.59193.40492.34513.58
Table 10. The unit cost details of both systems with different methods.
SystemThe Solar-Heated Membrane Distillation SystemThe PEMFC Coupled Solar-Heated Membrane Distillation System
Units Cost
Symbol)
The Cost with fmincon (USD)The Cost with Full-Range (USD)The Cost with fmincon (USD)The Cost with Full-Range (USD)
Solar collector
(psc & pscr)
9684.196729683.79672
Heat storage tank with internal heat
(pte)
201,011200,350200,851200,851
DCMD module
(pmem & pmemr)
345.6345.6345.6345.6
PEMFC
(pfc)
33,61638,870
Pump
(ppump)
63,71763,71763,71763,717
Annual fixed cost
(pfixed)
23,002.522,98140,15242,988
Unit replacement costDCMD
(pmemr)
17.2817.2817.2817.28
PEMFC
(pfcr)
10,08511,661
System maintenance cost (pM)115114.9200.42214.9
Utility costCooling water
(pw)
1.611.31.3
Electricity
(pelec)
52.652.6(−)3610(−)4306
Hydrogen
(pH2)
18,46321,349
Operating and Maintenance cost
(pO&M)
186.5185.825,15728,938
Total annual cost
(TAC)
23,18923,16765,30971,926
Publisher’s Note: MDPI stays neutral with regard to jurisdictional claims in published maps and institutional affiliations.

