Article

Differences in Physiological Metabolism and Antioxidant System of Different Ecotypes of Miscanthus floridulus under Cu Stress

1
Guangdong Provincial Key Laboratory of Environmental Health and Land Resource, School of Environmental and Chemical Engineering, Zhaoqing University, Zhaoqing 526061, China
2
Shunde Polytechnic, Shunde 528300, China
3
School of Environmental and Chemical Engineering, Foshan University, Foshan 528000, China
4
School of Environmental Science and Engineering, Guilin University of Technology, Guilin 541004, China
5
School of Environmental Science and Engineering, Sun Yat-Sen University, Guangzhou 510275, China
*
Authors to whom correspondence should be addressed.
Processes 2022, 10(12), 2712; https://doi.org/10.3390/pr10122712
Submission received: 22 November 2022 / Revised: 12 December 2022 / Accepted: 13 December 2022 / Published: 15 December 2022
(This article belongs to the Special Issue Advances in Remediation of Contaminated Sites: Volume II)

Abstract

:
To reveal the similarities and differences in the resistance mechanisms of different ecotypes to Cu stress, a pot experiment was used to systematically compare the physiological responses of non-mining ecotype Miscanthus floridulus (collected from Boluo County, Huizhou City) and mining ecotype Miscanthus floridulus (collected from Dabaoshan mining area) under different Cu concentrations. The results showed that chlorophyll a, chlorophyll b and total chlorophyll in the leaves of the two ecotypes of M. floridulus were negatively correlated with Cu stress concentration (p < 0.01), but the extent of decrease for the ecotypes in the mining area was lower than that for the ecotypes in the non-mining area. The values of chlorophyll a/b for both ecotypes increased with increasing Cu treatment concentration, indicating that Cu is more harmful to chlorophyll b than to chlorophyll a for M. floridulus. Cu stress can lead to the accumulation of malondialdehyde (MDA) in the leaves of M. floridulus with the amount of MDA accumulation observed being greater in the non-mining ecotype than in the mining ecotype (p < 0.05). The content of antioxidant substances (ascorbic acid and reduced glutathione) in the mining ecotype M. floridulus was significantly higher than that in the non-mining ecotype. The activity of SOD in the leaves of non-mining ecotypes was inhibited by Cu stress and the activity of POD was increased by Cu stress. However, the increase in POD in the mining ecotypes was greater than that in the non-mining ecotypes and the activities of the two enzymes in the mining ecotypes were significantly higher than those in the non-mining ecotypes at the highest concentration of Cu. Cu had different effects on PPO activity in the leaves of the two ecotypes of M. floridulus. The plant leaves of the non-mining ecotype at 400 and 800 mg·kg−1 were significantly fewer than those of the control group (p < 0.05), which were 87.1% and 65.2% of the control group, respectively. The PPO activity in the plant leaves of the mining ecotype was higher than that in the leaves of the non-mining ecotype and was significantly higher at 400 and 800 mg·kg−1 than that of the control group (p < 0.05), at 226.5% and 268.1% of the control group, respectively. These results indicate that the mining ecotype M. floridulus is more resistant to copper stress, that resistant ecotypes have been formed, and that small-molecule antioxidant substances play an important role in increasing resistance levels.

1. Introduction

With increasing growth in Cu-containing pollutants in industry, agriculture, transportation and other fields, especially in recent years, the frequent use of Cu-containing pesticides in agricultural production, the excessive mining of copper ores and the huge discharge of Cu-containing pollutants in industrial production have resulted in serious harm to animals, plants and the environment, and even endangered human health [1,2,3]. These harms to the ecosystem have attracted the attention of researchers [4,5]. The phytoremediation of mining wasteland with (super) enriched plants and tolerant plants is currently considered to be an economical and effective method [6,7]. Therefore, screening new repair species and exploring their mechanisms of tolerance to heavy metals has become a focus of academic research [8,9].
Previous studies have shown that, due to its long-term survival in a polluted environment, Miscanthus floridulus in metal mining areas may have undergone resistance evolution adapted to the polluted environment and formed resistant ecotypes [10,11,12]. Liao Bin et al. [13] found that there were significant differences in the critical concentration and symptoms of Cu poisoning between the two ecotypes of Commelina communis. The differences in the resistance mechanisms of different ecotypes to heavy metal stress may be caused by variation in genetic mechanisms, the functioning of the antioxidant enzyme system or the detoxification of heavy metal chelation, but there is no consensus at present [14,15,16]. M. floridulus is a perennial herb plant of the Miscanthus genus, which is widely distributed in southern China and is highly adaptable [17,18]. Sun Jian et al. [19] investigated heavy metal pollution in the soil and plants in a lead–zinc mining area in Chenzhou, Hunan Province, and found that M. floridulus had a large capacity for absorption and transport of lead and copper. Studying the physiological and ecological differences between resistant ecotypes and sensitive ecotypes is a valuable approach for revealing the mechanisms of plant resistance and underpins the widespread use of phytoremediation technology [20,21,22].
The Dabaoshan mine, located at the junction of Qujiang County and Wengyuan County, Shaoguan City, Guangdong Province, is a large iron polymetallic sulfide-associated deposit [23]. Zhao et al. [24] investigated the soil of Dabaoshan and found that heavy metal Cd pollution in the soil of Dabaoshan was the most severe, with more than 81.19% of the soil contaminated by Cd. Furthermore, more than 72.91% of the soil evidenced Cu pollution. According to a study of plants in the Dabaoshan mining area by Chen et al. [25], the rhizosphere of M. floridulus can activate Cu and other heavy metals significantly and may be considered a pioneer plant for local vegetation restoration. Qin et al. [26,27] conducted a number of studies on soil heavy metal content, soil enzyme activity and vegetation restoration in the Dabaoshan lead-zinc mining area. The results showed that M. floridulus was beneficial in accelerating the ecological restoration of abandoned mining areas. Previous studies have also shown that M. floridulus can grow normally in the heavily polluted tailings ponds in the Dabaoshan mining area and that its roots can absorb and fix heavy metal copper. Moreover, its biomass is large, so it represents good plant repair material [28,29].
To better apply M. floridulus to soil heavy metal pollution remediation practice, it is necessary to conduct in-depth research concerning the changes to its physiological and biochemical mechanisms. In this study, through soil culture experimentation, the physiological metabolism and antioxidant enzyme activity response of two ecotypes of M. floridulus under Cu stress were compared to provide a theoretical basis for the rational application of M. floridulus in the future phytoremediation of Cu-contaminated soil.

2. Materials and Methods

2.1. Materials

The experimental material was M. floridulus seedlings. New seedlings of the current year were collected in early March. The mining ecotype M. floridulus was collected from Dabaoshan Mining area, Shaoguan, Guangdong (24°33′36.6″ N, 113°43′14.0″ E), while the non-mining ecotype M. floridulus was collected from the hills and mountains of Boluo County, Huizhou, Guangdong (23°08′57.8″ N, 114°21′10.0″ E), in the same subtropical monsoon climate zone. The seedlings with soil were collected in the wild and immediately brought back to the school’s greenhouse. The roots were rinsed with running water to prepare for planting experiments.

2.2. The Experimental Soil

The soil for this test was taken from the teaching vegetable garden of South China Agricultural University. The air-dried soil, screened to 2 mm, was put into plastic pots, with 1.2 kg per pot. The base fertilizer standard was 100 mg N kg−1 dry soil, added as H2NCONH2, and 80 mg P kg−1 and 100 mg K kg−1, added as KH2PO4. This was mixed well and set aside.
The total amounts of Zn, Pb, Cu, and Cd in the soil were determined by digestion using HCl, HF, and perchloric acid, and then by ICP-OES (Optima5300DV, Perkin-Elmer, Sheldon, CT, USA) [30]. The basic chemical properties of the soil were determined using soil agrochemical analysis methods [31].
The basic chemical properties and heavy metal contents of the soil at the plant sample collection site and the test soil are shown in Table 1.

2.3. The Experimental Design

The levels of Cu stress treatment were: CK (control), 50 mg·kg−1, 100 mg·kg−1, 200 mg·kg−1, 400 mg·kg−1, and 800 mg·kg−1. Cu was added in the form of CuSO4·5H2O. After the soil was thoroughly mixed, deionized water was added to the soil pre-culture. After the soil was stable for 14 days, the M. floridulus seedlings were transplanted. Plants of the same weight and height were selected, separated according to the mining ecotypes and non-mining ecotypes, and assigned to each treatment concentration. Each ecotype was planted with 3 pots per treatment and 3 plants per pot. After transplantation, the soil in the basin was kept at 65% of the field water capacity. The physiological indexes were determined after 60 days of Cu stress.

2.4. Test Index and Method

The photosynthetic pigment of leaves was determined by an extraction method [32] using a 752 N ultraviolet spectrophotometer.
Preparation of supernatant extract: take 0.2 g of the blade to be tested (the last but one blade at the top), grind it quickly in an ice bath to homogenate, add 20 mL of precooled 0.05 mmol·L−1, pH 7.8 phosphoric acid buffer solution in batches, and centrifuge it at 4 ℃ for 10 min at 7000 r·min−1. The supernatant extract was used for the determination of protein content, superoxide dismutase (SOD), peroxidase (POD), polyphenol oxidase (PPO) activity and malondialdehyde (MDA) content.
The activity of SOD, POD and PPO was determined by the method introduced by Li Hesheng et al. [32]; the activity of SOD was determined by the nitrogen blue tetrazole (NBT) method; the activity of POD was determined by the guaiacol method; and the activity of PPO was determined by the colorimetric method.
The method of Zhang and Qu [33] was used for the determination of MDA. An amount of 2 mL of enzyme solution was taken and 2 mL of 0.67% TBA (thiobarbituric acid) was added. After mixing, the solution was boiled in a 100 ℃ water bath for 30 min, cooled down, and centrifuged again. The absorbance values of the supernatant at 450 nm, 532 nm and 600 nm were measured.
The permeability of the cell membrane was measured using a conductance meter [33], with slight changes in the procedure as follows: take 0.2 g of fresh leaves; wash and cut them with high-purity water; soak them in 20 mL of high-purity water; vacuum them with a vacuum extractor for 20 min; take them out and leave them to stand for 20 min; shake the leaves gently during this process, then measure the conductivity S1 with a conductivity meter (DDS-12, Shanghai, China) at a constant temperature of 20~25 °C; place them in a boiling water bath for 15 min after measurement; after cooling to room temperature, measure the conductivity S2; S1/S2 × 100% is the relative injury rate.
For the determination of ascorbic acid (AsA) content, the chemical colorimetric method introduced by Chen and Wang [34] was used. For determination of reduced glutathione (GSH) content, GSH extraction involved the same sample extraction method as for MDA. The method of Chen Jianxun et al. [34] was used for determining the GSH content and the mercapto reagent DTNB was used for determination.
Three strains were selected and tested for all indexes; all tests were repeated more than 3 times.

2.5. Data Processing

The statistical analysis of data was performed using a combination of Microsoft Excel 2007 and IBM SPSS Statistics 20.0 software. The significance of differences between means was analyzed using Duncan’s multiple comparisons test (SSR test, p < 0.05).

3. Results

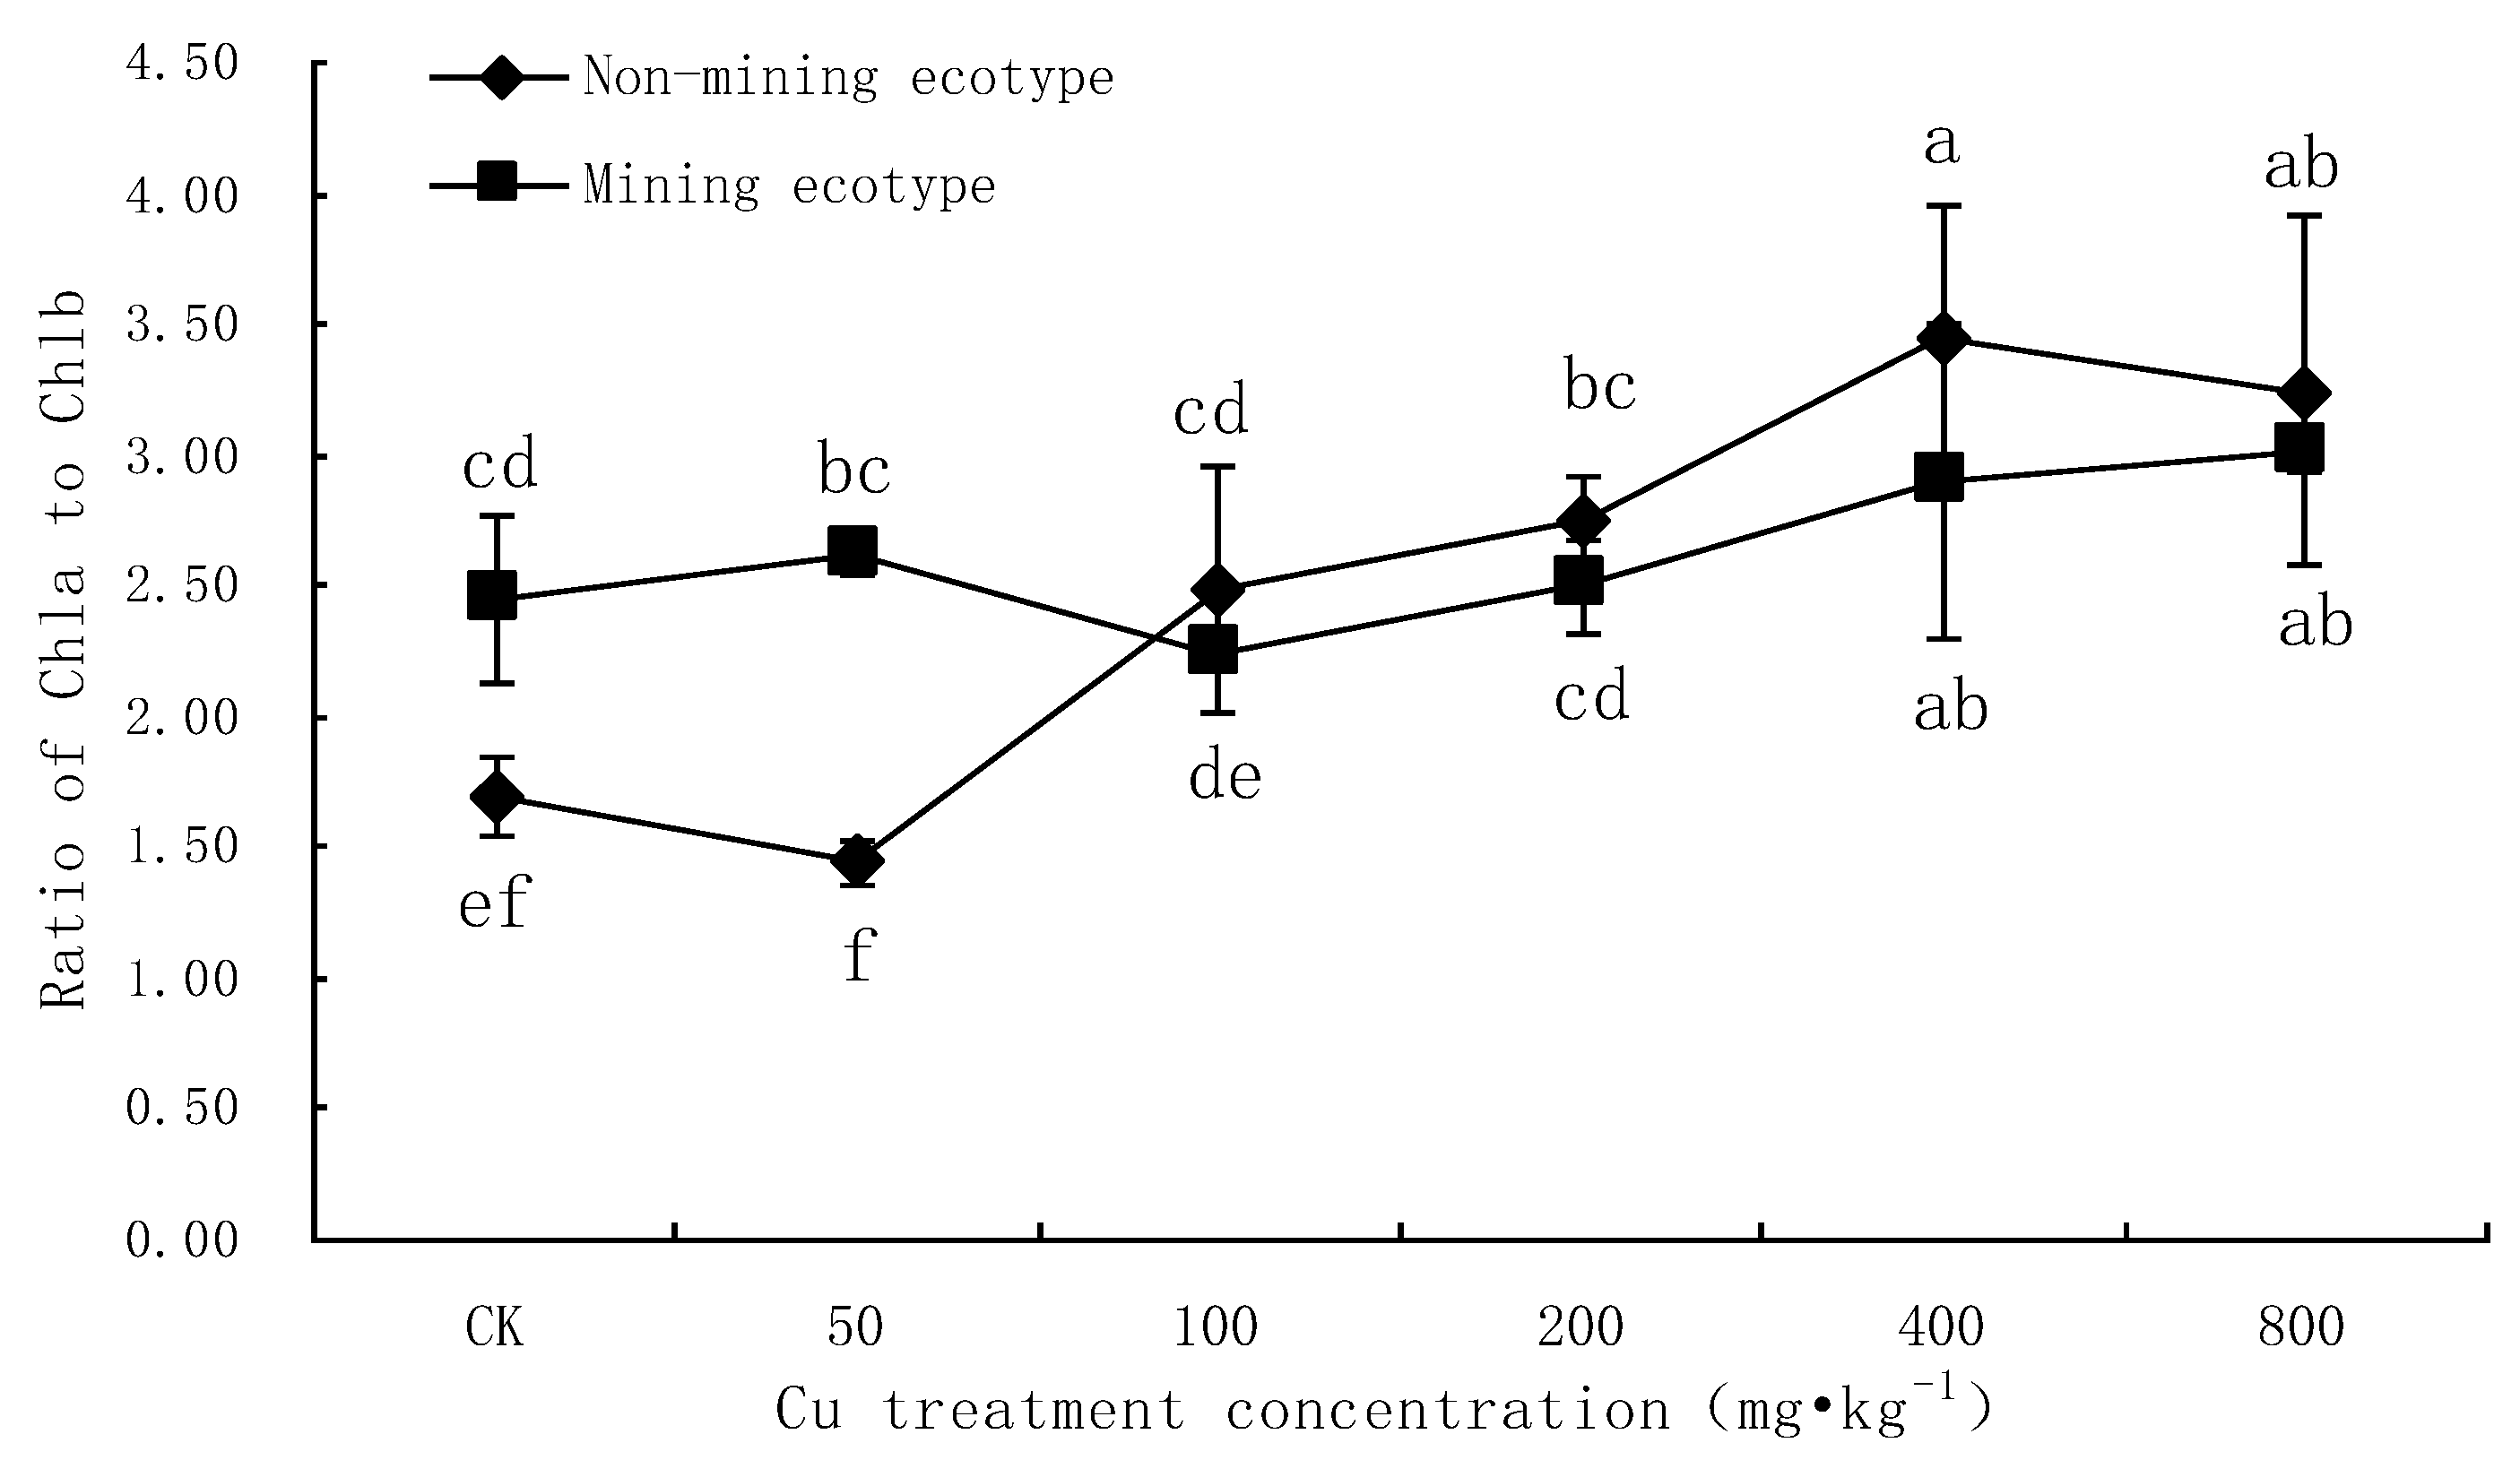
3.1. Effect of Cu Stress on Chlorophyll Content in Leaves of M. floridulus

Table 2 of the experimental results shows that, with increase in Cu treatment concentration, chlorophyll a, chlorophyll b, carotenoids and the total amount of chlorophyll in the leaves of the two ecotypes of M. floridulus decreased.
Under low concentration Cu stress (50 mg·kg−1), the various chlorophyll components and the total amount of chlorophyll of the non-mining ecotype plants increased slightly, but the difference did not reach a significant level (p > 0.05), indicating that the low concentration Cu stress slightly stimulated the chlorophyll synthesis of M. floridulus. When the concentration of Cu was greater than 100 mg·kg−1, the various components of chlorophyll, and the total amount of chlorophyll, began to decline significantly; the difference between the two ecotypes was significant (p < 0.05). The content of chlorophyll a, chlorophyll b, carotenoids and total chlorophyll in the 400 mg·kg−1 treatment group were 83.5%, 38.5%, 78.1% and 62.2% of the control group, respectively.
The contents of chlorophyll and the total amount of chlorophyll in the leaves of the mining ecotype M. floridulus showed a downward trend with increase in Cu concentration, but the degree of decline was not as large as that for the non-mining ecotype M. floridulus. Chlorophyll a and chlorophyll b concentrations were statistically different from the control group for the 400 mg·kg−1 and 800 mg·kg−1 treatment groups (p < 0.05). The total amount of chlorophyll was statistically different from the control for the 800 mg·kg−1 treatment group (p < 0.05), being 84.4% of the total chlorophyll in the control group.
As shown in Figure 1, with increase in Cu treatment concentration, the chlorophyll a/b value in the leaves of the two ecotypes of M. floridulus showed a trend of first decreasing and then increasing. The plant growth of the non-mining ecotype was more obvious. However, while the chlorophyll a/b values were higher than the control for most treatment groups, the chlorophyll a/b value for the 50 mg·kg−1 treatment group was slightly lower than that of the control group (85.5% of the control group). For the 400 mg·kg−1 treatment, the chlorophyll a/b value was 2.04 times that of the control group. The change in the chlorophyll a/b value of ecotype plants in the mining area was gentle, but also showed a trend of first decreasing and then increasing, being 1.25 times that of the control at 800 mg·kg−1. These results suggest that Cu has a more harmful effect on chlorophyll b than chlorophyll a in the leaves of M. floridulus.

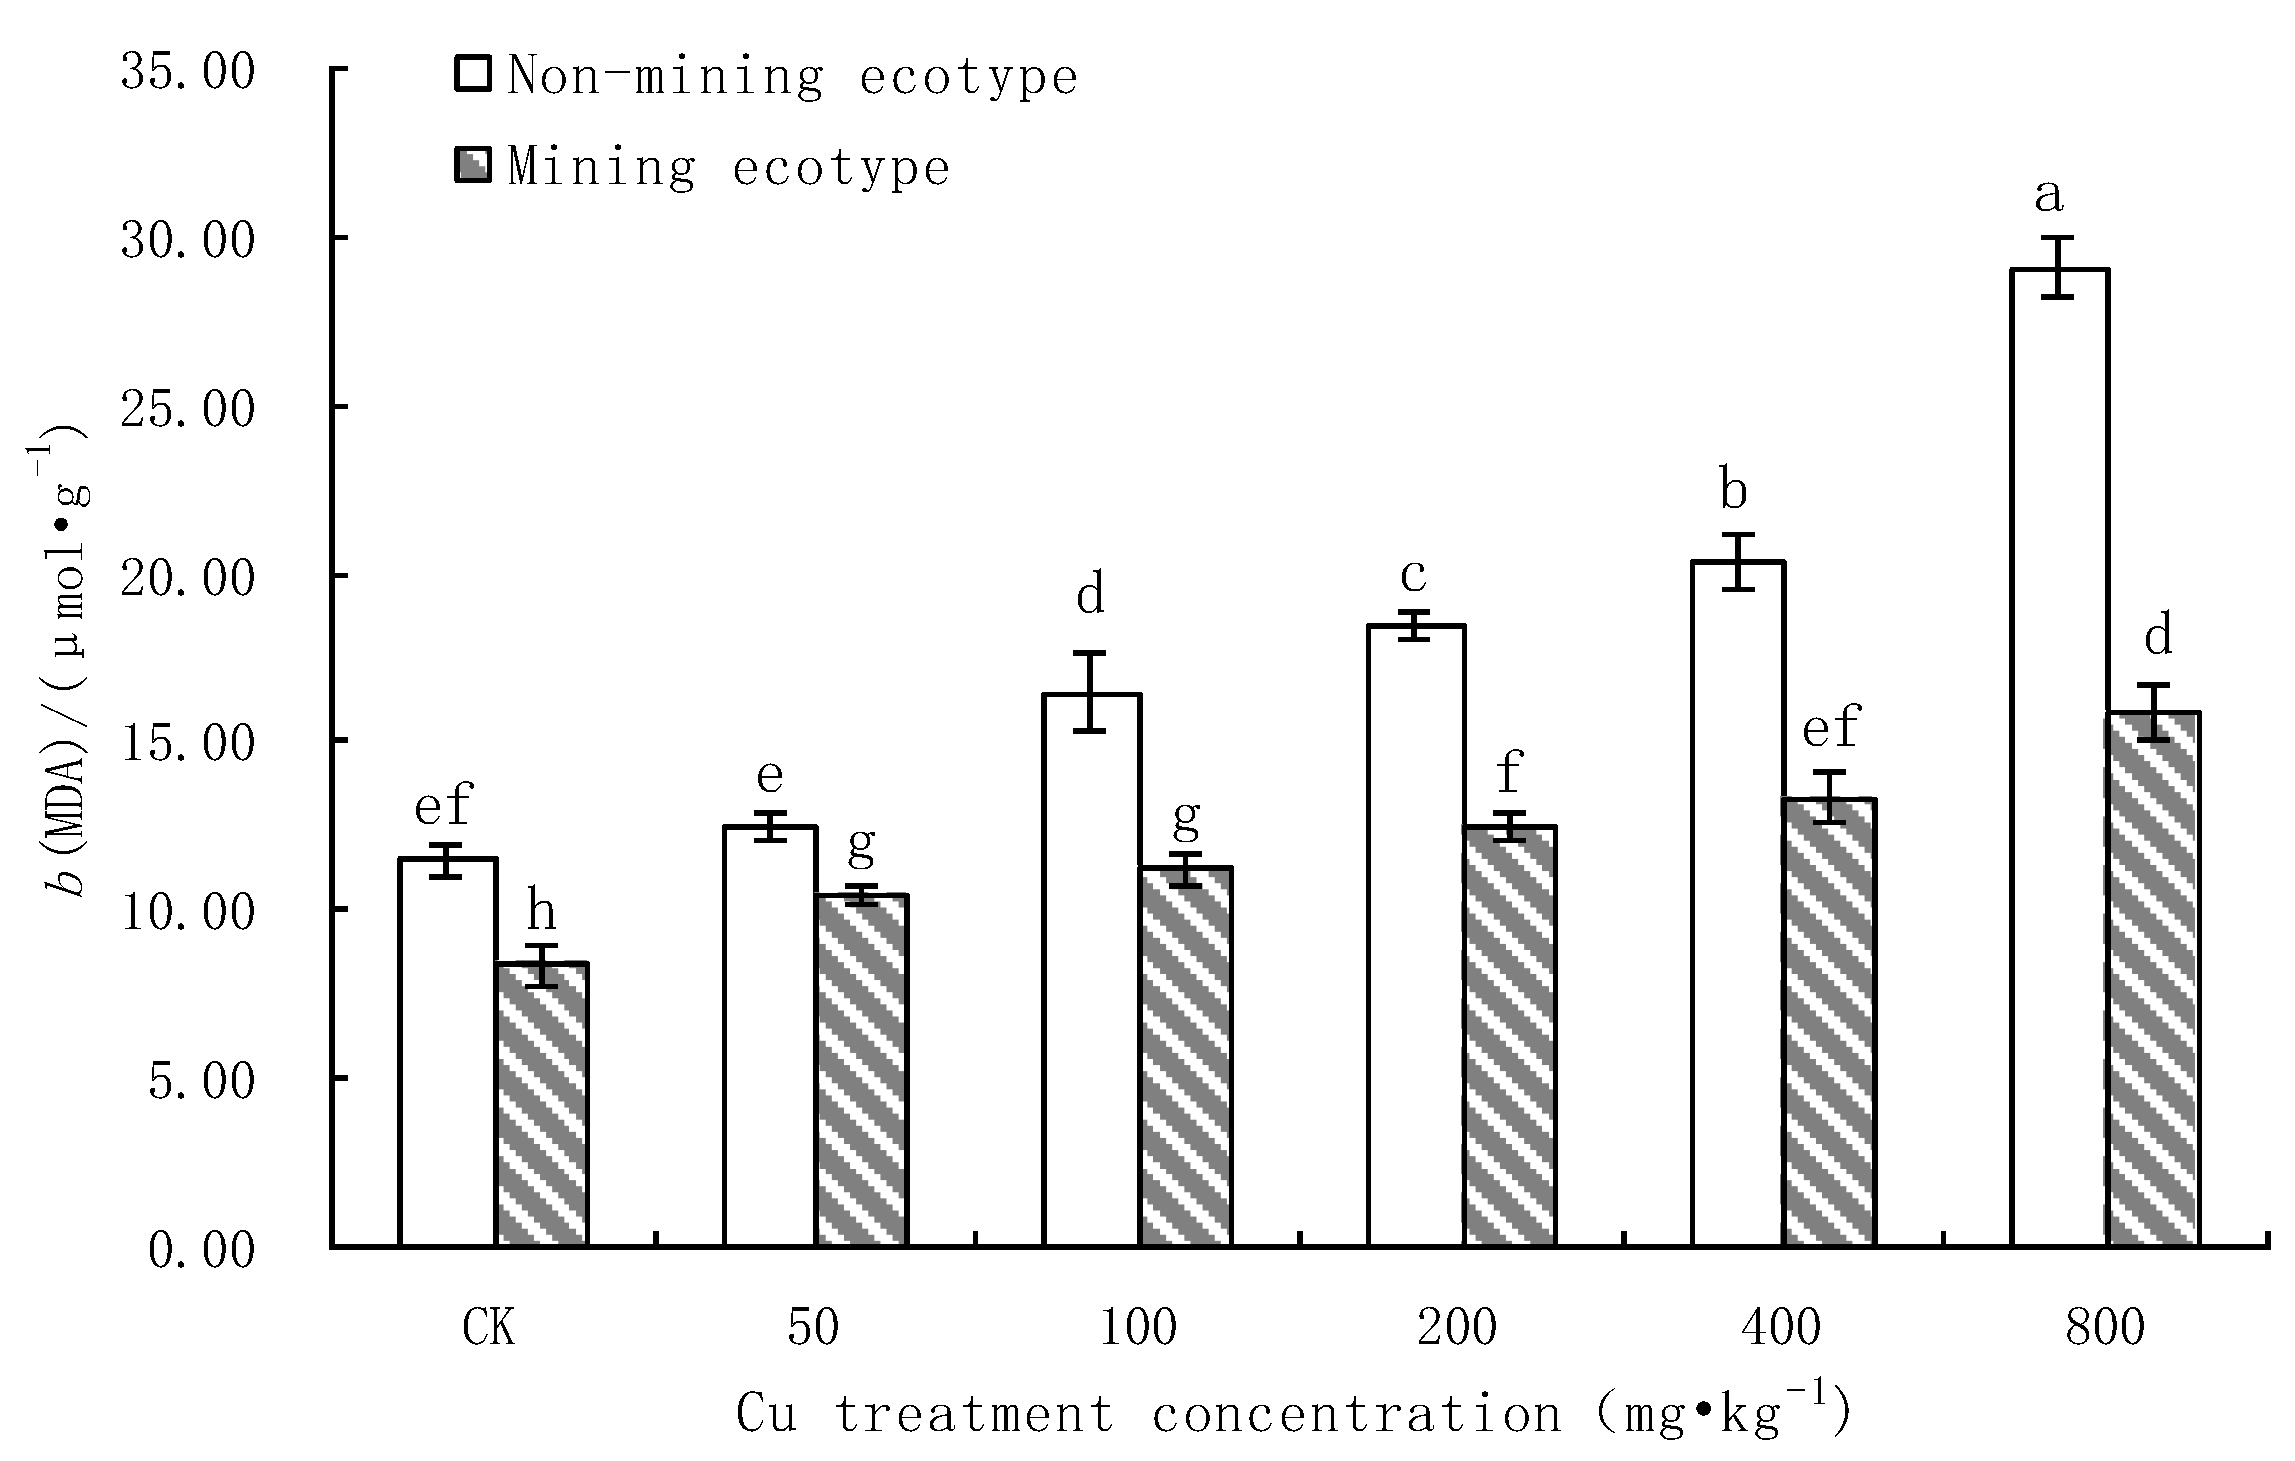
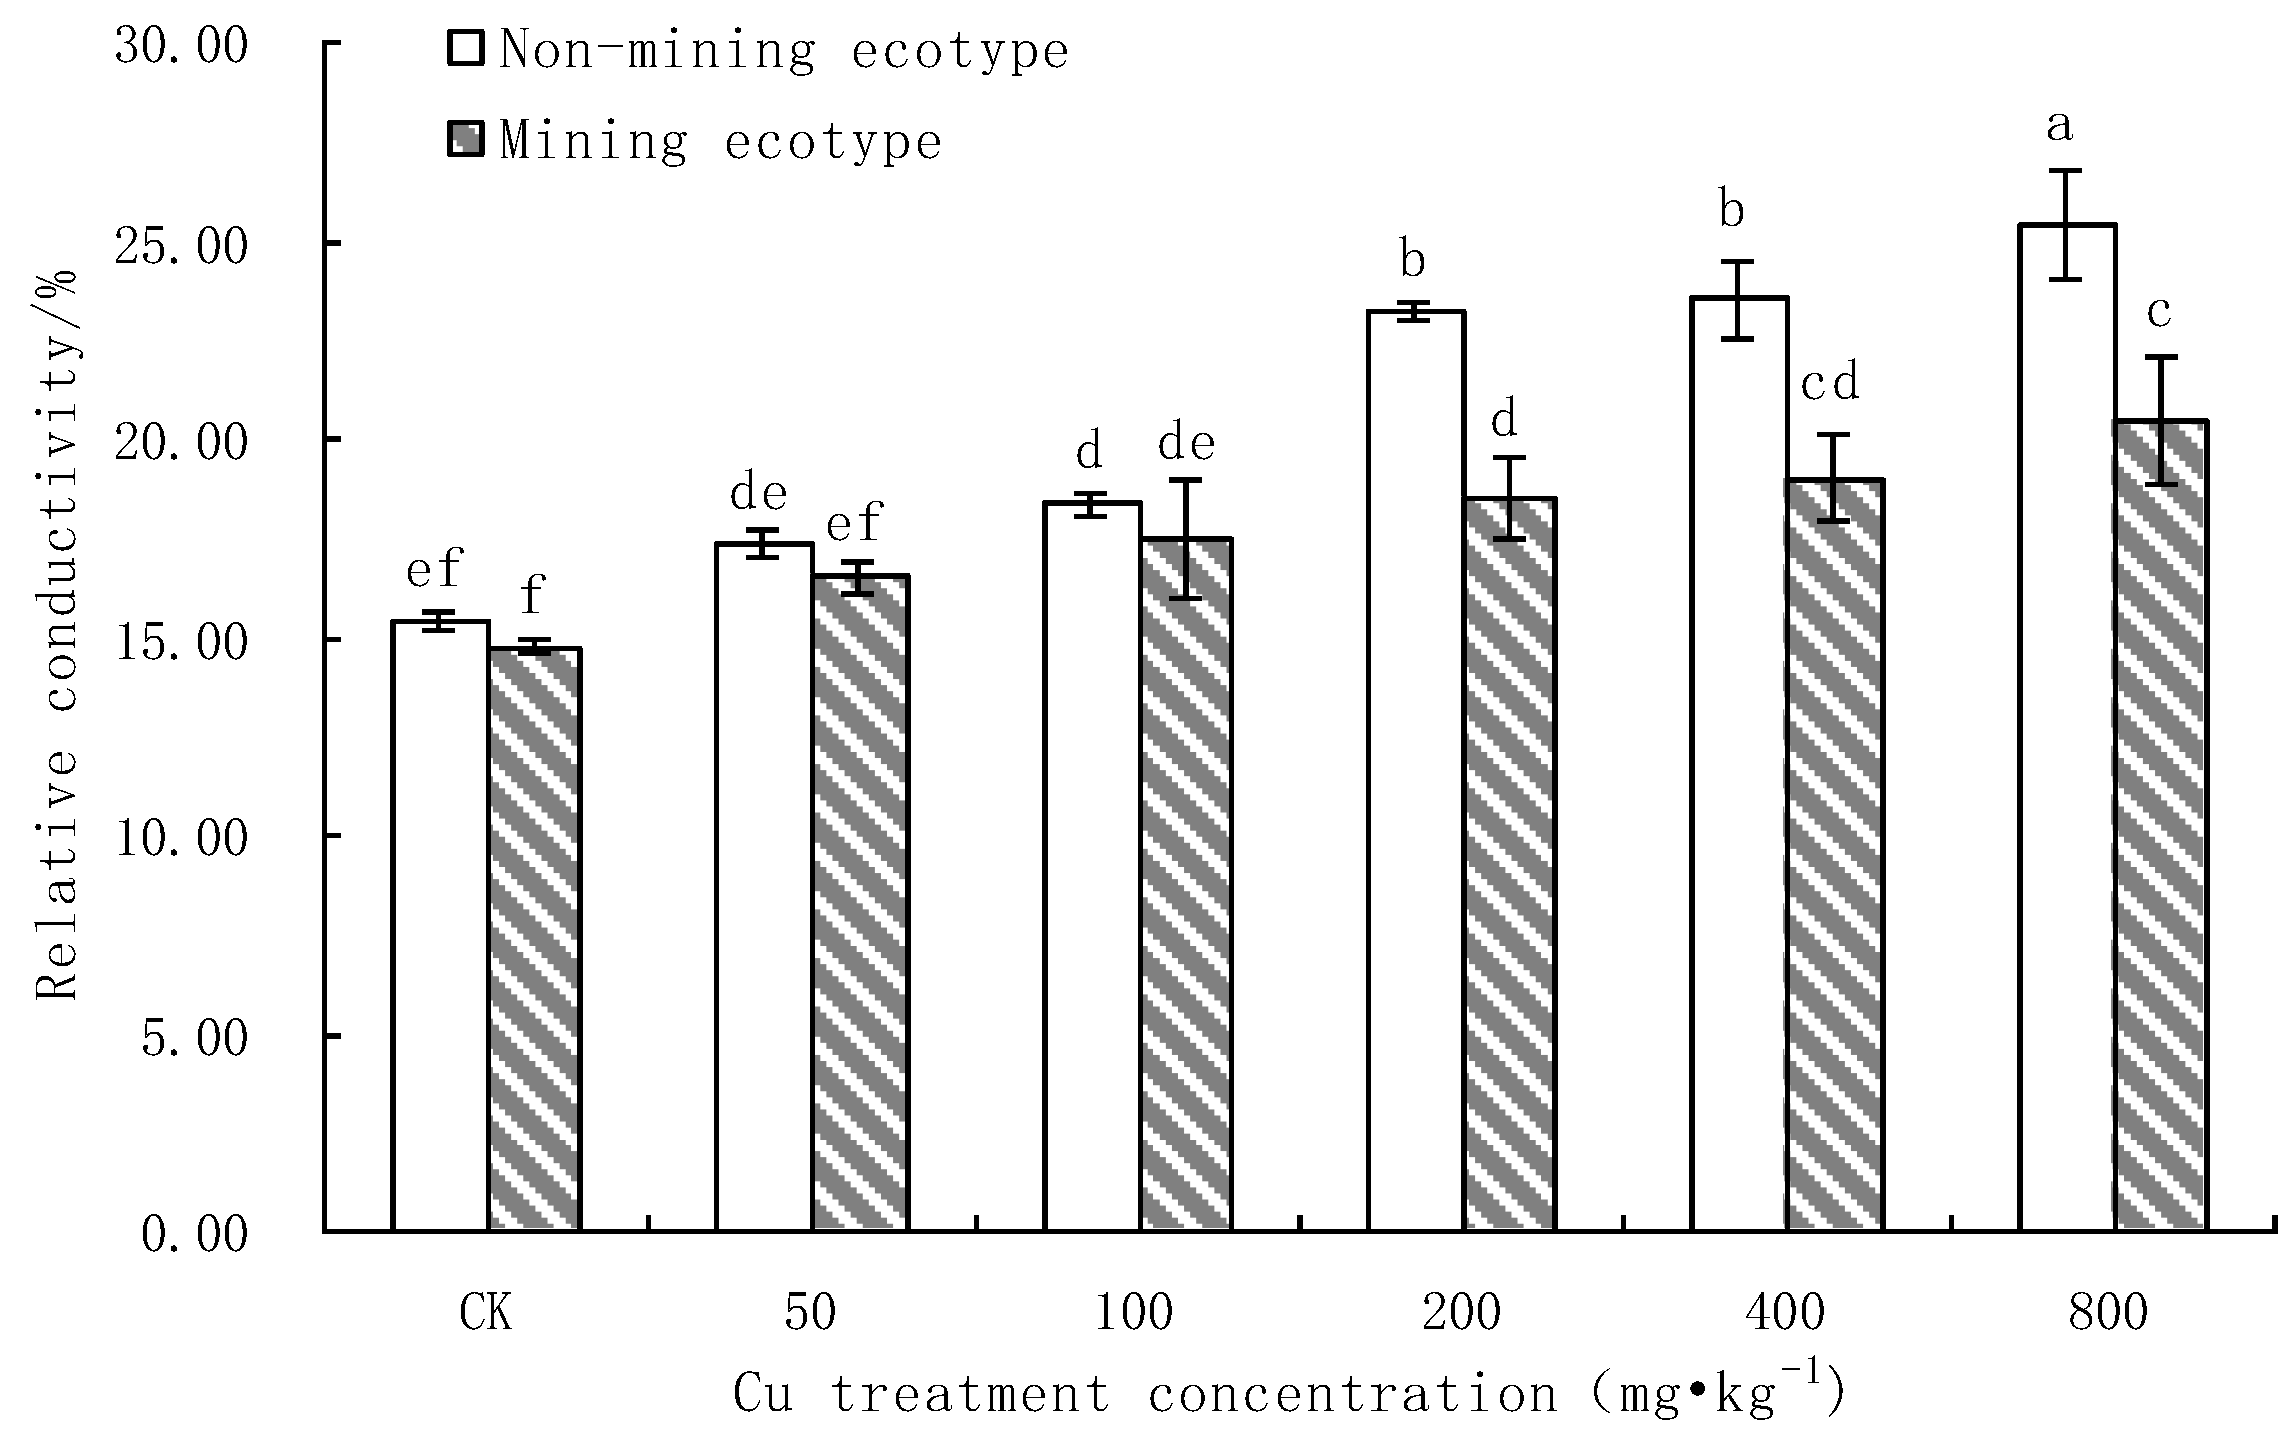
3.2. The Effect of Cu Stress on the Membrane Protection System of M. floridulus

(1)
Effects of Cu stress on MDA content in leaves of M. floridulus
Malondialdehyde (MDA) is the product of membrane lipid peroxidation in plants, and its content reflects the degree of damage to plant cells caused by membrane lipid peroxidation generated by reactive oxygen species [35]. As can be seen from Figure 2, with increase in Cu treatment concentration, the MDA content in the leaves of the non-mining ecotype M. floridulus increased significantly and was significantly increased compared with the control (p < 0.05). The MDA levels were 108.5%, 122.1%, 135.1%, 151.3% and 213.2% of the control for each treatment concentration group, respectively. The amount of MDA in the leaves of the mining ecotype M. floridulus gradually increased with Cu treatment concentration, but the increase was not significant. The content of MDA in the treatment concentration groups was 123.1%, 135.2%, 152.3%, 159.5% and 189.5% of the control group, respectively. Under each treatment concentration, the MDA content of the non-mining ecotype plants was significantly higher than that of the mining ecotype plants (p < 0.05). The gradual increase in MDA content may have been due to the increased Cu treatment concentration, which gradually accumulated free radical content in the plant that could not be removed in time, resulting in severe oxidation of the cell membrane lipids and cell damage. Through regression analysis, for the non-mining ecotype b(MDA) = 0.0084x + 12.61 (x is the concentration of Cu, R2 = 0.95, p < 0.05), and for the mining ecotype b(MDA) = 0.0032x + 9.85 (x is the concentration of Cu, R2 = 0.83, p < 0.05). The results indicate that Cu had a substantial influence on the content of MDA in the leaves of the non-mining ecotype M. floridulus. MDA levels were significantly higher in non-mining ecotype plants than in mining ecotype plants, indicating that non-mining ecotype plants experienced more severe lipid oxidation in their cell membranes.
(2)
Effect of Cu Stress on Cell Membrane Permeability in Leaves of M. floridulus
The permeability of the cell membrane is one of the indicators to evaluate the response of plants to pollution; an increase in cell membrane permeability is mainly manifested in an increase in relative electrical conductivity [36]. As can be seen from Figure 3, in the case of CK, there was no significant difference in the membrane permeability of the two ecotypes (p > 0.05) and the relative electrical conductivity of the leaf membrane showed an increasing trend with increase in Cu treatment concentration. Under a Cu treatment concentration of 400–800 mg·kg−1, the relative electrical conductivity of plant leaves of the non-mining ecotype was 131.5%, 135.1%, 151.7% and 156.8% of the control, and that of the mining ecotype was 118.9%, 124.4% and 133.1% of the control, respectively. There were significant differences between the two ecotypes and the control (p < 0.05). The cell membrane permeability of the non-mining ecotype plants was higher than that of the mining ecotype plants; the difference was significant at the 400–800 mg·kg−1 treatment concentrations (p < 0.05).

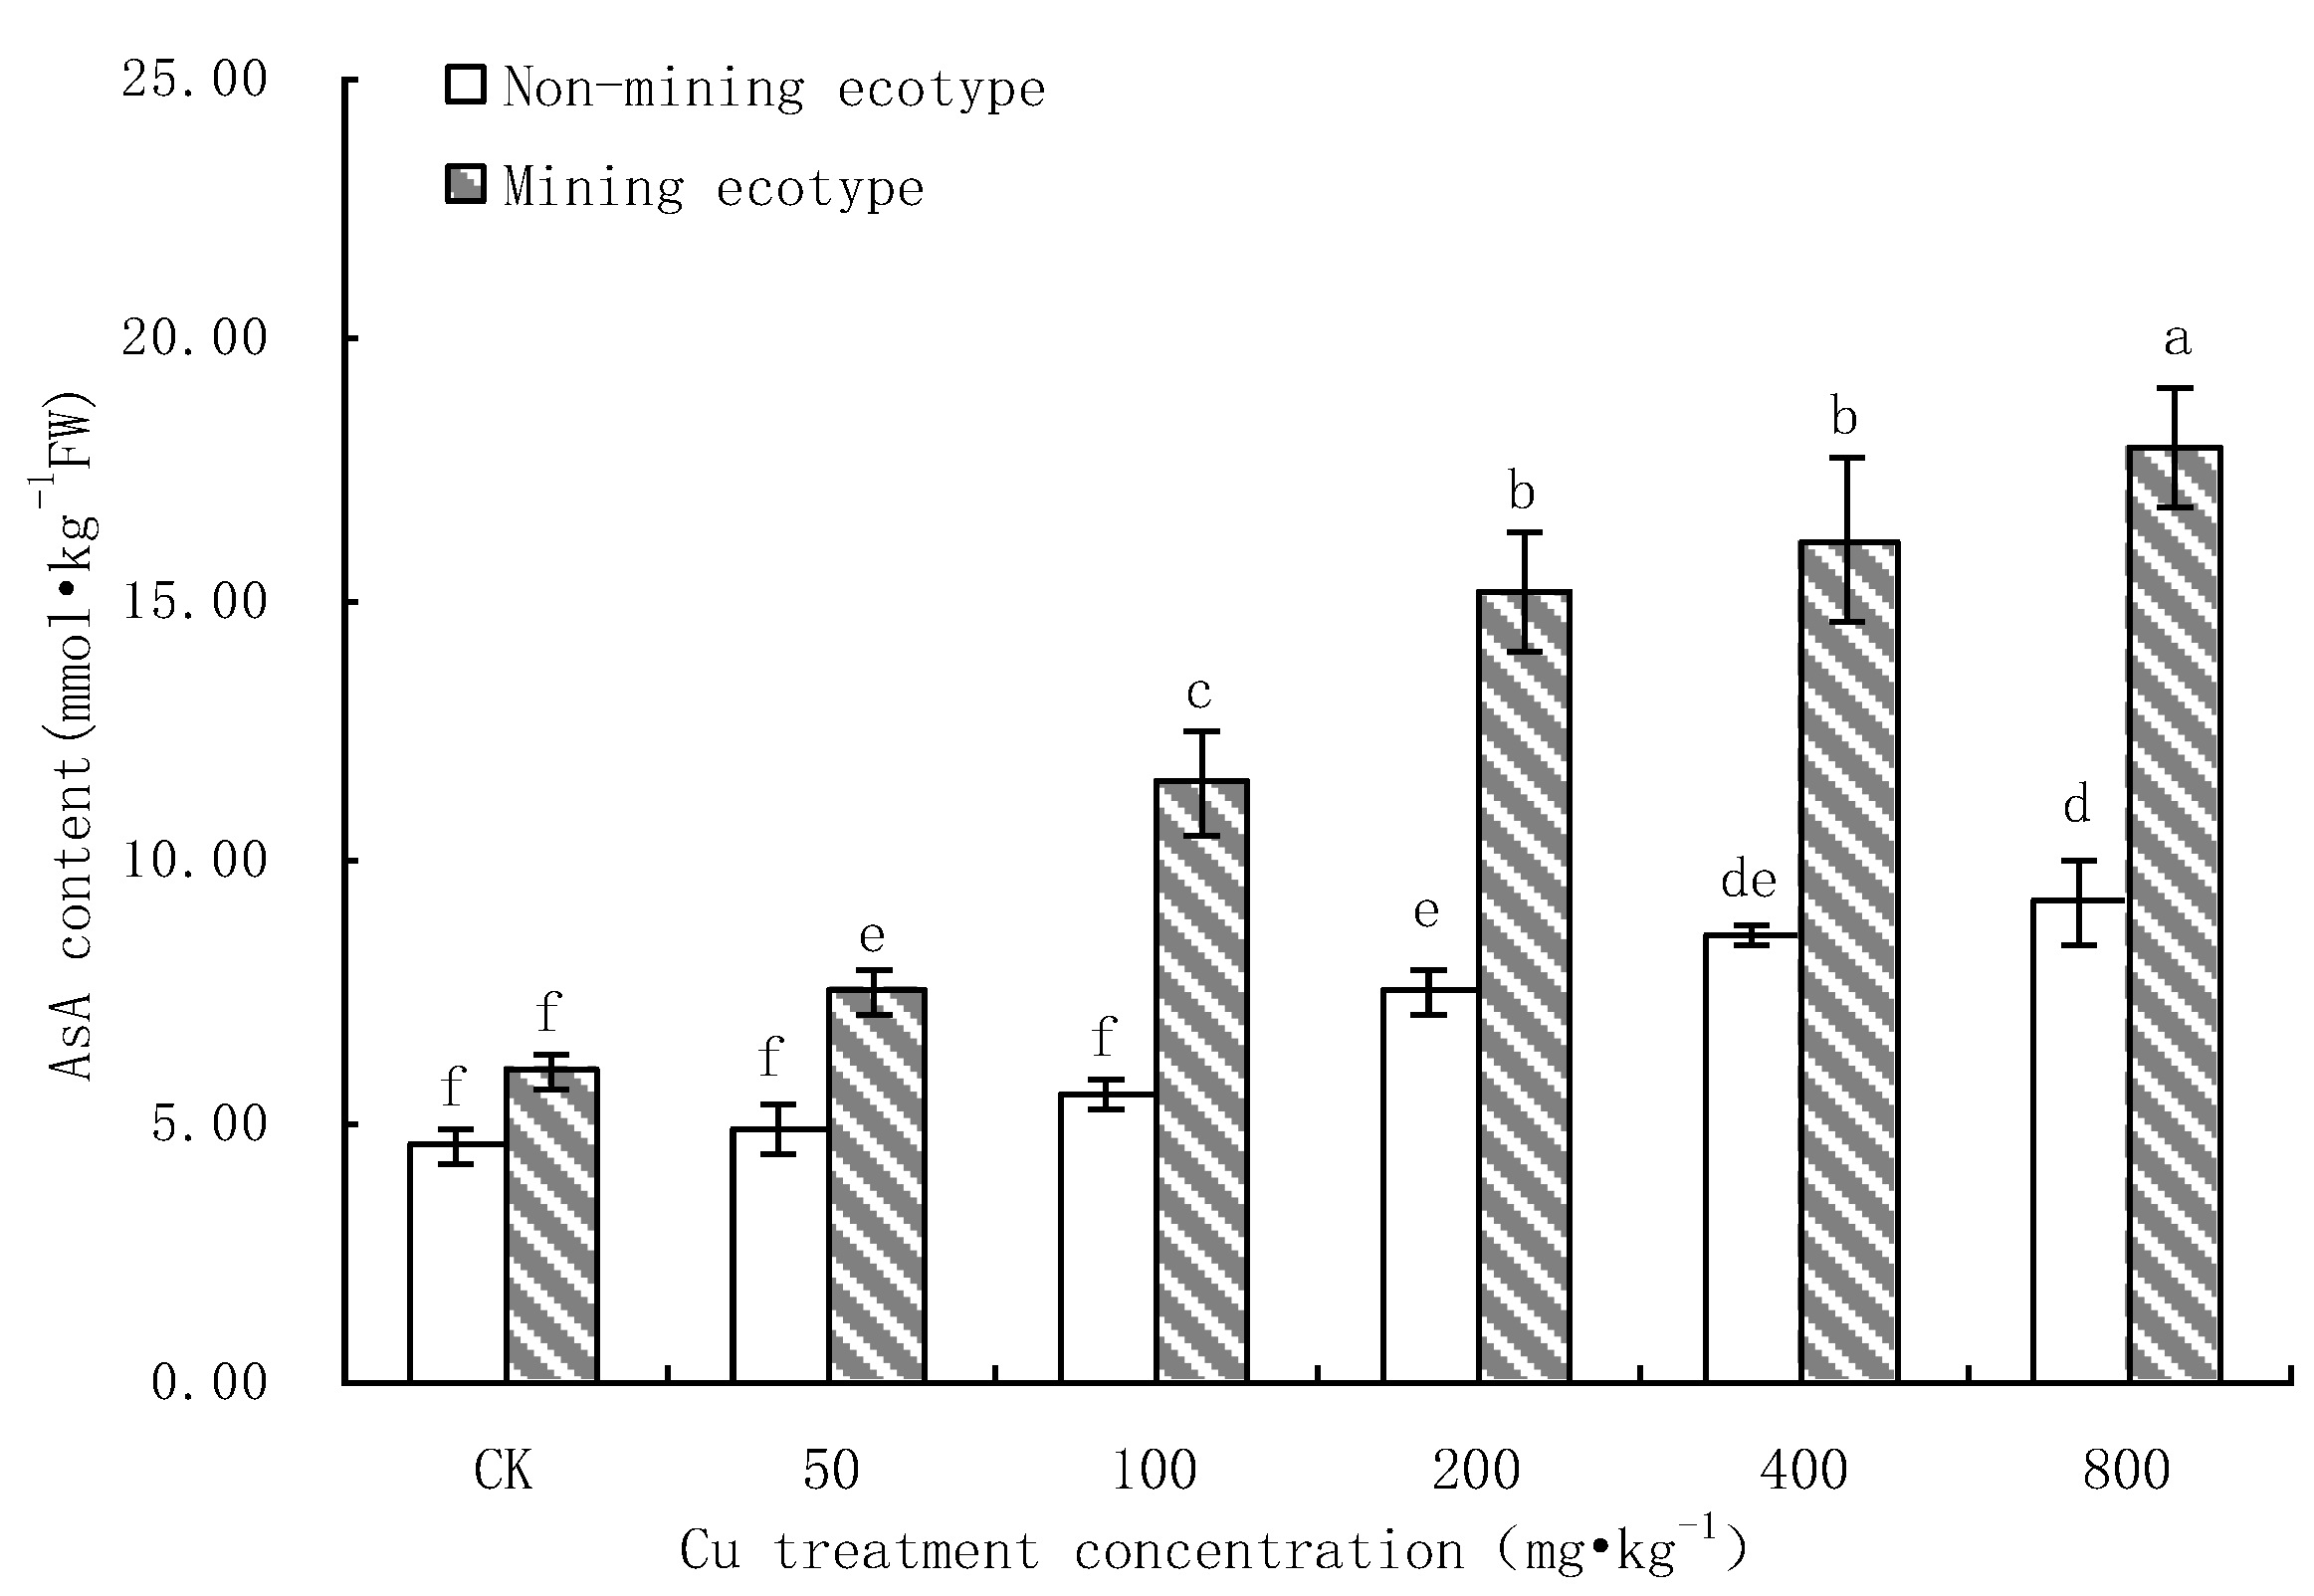
3.3. Effect of Cu Stress on AsA Content of M. floridulus

As can be seen in Figure 4, the AsA content of the non-mining ecotype M. floridulus gradually increased with Cu concentration, with a similar pattern of change to that of the mining ecotype M. floridulus. However, in general, the ascorbic acid content of the mining ecotype M. floridulus was significantly higher than that in the non-mining ecotype (p < 0.05). At higher Cu concentrations (400 mg·kg−1 and 800 mg·kg−1), the AsA content of both ecotypes of M. floridulus was significantly different from that of the corresponding control group (p <0.05). The AsA content of the mining ecotype M. floridulus was 2.74 times (400 mg·kg−1 Cu treatment) and 1.90 times (800 mg·kg−1 Cu treatment) that of the non-mining ecotype M. floridulus, respectively.

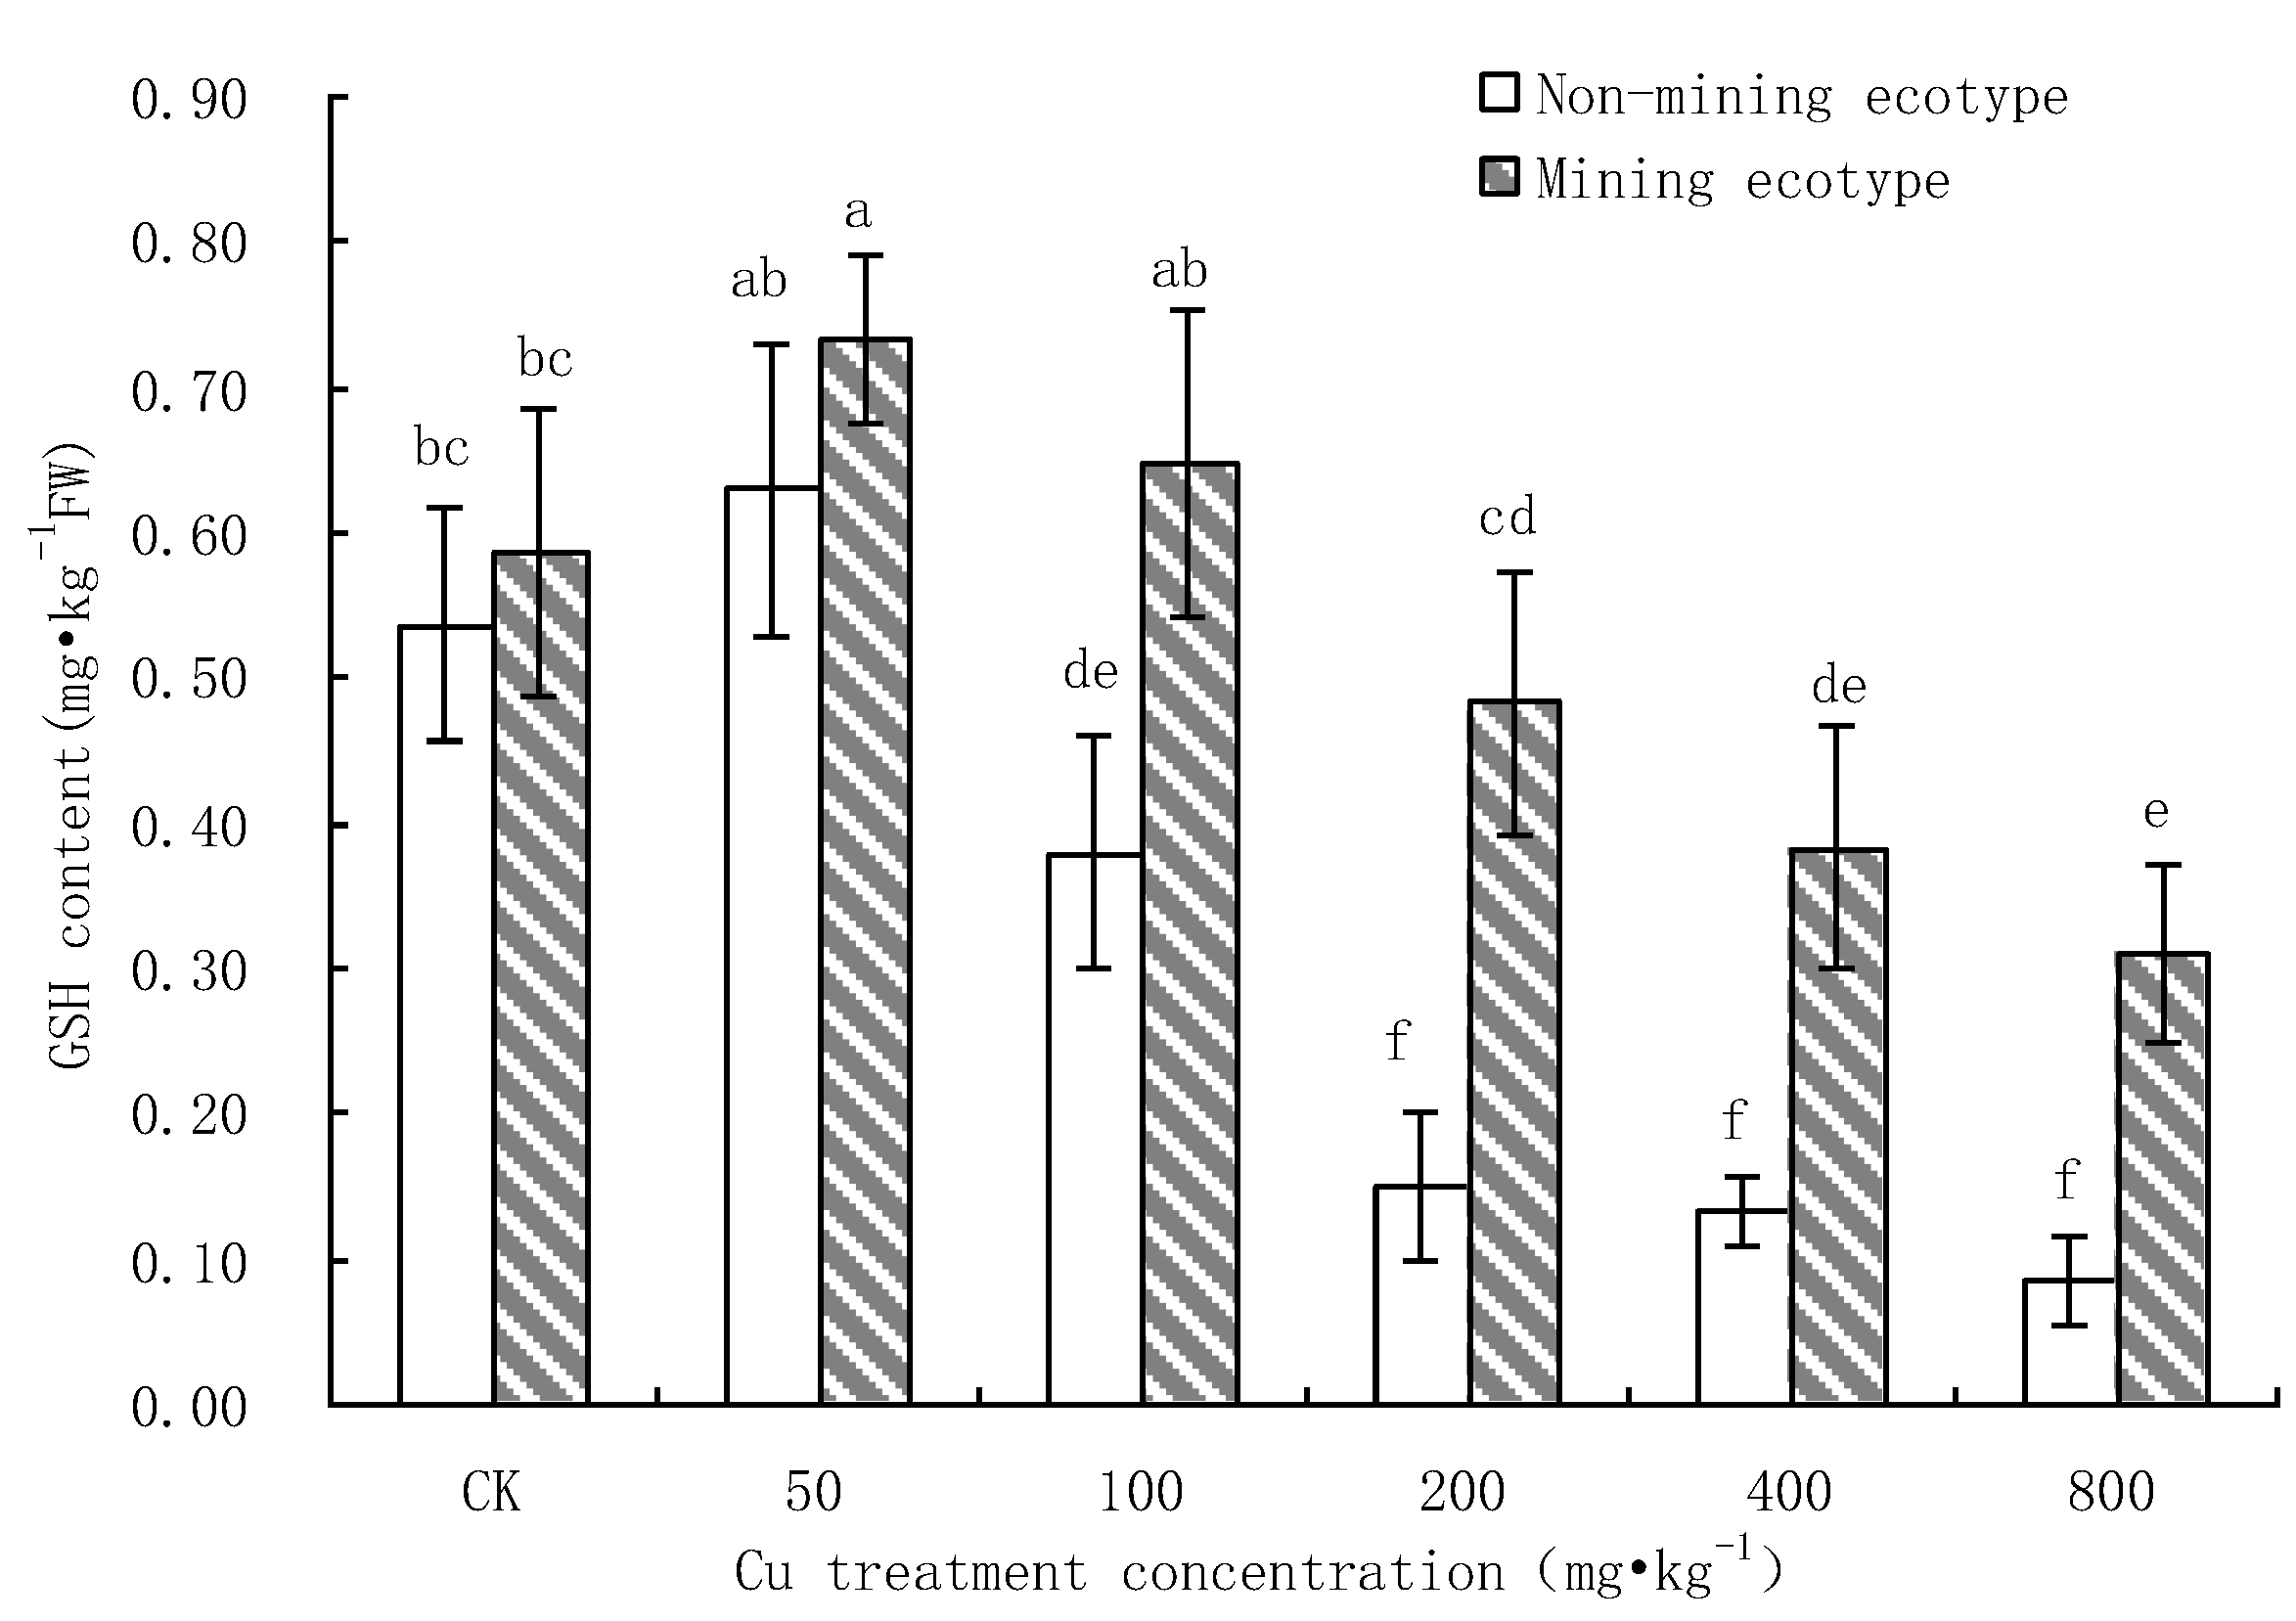
3.4. Effect of Cu Stress on the Content of GSH in M. floridulus

As can be seen from Figure 5, when the Cu concentration was 50 mg·kg−1, the GSH content of the two ecotypes of M. floridulus increased compared with that of the control group. However, with continuous increase in Cu concentration, the content changes were different: the GSH content of the non-mining ecotype M. floridulus decreased rapidly, and the GSH content of the non-mining ecotype M. floridulus was significantly different from that of the control group when the Cu concentration was 400 mg·kg−1 and 800 mg·kg−1 (p < 0.01). The GSH content of the ecotype M. floridulus also decreased but did not reach a highly significant level compared with the control group (p > 0.01). In general, under the higher Cu treatment concentration, the GSH content of ecotype M. floridulus in the mining area was significantly higher than that in the non-mining area: The GSH content of the mining ecotype M. floridulus was 2.54 times (400 mg·kg−1 Cu treatment) and 3.81 times (800 mg·kg−1 Cu treatment) that of the non-mining ecotype M. floridulus.

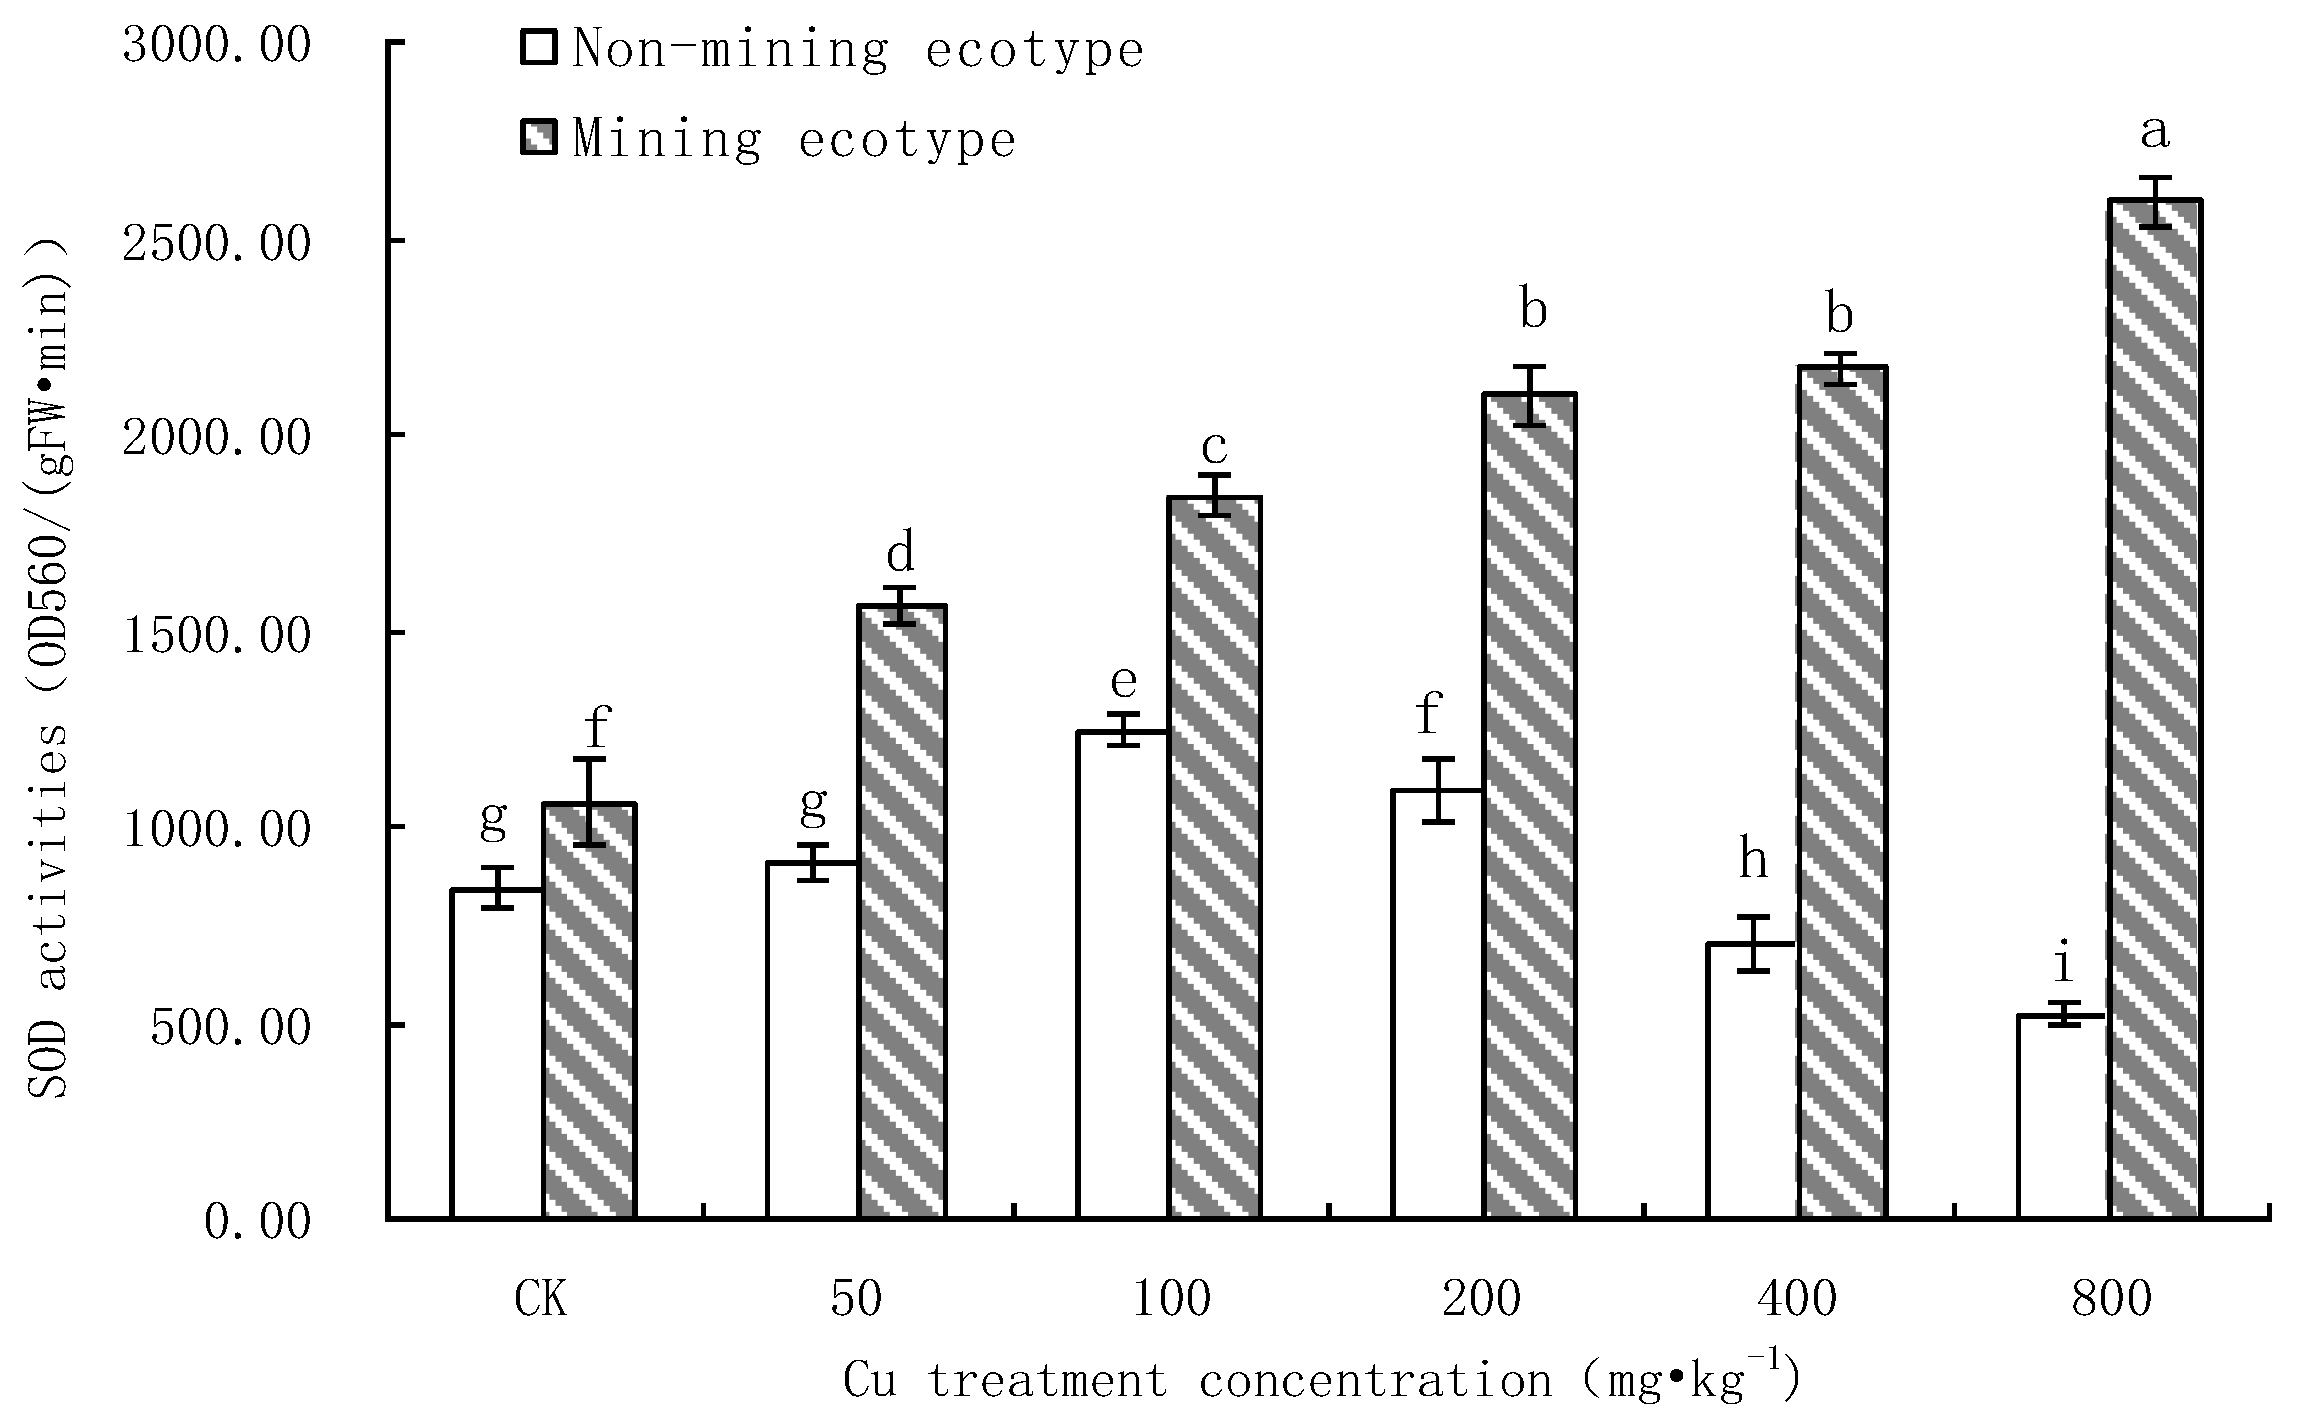
3.5. Effect of Cu Stress on SOD Activity of M. floridulus

Many studies have shown that the SOD activity of plant leaves is enhanced under heavy metal stress [37]. Figure 6 shows that Cu had a different effect on the SOD activity in the leaves of the two ecotypes of M. floridulus. The SOD activity in the leaves of the non-mining ecotype plants exposed to Cu stress first increased and then decreased and reached the highest level at 100 mg·kg−1, which was 143.5% that of the control. The levels for concentrations of 400 mg·kg−1 and 800 mg·kg−1 were significantly lower than those of the control group (p < 0.05), being 85.2% and 61.5% of the control group, respectively.
The SOD activity in the plant leaves of the mining ecotype was much higher than that of the non-mining ecotype. The SOD activity increased significantly after Cu stress (p < 0.05). The SOD activity in the treatment groups was 141.1%, 171.5%, 195.6%, 205.1% and 245.5% that of the control group, respectively.

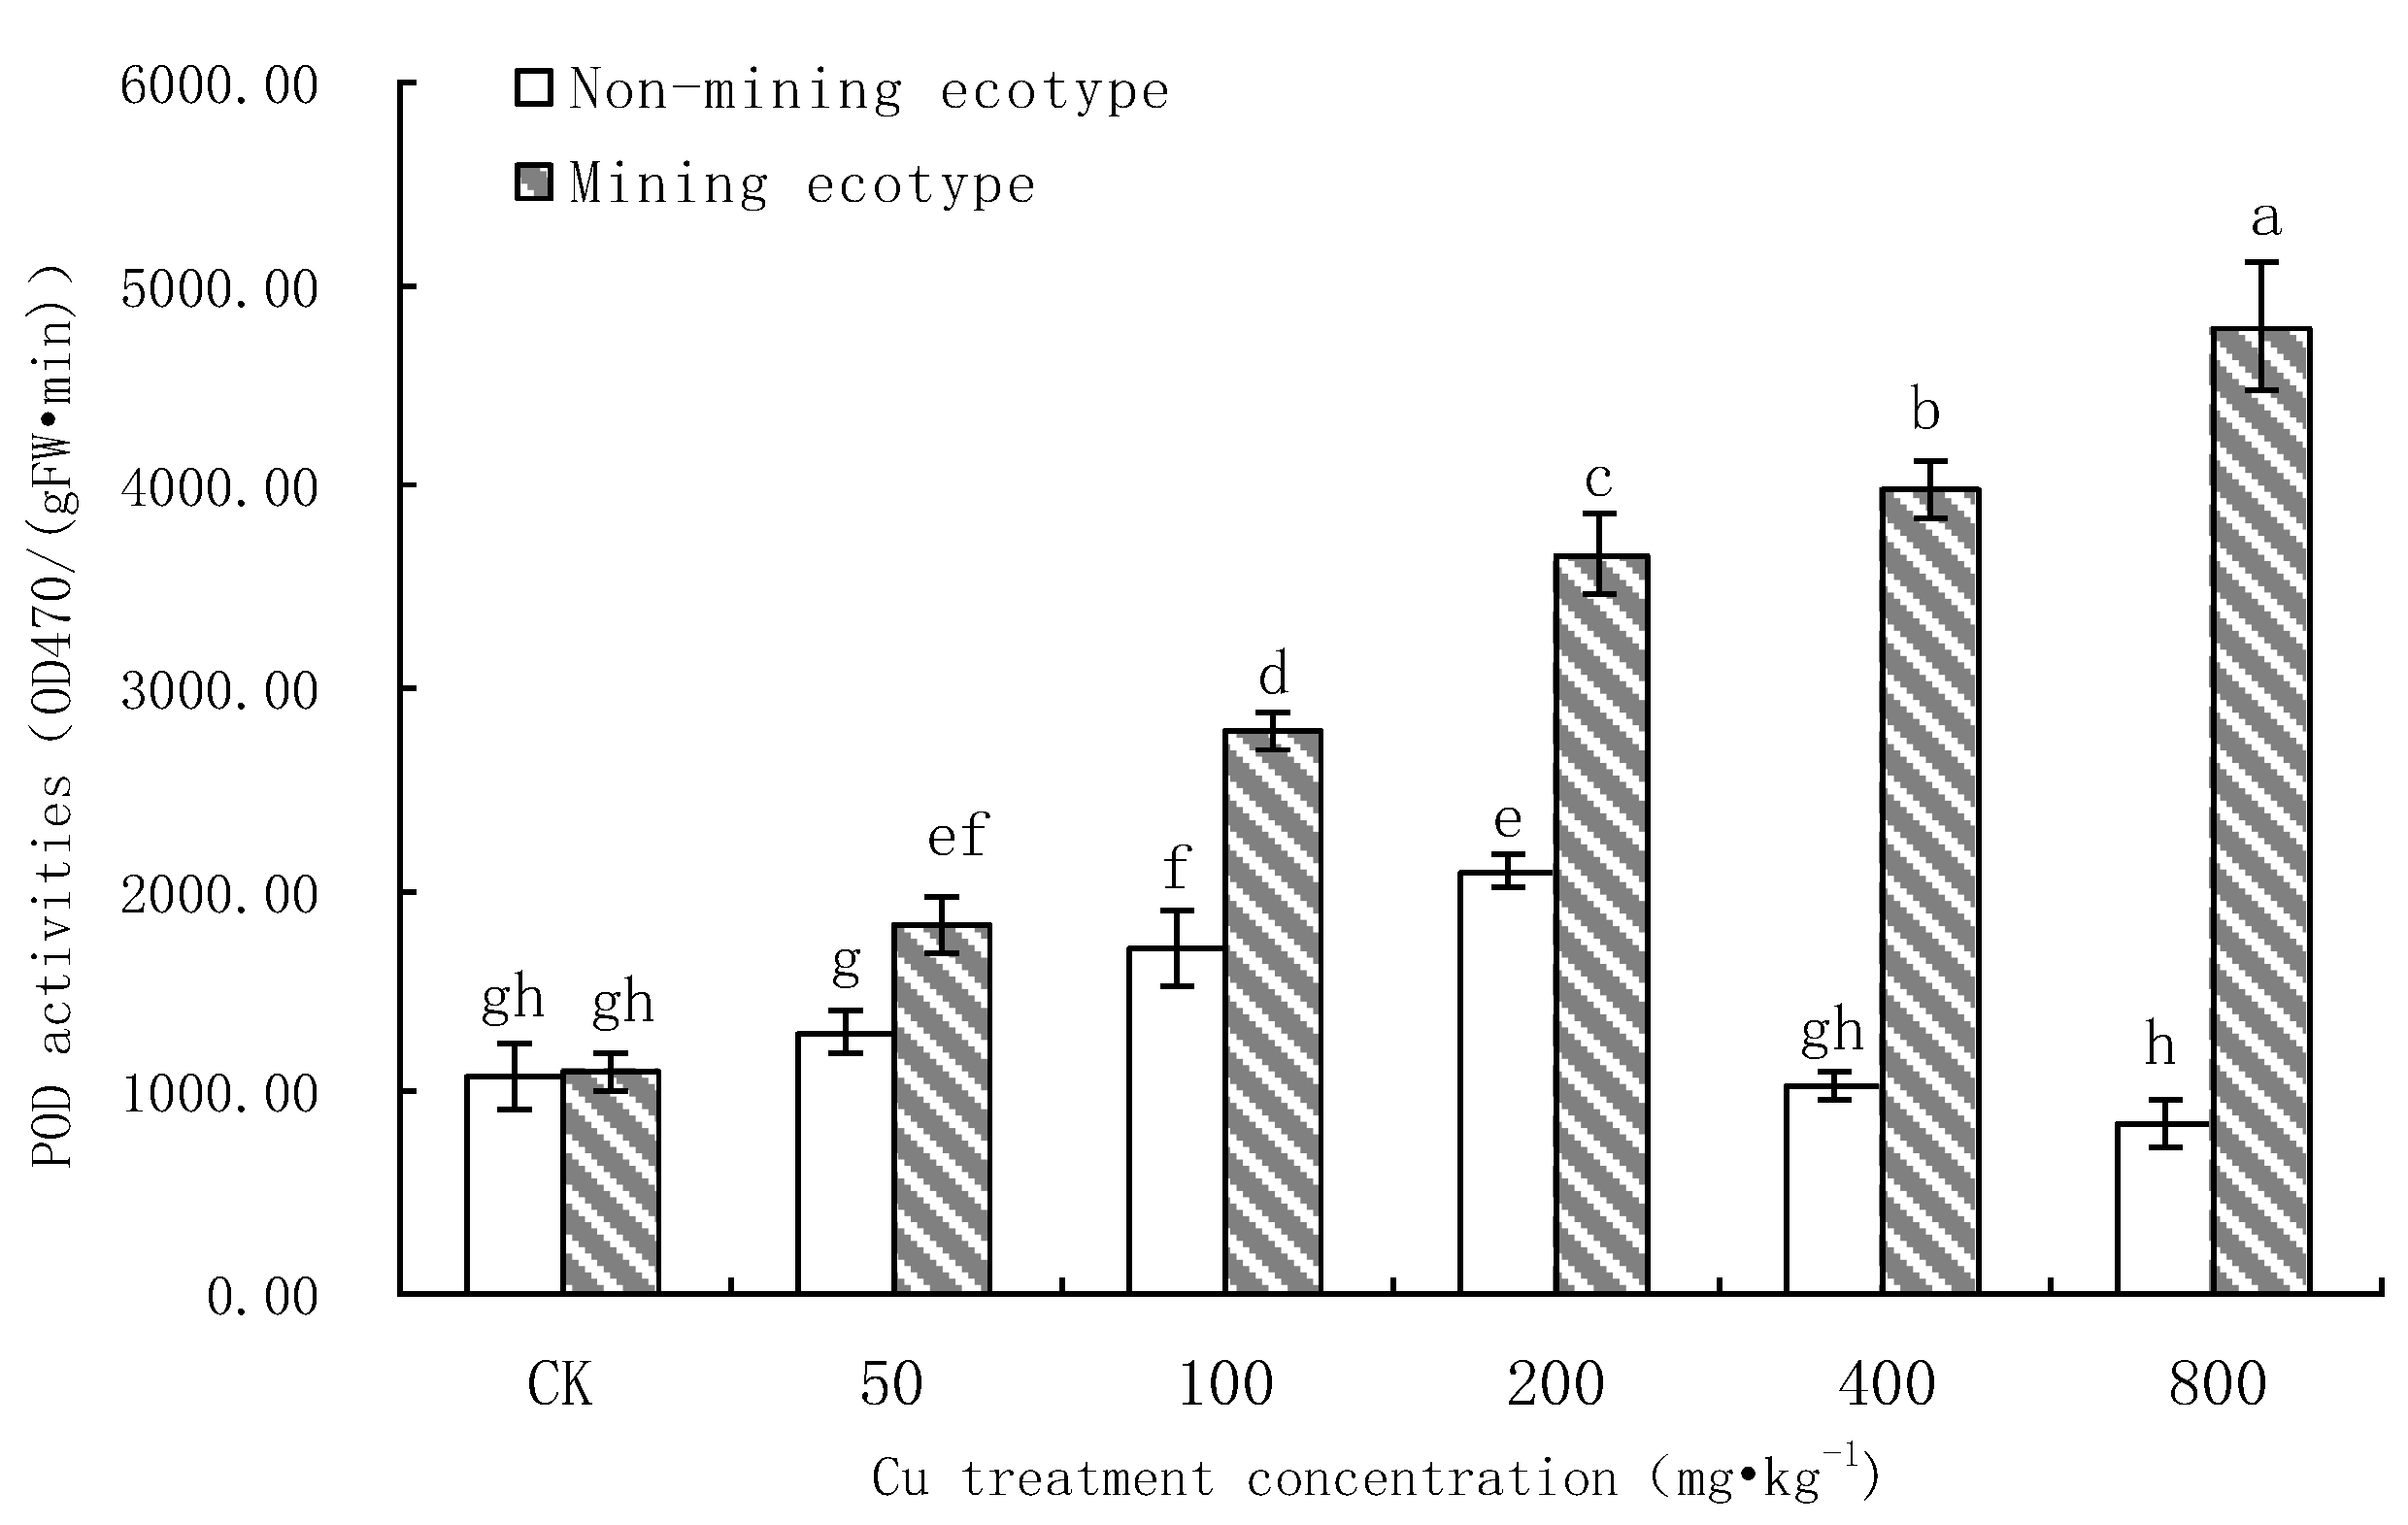
3.6. Effect of Cu Stress on POD Activity of M. floridulus

Figure 7 shows that Cu has a different effect on the POD activity in the leaves of the two types of M. floridulus. The POD activity of non-mining ecotype plants exposed to Cu stress first increased and then decreased and reached its highest level at 200 mg·kg−1, which was 185.2% of that of control. Following this, it decreased significantly, and for the 400 mg·kg−1 and 800 mg·kg−1 treatment groups was lower than that of the control group (93.5% and 75.5%, respectively). The POD activity in plant leaves of the mining ecotype was much higher than in those of the non-mining ecotype. The POD activity increased significantly after Cu stress (p < 0.05). The POD activity in the treatment groups was 155.9%, 245.1%, 315.6%, 351.8% and 430.5% that of the control group, respectively.

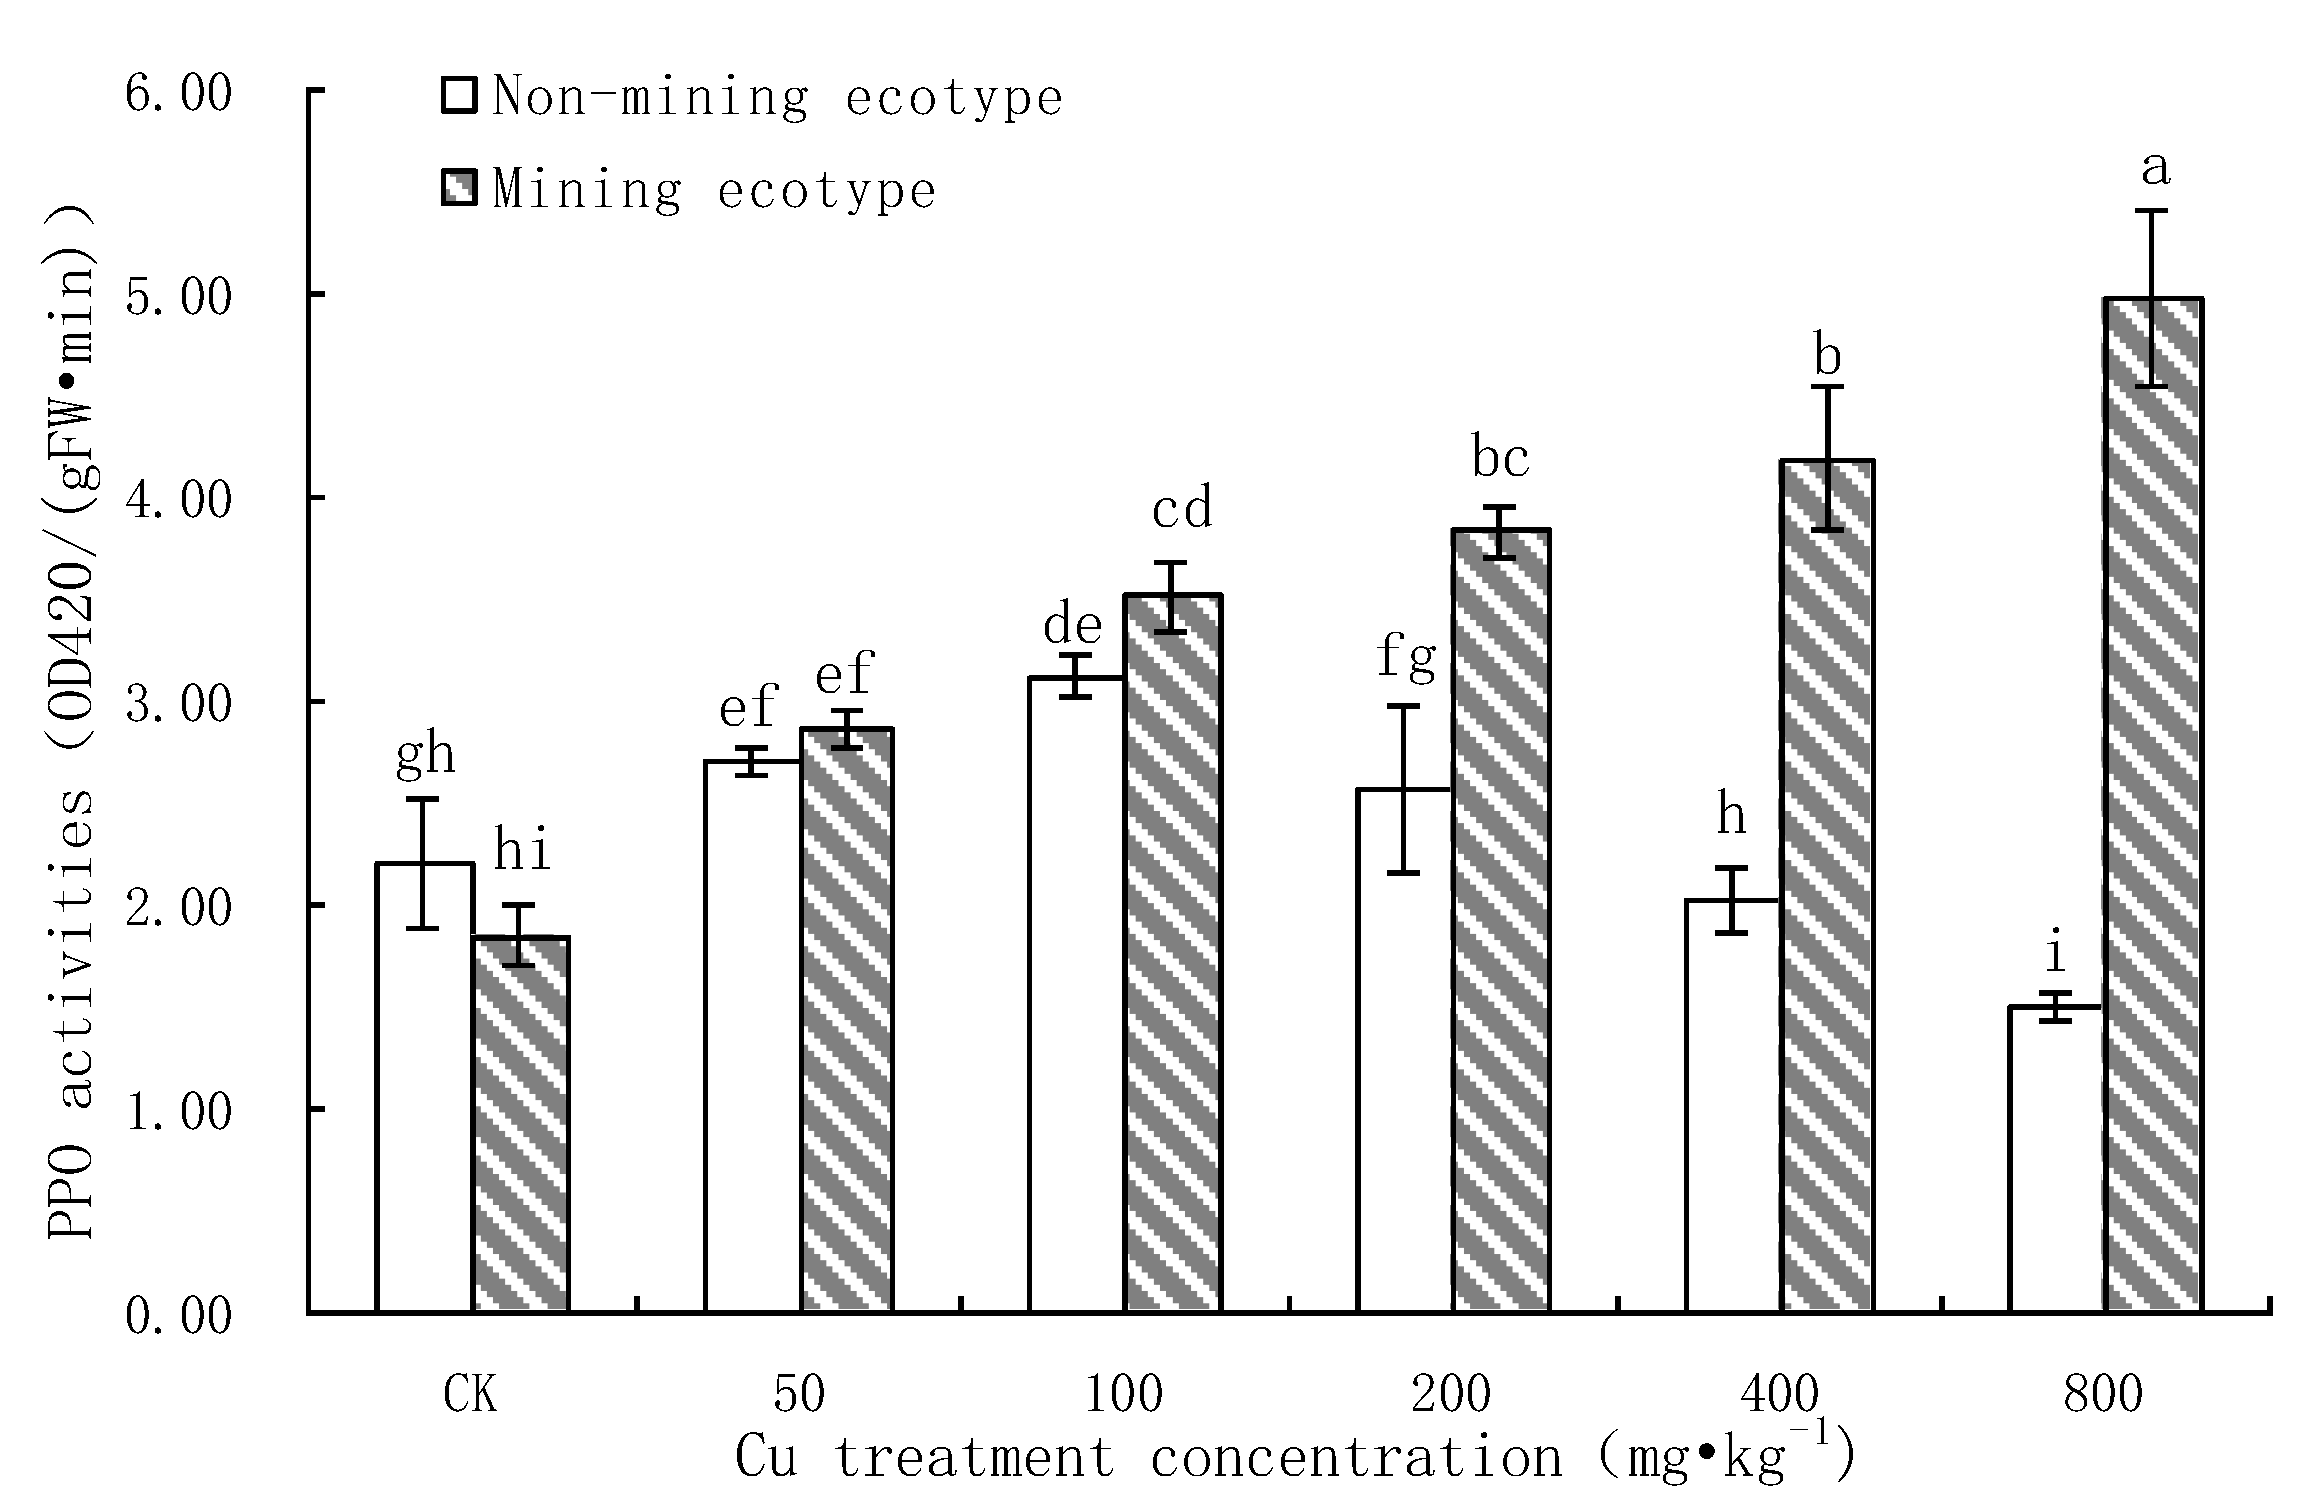
3.7. Effect of Pb Stress on PPO Activity of M. floridulus

Figure 8 shows that Cu had a different effect on the PPO activity in the leaves of the two ecotypes of M. floridulus. The PPO activity in the leaves of the non-mining ecotype plants exposed to Cu stress first increased and then decreased, reaching its highest level at 100 mg·kg−1, which was 138.7% of that of the control. Following this, the PPO activity of the 400 and 800 mg·kg−1 treatment groups was significantly lower than that of the control group (p < 0.05) at 87.1% and 65.2% of the control, respectively. The PPO activity in the plant leaves of the mining ecotype was higher than that in the leaves of the non-mining ecotype. The PPO activity significantly increased after Cu stress (p < 0.05). The PPO activity of each treatment concentration group was 151.1%, 190.8%, 207.5%, 226.5% and 268.1% of the control group, respectively.

3.8. The Correlation between the Physiological Indexes and the Mass Fraction of Cu

As can be seen from Table 3, among the physiological indexes of the non-mining ecotype M. floridulus: MDA, RPP and AsA were significantly positively correlated with Cu treatment concentration (p < 0.05); GSH, SOD and PPO were negatively correlated with Cu concentration (p < 0.05); and there was no significant correlation between POD and Cu concentration. Among the other indexes, SOD, POD and PPO were significantly positively correlated (p < 0.01); MDA was negatively correlated with GSH, SOD and PPO (p < 0.05); and RPP was negatively correlated with GSH and PPO (p < 0.05).
As can be seen from Table 3, among the physiological indexes of the mining ecotype M. floridulus: MDA, RPP, AsA, SOD, POD and PPO were significantly positively correlated with Cu treatment concentration (p < 0.05). Among the other indexes, SOD, POD and PPO were significantly positively correlated (p < 0.01); MDA was positively correlated with SOD, POD and PPO (p < 0.05); and RPP was significantly positively correlated with SOD, POD and PPO (p < 0.05).

4. Discussion

4.1. Analysis of the Effect of Cu Stress on Chlorophyll Content of M. floridulus

Cu is a trace mineral element necessary for the normal life activities of plants, and chlorophyll a and chlorophyll b are composed of a metal pigment protein [38]. Therefore, when the concentration of Cu is low, it may participate in and promote the synthesis of plant pigment protein, which is conducive to the various life activities of plants and will not cause obvious damage to them. When the content of Cu is higher than that required by plant life, a significant quantity of oxygen free radicals cannot be quickly removed, which destroys the structure and functioning of mitochondria and chloroplasts [39]. It also causes the oxidation of pigment proteins, inhibits the synthesis of chlorophyll, especially causing obvious damage to chlorophyll b, hindering the photosynthesis of plants and affecting their normal growth and development [40]. Many studies have confirmed that excessive copper can cause a decrease in chlorophyll content in plants [41,42]. Prasad et al. [41] suggested that a reduction in chlorophyll content caused by copper was mainly a result of the decomposition of chlorophyll caused by copper. Some studies have also indicated that copper can replace magnesium in the reaction center of chlorophyll, thus destroying the functioning and structure of chlorophyll [42].
The present study showed that the total amount of chlorophyll a, chlorophyll b, carotenoid, and chlorophyll in the leaves of the two types of M. floridulus first increased and then decreased as the Cu stress concentration increased. This may be because low Cu concentration affected the stimulation of chlorophyll synthesis, which would have a greater toxic effect as the Cu concentration increased. The total chlorophyll, chlorophyll a and chlorophyll b of the two ecotypes were negatively correlated with the Cu stress concentration (p < 0.05), suggesting that chlorophyll can be used as an indicator to show the degree of Cu stress.
Based on comparison between the two ecotypes, the chlorophyll content in the leaves of the non-mining ecotype decreased more rapidly; Cu stress caused more significant damage to chlorophyll b in the non-mining ecotype. In addition, in terms of appearance, the leaves of the non-mining species became more greenish-yellow than those of the mining species as the Cu concentration increased, presumably because the M. floridulus of the mining species has a resistance mechanism that reduces the damage caused by Cu to chlorophyll. This chlorophyll protection mechanism may enable the normal photosynthesis and substance synthesis of plants in polluted conditions.

4.2. Effects of Cd Stress on Physiological Metabolism of M. floridulus

Cell membranes are selective permeable membranes that control and regulate the transport and exchange of substances inside and outside the cell. Their permeability is one of the indicators used to assess the response of plants to pollution. Under adverse conditions, an increase in the permeability of the plant cell plasma membrane is mainly manifested as an obvious increase in relative conductivity [43]. Malondialdehyde (MDA) is a product of membrane lipid peroxidation. The intracellular MDA level indirectly indicates the level of reactive oxygen species and the degree of cellular damage in the plant. When plants are subjected to heavy metal stress, the balance between the production and removal of free radicals in the cell is impaired, leading to an increase in MDA content and the production of a large number of reactive oxygen species [44,45].
The results of this study showed that the membrane permeability of the leaves of the two ecotypes increased with Cu concentration and that the membrane permeability of the two ecotypes had a significant positive correlation with Cu stress concentration. With treatment at 800 mg·kg−1, the number of non-mining ecotype plants was 1.6 times that of the control, while the number of mining ecotype plants was 1.3 times that of the control. This may have been due to the protective mechanism of the mining ecotype M. floridulus, which reduced damage to the cell membrane of the plant under Cu stress. The MDA content of the leaves of both ecotypes of M. floridulus increased after Cu treatment compared to the control. Under 800 mg·kg−1 treatment, the non-mining ecotype plants were 2.2 times as many as the control, while the mining ecotype plants were 1.8 times as many as the control, indicating that the two ecotypes of M. floridulus had different responses to Cu stress. The mining ecotype plants showed significantly stronger resistance and less damage under Cu stress, which was similar to the experimental results of a study by Xie Mingji et al. [46] involving comparison of the MDA content of mining type and non-mining type Elsholtzia chinensis under copper stress.
AsA is a very important antioxidant in plants. Mediated by AsA, H2O2 accepts NADPH electrons and is reduced to H2O, thus eliminating H2O2 toxicity. AsA can also react directly with superoxide free radicals and hydroxyl free radicals to remove these toxic molecules [47,48]. Studies have shown that AsA can inhibit membrane lipid peroxidation [49]. In this experiment, the content of AsA in the mining area was significantly higher than that in the non-mining area and the content of AsA increased significantly with increase in the treatment concentration; there was an obvious positive correlation between the content of AsA and treatment concentration. This result suggests that AsA can reduce the peroxidation damage caused by copper, which is consistent with the results of other studies [47]. GSH is a specific peptide ubiquitous in plants and is an important free radical scavenger that stabilizes the SH group in proteins and plays an important role in maintaining the structural integrity of membranes and preventing membrane lipid peroxidation. Under higher concentration copper treatment, the GSH content of the mining ecotype M. floridulus was significantly higher than that of the non-mining ecotype, indicating that GSH plays a positive role in alleviating the peroxidation damage caused by copper [47,50].

4.3. Effects of Cu Stress on the Antioxidant Enzyme System of M. floridulus

Studies have shown that excessive heavy metals produce reactive oxygen species in plants and break the dynamic balance of their scavenging mechanism, resulting in peroxide damage [51]. There are two types of protection mechanisms in plants against reactive oxygen species, namely, enzyme-induced and non-enzyme-induced mechanisms. The enzyme system includes SOD, POD, etc. Non-enzymatic systems mainly consist of minor molecules, such as AsA and reduced GSH [52,53].
Normally, the metabolism of ROS in plants is kept in equilibrium and cells are protected from damage. However, under stress, the production rate of ROS in the plant exceeds the plant’s ability to remove ROS and excessive accumulation of ROS leads to peroxidation damage. In order to keep the ROS in plants at a certain equilibrium level, the antioxidant protection enzyme system can be quickly activated in plants under various stresses to reduce the damage of ROS [54]. The SOD can break down O2 into H2O2 and O2, reducing the accumulation of O2 in the body. POD is an enzyme containing Fe, which can decompose H2O2, the product of SOD, into H2O [55,56]. PPO is a stress-response enzyme system widely present in plants and its activity is closely related to the plant’s metabolic strength and environmental stress response [56]. In plant respiration, the end of the respiratory chain oxidase, of which PPO is one, directly transfers electrons released during the oxidation of respiratory substrate intermediate products to O2. PPO can catalyze the oxidation of phenolic compounds to quinones and decrease in activity of this enzyme affects the respiration of plants [56,57].
As can be seen from the results of this study, the response of antioxidant enzymes to Cu stress is very different for the two ecotypes. The SOD and POD activities of the non-mining ecotypes exposed to Cu first increased and then decreased in each treatment group, while the SOD and POD activities of the mining ecotypes exposed to Cu were significantly increased (p < 0.05). In addition, the SOD and POD activities in the leaves of the mining ecotype plants were much higher than those of non-mining ecotype plants and remained at a high level under high concentration Cu (800 mg·kg−1) stress. This indicates that the mining ecotype M. floridulus is more resistant to Cu stress than the non-mining ecotype.
PPO is barely mentioned in studies of heavy metal stress on plants. In this study, it was found that the response of PPO activity to Cu stress in the leaves of the two ecotypes was very different. The PPO activity in the non-mining ecotype plants first increased and then decreased with increase in Cu treatment concentration, while that in the mining ecotype plants increased significantly (p < 0.05). Correlation analysis showed that the activity of PPO in the leaves of non-mining ecotype M. floridulus was negatively correlated with the concentration of Cu (p < 0.05) and the activity of PPO in the leaves of mining ecotype M. floridulus was significantly positively correlated with Cu concentration (p < 0.05). The relationship between PPO activity and Cu concentration in the leaves of the two ecotypes of M. floridulus was very different and the internal relationships and specific mechanisms underpinning this need further study.
Stress also promotes the production of ROS in plants. Under normal circumstances, the production and removal of ROS in plant cells are in a balanced state, while increase in ROS in plants under stress can, on the one hand, induce an increase in the activities of related protective enzymes, such as SOD, POD and CAT, and, on the other hand, directly destroy biological macromolecules, resulting in the loss of enzyme activity [58]. In general, the antioxidant enzyme activity of mining ecotype plants was higher than that of non-mining ecotype plants. The most significant difference was that the antioxidant enzyme activity of the non-mining ecotype plants was not high under the stress of a high concentration of Cu at 800 mg·kg−1, while the enzyme activity of the mining ecotype plants was maintained at a high level under the stress of this concentration of Cu. This behavior of mining ecotype M. floridulus implies that the plants possess a tolerance mechanism enabling adaptation to heavy metals [59,60]. This may be because mining ecotype plants have previously been damaged to a certain extent by long-term adverse conditions and that the two ecotypes have become physiologically and ecologically different in different habitats. The results show that the mining ecotype M. floridulus is better able to protect itself under the stress of Cu.

5. Conclusions

(1)
Chlorophyll a, chlorophyll b and total chlorophyll in the leaves of two ecotypes of M. floridulus were negatively correlated with Cu stress concentration (p < 0.01), but the extent of decrease for the ecotypes in the mining area was lower than that for ecotypes in the non-mining area. The values of chlorophyll a/b for both ecotypes increased with increasing Cu treatment concentration, indicating that Cu is more harmful to chlorophyll b than to chlorophyll a for M. floridulus.
(2)
Under Cu stress, the content of antioxidant substances (GSH, AsA) in the mining ecotype was significantly higher than that in the non-mining ecotype. The membrane permeability increased for both ecotypes at high concentrations of copper treatment, and the MDA content of the non-mining ecotype was significantly higher than that of the mining ecotype. The experimental data obtained showed that, under copper stress, the non-mining ecotype M. floridulus suffered more severe peroxidation damage than the mining ecotype. The endogenous GSH and AsA of M. floridulus play an important role in scavenging free radical accumulation caused by excess copper.
(3)
The SOD activity in the leaves of the non-mining ecotype was inhibited by Cu stress, and the POD activity was increased by Cu stress, but the increase for the mining ecotype was larger than that for the non-mining ecotype. At the highest Cu concentrations, both enzyme activities were significantly higher in the mining ecotype plants than in the non-mining ecotype plants. The results suggest that, in the long-term adaptation process, the mining ecotype M. floridulus becomes a resistant ecotype, and that the non-enzymatic system plays an important role in raising the level of resistance.

Author Contributions

Project administration and writing—review and editing, J.Q.; conceptualization, X.J. and H.Z.; formal analysis, Z.Y. and M.D.; methodology, S.L. and X.C.; investigation, D.X. All authors have read and agreed to the published version of the manuscript.

Funding

This work was supported by the Guangdong Provincial Key Laboratory of Environmental Health and Land Resource (project number: 2020B121201014); Special Project of Key Areas of Colleges and Universities in Guangdong Province (Science and Technology Promoting Rural Revitalization) “Research and Development of Key Technologies for Resource Utilization of Manure from Large-Scale Livestock and Poultry Breeding in Rural Areas of Western Guangdong” (No.: 2021ZDZX4023), and the Innovation Team Project of Colleges and Universities in Guangdong Province (2021KCXTD055).

Data Availability Statement

The data presented in this study are available on request from the corresponding author.

Acknowledgments

The authors acknowledge the Guangdong Provincial Key Laboratory of Environmental Health and Land Resource; Special Project of Key Areas of Colleges and Universities in Guangdong Province (Science and Technology Promoting Rural Revitalization) “Research and Development of Key Technologies for Resource Utilization of Manure from Large-Scale Livestock and Poultry Breeding in Rural Areas of Western Guangdong” and the Innovation Team Project of Colleges and Universities in Guangdong Province.

Conflicts of Interest

The authors declare no conflict of interest.

References

  1. Li, J.; He, J.Z.; Ma, Y.H.; Zhu, Y.G.; Zhang, L. Molecular mechanism of biological copper tolerance and biological joint remediation of copper polluted environment. Acta Ecol. Sin. 2007, 6, 2615–2626. [Google Scholar]
  2. Li, D.L.; Chen, J.W.; Zhang, H.; Li, J.J. Effects of copper pollution on soil bacterial community structure and heavy metal resistance genes. J. Environ. Sci. 2021, 41, 1082–1090. [Google Scholar]
  3. Hector, A.; Bagchi, R. Biodiversity and ecosystem multifunctionality. Nature 2007, 448, 188–190. [Google Scholar] [CrossRef]
  4. Song, J.; Shen, Q.; Wang, L.; Qiu, G.; Shi, J.; Xu, J.; Philip, C.B.; Liu, X. Effects of Cd, Cu, Zn and their combined action on microbial biomass and bacterial community structure. Environ. Pollut. 2018, 243, 510–518. [Google Scholar] [CrossRef]
  5. Chen, J.; Zhang, H.; Li, J.; Liu, Y.; Shi, W.; Hu, H. The toxic factor of copper should be adjusted during the ecological risk assessment for soil bacterial community. Ecol. Indic. 2020, 111, 106072. [Google Scholar] [CrossRef]
  6. Zheng, B.J.; Xu, S.C.; Tu, Y.H.; Zou, F.; Liang, D.D.; Wang, H.; Mo, Y.W. Research progress on copper toxicity to crops. J. Shaoxing Univ. Arts Sci. 2022, 42, 58–64. [Google Scholar]
  7. Lin, M.Z.; Jin, M.F.; Chen, Y.; Zeng, Q.L. Photosynthetic characteristics and mechanism of wedelia chinensis under soil Cu pollution stress. J. Anhui Agric. Univ. 2018, 45, 657–663. [Google Scholar]
  8. Yang, K.; Huang, C.; Lu, S.; Peng, G.Y.; Huang, C.G. Selection of reference genes in real-time quantitative PCR of root tissue of Commelina purpurea under copper stress. Acta Phytophysiol. Sin. 2021, 57, 195–204. [Google Scholar]
  9. Qin, J.Q.; Zhao, H.R.; Dai, M.; Zhao, P.; Chen, X.; Liu, H.; Lu, B.Z. Speciation Distribution and Influencing Factors of Heavy Metals in Rhizosphere Soil of Miscanthus Floridulus in the Tailing Reservoir Area of Dabaoshan Iron Polymetallic Mine in Northern Guangdong. Processes 2022, 10, 1217. [Google Scholar] [CrossRef]
  10. Wu, B.H.; Luo, S.H.; Luo, H.Y.; Huang, H.Y.; Xu, F.; Feng, S.; Xu, H. Improved phytoremediation of heavy metal contaminated soils by Miscanthus floridulus under a varied rhizosphere ecological characteristic. Sci. Total Environ. 2021, 808, 151995. [Google Scholar] [CrossRef]
  11. Nie, G.; Zhong, M.Y.; Cai, J.B.; Yang, X.Y.; Zhou, J.; Appiah, C.; Tang, M.Y.; Wang, X.; Feng, G.Y.; Huang, L.K.; et al. Transcriptome characterization of candidate genes related to chromium uptake, transport and accumulation in Miscanthus sinensis. Ecotoxicol. Environ. Saf. 2021, 221, 112445. [Google Scholar] [CrossRef] [PubMed]
  12. Li, Q.F.; Du, W.B.; Li, Z.A.; Wang, Z.F.; Peng, S.L. Heavy metals accumulation in mining area’s Miscanthus sinensis populations and its relationship with soil characters. Chin. J. Ecol. 2006, 25, 255–258. [Google Scholar]
  13. Liao, B.; Deng, D.M.; Yang, B.; Shu, W.S.; Lin, L.; Lan, C.Y. Study on copper tolerance and accumulation of Commelina communis. J. Environ. Sci. 2003, 6, 797–801. [Google Scholar]
  14. Wen, C.H.; Duan, C.Q.; Chang, X.X. Differentiation in Datura stramonium L. populations exposed to heavy-metal pollution at different durations: RAPD analysis. Acta Ecol. Sin. 2001, 21, 1239–1245. [Google Scholar]
  15. Peng, S.L.; Du, W.B.; Li, Z.A. A review of heavy metal accumulation and tolerance by plants of different ecotype. J. Jishou Univ. 2004, 25, 19–26. [Google Scholar]
  16. Yu, H.; Zheng, X.; Weng, W.; Yan, X.; Chen, P.; Liu, X.; Peng, T.; Zhong, Q.; Xu, K.; Wang, C.; et al. Synergistic effects of antimony and arsenic contaminations on bacterial, archaeal and fungal communities in the rhizosphere of Miscanthus sinensis: Insights for nitrification and carbon mineralization. J. Hazard. Mater. 2021, 411, 125094. [Google Scholar] [CrossRef]
  17. Barbosa, B.; Boléo, S.; Sidella, S.; Costa, J.; Duarte, M.P.; Mendes, B.; Cosentino, S.L.; Fernando, A.L. Phytoremediation of heavy metal-contaminated soils using the perennial energy crops Miscanthus spp. and Arundo donax L. Bioenerg. Res. 2015, 8, 1500–1511. [Google Scholar] [CrossRef]
  18. Zadel, U.; Nesme, J.; Michalke, B.; Vestergaard, G.; Plaza, G.A.; Schroder, P.; Radl, V.; Schloter, M. Changes induced by heavy metals in the plant-associated microbiome of Miscanthus × Giganteus. Sci. Total Environ. 2020, 711, 134433. [Google Scholar] [CrossRef]
  19. Sun, J.; Tie, B.Q.; Qin, P.F. Investigation of contaminated soil and plants by heavy metals in Pb-Zn mining area. J. Plant Resour. Environ. 2006, 15, 63–67. [Google Scholar]
  20. Zhu, Y.G. Microinterface processes in soil-plant systems and their eco-environmental effects. J. Environ. Sci. 2003, 23, 205–210. [Google Scholar]
  21. Wang, H.B.; Shu, W.S.; Lan, C. Ecology for heavy metal pollution: Recent advances and future prospects. Acta Ecol. Sin. 2005, 25, 596–605. [Google Scholar]
  22. Zhou, S.; Deng, R.; Hursthouse, A. Risk Assessment of Potentially Toxic Elements Pollution from Mineral Processing Steps at Xikuangshan Antimony Plant, Hunan, China. Processes 2020, 8, 29. [Google Scholar] [CrossRef]
  23. Fu, S.; Zhou, Y.; Zhao, Y.; Gao, Q.Z.; Peng, X.Z.; Dang, Z.; Zhang, C.B.; Yang, X.Q.; Yang, Z.J.; Dou, L.; et al. Study on heavy metals in soils contaminated by acid mine drainage from Dabaoshan Mine, Guangdong. Environ. Sci. 2007, 28, 805–812. [Google Scholar]
  24. Zhao, H.R.; Wang, D.; Zhu, B.T.; Jin, X. Evaluation of heavy metal pollution of soil in the Dabaoshan mining area based on the information diffusion theory. J. Agro-Environ.Sci. 2019, 38, 79–86. [Google Scholar]
  25. Chen, J.Y.; Liu, G.B.; Cui, J.L.; Xiao, T.F. Migration process and risk assessment of heavy metals in soil plant system of Dabaoshan mining area in Guangdong Province. Environ. Sci. 2019, 40, 5629–5639. [Google Scholar]
  26. Qin, J.Q.; Xia, B.C.; Hu, M.; Zhao, P.; Zhao, H.R.; Lin, X.F. Analysis of the vegetation succession of tailing wasteland of Dabaoshan Mine, Guangdong Province. J. Agro-Environ. Sci. 2009, 28, 2085–2091. [Google Scholar]
  27. Qin, J.Q.; Zhao, H.R.; Liu, H.; Dai, M.; Zhao, P.; Chen, X.; Wu, X.G. The Difference of Lead Accumulation and Transport in Different Ecotypes of Miscanthus floridulus. Processes 2022, 10, 2219. [Google Scholar] [CrossRef]
  28. Zhao, H.R.; Xia, B.C.; Qin, J.Q.; Zhang, J. Hydrogeochemical and mineralogical characteristics related to heavy metal attenuation in a stream polluted by acid mine drainage: A case study in Dabaoshan mine, China. J. Environ. Sci. 2012, 24, 979–989. [Google Scholar] [CrossRef]
  29. Zhao, H.R.; Xia, B.C.; Fan, C.; Zhao, P.; Shen, S. Human health risk from soil heavy metal contamination under different land uses near Dabaoshan mine, southern China. Sci. Total Environ. 2012, 417, 45–54. [Google Scholar] [CrossRef]
  30. Cui, J.L.; Luo, C.L.; Tang, C.W.; Chang, T.; Li, X. Speciation and leaching of trace metal contaminants from e-waste contaminated soils. J. Hazard. Mater. 2017, 329, 150–158. [Google Scholar] [CrossRef]
  31. Lu, R. Methods of Soil and Agricultural Chemistry; Beijing Science and Technology Press: Beijing, China, 1999; pp. 235–285. [Google Scholar]
  32. Li, H.S.; Sui, Q.; Zhao, S.J.; Zhang, W.H. Experimental Principle and Technology of Plant Physiology and Biochemistry; Higher Education Press: Beijing, China, 2000; pp. 134–138. [Google Scholar]
  33. Zhang, Z.L.; Qu, W.J. A Guide Book of Plant Physiology Experiment; Higher Education Press: Beijing, China, 2004. [Google Scholar]
  34. Chen, J.X.; Wang, X.F. Experimental Instruction in Plant Physiology; South China University of Technology Press: Guangzhou, China, 2002; pp. 124–125. [Google Scholar]
  35. Brun, L.A.; Maillet, J.; Hinsinge, P.; Pepin, M. Evalution of copper availability to plants in copper contaminated vineyard soils. Environ. Pollut. 2001, 111, 293–302. [Google Scholar] [CrossRef] [PubMed]
  36. Tang, C.F.; Liu, Y.G.; Zeng, G.M. Effects of cadrnium stress on active oxygen generation, lipid peroxidation and antioxidant enzyme actives in radish seedlings. J. Plant Physiol. Mol. Biol. 2004, 30, 469–474. [Google Scholar]
  37. Zou, C.F.; Wu, G.R.; Shi, G.X. The role of antioxidant systems in Cu2+ stress resistance in Alternanthera philoxeroides. Acta Bot. Sin. 2001, 43, 389–494. [Google Scholar]
  38. Nagalakshmi, N.; Prasad, M.N.V. Copper-induced oxidative stress in Scenedesmus bijugatus: Protective role of free radical scavengers. Bull. Environ. Contam. Toxicol. 1998, 61, 623–628. [Google Scholar] [CrossRef]
  39. Ouzounidou, G. Copper-induced changes on growth metal conent and phyotosynthetic function of Alyssummon tanum plants. Environ. Exp. Bot. 1994, 34, 165–172. [Google Scholar] [CrossRef]
  40. Huang, Y.S.; Qiu, G.H. Physiological differences of Festuca rubra copper tolerant merlin and sensitive S59 to copper treatment at their early developmental stages. Chin. J. Appl. Environ. Biol. 1998, 4, 126–131. (In Chinese) [Google Scholar]
  41. Prasad, M.N.V.; Malec, P. Physiological Responses of Lemna trisulca L. (duckweed) to Cadmium and Copper Bioaccumulation. Plant Sci. 2001, 161, 881–889. [Google Scholar] [CrossRef]
  42. Kupper, H.; Kupper, F.; Spiller, M. Environmental Relevance of Heavy Metal Substituted Chlorophylls Using the Example of Water Plants. J. Exp. Bot. 1996, 47, 259–266. [Google Scholar] [CrossRef] [Green Version]
  43. Ren, Q.Q.; Huang, Z.R.; Huang, W.L.; Huang, W.T.; Chen, H.H.; Yang, L.T.; Ye, X.; Chen, L.S. Physiological and molecular adaptations of Citrus grandis roots to long-term copper excess revealed by physiology, metabolome and transcriptome. Environ. Exp. Bot. 2022, 203, 105049. [Google Scholar] [CrossRef]
  44. Huang, H.; Li, S.; Guo, J.L. Effects of cadmium stress on antioxidant system and photosynthesis of maize seedlings. J. Agro-Environ. Sci. 2010, 29, 211–215. [Google Scholar]
  45. Sujkowska-Rybkowska, M.; Muszyñska, E.; Labudda, M. Structural Adaptation and Physiological Mechanisms in the Leaves of Anthyllis vulneraria L. from Metallicolous and Non-Metallicolous Populations. Plants 2020, 9, 662. [Google Scholar] [PubMed]
  46. Xie, M.J.; Ke, W.S.; Wang, W.X. MDA accumulation and antioxidation capacity of two Elsholtzia splendens populations under copper stress. Chin. J. Ecol. 2005, 24, 935–938. [Google Scholar]
  47. Li, X.Y.; Wang, X.; Lu, L.-f; Yin, B.; Zhang, M.; Cui, X.-m. Effects of exogenous NO on ascorbic acid glutathione cycle in tomato seedling roots under copper stress. Chin. J. Appl. Ecol. 2013, 24, 1023–1030. [Google Scholar]
  48. Du, Y.L.; Zhao, Q.; Chen, L.W.; Yao, X.D.; Zhang, W.; Zhang, B.; Xie, F.T. Effect of drought stress on sugar metabolism in leaves and roots of soybean seedlings. Plant Physiol. Biochem. 2020, 146, 1–12. [Google Scholar] [CrossRef]
  49. Han, Y.Y.; Zhou, S.; Chen, Y.H.; Kong, X.; Xu, Y.; Wang, W. The involvement of expansins in responses to phosphorus availability in wheat, and its potentials in improving phosphorus efficiency of plants. Plant Physiol. Biochem. 2014, 78, 53–62. [Google Scholar] [CrossRef]
  50. Li, J.Y.; Zheng, B.H.; He, Y.Z.; Zhou, Y.Y.; Chen, X.; Ruan, S.; Yang, Y.; Dai, C.H.; Tang, L. Antimony contamination, consequences and removal techniques: A review. Ecotoxicol. Environ. Saf. 2018, 156, 125–134. [Google Scholar] [CrossRef]
  51. Smirnoff, N. The role of active oxygen in the response of plants to water deficit and desiccation. New Phytol. 1993, 125, 27–58. [Google Scholar] [CrossRef]
  52. Ambrosini, V.G.; Rosa, D.J.; de Melo, G.W.B.; Zalamena, J.; Cella, C.; Simão, D.G.; da Silva, L.S.; dos Santos, H.P.; Toselli, M.; Tiecher, T.L.; et al. High copper content in vineyard soils promotes modifications in photosynthetic parameters and morphological changes in the root system of ‘Red Niagara’ plantlets. Plant Physiol. Biochem. 2018, 128, 89–98. [Google Scholar] [CrossRef] [Green Version]
  53. Pietrini, F.; Di Baccio, D.; Iori, V.; Veliksar, S.; Lemanova, N.; Juškaitė, L.; Maruška, A.; Zacchini, M. Investigation on metal tolerance and phytoremoval activity in the poplar hybrid clone “Monviso” under Cu-spiked water: Potential use for wastewater treatment. Sci. Total Environ. 2017, 592, 412–418. [Google Scholar] [CrossRef]
  54. Oustriere, N.; Marchand, L.; Lottier, N.; Motelica, M.; Mench, M. Long-term Cu stabilization and biomass yields of Giant reed and poplar after adding a biochar, alone or with iron grit, into a contaminated soil from a wood preservation site. Sci. Total Environ. 2017, 579, 620–627. [Google Scholar] [CrossRef]
  55. Li, C.; Xiao, B.; Wang, Q.H.; Yao, S.H.; Wu, J.Y. Phytoremediation of Zn- and Cr-contaminated soil using two promising energy grasses. Water Air Soil Pollut. 2014, 225, 2027. [Google Scholar] [CrossRef]
  56. Feigl, G.; Kumar, D.; Lehotai, N.; Tugyi, N.; Molnár, Á.; Ördög, A.; Szepesi, Á.; Gémes, K.; Laskay, G.; Erdei, L.; et al. Physiological and morphological responses of the root system of Indian mustard (Brassica juncea L. Czern.) and rapeseed (Brassica napus L.) to copper stress. Ecotoxicol. Environ. Saf. 2013, 94, 179–189. [Google Scholar] [CrossRef]
  57. Marzilli, M.; Di Santo, P.; Palumbo, G.; Maiuro, L.; Paura, B.; Tognetti, R.; Cocozza, C. Cd and Cu accumulation, translocation and tolerance in Populus alba clone (Villafranca) in autotrophic in vitro screening. Environ. Sci. Pollut. Res. 2018, 25, 10058–10068. [Google Scholar] [CrossRef]
  58. He, J.; Li, H.; Luo, J.; Ma, C.; Li, S.; Qu, L.; Gai, Y.; Jiang, X.; Janz, D.; Polle, A. A transcriptomic network underlies microstructural and physiological responses to cadmium in Populus canescens. Plant Physiol. 2013, 162, 424–439. [Google Scholar] [CrossRef] [Green Version]
  59. Zhu, H.; Teng, Y.; Wang, X.; Zhao, L.; Ren, W.; Luo, Y.; Christie, P. Changes in clover rhizosphere microbial community and diazotrophs in mercury-contaminated soils. Sci. Total Environ. 2021, 767, 145473. [Google Scholar] [CrossRef]
  60. Rehman, M.; Maqbool, Z.; Peng, D.; Liu, L. Morpho-physiological traits, antioxidant capacity and phytoextraction of copper by ramie (Boehmeria nivea L.) grown as fodder in copper-contaminated soil. Environ. Sci. Pollut. Res. 2019, 26, 5851–5861. [Google Scholar] [CrossRef]
Figure 1. Chlorophyll a/b of two ecotypes of M. floridulus under different Cu treatment. Note: Error bars indicate standard deviation; different letters in the same group indicate significant difference at p < 0.05 according to Duncan’s multiple range tests; the same below.
Processes 10 02712 g001
Figure 2. MDA concentrations of two ecotypes of M. floridulus under different Cu treatment. Note: Error bars indicate standard deviation; Different letters in the same group indicate significant difference at p < 0.05 according to Duncan’s multiple range tests; the same below.
Processes 10 02712 g002
Figure 3. Change in relative conductivity of two ecotypes of M. floridulus under different Cu treatment. Note: Error bars indicate standard deviation; Different letters in the same group indicate significant difference at p < 0.05 according to Duncan’s multiple range tests; the same below.
Processes 10 02712 g003
Figure 4. AsA concentrations of two ecotypes of M. floridulus under different Cu treatment. Note: Error bars indicate standard deviation; Different letters in the same group indicate significant difference at p < 0.05 according to Duncan’s multiple range tests; the same below.
Processes 10 02712 g004
Figure 5. GSH concentrations of two ecotypes of M. floridulus under different Cu treatment. Note: Error bars indicate standard deviation; Different letters in the same group indicate significant difference at p < 0.05 according to Duncan’s multiple range tests; the same below.
Processes 10 02712 g005
Figure 6. Activity of SOD of two ecotypes of M. floridulus under different Cu treatment. Note: Error bars indicate standard deviation; Different letters in the same group indicate significant difference at p < 0.05 according to Duncan’s multiple range tests; the same below.
Processes 10 02712 g006
Figure 7. Activity of POD of two ecotypes of M. floridulus under different Cu treatment. Note: Error bars indicate standard deviation; Different letters in the same group indicate significant difference at p < 0.05 according to Duncan’s multiple range tests; the same below.
Processes 10 02712 g007
Figure 8. Activity of PPO of two ecotypes of M. floridulus under different Cu treatment. Note: Error bars indicate standard deviation; Different letters in the same group indicate significant difference at p < 0.05 according to Duncan’s multiple range tests; the same below.
Processes 10 02712 g008
Table 1. The basic chemical properties of the soil at the sampling points of two ecotypes of M. floridulus and the soil for the pot experiment [27].
Soil Sample PointpHOrganic C
(g·kg−1)
Available P
(mg·kg−1)
Available N
(mg·kg−1)
Heavy Metal Content
(mg·kg−1)
ZnPbCuCd
Dabaoshan Mining Area6.214.7 ± 0.9 b32.2 ± 2.0 b30.2 ± 1.9 b1768.7 ± 91.1 a1253.3 ± 71.3 a1701.3 ± 77.5 a9.1 ± 0.9 a
Boluo County6.613.8 ± 0.9 b26.6 ± 1.8 b28.4 ± 2.7 b135.2 ± 13.1 b242.6 ± 44.1 b48.4 ± 9.5 b1.1 ± 0.2 b
Soil samples tested6.528.4 ± 1.8 a61.5 ± 9.9 a55.5 ± 9.1 a80.2 ± 8.9 b8.2 ± 7.2 c1.5 ± 0.7 c0.30 ± 0.1 b
Note: Data in the table are means ± SD (n = 3); different letters in the same vertical column indicate significant difference according to SSR test (p < 0.05), the same below.
Table 2. Effect of different Cu treatment concentrations on chlorophyll content of two ecotypes.
Cu Treatment
Concentration (mg·kg−1)
050100200400800
Chl a (mg·g−1FW)Non-mining ecotype1.30 ± 0.021.32 ± 0.011.21 ± 0.071.19 ± 0.031.01 ± 0.141.12 ± 0.11
Mining ecotype1.27 ± 0.021.27 ± 0.011.28 ± 0.011.21 ± 0.041.17 ± 0.121.14 ± 0.02
Chl b (mg·g−1FW)Non-mining ecotype0.77 ± 0.060.91 ± 0.070.50 ± 0.130.43 ± 0.040.30 ± 0.080.35 ± 0.10
Mining ecotype0.52 ± 0.080.47 ± 0.010.56 ± 0.010.48 ± 0.050.41 ± 0.120.38 ± 0.01
Carotenoid (mg·g−1FW)Non-mining ecotype0.42 ± 0.010.43 ± 0.010.37 ± 0.030.38 ± 0.020.33 ± 0.020.37 ± 0.04
Mining ecotype0.38 ± 0.010.37 ± 0.010.39 ± 0.010.37 ± 0.010.35 ± 0.050.34 ± 0.01
Total chlorophyll (mg·g−1FW)Non-mining ecotype2.07 ± 0.05 2.23 ± 0.07 1.71 ± 0.11 1.62 ± 0.05 1.31 ± 0.12 1.47 ± 0.20
Mining ecotype1.80 ± 0.09 1.74 ± 0.02 1.84 ± 0.02 1.70 ± 0.10 1.59 ± 0.21 1.52 ± 0.02
Chl a/bNon-mining ecotype1.70 ± 0.16 1.44 ± 0.092.49 ± 0.472.74 ± 0.18 3.44 ± 0.52 3.25 ± 0.66
Mining ecotype2.44 ± 0.32 2.61 ± 0.062.25 ± 0.06 2.50 ± 0.18 2.90 ± 0.60 3.00 ± 0.07
Table 3. Pearson product-moment correlation matrix for MDA, Cu concentrations and SOD, POD, PPO of Miscanthus floridulus.
TypeItemCuChlMDARPPAsAGSHSODPODPPO
Non-mining ecotypeCu1
Chl−0.671 **1
MDA0.972 **−0.717 **1
RPP0.855 **−0.757 **0.902 **1
AsA0.884 **−0.810 **0.891 **0.936 **1
GSH−0.763 **0.842 **−0.818 **−0.903 **−0.883 **1
SOD−0.713 **0.310−0.560 *−0.437−0.530 *0.3161
POD−0.4650.086−0.296−0.080−0.203−0.0080.852 **1
PPO−0.747 **0.354−0.635 **−0.548*−0.649 **0.478 *0.853 **0.650 **1
Mining ecotypeCu1
Chl−0.667 **1
MDA0.920 **−0.698 **1
RPP0.797 **−0.4660.909 **1
AsA0.831 **−0.622 **0.932 **0.852 **1
GSH−0.794 **0.424−0.718 **−0.738 **−0.762 **1
SOD0.868 **−0.543 *0.955 **0.883 **0.939 **−0.686 **1
POD0.875 **−0.583 *0.952 **0.873 **0.963 **−0.740 **0.970 **1
PPO0.861 **−0.501 *0.922 **0.855 **0.909 **−0.702 **0.976 **0.959 **1
Note: Cu: Cu treatment concentration; Chl: total chlorophyll; RPP: cell membrane permeability; MDA: malondialdehyde; AsA: ascorbic acid; GSH: reduced glutathione; POD: peroxidase enzyme; SOD: superoxide dismutase; PPO: polyphenol oxidase; * and ** indicate significance under p < 0.05 and p < 0.01, respectively.
Publisher’s Note: MDPI stays neutral with regard to jurisdictional claims in published maps and institutional affiliations.

