Article

Mathematical Modeling of Thin Layer Drying Kinetics and Moisture Diffusivity Study of Pretreated Moringa oleifera Leaves Using Fluidized Bed Dryer

1
Department of Food Technology, Guru Jambheshwar University of Science and Technology, Hisar 125001, India
2
Department of Crop Science, Konkuk University, Seoul 143-701, Republic of Korea
*
Author to whom correspondence should be addressed.
Processes 2022, 10(11), 2464; https://doi.org/10.3390/pr10112464
Submission received: 8 October 2022 / Revised: 3 November 2022 / Accepted: 17 November 2022 / Published: 21 November 2022
(This article belongs to the Special Issue Drying Kinetics and Quality Control in Food Processing)

Abstract

:
Investigations were undertaken to study the drying kinetics of pretreated and unblanched leaves of Moringa oleifera dried in a fluidized bed dryer (FBD) using nine established thin layer drying mathematical models. The statistical software tool Statistica was utilized to carry out regression analysis, and the model constants were evaluated using nonlinear regression. In nonlinear regression, the R2 and reduced χ2 were employed to evaluate the goodness of fit of several mathematical models to the data generated experimentally. The model with the highest R2 and the lowest reduced χ2 and root mean square error (RMSE) values was adjudged as best fit to the drying curves. The drying kinetics of drumstick leaves was best explained by the Midilli–Kucuk model, followed by the Logarithmic model. The R2, reduced χ2, and RMSE values of the Midilli–Kucuk model under fluidized bed drying varied from 0.9982–0.9997, 0.00003–0.00029, and 0.0059–0.0166 in pretreated and 0.9945–0.9961, 0.00019–0.00054 and 0.0136–0.227 in unblanched Moringa leaves dried at 50–70 °C, respectively. The diffusivity (Deff) values ranged between 2.96 × 10⁻⁹–3.59 × 10⁻⁹ m2 s−1 and 2.92 × 10⁻⁹–3.04 × 10⁻⁹ m2 s−1, and activation energy varied from 13.67–14.07 (KJ/mol) and 13.85–14.11 (KJ/mol) for pretreated and unblanched dried leaves at 50–70 °C drying temperatures, respectively.

1. Introduction

Moringa oleifera, commonly known as “Moringa”,”drumstick”,”sahjan” or “horseradish” tree, belongs to the family Moringaceae (Brassicales), and is a fast-growing drought-resistant plant mainly grown in semi-arid tropical and subtropical climatic areas. The global market value of Moringa products was USD 7.1 billion in 2021 and is expected to grow at a steady CAGR of 8.9% during the period 2023–2032 [1]. Moreover, the Moringa leaf powder market is expected to exceed USD 6 billion by 2025 [2]. It is considered a “superfood” or “miracle tree being extremely nutritious tree, and almost each part has food value or other beneficial uses” [3]. Its leaves are a rich source of minerals (potassium, calcium, magnesium, phosphorus, iron, zinc and copper) [4,5], fiber, vitamin C and carotenoids [6], polyphenols [7,8], proteins, alkaloids [9], and several other nutritionally vital constituents [10,11]. The Moringa seeds, leaves, bark, roots, and flowers are widely used in traditional medicine to treat several diseases, including anemia, arthritis, asthma, cancer, diarrhea, constipation, diabetes, heart problems, epilepsy, headache, intestinal ulcers and spasms, stomach pain and kidney stones, and viral, bacterial and fungal diseases [12,13].
Drying, one of the oldest and common food preservation methods, is a very important food processing stage applicable to a broad range of industrial and agricultural products [14]. Moisture removal from a product by application of heat to an acceptable level is very important for safe storage, thwarting marketing deterioration within a definite time period, processing and transportation [15]. It also helps in the prevention of microbial spoilage and chemical modifications, leading to prolonged shelf-life and the realization of weight and space savings [16]. The drying of a product leads to its discoloration, changes in physical appearance and shape, textural alterations, and loss of flavor, aroma, and nutritive value. Though drying at higher temperatures reduce drying time, it may result in a product of poor quality and consume additional power. On the other hand, mild drying at low temperature can provide better-quality products. However, it reduces the rate of drying and prolongs the drying period [17]. An advanced drying technique, namely fluidized bed drying (FBD), offers numerous advantages over other techniques of drying particulate materials [18]. Particle fluidization provides easy material transport and greater heat exchange rates at high thermal efficiency and, thus, prevents overheating of the individual particles. It is widely used in several industries for drying finely divided 50–5000 µm particulate materials. Combining appropriate drying techniques and pretreatment could be an economical preservation approach. Pretreatment before drying proved beneficial in agricultural goods, as it helps to decrease undesirable changes in color, texture, etc. It also shortens drying time by relaxing tissue structure, and thus improves the quality of the dried product.
The experimental setup and mathematical modeling of the process are vital aspects in drying technology. Modeling is primarily performed on the basis of the creation of a set of equations that precisely represent the system. Process modeling is of vital significance in the analysis of the design and optimization of dryers. In process model development, an essential part is to determine the drying kinetics, which explain the mechanisms and effects that certain process variables impose on the moisture removal processes. Moisture transport is the most commonly encountered phenomenon in the modeling of drying operations. Several mathematical models need to be applied for developing drying procedures in order to design new or modify existing drying systems so that the drying process can be controlled. Evaluation of drying kinetics as a function of various drying conditions may help in drying simulation for prediction of appropriate drying conditions. Among the different drying models developed, thin layer models are normally considered to describe the drying process. Thin layer drying of the materials is essential for understanding the basic transport mechanism and is a prerequisite to the successful simulation or scaling-up of the entire process for optimizing or controlling the operating conditions. Models are generally categorized as empirical, semi-theoretical and theoretical to depict the drying kinetics. Semi-theoretical models offer a compromise between theory and ease of application [19]. Examples of semi-theoretical models generally used are Newton, Henderson and Pabis, Page, Logarithmic, Two-term, Two-term exponential, Midilli–Kucuk and Verma et al. Empirical modeling derives a direct relationship between moisture content and drying time. The fundamentals of the drying process are neglected, and the Wang and Singh model is an example of an empirical model used in the literature. Fick’s second law of diffusion is the basis of the most widely used theoretical models. These models were found to be inadequate, tend to generate inaccurate results, and are complex for practical applications, thus limiting their use in dryer design [20]. Therefore, semi-theoretical models have been developed for food drying as better fit models to the drying data. Accordingly, for developing semi-theoretical models, Fick’s second law and variations of its simplified versions are most commonly used. However, some other semi-theoretical models have been derived through analogies with Newton’s law of cooling [21]. Both empirical and semi-theoretical models contain many similarities. These models are extremely dependent upon experimental conditions and offer modest information in respect of drying behavior of product [21]. The experimental data and dimensional analysis are generally utilized in the empirical technique, so these can be used very easily in drying simulations [22]. The theoretical models consider external variables and the internal moisture transfer mechanism, including its implications [23]. However, in empirical and semi-theoretical models, only external impedance to movement of moisture between product and atmosphere is integrated [24]. The drying rate model construction may require a meticulous understanding of drying rate [25]. The drying kinetics is utilized to demonstrate moisture removal from products and elucidate more about the process variables. The major flaw of the empirical model is that it ignores the drying process basics and only explains drying curves for certain drying conditions and not the processes going on during drying [26]. The knowledge pertaining to activation energy and effective moisture diffusivity is vital in order to design and model mass transfer processes such as dehydration or adsorption of moisture during the storage period.
Studies in respect of mathematical modeling and the drying process have been carried out by numerous researchers on vegetables [27,28], fruits [29,30] and leaves of other plants [31,32]. The drying kinetics of Moringa leaves in convective drying [33,34], microwave drying [35] and lyophilization [36] techniques have been studied. However, such studies for other drying methods are very meager. Moringa leaves pretreated with 0.1% sodium bicarbonate followed by shade drying resulted in better drying characteristics [37]. Moreover, drying kinetics-based studies of Moringa (drumstick) leaves with respect to pre-drying treatments, such as blanching, blanching with sodium bicarbonate (NaHCO3), sodium chloride (NaCl), potassium metabisulphite (KMS) and sodium bisulphite (NaHSO3), are lacking. Considering the above facts, the present investigation was undertaken to understand the drying behavior of pretreated Moringa leaves in fluidized bed drying at different temperatures and to identify the most suitable model by fitting drying curves with established models. Secondly, moisture diffusivity studies were carried out using the Arrhenius equation, and activation energy and specific energy consumption were estimated.

2. Materials and Methods

2.1. Materials

The Moringa leaves were collected from the campus of Guru Jambheshwar University of Science and Technology (GJUS&T), Hisar, Haryana, India. First of all, leaves and stems were separated. Then, fresh, green and undamaged leaves were sorted, and bruised, discolored, decayed, wilted and insect-pest and diseases-infested leaves were discarded. Then, the selected leaves were washed thoroughly with distilled water for removing dirt and impurities from the surface of leaves and transferred to a stainless steel sieve and kept for 30 min to drain out surface water.

2.2. Pretreatments before Drying

After initial sample preparation, the leaves were utilized for subsequent pre-drying treatments. At optimized temperature and time (84.6 °C for 58.4 s) using the response surface methodology (RSM), samples of the leaves were blanched in a 200 mL solution of 1% sodium chloride (B+NaCl), 0.1% sodium bicarbonate (B+NaHCO3), 0.5% potassium metabisulphite (B+KMS), hot water blanching (BS), 0.5% sodium bisulfite (B+SB) and also kept unblanched (UB) for further drying studies.

2.3. Drying Equipment

A tabletop FBD (Retsch, part of Verder Scientific, Maharashtra, India) was used for drying Moringa leaves. The FBD is simple, compact, portable, convenient, and easy to operate. The dryer’s electrical controls and air distribution system are enclosed in a cabinet. At the base of the cabinet, a mesh filter is provided to draw the air inside the dryer. A centrifugal fan over an electrical heater of 2 kW is installed to blow the air outside. The tube unit comprises a container with a fine mesh distributor (pore size 63 µm and mesh diameter 16 cm) and stainless steel support. A filter bag is fitted on top of the tube to retain particles expelled from the fluidized bed. The FBD has a PID controller ranging from 0–110 °C for regulating the operation of the heater and maintaining the desired preset temperature of drying air.

2.4. Drying Experiment

The Moringa leaf samples (50 g) were dried in the FBD at 50, 60 and 70 °C air temperatures and 2 m s−1 air velocity. They were then properly labeled and transferred into a transparent cellophane bag. The weights of the Moringa leaf samples were recorded in triplicate at 10 min intervals using a weighing balance until a constant value of moisture content was reached, and average values were used for calculation. Initial moisture contents of samples (%wb) in each treatment were determined by the standard method [38] until constant weight was obtained. Moisture content (MC) was calculated with the following equation:
Moisture   Content   ( MC , % wb ) = W w W d W w × 100
where Ww and Wd denote the wet and dry weight of the Moringa leaf samples, respectively, and wb represents the moisture content on a wet basis.
The equilibrium moisture content (EMC) for each treatment was estimated by continuing the drying process until constant weight was recorded in consecutive observations of the Moringa leaves.

2.5. Drying Kinetics through Appropriate Mathematical Modeling

2.5.1. Moisture Ratio

The moisture ratio (MR) was calculated using moisture content data obtained from samples at different time intervals and at different drying temperatures. The calculation of MR using Equation (1) during drying experiments was as follows:
Moisture   Ratio   ( MR ) = M t M e M o M e
where MR represents moisture ratio and Mo, Me and Mt are initial moisture content, equilibrium moisture content and moisture content at ‘t’, respectively, and ‘t’ is the drying time (min).
The moisture ratio was used for studying the drying kinetics of Moringa (drumstick) leaves through suitable mathematical modeling.

2.5.2. Drying Rate

For calculating the drying rate (DR), the following equation was used.
Drying   Rate   ( DR ) = M ( t + d t ) M t d t
where Mt represents the moisture content at time ‘t’, while M(t+dt) denotes moisture content at t + dt, and dt is the time difference between two successive drying times.

2.5.3. Mathematical Modeling

Several thin layer drying models used for analyzing and describing experimental data from drying process are presented in Table 1. The model coefficients are a, b, c and n, whereas k represents the drying constant (min−1) and t is the duration of drying in minutes. The software program “Statistica version 10.0” was used for applying the models to experimental data via nonlinear regressions. The coefficient of determination (R2) was the most crucial factor for deciding which model may be used in order to explain the drying curves. The R2, variances between experimental and projected values and root mean square error (RMSE) analysis were used to determine goodness of fit of the models. Midilli and Kucuk [39] reported better goodness of fit with higher R2, reduced χ2 and RMSE values. These parameters were determined using Equations (3)–(5), as given below:
R 2 = i = 1 N ( MR i MR pre , i ) × ( MR i MR exp , i ) i = 1 N [ MR i MR pre , i ] 2 × [ i = 1 N ( MR i MR exp , i ) 2 ]
R M S E = i = 1 N ( M R e x p , i M R c a l , i ) 2 N
χ 2 = i = 1 N ( M R e x p , i M R c a l , i ) 2 N n
where R2 is the coefficient of determination, MRexp,i—experimental moisture ratio in any measurement, MRpre,i—predicted moisture ratio for this measurement, N—total number of observations, and n is the number of constants [40].
Table 1. Mathematical models fitted to the thin layer drying curves of Moringa oleifera leaves.
ModelModel ExpressionReferences
NewtonMR = exp (−kt)[41]
PageMR = exp (−ktn)[23,42]
Wang and SinghMR = 1 + at + bt2[43]
LogarithmicMR = a exp (−kt) + c[44]
Two-term exponentialMR = a exp (−kt) + (1 − a) exp (−k at)[39,45]
Henderson and PabisMR = a exp (−kt)[19,26]
Verma et al.MR = a exp (−kt) + (1 − a) exp (−gt)[46]
MageeMR = a + kt1/2[47]
Midilli–KucukMR = a exp (ktn) + bt[39,48]
k represents drying constant; a, b, c, g, n and g are coefficients and t is the drying time.

2.6. Effective Moisture Diffusivity and Activation Energy

2.6.1. Determination of Effective Diffusivity Coefficients

Fick’s second law of diffusion (Equation (6)) was used to study the process of drying during removal of moisture as described by Doymaz [49].
M t = D eff 2 M
where M is the moisture content (%wb) and t is the drying time (s). The drying process in a falling rate period for food and agricultural commodities can be elucidated using Fick’s second law of diffusion. Using Equation (6) as worked out by Crank [50] for an infinite slab, assuming uni-dimensional moisture movement, stable temperature, change of volume, diffusivity coefficient and minor external resistance, the solution is in the form of Equation (7).
MR = M M e M 0 M e = 8 π 2 n = 0 1 ( 2 n + 1 ) exp ( ( 2 n + 1 ) 2 π 2 D eff t ) 4 L 2 )
On expanding Equation (7) to the first three terms, Equation (8) will be obtained, as mentioned below.
M R = 8 π 2 { e x p ( π 2 4 L 2 · D e f f · t ) + 1 9 e x p ( 9 π 2 4 L 2 · D e f f · t ) + 1 25 e x p ( 25 π 2 4 L 2 · D e f f · t ) }
Neglecting the higher order term from Equation (8) and simplifying by taking the first term of the series, the moisture diffusivity of Moringa oleifera leaves can be expressed as Equation (9).
MR = M M e M 0 M e = 8 π 2 exp ( π 2 D eff t 4 L 2 )
where Deff is obtained from the slope (K) of the graph between lnMR and drying time t. LnMR versus time resulted in a straight line with a negative slope. K is associated with Deff using Equation (10).
K = π 2 D eff 4 L 2
where Deff is effective moisture diffusivity (m2 s−1), L is half the thickness mean of slab (m) (0.00035 for Moringa leaves), t represents the drying time, and n is a positive integer (0,1,2…).

2.6.2. Calculation of Activation Energy

Effective moisture diffusivity is related to temperature by the Arrhenius equation. Doymaz [49] and Garau et al. [51] stated that Deff can be linked to temperature by
D eff = D 0 exp ( E a R ( T + 273.15 ) )
where D0—the constant in Arrhenius equation (m2 s−1), Ea—activation energy (kJ mol−1), T—temperature of hot air (°C), and R—universal gas constant (8.31451 kJ mol−1 K−1). Equation (11) can be rearranged as below:
ln ( D eff ) = ln ( D 0 ) E a R ( T + 273.15 )
The activation energy for moisture diffusion is obtained from the slope of the graph of ln(Deff) against 1/(T + 273.15).

2.7. Energy and Specific Energy Consumption

The energy consumption (Ec) in kWh of the FBD was calculated using the following equation:
Energy consumption Ec = P × t/1000
where Ec represents the energy consumption in kWh, P is the power rating of the FBD in Watts, and t denotes the drying time in hours.
The amount of specific energy consumption (SEC) needed to dry the pretreated and untreated leaves under the fluidized bed drying method can then be calculated by the following equation:
SEC (kWh/kg) = Ec/∆w
where ∆w is change in the weight of each dried sample.

3. Results and Discussion

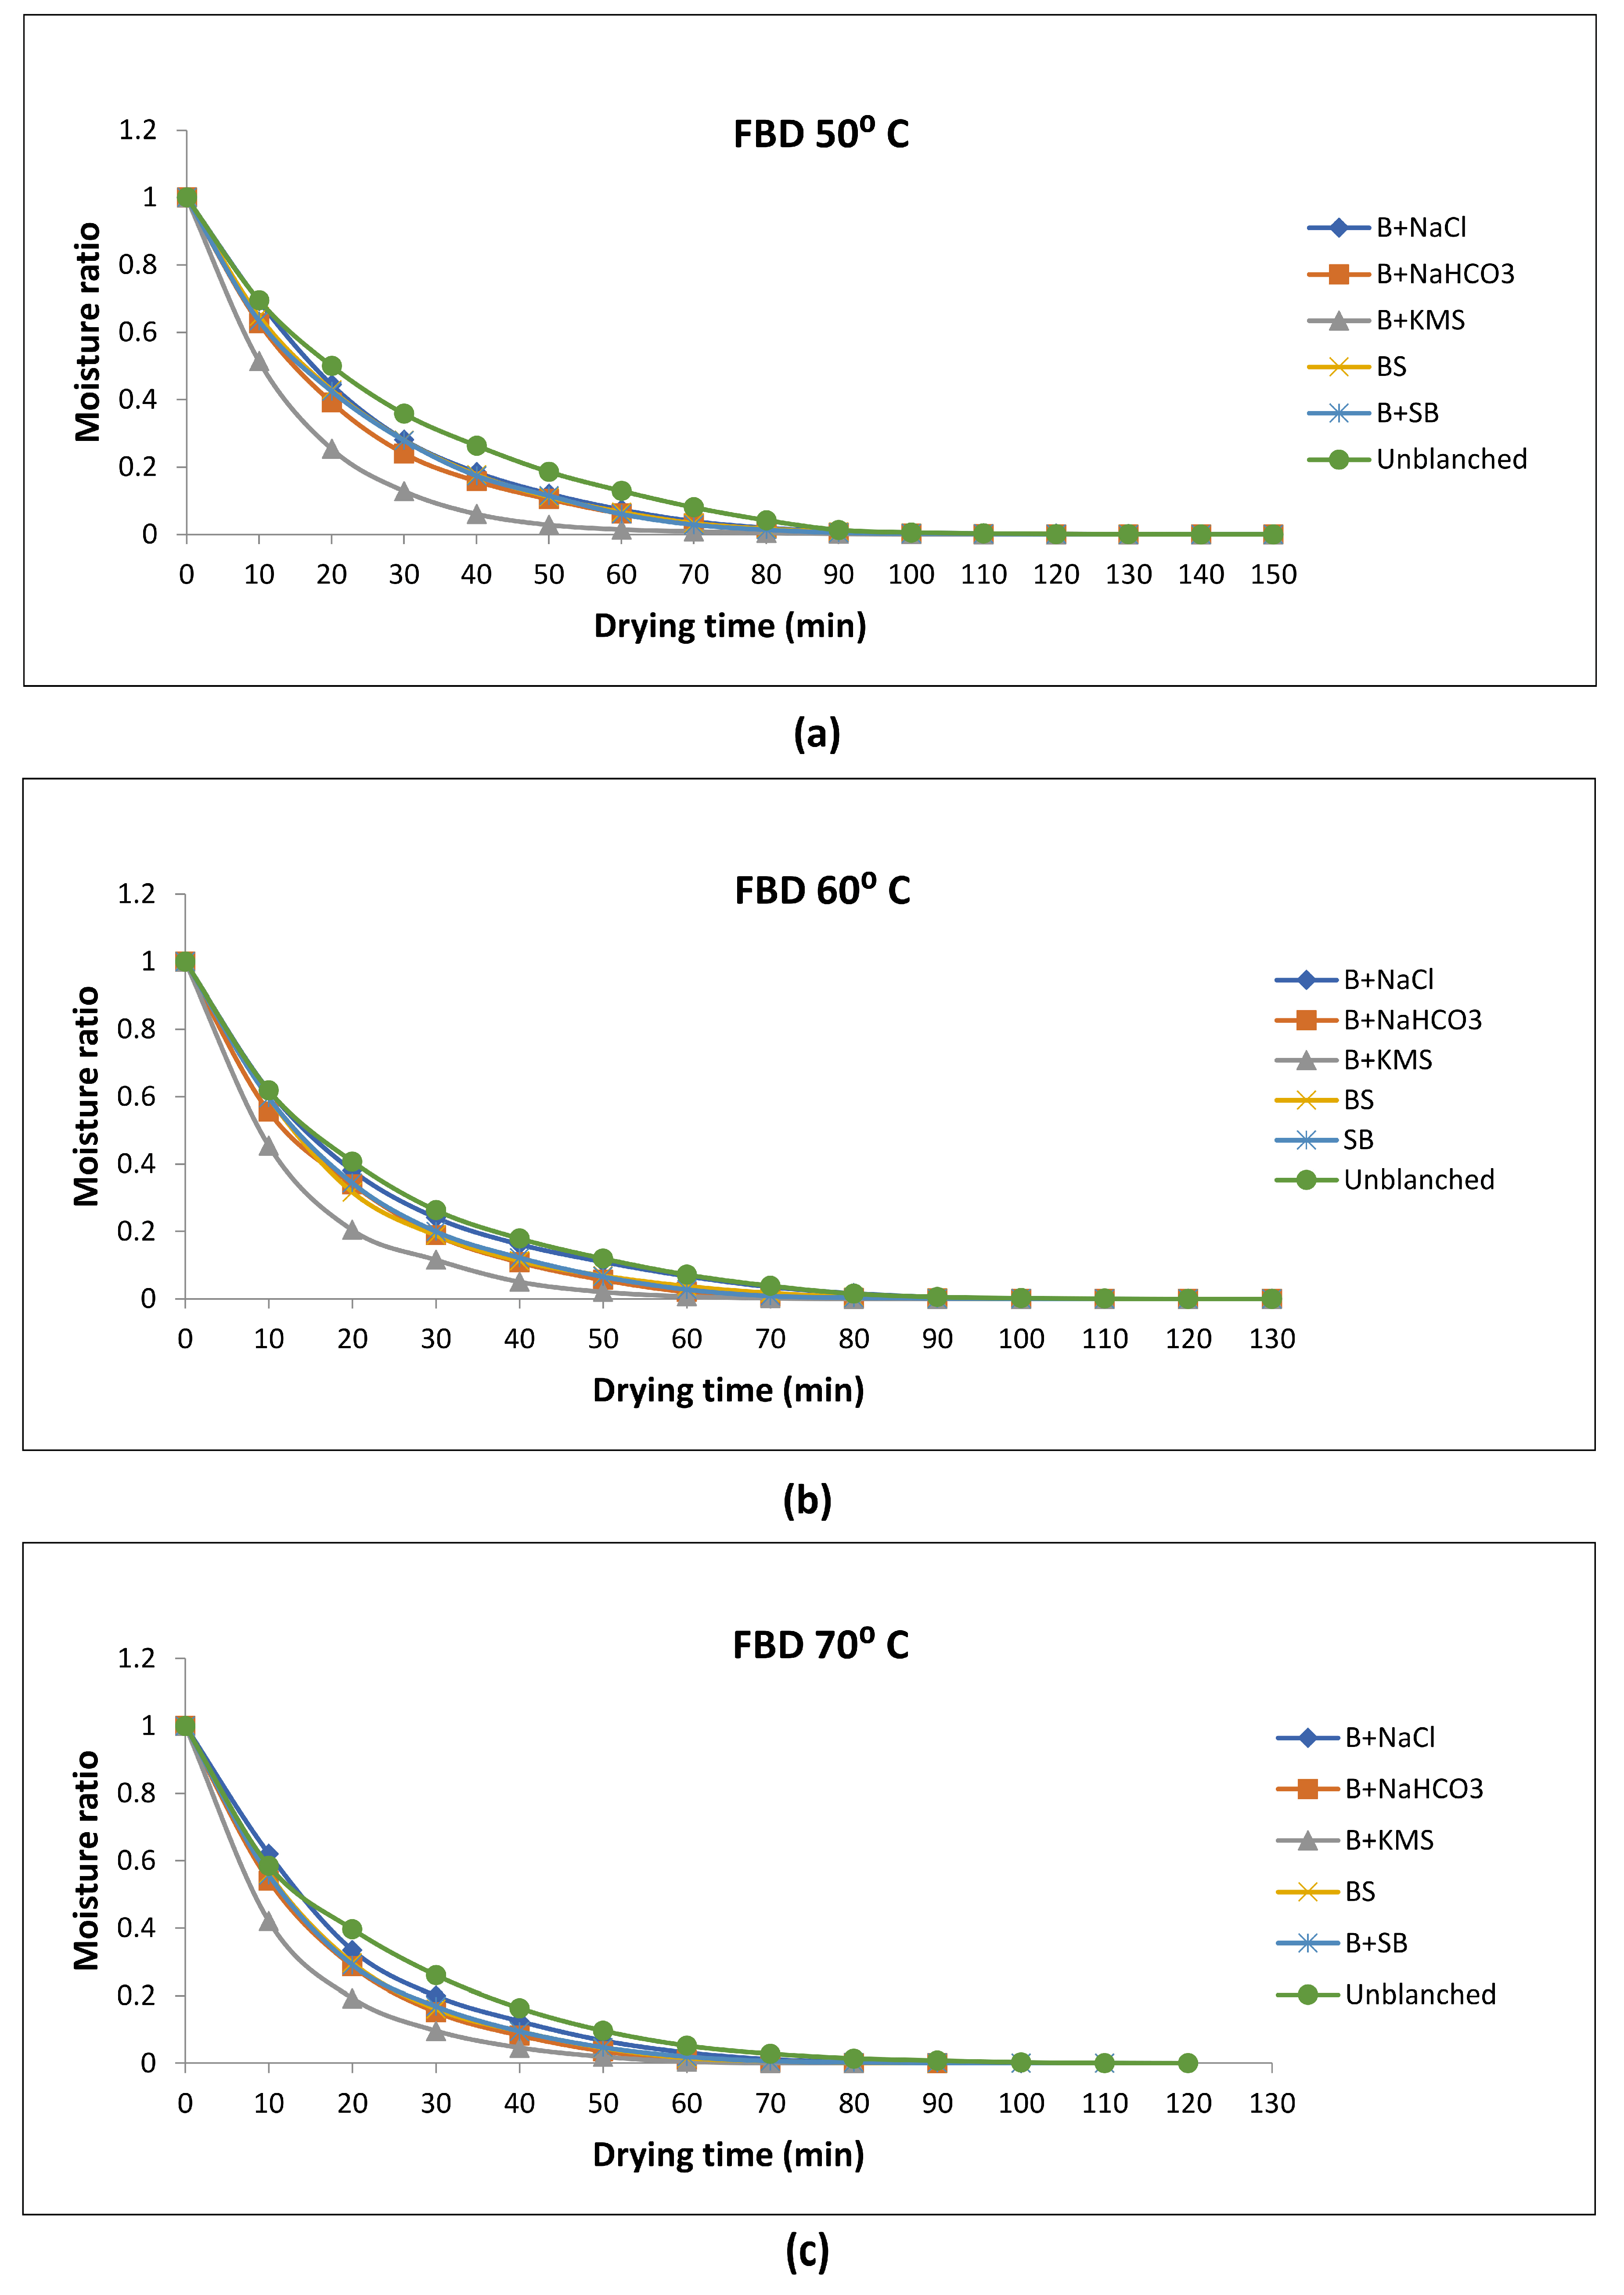
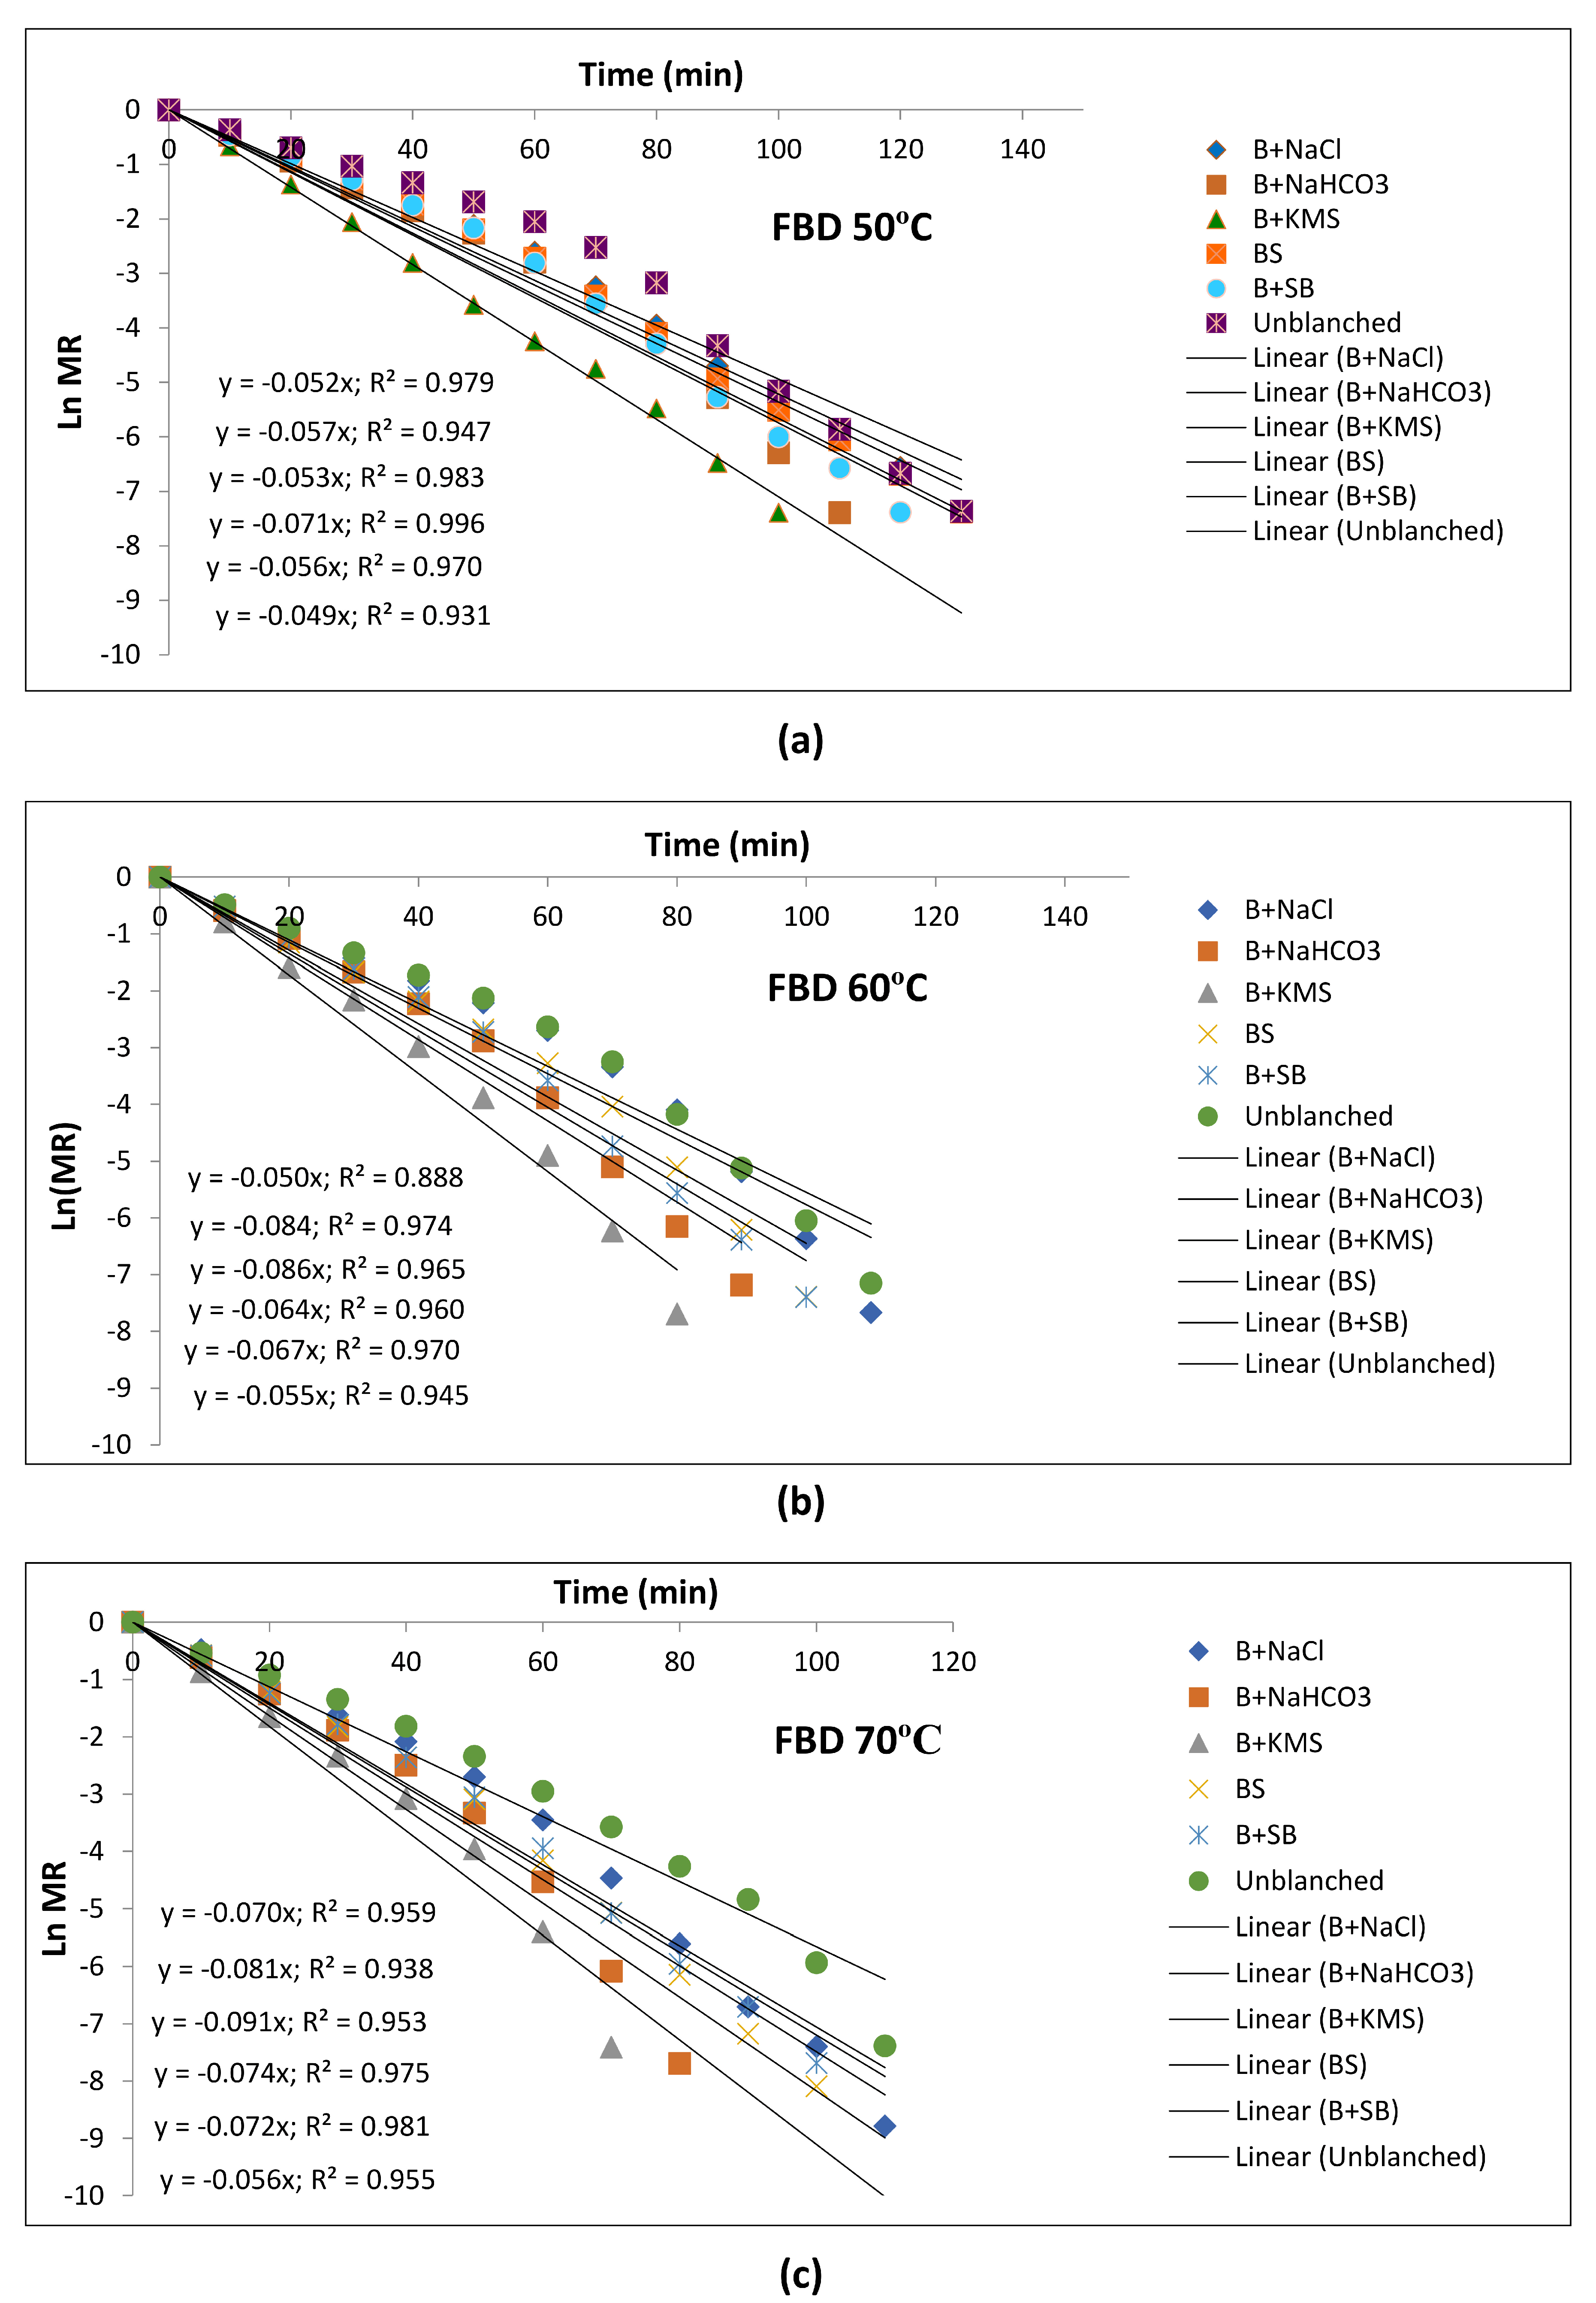
3.1. Moisture Ratio versus Drying Time

The initial moisture content (Mo) in Moringa leaves prior to drying was 73.36, 73.51, 73.55, 73.44, 73.27 and 73.18 percent on a wet basis in B+NaCl, B+NaHCO3, B+KMS, B+SB, blanched (BS) and unblanched (UB) treatments, respectively. It decreased continuously with the increase in drying time under various pretreatments at all drying temperatures, i.e., 50 °C to 70 °C. The drying time decreased with pretreatment of leaves as compared to unblanched samples at all drying temperatures. The leaves pretreated with KMS required the least drying time (80 min) at 70 °C drying temperature and attained an equilibrium moisture content (Me) value of 7.52 percent, closely followed by KMS pretreatment at 60 °C and NaHCO3 pretreatment at 70 °C drying temperature with an Me of 7.83. The B+KMS samples took the least time to dry compared to other pretreatments, because blanching in KMS resulted in comparatively better softening of the texture of the leaves, which helped in accelerating the drying process, resulting in easier moisture removal and thus shorter drying times [52,53]. The drying process took longer time to reach Me in other pretreatments and unblanched samples. The Me values in these pretreatments ranged between 9.18 to 10.12, 7.95 to 8.01 and 8.30 to 9.34 percent as compared to 10.39, 9.64 and 8.74 percent with the unblanched samples dried at 50 °C, 60 °C and 70 °C, respectively. The moisture ratio (MR) is the amount of residual moisture content to initial moisture content in leaves. The decrease in MR with drying time was used for analyzing the experimental drying data. The results revealed that with the increase in drying time, the MR decreased exponentially. The MR versus drying time curves for various pretreated drumstick leaves dried in FBD at selected temperatures of 50 °C, 60 °C and 70 °C are shown in Figure 1a–c. The MR vs. drying time curves showed a much faster drop in MR during the initial drying period and, thereafter, decreased slowly.
The results further indicated that a constant rate period was not present in the drumstick leaf drying process. Babu et al. [54] concluded that as a significant drying time was involved in the removal of internal moisture, the falling rate represented the predominant drying mechanism in the case of leaf drying. The initial moisture ratio of 1 decreased to minimum MR in B+KMS treated Moringa leaves in the shortest drying times (110, 90, and 80 min at 50, 60, and 70 °C, respectively). The other pretreatments required more time to attain minimum MR, and the longest drying time was observed with unblanched (UB) leaves (Figure 1a–c). The results are in conformity with the findings reported by Brar et al. [55], Kayran and Doymaz [56], and Singh et al. [57] for other plant species. Continuous MR decreases indicated that diffusion governed the internal mass transfer [58]. A higher drying air temperature decreased the MR faster as a result of the increased air heat supply rate to the leaves, as well as the acceleration of moisture migration [59].

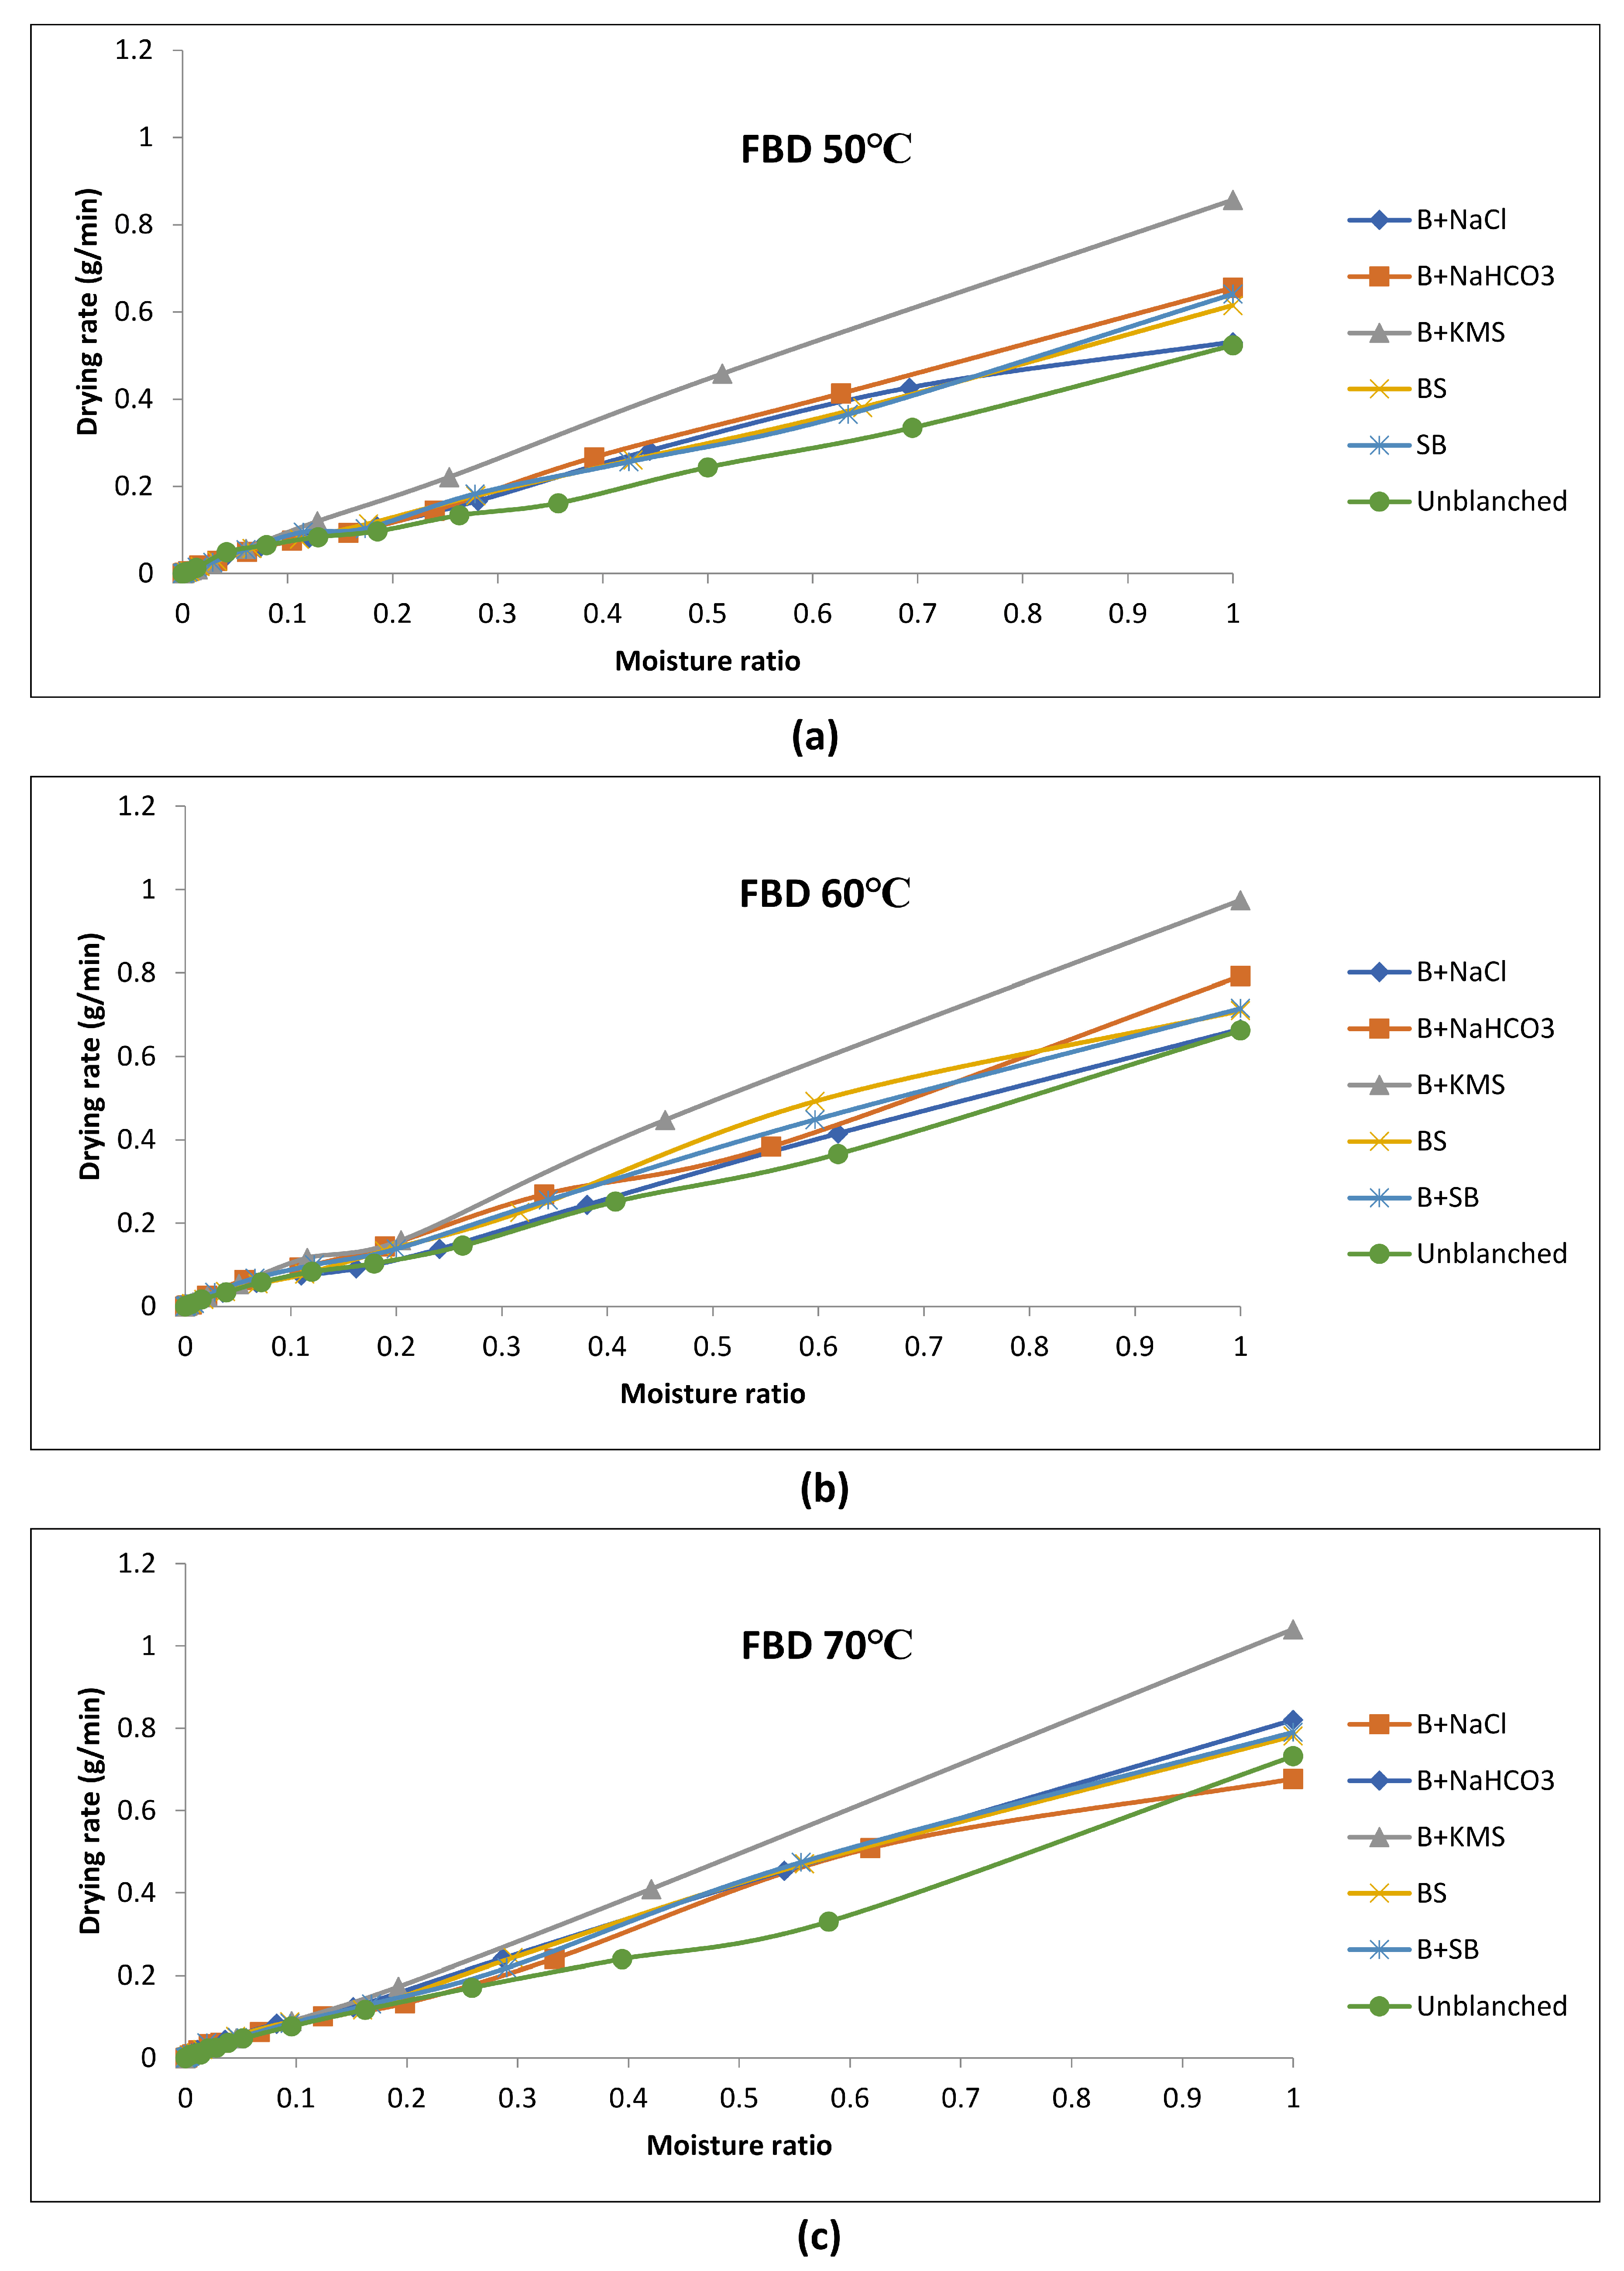
3.2. Drying Rate versus Moisture Ratio

The variation in drying rate with respect to MR for various pretreatments and drying temperatures, i.e., 50, 60, and 70 °C, are presented in Figure 2a–c, respectively. The results showed that at the initial stage of drying, the drying rate was high because of the presence of high moisture content, and it decreased constantly until the termination of drying primarily because of the decreasing MR as drying proceeded. The higher drying rate in the beginning may be because of the accelerated internal heating, whereas, at the final stage of drying, the moisture migration rate from inner to outer surface decreases, hence the drying rate decreases. These results agree with earlier studies on various herbal leaves [60]. Similar results were obtained by Doymaz [61] and Wankhade et al. [62].
It was further observed that with the increase in drying temperature from 50 to 70 °C, the drying rate increased and consequently reduced the MR. This was probably due to the increased rate of air heat supply to the product and the hastening of water migration inside drumstick leaves and is attributed to the increase in Deff of moisture at higher temperatures. The flux between the heating medium and the solid material improved with increasing temperature of the heating medium, as well as due to improved thermal and mass driving force, which resulted in an increased drying rate. This is in agreement with the results of several researchers who also reported a significant increase in drying rates with increasing temperatures used for drying various agricultural products [63,64].
The highest drying rates in pretreated leaves dried under the fluidized bed at 50, 60 and 70 °C varied between 0.53 to 0.86 g/min, 0.67 to 0.97 g/min, and 0.68 to 1.04 g/min, respectively, after 10 min of drying. However, the corresponding drying rates for unblanched (UB) leaves were 0.52, 0.66 and 0.73 g/min. Among all of the pretreated leaves, the drying rate at all drying temperatures was maximum under B+KMS pretreatment throughout the drying period. This might be due to the fact that B+KMS pretreatment enhanced the tenderness of the leaves and modified their leaf matrix microstructure in terms of cell wall disintegration, resulting in increased permeability, which led to an increased drying rate [65]. The findings were in agreement with the results reported by Fijalkowska et al. [66] and Sharma et al. [65].

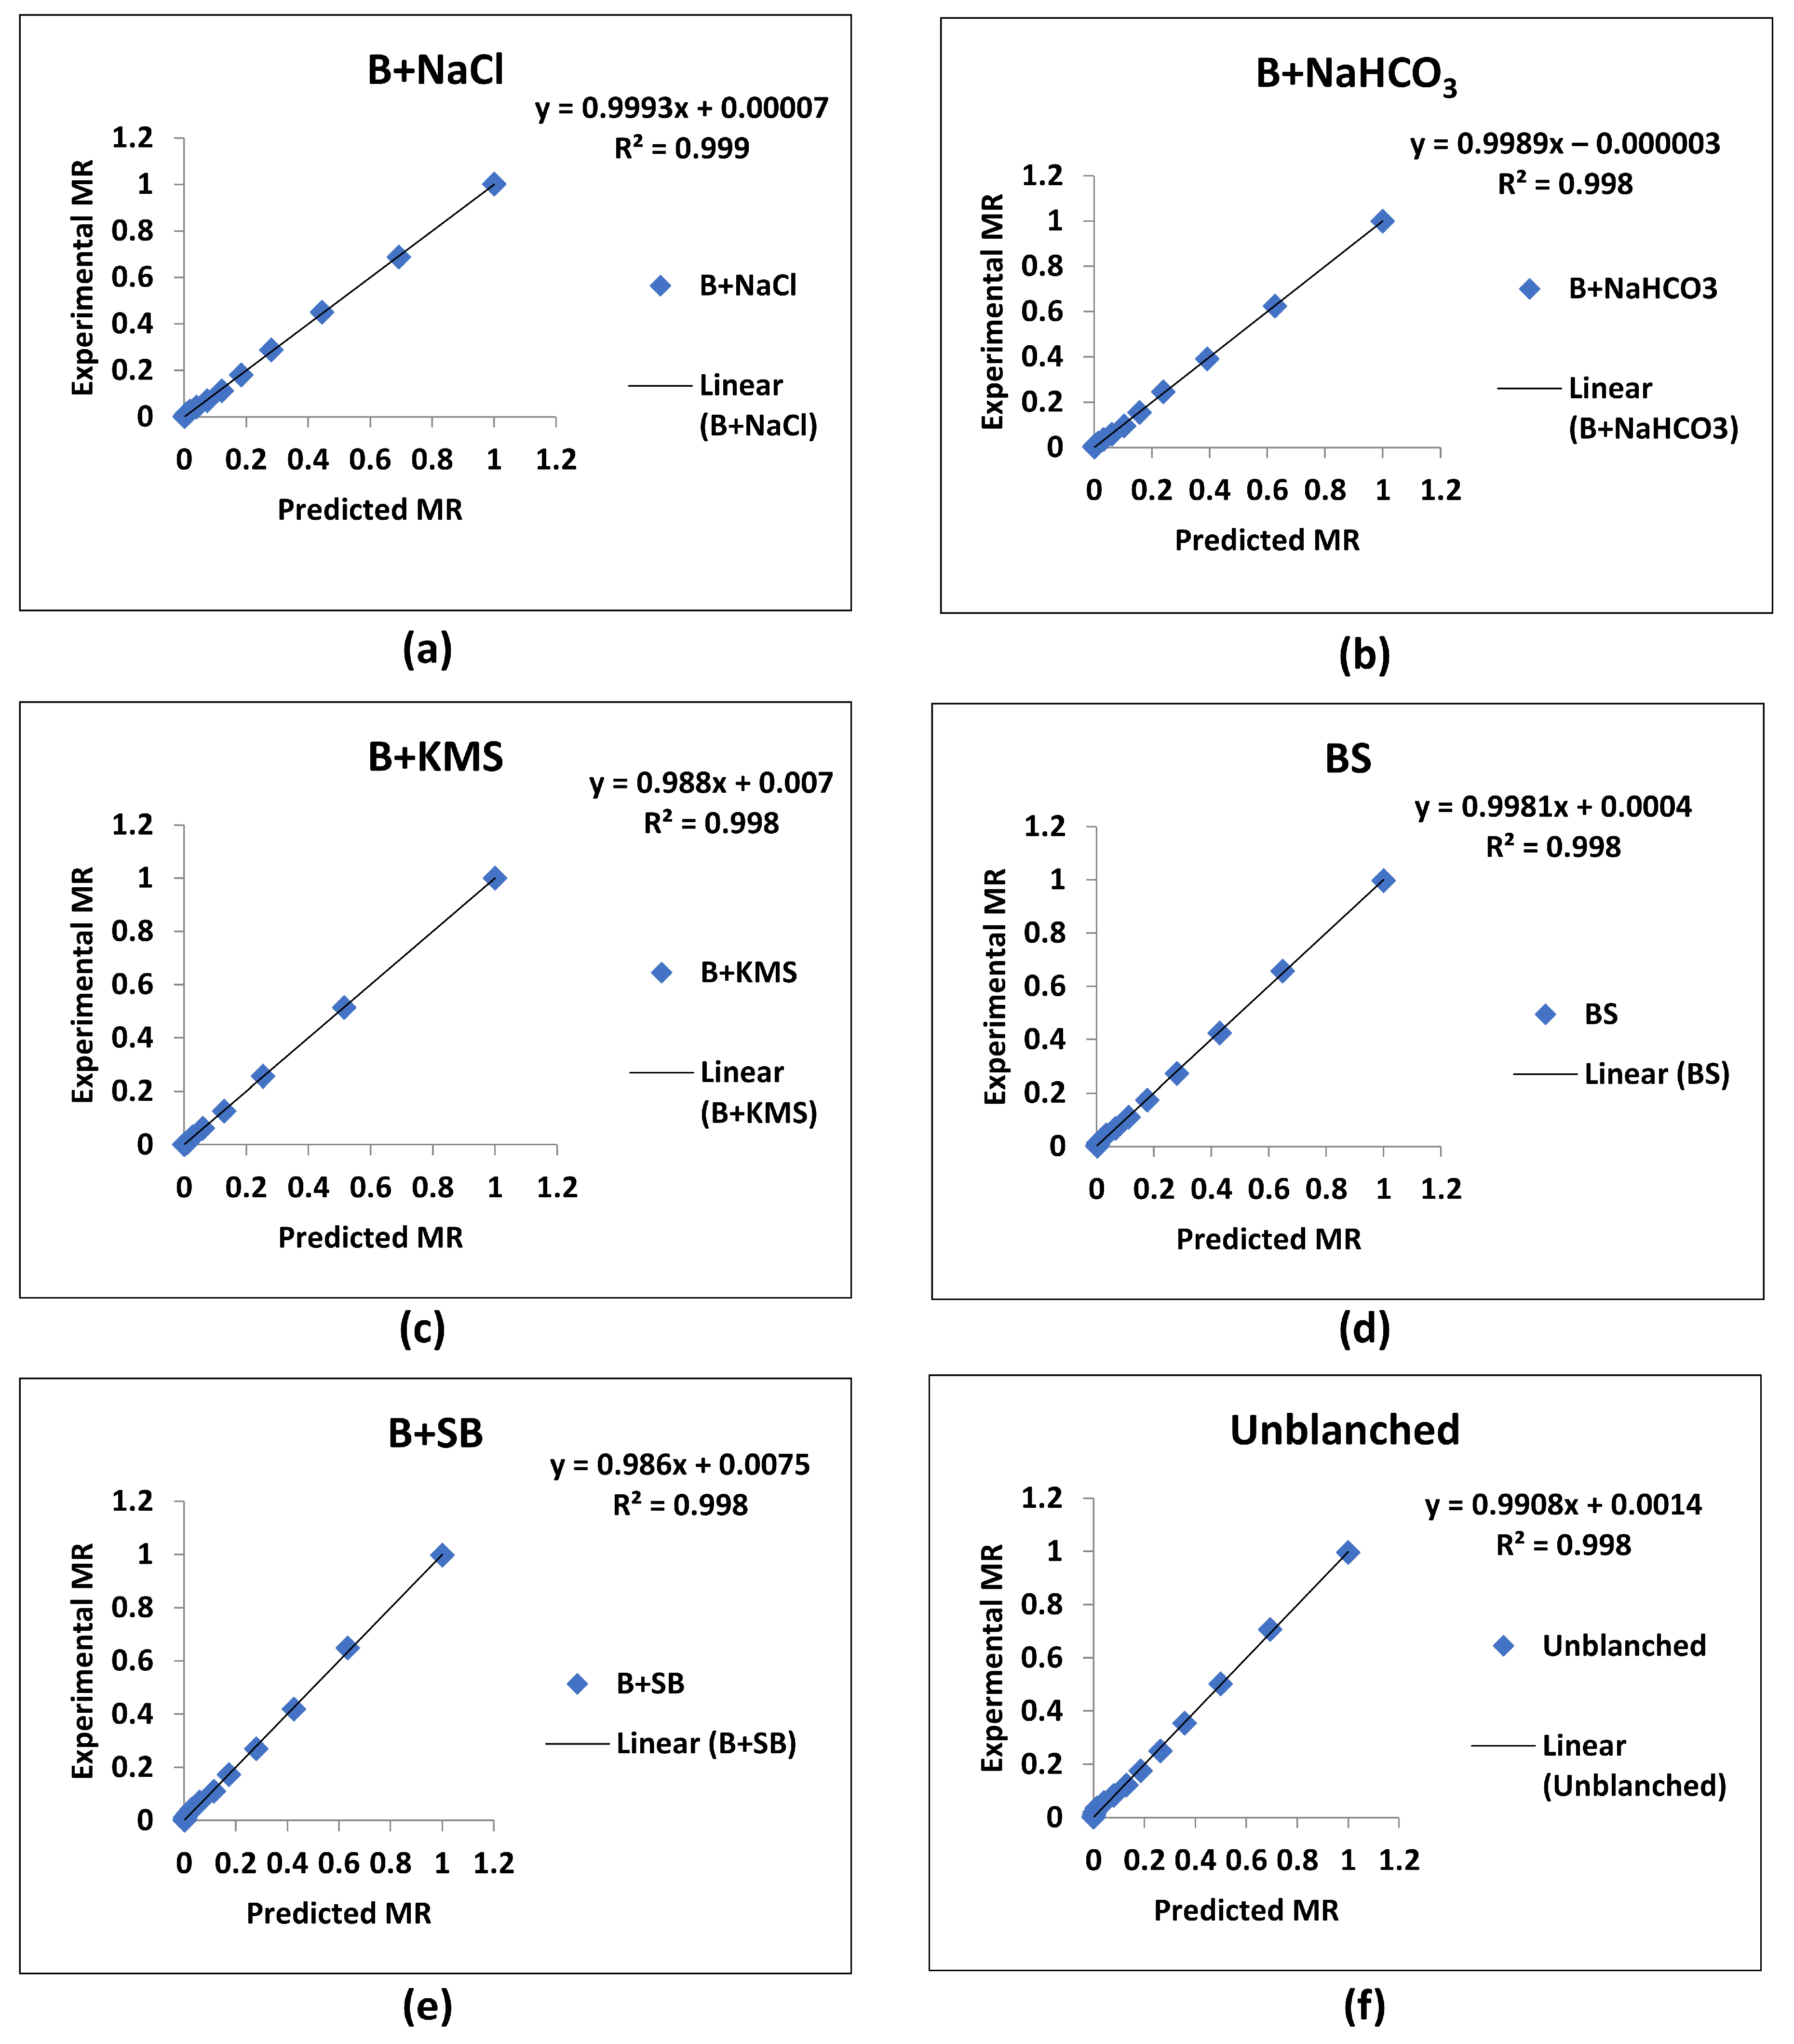
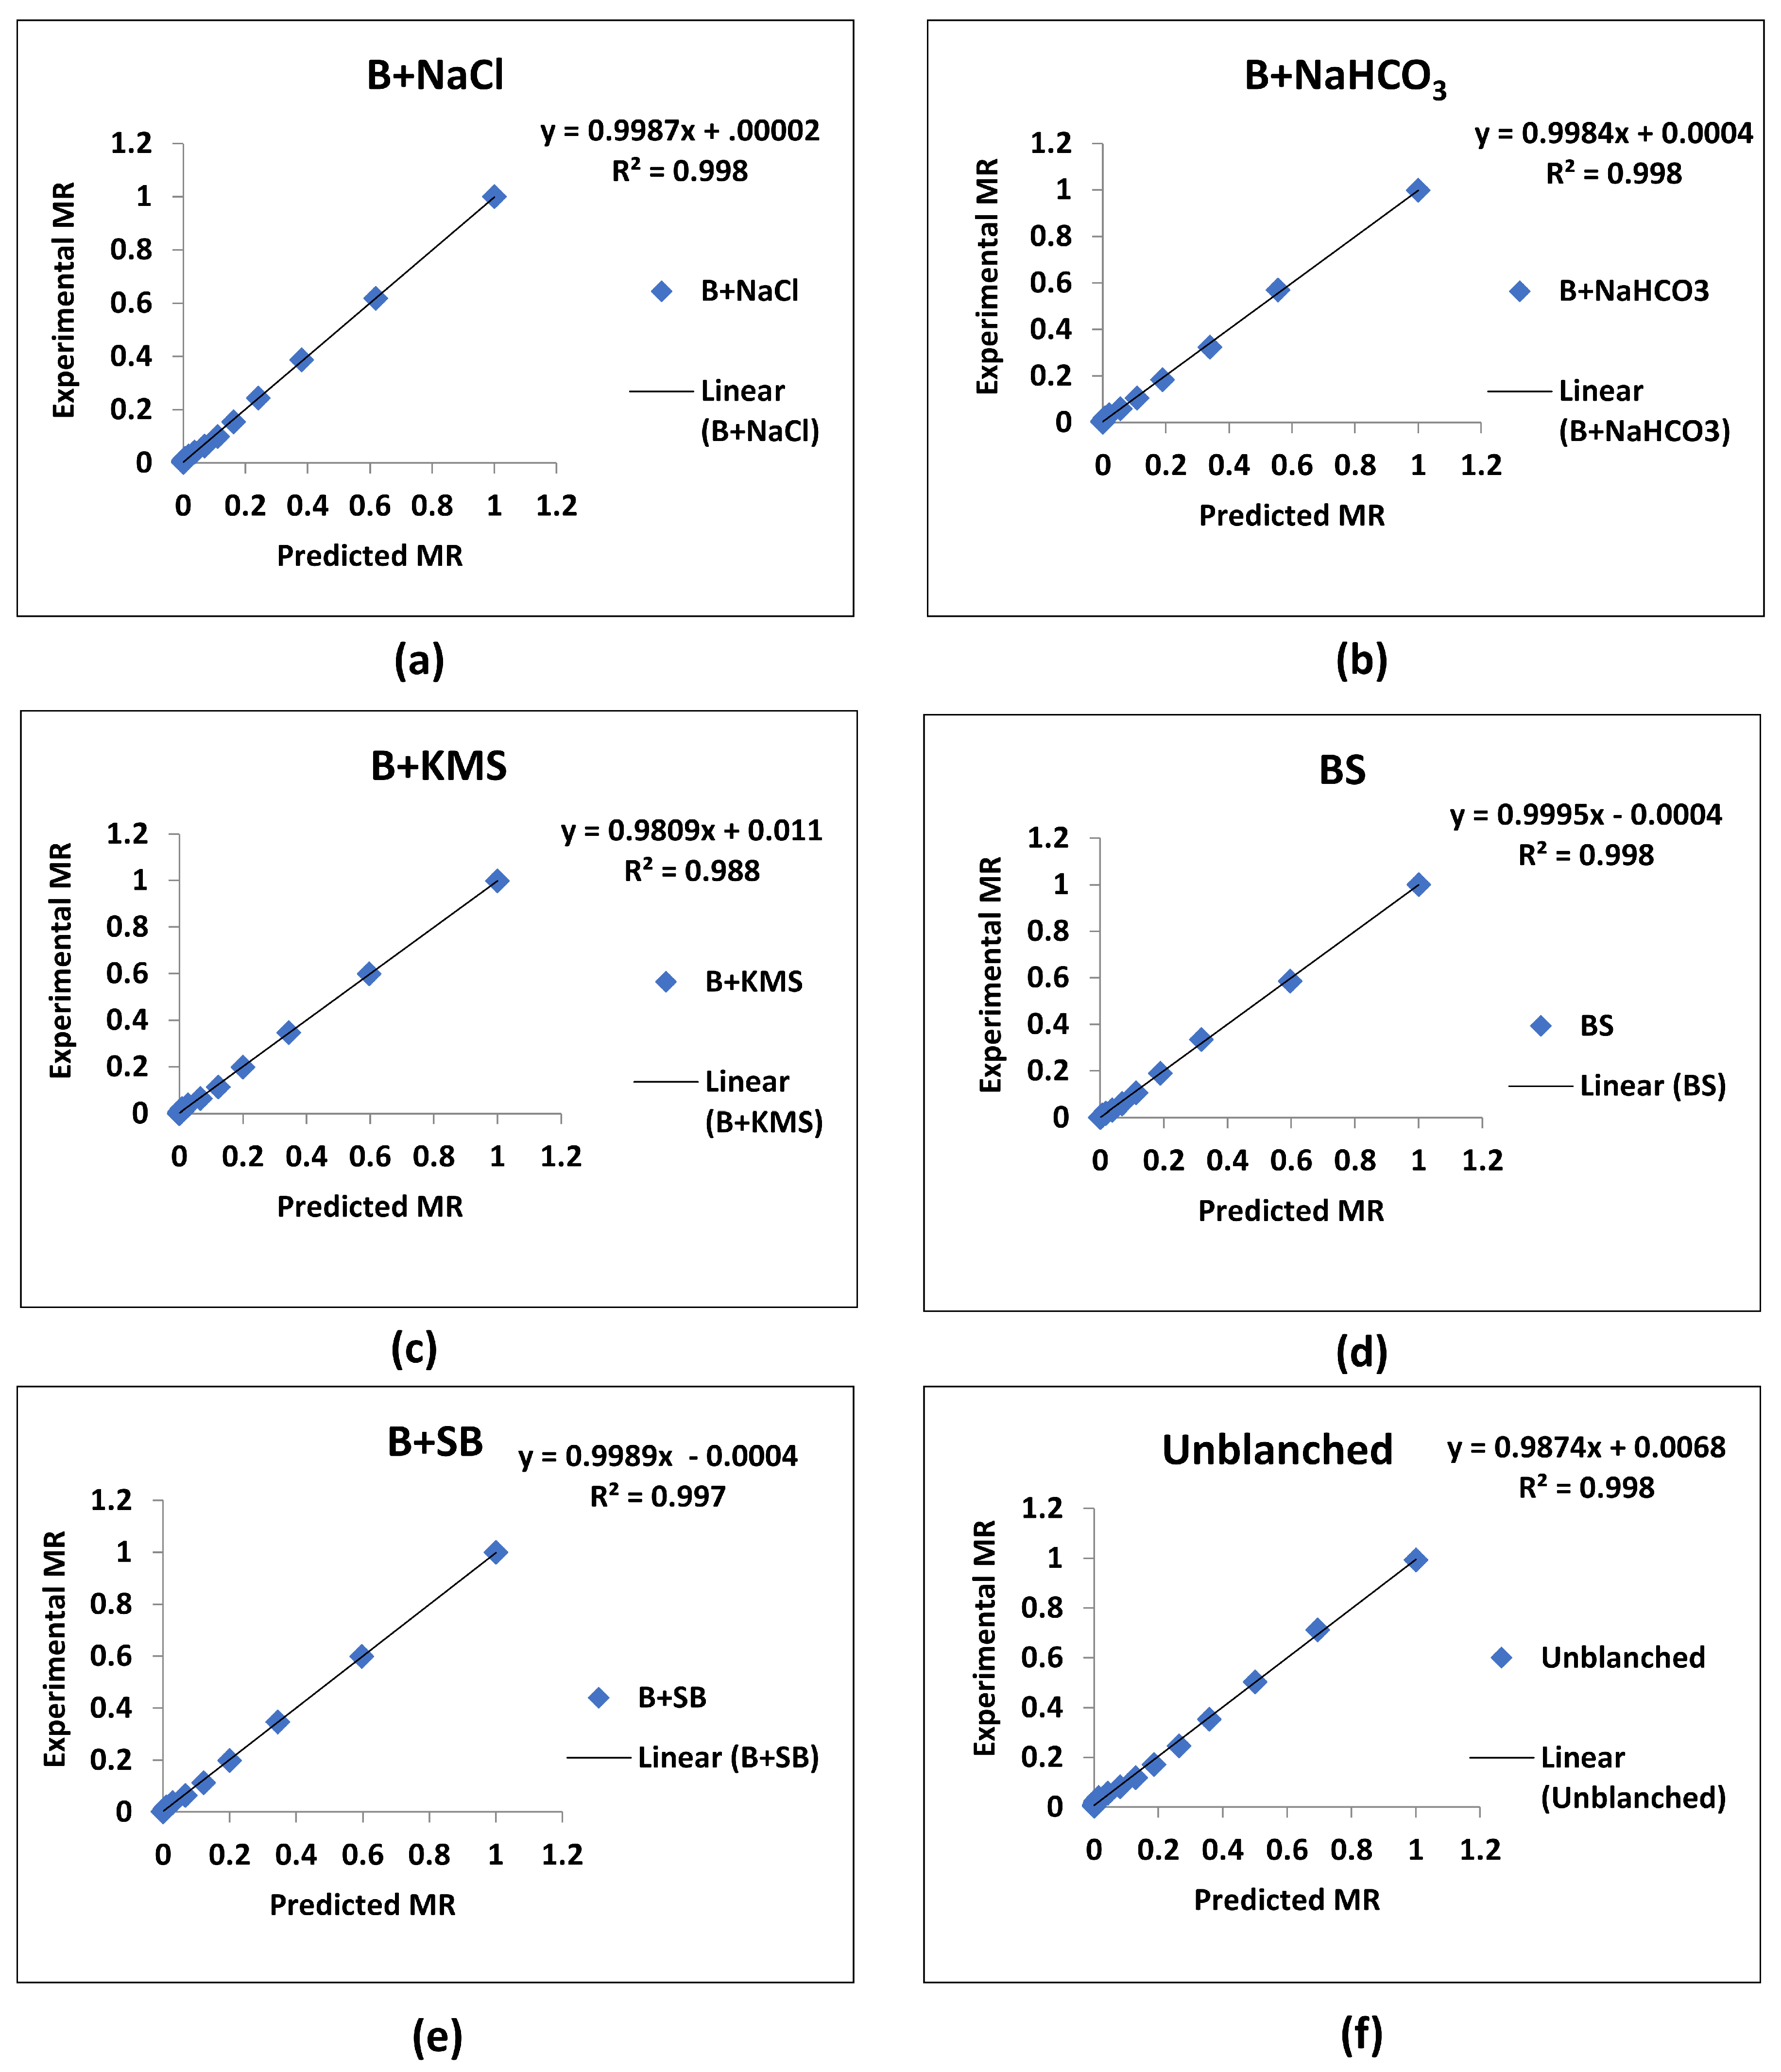
3.3. Mathematical Models for Fitting of Drying Curve

The moisture ratios of pretreated and unblanched Moringa leaves obtained during fluidized bed drying at 50, 60, and 70 °C air temperature at different time intervals were fitted into various drying models (Table 1) to obtain the predicted MR. In all of the models, the value of each parameter was obtained using nonlinear regression. Data pertaining to estimated parameters, namely drying constants and coefficients, and statistical analysis of models examined for pretreatments and drying temperatures are presented in Table 2, Table 3 and Table 4. The quality of fitted models was evaluated by using statistical parameters, i.e., R2, reduced χ2, and RMSE. The model with the highest R2 and lowest χ2 and RMSE was rated as the best in order to characterize the thin layer drying of Moringa leaves. Among all of the tested models, the Midilli–Kucuk model was the most suitable, with the highest R2 and lowest reduced χ2 and RMSE, followed by the Logarithmic and Page models.
Based on the various observations recorded, it was found that the Midilli–Kucuk, Logarithmic, Page, Henderson and Pabis, Newton, and Verma et al. models fit well to the experimental data of pretreated and untreated Moringa leaves dried in a fluidized bed dryer at 50, 60 and 70 °C, with R2 values in the range of 0.995–0.999, 0.994–0.999 and 0.995–0.999, respectively (Table 2 and Table 3), indicating the fitness of the models to predict the data. Results further showed that corresponding R2 values were 0.931–0.984, 0.948–0.973 and 0.952–0.971 for Wang and Singh, whereas these values for Magee et al. model ranged from 0.858–0.957, 0.887–0.946 and 0.881–0.941, respectively (Table 4). The results presented in Table 2, Table 3 and Table 4 for statistical parameters exhibited that values of R2, reduced χ2 and RMSE ranged from 0.727 to 0.999, 0.00006 to 0.1075 and 0.0001 to 0.3212 at 50 °C; 0.793 to 0.999, 00006 to 0.087 and 0.0076 to 0.288 at 60 °C, and 0.760 to 0.999, 0.00003 to 0.0956, 0.0059 to 0.3030, at 70°C, respectively. It was further revealed that the Midilli–Kucuk model was the best in order to explain the drying kinetics of Moringa leaves at all pretreatments and drying temperatures with R2, reduced χ2, and RMSE values in the range of 0.9945 to 0.9997, 0.00003 to 0.00054, and 0.0059 to 0.0227, respectively. Many researchers also observed the Midilli–Kucuk to be the best fit thin layer model to describe the drying behavior of bay leaves [67], coriander leaves and stem [27], Citrus auranticum leaves [68], savory and basil leaves [69], and other food commodities [14,70] for all drying conditions. The results presented in Figure 3a–f, Figure 4a–f and Figure 5a–f compare the experimental MR with predicted MR fitted from the Midilli–Kucuk model for pretreated Moringa leaves dried at 50, 60, and 70 °C drying temperatures. The results revealed outstanding concurrence between experimental MR and predicted MR values, which were strongly banded around 45 °C straight lines indicating the model’s suitability in elucidating the drying behavior of Moringa leaves. The experimental MR was satisfactorily compared with theoretical MR. The similarity was revealed from the high value (close to 1) of the coefficient of multiple determinations achieved at different drying times. The coefficient of determination and results of statistical analysis are given in Table 2, Table 3 and Table 4. The R2 values for the mathematical models were mostly greater than 0.9, except for the two-term exponential model with R2 values in the range of 0.727–0.898, 0.793–0.856, and 0.760–846 at 50, 60, and 70 °C, respectively. These results showed that the values of ‘k’ and ‘a’ increased with increase in drying temperature. This result can be explained by the effect of temperature on diffusivity and heat transfer during drying. The increase in temperature may accelerate the water movement via the diffusion mechanism inside the product and water uptake by the surrounding air. Unblanched samples showed maximum resistance to moisture removal as compared to the pretreated samples [71]. It was determined that the drying rate constant (k) value increased with an increase in drying temperature. This implies that with increased temperature, the drying curve became steeper, indicating an increased rate of drying. The drying curve showed a steeper slope at the higher temperature, thus exhibiting an increased drying rate.

3.4. Effective Moisture Diffusivity

The drying process for agricultural commodities is regulated by moisture diffusion. The moisture from the core of the food commodity must diffuse towards the surface prior to the start of the evaporation process. The findings showed that the internal mass transfer rate regulates drying time, which indicates the prevalence of a falling rate drying cycle. Fick’s diffusion equation was used to clarify the experimental results and to determine effective diffusivity (Deff). Equation (9) expresses the determination of effective moisture diffusivity using the slope approach. The data illustrated in Figure 6a–c showed that pretreated samples of Moringa leaves had higher Deff values as compared to unblanched samples at all three drying temperatures, namely 50, 60, and 70 °C. The pretreatments most likely influenced internal mass transfer during drying. The data on Deff measurements during the drying of Moringa leaves at various temperatures with and without blanching treatments are presented in Table 5. The results showed that the analytical solution to Fick’s diffusion equation for a flat slab suitably described the drying process of pretreated and unblanched Moringa leaves at all drying temperatures (i.e., 50, 60 and 70 °C) with R2 greater than 90%.
The results presented in Table 5 indicated that the range of Deff for all of the pretreated leaf samples under fluidized bed drying was more than that for unblanched leaves. This was mainly due to microstructural changes on the external surfaces of the leaves owing to blanching, thereby leading to enhanced moisture loss that caused a remarkable increase in Deff. Among the various pretreatments, B+KMS had the highest Deff (3.39 × 10⁻⁹ m2 s−1, 3.48 × 10⁻⁹ m2 s−1 and 3.59 × 10⁻⁹ m2 s−1) at 50, 60, and 70 °C drying temperatures, respectively. The higher drying rate in B+KMS, as explained earlier, resulted in the highest effective moisture diffusivity. The Deff at 50 °C varied from 2.92 × 10⁻⁹ to 3.39 × 10⁻⁹ m2 s−1, whereas it ranged from 2.96 × 10⁻⁹ to 3.48 × 10⁻⁹ m2 s−1 at 60 °C and 3.04 × 10⁻⁹ to 3.59 × 10⁻⁹ m2 s−1 at the 70 °C drying temperature under various pretreatments. The results revealed that Deff increased with increasing drying temperatures. This may be attributed to the fact that an increase in temperature strongly activates water molecules and accelerates their transport to the surface of the matrix [72,73].
Moreover, the higher values for moisture diffusivity with higher temperature were mainly due to the increase in the air heat supply rate to the product and the accelerated movement of water inside the Moringa leaves, which ultimately increased the drying rate. The increase in temperature increased the average energy for the transitional, rotational, and vibrational motion of vapor, resulting in a higher moisture gradient and increased mass transfer rate, hence increasing moisture diffusivity [74]. The Deff values in the present study were in the standard range for food commodities [75]. The results are in line with those reported by Premi et al. [76] in Moringa leaves under cabinet drying, Nourhene et al. [77] in olive leaves and Doymaz [61] in grape leaves. It was further discovered by Doymaz [78] that Deff varied between 1.70 × 10⁻¹⁰ m2 s−1 and 7.12 × 10⁻¹⁰ m2 s−1, with higher values in pretreated samples compared to unblanched ones. Another study indicated that effective moisture diffusivity (Deff) increased significantly with increasing temperature and air velocity [79].
The findings of the present investigation are in agreement with results for other crop products [80,81]. The Deff values for alfalfa stem are in the range of 10−8 to 10−12 m2 s−1 with and without blanching [82]. As illustrated in Figure 6a–c, the moisture diffusivity was estimated by plotting a graph of ln(MR) against time.

3.5. Activation Energy

The effect of temperature on the diffusivity was expressed through the Arrhenius equation as given by Equation (12). The activation energy (Ea), an indicator of temperature sensitivity, is the amount of energy required by a molecule to begin the internal moisture diffusion process. In the present study, among various pretreatments, the B+KMS treatment yielded the lowest activation energy values of 13.67, 13.81 and 13.95 KJ/mol at 50, 60, and 70 °C drying temperatures, respectively, whereas unblanched samples had the highest values of activation energy, corresponding to 13.85, 13.98 and 14.11 KJ/mol (Table 5), respectively. The data further indicated that drying different pretreated samples of Moringa leaves in the FBD at 50 °C required less activation energy (13.67–13.85 KJ/mol) as compared to 13.81–13.98 KJ/mol at 60 °C and 13.95–14.11 KJ/mol at 70 °C. The results of this study are in agreement with the research outcomes of Zheng et al. [83], who observed a considerable increase in Ea and Deff with increasing temperature. The activation energies of dried Moringa leaves were 12.50 and 32.74 kJ/mol with air velocity of 0.5 and 1.3 m s−1 respectively, under convective drying at 50–80 °C [33]. Reported activation energy values were 43.92 kJ/mol for parsley leaves and 35.05 kJ/mol for dill leaves [60]. Activation energy ranged between 12.7 and 110 kJ/mol for various food ingredients [82]. Investigation of temperature influence on Deff indicated that a straight line was produced according to Equation (9).

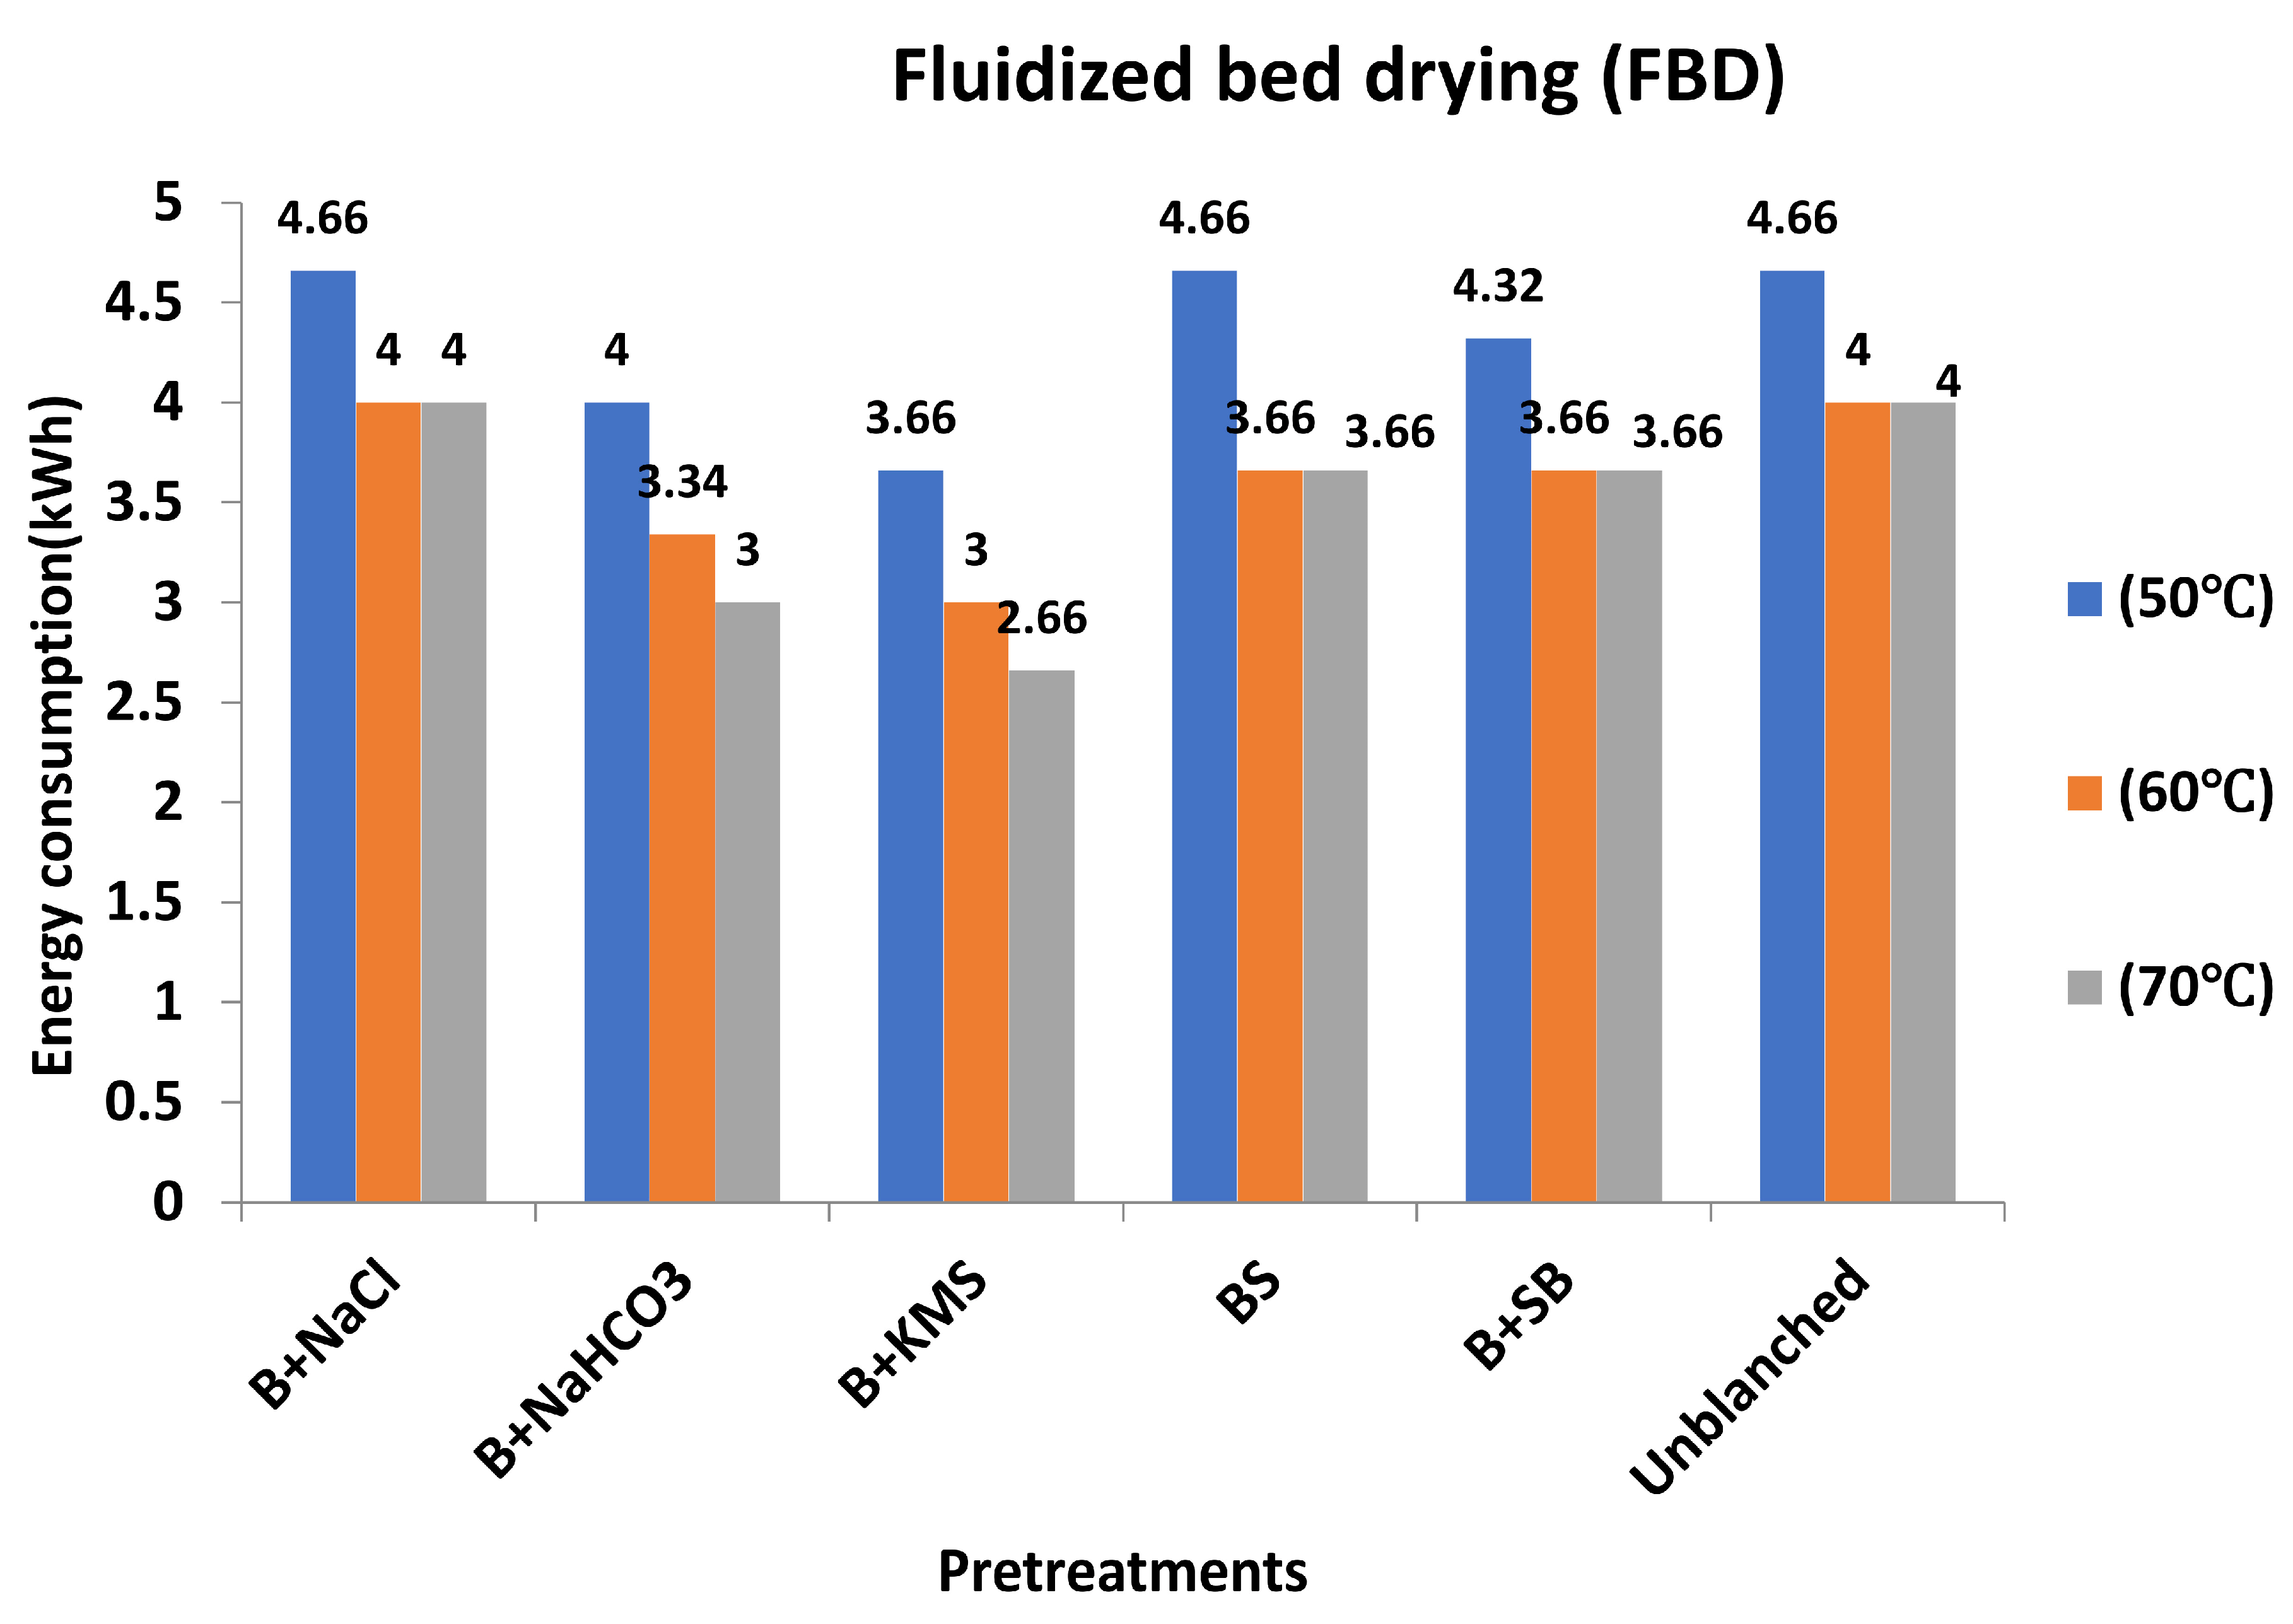
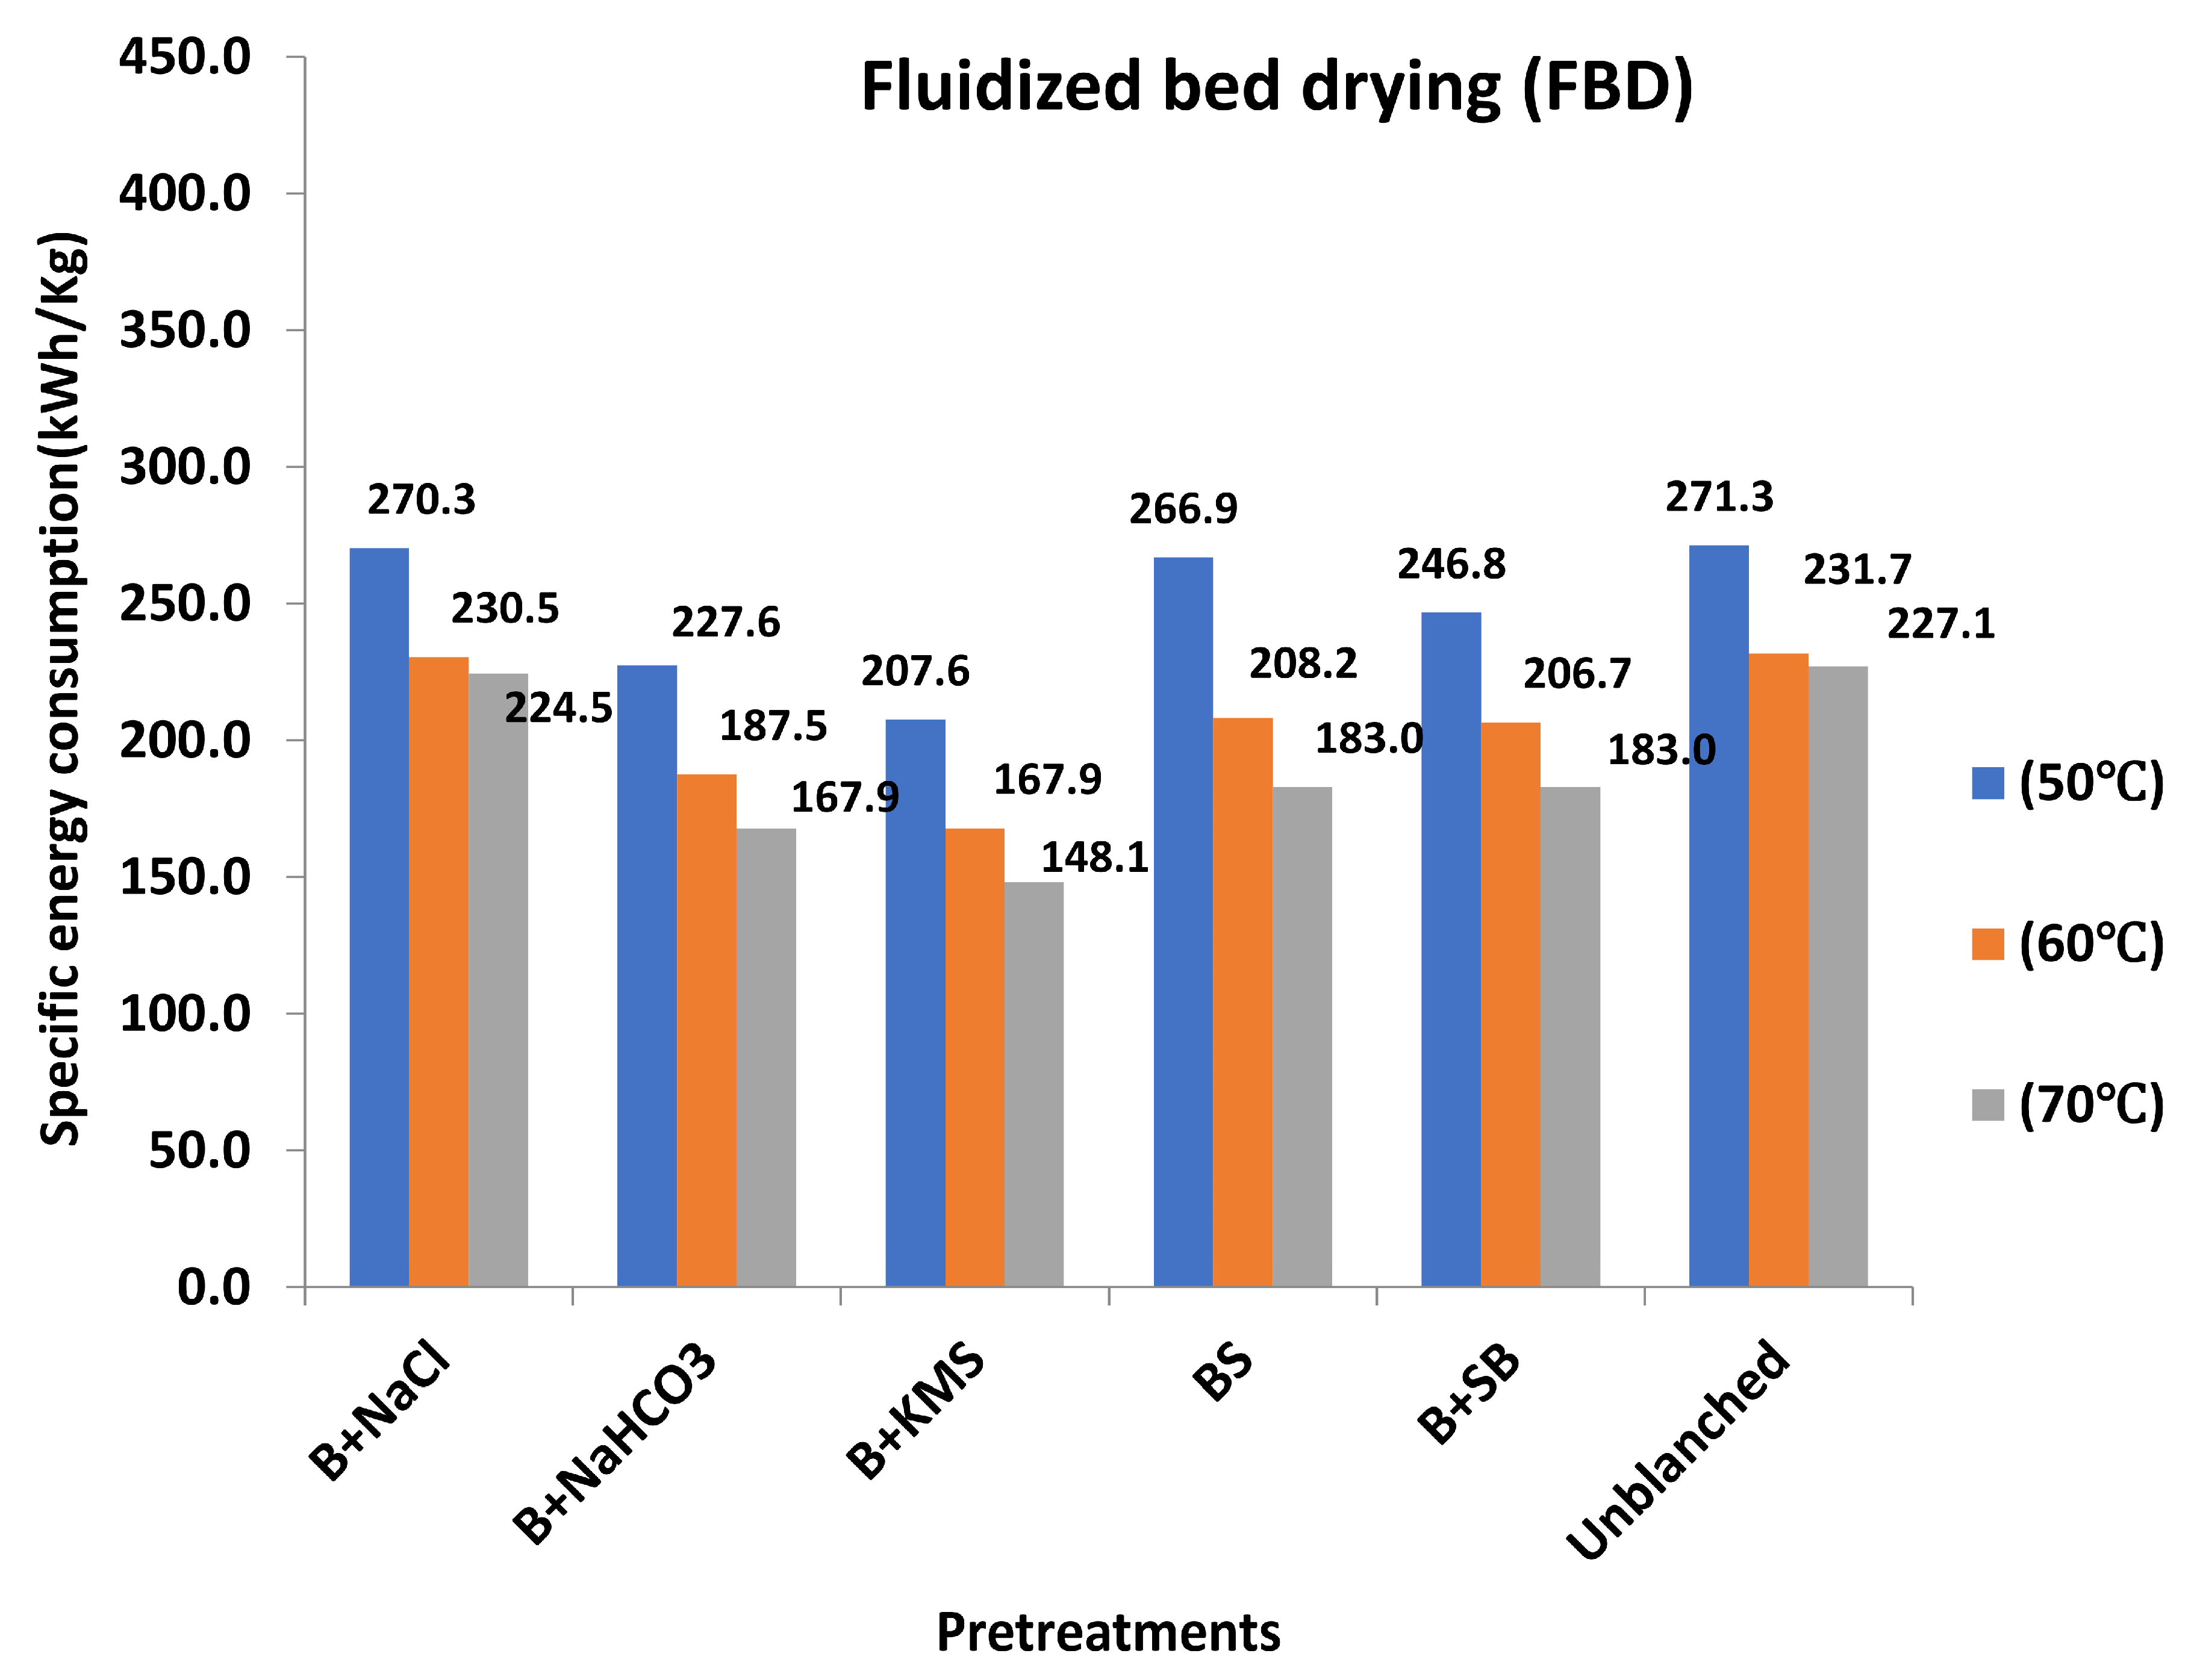
3.6. Energy Consumption and Specific Energy Consumption

Energy consumption for the drying of drumstick leaves in FBD under various pretreatments ranged from 4 to 4.66 kWh, 3 to 4 kWh and 2.66 to 4 kWh at 50 °C, 60 °C, and 70 °C drying temperatures, respectively (Figure 7 and Figure 8). This indicated that more energy will be required at lower drying temperatures, as the drying period is prolonged. In FBD, the unblanched sample required about 140, 120 and 120 min to dry and consumed 4.66, 4 and 4 kWh of energy in the process at 50 °C, 60 °C and 70 °C, respectively. In contrast, the blanched sample required 140, 110 and 110 min to dry and consumed about 4.66, 3.66 and 3.66 kWh of energy during the drying process at 50, 60 and 70 °C. On the other hand, among the pretreated Moringa leaf samples, the minimum drying times (110, 90 and 80 min) and energy consumed (3.66, 3 and 2.66 kWh) were achieved with the B+KMS treatment at 50 °C, 60 °C, and 70 °C, respectively, as compared to other pretreatments. The specific energy consumption (kWh/kg) ranged from 207.6 to 271.3 kWh/kg, 167.9 to 231.7 kWh/kg and 148.1 to 227.1 kWh/kg at 50 °C, 60 °C, and 70 °C drying temperatures, respectively, in various pretreatments. This indicated that the specific energy requirement is higher with lower drying temperature because of the longer drying period. Among the various pretreatments, the specific energy consumption was lowest with the B+KMS treatment (148.1 to 207.6 kWh/kg), closely followed by B+NaHCO3 (167.9 to 227.6 kWh/kg), and the highest consumption was recorded with unblanched leaves (227.1 to 271.3 kWh/kg) when Moringa leaves were dried at 50–70 °C. The lower energy values presented in parentheses were obtained with the higher drying temperature (70 °C), and higher values were achieved under lower temperature (50 °C). Krishna Murthy et al. [71] also reported that blanching reduced drying time by relaxing tissue structure and yielded good quality dried products, which reflected the reduced energy requirement for dehydration.

4. Conclusions

Investigations were carried out to examine the drying behavior of pretreated and unblanched Moringa leaves dried in a fluidized bed dryer (FBD) at different temperatures. Based on regression analysis results, it was concluded that among nine thin layer drying models, the Midilli–Kucuk model was most suitable to describe the drying behavior of pretreated and unblanched Moringa leaves at temperatures ranging from 50 to 70 °C. The pretreated samples had higher effective moisture diffusivity (Deff) values than the unblanched samples at all drying temperatures. However, the unblanched samples required more activation energy at all drying temperatures as compared to the pretreated samples. The specific energy consumption (SEC) decreased with increases in drying temperature from 50 to 70 °C. Furthermore, pretreated Moringa leaves required less specific energy consumption than unblanched leaves.
To identify the best drying process with high energy efficiency, information pertaining to energy consumption is vital and will be quite valuable for the food industry to manage drying techniques and thus effectively avoid the misuse of energy. For proper dryer design, knowledge about the characteristics of the material to be dried and its drying kinetics is required. Hence, design engineers may choose process parameters, pretreatment methods, and suitable kinetic model equations in order to design suitable drying equipment and drying chambers. The major advantage of these drying kinetic models is associated with the savings in cost and time that would otherwise have been required for expensive experimentation and pilot plant construction for the production and analysis of drying systems. In addition, they can be used to create highly efficient drying systems for the food industry. Furthermore, the best model can accurately compute the moisture content of leaves at any point during the drying process under various conditions.

Author Contributions

Conceptualization, S.A., A.S. and R.K.S.; methodology, S.A. and A.S.; validation, S.A. and A.S.; formal analysis, S.A.; investigation, S.A.; data curation, S.A.; writing—original draft preparation, S.A. and A.S.; writing—review and editing, S.A. and A.S.; visualization, S.A.; supervision, A.S. and R.K.S.; project administration, A.S.; funding acquisition, A.S. All authors have read and agreed to the published version of the manuscript.

Funding

This work was financially supported by Guru Jambheshwar University of Science and Technology, Hisar, and the Technical Education Quality Improvement Programme (TEQIP-3) of the Ministry of Human Resource Development (MHRD), Government of India.

Data Availability Statement

Data are contained within the article.

Acknowledgments

This paper was supported by the KU research professor program of Konkuk University, Seoul, Korea.

Conflicts of Interest

The authors declare no conflict of interest.

References

  1. Global Moringa Products Market. Available online: https://market.us/report/moringa-products-market (accessed on 3 November 2022).
  2. Moringa Ingredients Market. Available online: https://www.gminsights.com/industry-analysis/moringa-ingredients-market (accessed on 3 November 2022).
  3. Rebecca, H.S.U.; Sharon, M.; Arbainsyah, A.; Lucienne, D. Moringa oleifera: Medicinal and socio-economic uses. In International Course on Economic Botany; National Herbarium Leiden: Leiden, The Netherlands, 2006; pp. 2–6. [Google Scholar]
  4. El-Massry, F.H.; Mossa, M.E.; Youssef, S.M. Moringa oleifera Plant. Egypt J. Agric. Res. 2013, 91, 1597–1909. [Google Scholar]
  5. Rani, E.A.; Arumugam, T. Moringa oleifera (Lam)—A nutritional powerhouse. J. Crop Weed 2017, 13, 238–246. [Google Scholar]
  6. Oyeyinka, A.T.; Oyeyinka, S.A. Moringa oleifera as a food fortificant: Recent trends and prospects. J. Saudi Soc. Agric. Sci. 2018, 17, 127–136. [Google Scholar] [CrossRef] [Green Version]
  7. Lako, J.; Trenerry, V.C.; Wahlqvist, M.; Wattanapenpaiboon, N.; Sotheeswaran, S.; Premier, R. Phytochemical flavonols, carotenoids and the antioxidant properties of a wide selection of Fijian fruit, vegetables and other readily available foods. Food Chem. 2007, 101, 1727–1741. [Google Scholar] [CrossRef]
  8. Bennett, R.N.; Mellon, F.A.; Foidl, N.; Pratt, J.H.; Dupont, M.S.; Perkins, L.; Kroon, P.A. Profiling glucosinolates and phenolics in vegetative and reproductive tissues of the multi-purpose trees Moringa oleifera L. (horseradish tree) and Moringa stenopetala L. J. Agric. Food Chem. 2003, 51, 3546–3553. [Google Scholar] [CrossRef] [PubMed]
  9. Olson, M.E.; Sankaran, R.P.; Fahey, J.W.; Grusak, M.A.; Odee, D.; Nouman, W. Leaf protein and mineral concentrations across the “Miracle Tree” genus Moringa. PLoS ONE 2016, 11, e0159782. [Google Scholar] [CrossRef] [Green Version]
  10. Saini, R.K.; Sivanesan, I.; Keum, Y.S. Phytochemicals of Moringa oleifera: A review of their nutritional, therapeutic and industrial significance. 3 Biotech 2016, 6, 203. [Google Scholar] [CrossRef] [PubMed] [Green Version]
  11. Daba, M. Miracle tree: A review on multi-purposes of Moringa oleifera and its implication for climate change mitigation. J. Earth Sci. Clim. Chang. 2016, 7, 366. [Google Scholar] [CrossRef]
  12. Gopalakrishnan, L.; Doriya, K.; Kumar, D.S. Moringaoleifera: A review on nutritive importance and its medicinal application. Food Sci. Hum. Wellness 2016, 5, 49–56. [Google Scholar] [CrossRef] [Green Version]
  13. Bennour, N.; Mighri, H.; Bouhamda, T.; Mabrouk, M.; Apohan, E.; Yesilada, O.; Küçükbay, H.; Akrout, A. Moringaoleifera leaves: Could solvent and extraction method affect phenolic composition and bioactivities? Prep. Biochem. Biotechnol. 2021, 51, 1018–1025. [Google Scholar] [CrossRef]
  14. Zhang, Q.A.; Song, Y.; Wang, X.; Zhao, W.Q.; Fan, X.H. Mathematical modeling of debittered apricot (Prunus armeniaca L.) kernels during thin-layer drying. CyTA-J. Food 2016, 14, 509–517. [Google Scholar] [CrossRef] [Green Version]
  15. Senadeera, W.; Adiletta, G.; Önal, B.; Di Matteo, M.; Russo, P. Influence of different hot air drying temperatures on drying kinetics, shrinkage, and colour of persimmon slices. Foods 2020, 9, 101. [Google Scholar] [CrossRef] [PubMed]
  16. Çelen, S.; Haksever, A.; Moralar, A. The effects of microwave energy to the drying of apple (Gala) slices. Karaelmas Sci. Eng. J. 2017, 7, 228–236. [Google Scholar]
  17. Kumar, C.; Karim, M.A.; Joardder, M.U. Intermittent drying of food products: A critical review. J. Food Eng. 2014, 121, 48–57. [Google Scholar] [CrossRef] [Green Version]
  18. Özbey, M.; Söylemez, M.S. Effect of swirling flow on fluidized bed drying of wheat grains. Energy Convers. Manag. 2005, 46, 1495–1512. [Google Scholar] [CrossRef]
  19. Akpinar, E.K. Determination of suitable thin layer drying curve model for some vegetables and fruits. J. Food Eng. 2006, 73, 75–84. [Google Scholar] [CrossRef]
  20. Onwude, D.I.; Hashim, N.; Janius, R.B.; Nawi, N.M.; Abdan, K. Modeling the thin-layer drying of fruits and vegetables: A review. Compr. Rev. Food Sci. Food Saf. 2016, 15, 599–618. [Google Scholar] [CrossRef] [PubMed] [Green Version]
  21. Abano, E.E.; Haile, M.A.; Owusu, J.; Engmann, F.N. Microwave-vacuum drying effect on drying kinetics, lycopene and ascorbic acid content of tomato slices. J. Stored Prod. Postharvest Res. 2013, 4, 11–22. [Google Scholar] [CrossRef] [Green Version]
  22. Abbasi, S.; Azari, S. Novel microwave–freeze drying of onion slices. Int. J. Food Sci. Technol. 2009, 44, 974–979. [Google Scholar] [CrossRef]
  23. Aghbashlo, M.; Kianmehr, M.H.; Khani, S.; Ghasemi, M. Mathematical modelling of thin-layer drying of carrot. Int. Agrophys. 2009, 23, 313–317. [Google Scholar]
  24. Akbulut, A.; Durmuş, A. Thin layer solar drying and mathematical modeling of mulberry. Int. J. Energy Res. 2009, 33, 687–695. [Google Scholar] [CrossRef]
  25. Khazae, J.; Daneshmandi, S. Modeling of thin-layer drying kinetics of sesame seeds: Mathematical and neural networks modeling. Int. Agrophys. 2007, 21, 335–348. [Google Scholar]
  26. Henderson, S.M.; Pabis, S. Grain drying theory. I. Temperature effect on drying coefficients. J. Agric. Eng. Res. 1961, 6, 169–174. [Google Scholar]
  27. Silva, A.S.; Almeida, F.D.A.; Lima, E.E.; Silva, F.L.H.; Gomes, J.P. Drying kinetics of coriander (Coriandrum sativum) leaf and stem cinéticas de secado de hoja y tallo de cilantro (Coriandrum sativum). CYTA-J. Food 2008, 6, 13–19. [Google Scholar] [CrossRef]
  28. Rayaguru, K.; Routray, W. Mathematical modeling of thin layer drying kinetics of stone apple slices. Int. Food Res. J. 2012, 19, 1503–1510. [Google Scholar]
  29. Jha, A.K.; Sit, N. Drying characteristics and kinetics of colour change and degradation of phytocomponents and antioxidant activity during convective drying of deseeded Terminalia chebula fruit. J. Food Meas. Charact. 2020, 14, 2067–2077. [Google Scholar] [CrossRef]
  30. Batu, H.S.; Kadakal, Ç. Drying characteristics and degradation kinetics in some parameters of goji berry (Lyciumbarbarum L.) fruit during hot air drying. Ital. J. Food Sci. 2021, 33, 16–28. [Google Scholar] [CrossRef]
  31. Tummanichanont, C.; Phoungchandang, S.; Srzednicki, G. Effects of pretreatment and drying methods on drying characteristics and quality attributes of Andrographis paniculata. J. Food Process. Preserv. 2017, 41, e13310. [Google Scholar] [CrossRef]
  32. Mouhoubi, D.; Djenidi, R.; Bounechada, M. Contribution to the study of diversity, distribution, and abundance of insect fauna in salt wetlands of Setif region, Algeria. Int. J. Zool. 2019, 2013, 2128418. [Google Scholar] [CrossRef]
  33. Premi, M.; Sharma, H.K.; Sarkar, B.C.; Singh, C. Kinetics of drumstick leaves (Moringa oleifera) during convective drying. Afr. J. Plant Sci. 2010, 4, 391–400. [Google Scholar]
  34. Olalusi, A.P.; Odiase, G.E. Modeling drying characteristics of Moringa (Moringa oleifera) leaves under a mechanical convective cabinet dryer. Ann. Food Sci. Technol. 2015, 16, 27–36. [Google Scholar]
  35. Potisate, Y.; Phoungchandang, S. Microwave drying of Moringa oleifera (Lam.) leaves: Drying characteristics and quality aspects. Asia-Pac. J. Sci. Technol. 2015, 20, 12–25. [Google Scholar]
  36. Shobhit; Sharma, A.; Kajla, P.; Punia, S.; Lorenzo, J.M. Drying kinetics of pretreated drumstick (Moringa oleifera) leaves during lyophillization. Food Anal. Methods 2022, 15, 3334–3345. [Google Scholar] [CrossRef]
  37. Kannan, K.; Thahaaseen, A. Process optimization for drying of drumstick leaves. Indian J. Sci. 2016, 23, 275–288. [Google Scholar]
  38. AOAC. Official Methods of Analysis, 19th ed.; Association of Official Analytical Chemist: Washington, DC, USA, 2012. [Google Scholar]
  39. Midilli, A.; Kucuk, H. Mathematical modeling of thin layer drying of pistachio by using solar energy. Energy Convers. Manag. 2003, 44, 1111–1122. [Google Scholar] [CrossRef]
  40. Wang, Z.; Sun, J.; Liao, X.; Chen, F.; Zhao, G.; Wu, J.; Hu, X. Mathematical modeling on hot air drying of thin layer apple pomace. Food Res. Int. 2007, 40, 39–46. [Google Scholar] [CrossRef]
  41. Lewis, W.K. The rate of drying of solid materials. Ind. Eng. Chem. Res. 1921, 13, 427–432. [Google Scholar] [CrossRef]
  42. Page, G.E. Factors Influencing the Maximum Rates of Air Drying Shelled Corn in Thin Layers. Master’s Thesis, Purdue University, West Lafayette, IN, USA, 1949. [Google Scholar]
  43. Wang, C.Y.; Singh, R.P. Use of variable equilibrium moisture content in modeling rice drying. Trans. ASAE 1978, 11, 668–672. [Google Scholar]
  44. Chandra, P.K.; Singh, R.P. Applied Numerical Methods for Food and Agricultural Engineers; CRC Press: Boca Raton, FL, USA, 1995; pp. 163–167. [Google Scholar]
  45. Sharaf-Eldeen, Y.; Blaisdell, J.; Hamdy, M. A Model for ear corn drying. Trans. ASAE 1980, 23, 1261–1265. [Google Scholar] [CrossRef]
  46. Verma, L.R.; Bucklin, R.A.; Endan, J.B.; Wratten, F.T. Effects of drying air parameters on rice drying models. Trans. ASAE 1985, 28, 296–301. [Google Scholar] [CrossRef]
  47. Magee, T.R.A.; Hassaballah, A.A.; Murphy, W.R. Internal mass transfer during osmotic dehydration of apple slices in sugar solutions. Irish J. Food Sci. Technol. 1983, 7, 147–155. [Google Scholar]
  48. Midilli, A.; Kucuk, H.; Yapar, Z. A new model for single-layer drying. Dry. Technol. 2002, 20, 1503–1513. [Google Scholar] [CrossRef]
  49. Doymaz, İ.; İsmail, O. Drying characteristics of sweet cherry. Food Bioprod. Process. 2011, 89, 31–38. [Google Scholar] [CrossRef]
  50. Crank, J. The Mathematics of Diffusion; Clarendon Press: Oxford, UK, 1975; p. 414. [Google Scholar]
  51. Garau, M.C.; Simal, S.; Femenia, A.; Rosselló, C. Drying of orange skin: Drying kinetics modelling and functional properties. J. Food Eng. 2006, 75, 288–295. [Google Scholar] [CrossRef]
  52. Sengkhamparn, N.; Chanshotikul, N.; Assawajitpukdee, C.; Khamjae, T. Effects of blanching and drying on fiber rich powder from pitaya (Hylocereusundatus) peel. Int. Food Res. J. 2013, 20, 1595–1600. [Google Scholar]
  53. Deng, L.Z.; Pan, Z.; Mujumdar, A.S.; Zhao, J.H.; Zheng, Z.A.; Gao, Z.J.; Xiao, H.X. High humidity hot air impingement blanching (HHAIB) enhances drying quality of apricots by inactivating the enzymes, reducing drying time and altering cellular structure. Food Contr. 2019, 96, 104–111. [Google Scholar] [CrossRef]
  54. Babu, A.K.; Kumaresan, G.; Raj, V.A.A.; Velraj, R. Review of leaf drying: Mechanism and influencing parameters, drying methods, nutrient preservation, and mathematical models. Renew. Sustain. Energy Rev. 2018, 90, 536–556. [Google Scholar] [CrossRef]
  55. Brar, H.S.; Kaur, P.; Subramanian, J.; Nair, G.R.; Singh, A. Effect of chemical pretreatment on drying kinetics and physio-chemical characteristics of yellow European plums. Int. J. Fruit Sci. 2020, 20, S252–S279. [Google Scholar] [CrossRef]
  56. Kayran, S.; Doymaz, İ. Drying of Cataloglu apricots: The effect of sodium metabisulfite solution on drying kinetics, diffusion coefficient, and color parameters. Int. J. Fruit Sci. 2021, 21, 270–283. [Google Scholar] [CrossRef]
  57. Singh, S.K.; Singh, B.R.; Senger, R.S.; Kumar, P.; Patil, A.K. Drying characteristics and prediction of best fitted drying model for coriander leaves. Environ. Conserv. J. 2021, 22, 243–251. [Google Scholar] [CrossRef]
  58. Zielinska, M.; Markowski, M. Air drying characteristics and moisture diffusivity of carrots. Chem. Eng. Process. 2010, 49, 212–218. [Google Scholar] [CrossRef]
  59. Abbas, K.A.; Saleh, A.M.; Lasekan, O.; Khalil, S.K. A review on factors affecting drying process of pistachio and their impact on product’s quality. J. Agric. Sci. 2010, 2, 3–15. [Google Scholar]
  60. Doymaz, İ.; Tugrul, N.; Pala, M. Drying characteristics of dill and parsley leaves. J. Food Eng. 2006, 77, 559–565. [Google Scholar] [CrossRef]
  61. Doymaz, İ. Air-drying characteristics, effective moisture diffusivity and activation energy of grape leaves. J. Food Process. Preserv. 2012, 36, 161–168. [Google Scholar] [CrossRef]
  62. Wankhade, P.K.; Sapkal, R.S.; Sapkal, V.S. Drying characteristics of okra slices on drying in hot air dryer. Procedia Eng. 2013, 51, 371–374. [Google Scholar] [CrossRef]
  63. Zhao, D.; Zhao, C.; Tao, H.; An, K.; Ding, S.; Wang, Z. The effect of osmosis pretreatment on hot-air drying and microwave drying characteristics of chili (Capsicum annuum L.) flesh. Int. J. Food Sci. Technol. 2013, 48, 1589–1595. [Google Scholar] [CrossRef]
  64. Uribe, E.; Miranda, M.; Vega-Gálvez, A.; Quispe, I.; Clavería, R.; Di Scala, K. Mass transfer modelling during osmotic dehydration of jumbo squid (Dosidicus gigas): Influence of temperature on diffusion coefficients and kinetic parameters. Food Bioproc. Technol. 2011, 4, 320–326. [Google Scholar] [CrossRef]
  65. Sharma, R.; Joshi, V.K.; Kaushal, M. Effect of pretreatments and drying methods on quality attributes of sweet bell-pepper (Capsicum annum) powder. J. Food Sci. Technol. 2015, 52, 3433–3439. [Google Scholar] [CrossRef]
  66. Fijalkowska, A.; Nowacka, M.; Wiktor, A.; Sledz, M.; Witrowa-Rajchert, D. Ultrasound as a pretreatment method to improve drying kinetics and sensory properties of dried apple. J. Food Process. Eng. 2016, 39, 256–265. [Google Scholar] [CrossRef]
  67. Gunhan, T.; Demir, V.; Hancioglu, E.; Hepbasli, A. Mathematical modelling of drying of bay leaves. Energy Convers. Manag. 2005, 46, 1667–1679. [Google Scholar] [CrossRef]
  68. Mohamed, L.A.; Kouhila, M.; Jamali, A.; Lahsasni, S.; Kechaou, N.; Mahrouz, M. Single layer solar drying behaviour of Citrus aurantium leaves under forced convection. Energy Convers. Manag. 2005, 46, 1473–1483. [Google Scholar] [CrossRef]
  69. Taheri-Garavand, A.; Rafiee, S.; Keyhani, A. Mathematical modeling of thin layer drying kinetics of tomato influence of air dryer conditions. Int. Trans. J. Eng. Manage. Sci. Technol. 2011, 2, 147–160. [Google Scholar]
  70. Shimpy; Kumar, M.; Kumar, A.; Sahdev, R.K.; Manchanda, H. Comparison of groundnut drying in simple and modified natural convection greenhouse dryers: Thermal, environmental and kinetic analyses. J. Stored Prod. Res. 2022, 98, 101990. [Google Scholar] [CrossRef]
  71. Krishna Murthy, T.P.; Harish, A.; Rashmi, M.; Mathew, B.B.; Monisha, J. Effect of blanching and microwave power on drying behavior of green peas. Res. J. Eng. Sci. 2014, 3, 10–18. [Google Scholar]
  72. Amami, E.; Khezami, W.; Mezrigui, S.; Badwaik, L.S.; Bejar, A.K.; Perez, C.T.; Kechaou, N. Effect of ultrasound-assisted osmotic dehydration pretreatment on the convective drying of strawberry. Ultrason. Sonochem. 2017, 36, 286–300. [Google Scholar] [CrossRef]
  73. Aral, S.; Beşe, A.V. Convective drying of hawthorn fruit (Crataegus spp.): Effect of experimental parameters on drying kinetics, color, shrinkage, and rehydration capacity. Food Chem. 2016, 210, 577–584. [Google Scholar] [CrossRef]
  74. Nag, S.; Dash, K.K. Mathematical modeling of thin layer drying kinetics and moisture diffusivity study of elephant apple. Int. Food Res. J. 2016, 23, 2594. [Google Scholar]
  75. Madamba, P.S.; Driscoll, R.H.; Buckle, K.A. The thin-layer drying characteristics of garlic slices. J. Food Eng. 1966, 29, 75–97. [Google Scholar] [CrossRef]
  76. Premi, M.; Sharma, H.K.; Sarkar, B.C.; Upadhyay, A. Effect of air velocity and temperature on the drying kinetics of drumstick leaves (Moringa oleifera). Int. J. Food Eng. 2012, 8, 1–19. [Google Scholar] [CrossRef]
  77. Nourhène, B.; Mohammed, K.; Nabil, K. Experimental and mathematical investigations of convective solar drying of four varieties of olive leaves. Food Bioprod. Process. 2008, 86, 176–184. [Google Scholar] [CrossRef]
  78. Doymaz, İ. Mathematical modeling of drying of tomato slices using infrared radiation. J. Food Process. Preserv. 2014, 38, 389–396. [Google Scholar] [CrossRef]
  79. Rafiee, S.; Sharifi, M.; Keyhani, A.; Omid, M.; Jafari, A.; Mohtasebi, S.S.; Mobli, H. Modeling effective moisture diffusivity of orange slice (Thompson Cv.). Int. J. Food Prop. 2010, 13, 32–40. [Google Scholar] [CrossRef]
  80. Kara, C.; Doymaz, İ. Effective moisture diffusivity determination and mathematical modelling of drying curves of apple pomace. Heat Mass Transf. 2015, 51, 983–989. [Google Scholar] [CrossRef]
  81. Lamharrar, A.; Idlimam, A.; Alouani, A.; Kouhila, M. Modelling of thin layer solar drying kinetics and effective diffusivity of Urtica dioica leaves. J. Eng. Sci. Technol. 2017, 12, 2141–2153. [Google Scholar]
  82. Zogzas, N.P.; Maroulis, Z.B.; Marinos-Kouris, D. Moisture diffusivity data compilation in foodstuffs. Dry. Technol. 1996, 14, 2225–2253. [Google Scholar] [CrossRef]
  83. Zheng, X.; Jiang, Y.; Pan, Z. Drying and quality characteristics of different components of alfalfa. In Proceedings of the 2005 ASAE Annual Meeting, Tampa, FL, USA, 17–20 July 2005; p. 056185. [Google Scholar]
Figure 1. (ac): Moisture ratio versus drying time curves as influenced by pretreatments under fluidized bed drying (FBD) at 50 °C (a), 60 °C (b), and 70 °C (c).
Processes 10 02464 g001
Figure 2. (ac): Drying rate versus moisture ratio (MR) curves as influenced by pretreatments under fluidized bed drying (FBD) at 50 °C (a), 60 °C (b) and 70 °C (c).
Processes 10 02464 g002
Figure 3. (af): Plot of experimental moisture ratio against predicted moisture ratio of pretreated and unblanched Moringa leaves at 50 °C using Midilli–Kucuk model for fluidized bed drying.
Processes 10 02464 g003
Figure 4. (af): Plot of experimental moisture ratio against predicted moisture ratio of pretreated and unblanched Moringa leaves at 60 °C using Midilli–Kucuk model for fluidized bed drying.
Processes 10 02464 g004
Figure 5. (af): Plot of experimental moisture ratio against predicted moisture ratio of pretreated and unblanched Moringa leaves at 70 °C using Midilli–Kucuk model for fluidized bed drying.
Processes 10 02464 g005
Figure 6. (ac): Plot of Ln(MR) against drying time (min) for calculating effective diffusivity coefficients (Deff) under various pretreatments in fluidized bed dryer (FBD) at 50 °C (a), 60 °C (b) and 70 °C (c).
Processes 10 02464 g006
Figure 7. Energy consumption under various pretreatments and drying temperatures in fluidized bed dryer.
Processes 10 02464 g007
Figure 8. Specific energy consumption under various pretreatments and drying temperatures in fluidized bed dryer.
Processes 10 02464 g008
Table 2. Statistical analysis of different thin layer drying models of Moringa leaves under fluidized bed drying.
Temperature50 °C60 °C70 °C
ModelPretreatmentDrying Constants and CoefficientsCoefficient of Determination
(R2)
Chi-Square
2)
RMSEDrying Constants and CoefficientsCoefficient of Determination
(R2)
Chi-Square
2)
RMSEDrying Constants and
Coefficients
Coefficient of Determination
(R2)
Chi-Square
2)
RMSE
NewtonB+NaClk 0.335610.9988830.000270.0163k 0.378970.9964140.000220.0144k 0.403880.9980250.000410.0179
B+NaHCO3k 0.232920.9991680.000170.0128k 0.278120.9990610.000150.0120k 0.311170.9990060.000150.0120
B+KMSk 0.208550.9994160.000130.0114k 0.233810.9992300.000120.0108k 0.311170.9995150.000120.0108
B+BSk 0.217710.9990480.000220.0149k 0.273600.9985180.000170.0127k 0.299150.9982990.000340.0197
B+SBk 0.219590.9991380.000230.0146k 0.263850.9985940.000150.0122k 0.298670.9987610.000280.0165
UBk 0.176270.9949650.000690.0257k 0.225230.9942070.000230.0149k 0.236710.9954000.000660.0253
PageB+NaClk 0.30310
n 1.07834
0.9988390.000210.0143k 0.35629
n 1.05226
0.9976310.000200.0138k 0.38130
n 1.05219
0.9981870.000300.0169
B+NaHCO3k 0.21539
n 1.04669
0.9991560.000130.0113k 0.2587
n 1.04743
0.9990290.000110.0117k 0.26754
n 1.11003
0.9991160.000140.0116
B+KMSk 0.16964
n 1.11582
0.9995247.63 × 10−50.0085k 0.22863
n 1.01334
0.9993076.67 × 10−50.0080k 0.22867
n 1.09466
0.9997463.92 × 10−50.0061
B+BSk 0.19018
n 1.07716
0.9991390.000130.0113k 0.24518
n 1.07328
0.9984960.000140.0121k 0.26724
n 1.07899
0.9987160.000220.0145
B+SBk 0.20591
n 1.03667
0.9993910.000100.0101k 0.23177
n 1.08320
0.9985940.000150.0105k 0.26959
n 1.07257
0.9990290.000150.0122
UBk 0.16940
n 1.01988
0.9955900.000620.0245k 0.23426
n 0.97744
0.9965360.000210.0142k 0.24607
n 0.97717
0.9958730.000600.0241
Henderson and PabisB+NaClk 0.3421 0
a 1.02068
0.9989200.000240.0150k 0.38516
a 1.01722
0.9949460.002800.0514k 0.41046
a 1.01723
0.9980620.000320.0173
B+NaHCO3k 0.23788;
a 1.02192
0.9990210.000130.0115k 0.17792
a 0.93018
0.9990510.000140.0118k 0.32070
a 1.03274
0.9990530.000140.0118
B+KMSk 0.21653
a 1.04052
0.999350.000120.0110k 0.23669
a 1.01254
0.9992650.000120.0110k 0.27269
a 1.03255
0.9994669.1978 × 10−50.0093
B+BSk 0.22373
a 1.02896
0.9989590.000170.0129k 0.28084
a 1.02758
0.9986140.000160.0127k 0.30524
a 1.02161
0.9982070.000310.0175
B+SBk 0.22190
a 1.01087
0.9991340.000170.0128k 0.27005
a 1.02488
0.9989030.000130.0111k 0.30571
a 1.02471
0.9987020.000210.0143
UBk 0.17570
a 0.99675
0.9951050.000660.0253k 0.22337
a 0.99163
0.9754680.007820.0864k 0.23460
a 0.99096
0.9955440.000630.0246
k—drying constant; a and n are coefficients.
Table 3. Statistical analysis of different thin layer models of Moringa leaves under fluidized bed drying.
Temperature50 °C60 °C70 °C
ModelPretreatmentDrying Constants and CoefficientsCoefficient of Determination
(R2)
Chi-Square
2)
RMSEDrying Constants and CoefficientsCoefficient of Determination
(R2)
Chi-Square
2)
RMSEDrying Constants and CoefficientsCoefficient of Determination
(R2)
Chi-Square
2)
RMSE
LogarithmicB+NaCla 1.01710
k 0.34962
c 0.00657
0.9991390.000130.0116a 1.01754
k 0.38441
c 0.00058
0.9968370.000210.0116a 1.01665
k 0.41183
c 0.00101
0.9980630.000310.0172
B+NaHCO3a 1.02429
k 0.23343
c 0.23343
0.9992940.000110.0111a 1.01892
k 0.27273
c 0.00986
0.9990610.000140.0098a 1.03789
k 0.31103
c −0.00957
0.9991060.000130.0135
B+ KMSa 1.04499
k 0.20933
c −0.01032
0.9993450.00010.0001a 1.01378
k 0.23417
c −0.00310
0.9992979.11 × 10−50.0093a 1.03610
k 0.26603
c −0.00749
0.9995157.28 × 10−50.0083
B+BSa 1.03266
k 0.21725
c −0.00875
0.9990480.000140.0112a 1.02891
k 0.27814
c 0.00287
0.9986150.000170.0125a 1.02489
k 0.29873
c −0.00651
0.9982990.000290.0166
B+SBa 1.01077
k 0.22207
c 0.00023
0.9991680.000120.0111a 1.02940
k 0.26168
c 0.00953
0.9987750.000110.0103a 1.02230
k 0.31065
c 0.00481
0.9987640.000190.0111
UBa 1.00623
k 0.16313
c −0.02225
0.9951590.000640.0248a 0.99455
k 0.21781
c −0.00721
0.9949150.000410.0143a 0.99376
k 0.22909
c −0.00675
0.9955730.000620.0244
Midilli–KucukB+NaCla 1.00450
k 0.30062
n 1.10032
b 0.00071
0.9992030.000150.0121a 1.00956
k 0.36266
n 1.04774
b 0.00013
0.9967160.000130.0115a 1.01017
k 0.38716
n 1.05236
b 0.00029
0.9982190.000290.0166
B+NaHCO3a 1.01420
k 0.22641
n 1.02187
b 0.00018
0.9992540.00010.0108a 1.00490
k 0.26591
n 1.02596
b −0.00039
0.9990910.000100.0098a 1.01304
k 0.27718
n 1.09272
b −5.6 × 10⁻⁵
0.9990630.000100.0101
B+KMSa 1.01303
k 0.17814
n 1.09392
b −9.1 × 10⁻⁵
0.9995546.81926 × 10−50.0081a 1.01411
k 0.24079
n 0.98573
b −0.00026
0.9994186.0353 × 10−50.0076a 1.01382
k 0.23850
n 1.07478
b −7.7 × 10⁻⁵
0.9997533.70324 × 10−50.0059
B+BSa 1.01173
k 0.19920
n 1.05411
b −0.0002
0.9991710.000120.0107a 1.01389
k 0.25392
n 1.06021
b 6.32 × 10⁻⁵
0.9986850.000130.0112a 1.00555
k 0.27198
n 1.06912
b −7.9 × 10⁻⁵
0.9987490.000210.0142
B+SBa 0.99775
k 0.20108
n 1.05447
b 0.00029
0.9992170.000110.0108a 1.00679
k 0.23818
n 1.06661
b −0.00019
0.9987519.28903 × 10−50.0094a 1.00943
k 0.27077
n 1.08659
b 0.00060
0.9992720.000140.0118
UBa 0.99269
k 0.17612
n 0.97856
b −0.00092
0.9959690.000530.0226a 1.00246
k 0.24393
n 0.94305
b −0.00067
0.9945020.000190.0136a 1.00064
k 0.25335
n 0.94978
b −0.00057
0.9961530.000540.0227
Verma et al.B+NaCla 0.30330
k 0.33561
g 0.33561
0.9989110.000270.0149a −0.012821
k 0.144152
g 0.37340
0.9972860.000200.0138a 1.2681 × 10⁻¹
k −1.22530
g 0.51166
0.995400.000660.0253
B+NaHCO3a 0.20932
k 0.23293
g 0.23292
0.9991380.000170.0128a 1.15514
k 0.24966
g 0.13376
0.9990610.000100.0098a 0.24221
k 0.31117
g 0.31117
0.9982990.000130.0112
B+KMSa 0.20018
k 0.20855
g 0.20855
0.9994080.000130.0114a 0.21023
k 0.23382
g 0.23380
0.9992479.08063 × 10−50.0093a 0.21375
k 0.26453
g 0.26453
0.999220.000120.0108
B+BSa 0.20153
k 0.21771
g 0.21771
0.9990480.000230.0163a 1.20121
k 0.25058
g 0.16841
0.9982050.000150.0107a 0.24565
k 0.29914
g 0.29915
0.9980200.000400.0197
B+SBa 0.20204
k 0.21995
g 0.21995
0.9991680.000220.0146a 1.40683
k 0.22249
g 0.15150
0.9985710.000120.0122a 0.24327
k 0.29867
g 0.29867
0.9987610.000280.0165
UBa 0.19487
k 0.17586
g 0.17586
0.9949650.000690.0257a 0.20486
k 0.22439
g 0.22439
0.9953790.000230.0149a 0.03951
k 1.22800
g 0.22835
0.9932160.002270.0462
k—drying constant; a, b, n, g and c are coefficients.
Table 4. Statistical analysis of different thin layer drying models of Moringa leaves under fluidized bed drying.
Temperature50 °C60 °C70 °C
ModelPretreatmentDrying Constants and CoefficientsCoefficient of Determination
(R2)
Chi-Square
2)
RMSEDrying Constants and CoefficientsCoefficient of Determination
(R2)
Chi-Square
2)
RMSEDrying Constants and CoefficientsCoefficient of Determination
(R2)
Chi-Square
2)
RMSE
Two-term exponentialB+NaCla −2.44676
k −0.00599
0.8275070.07580.263a −2.44504
k −0.00792
0.8115280.07940.2697a −2.44359
k −0.00883
0.8046290.08330.2801
B+NaHCO3a −2.44172
k −0.00587
0.8419850.07200.254a −2.44507
k −0.00673
0.8437530.07210.2549a −2.44345
k −0.00779
0.8363970.06930.2704
B+KMSa −2.44293
k −0.00509
0.8989170.00020.014a −2.43996
k −0.00587
0.8569570.06350.2470a −2.44423
k −0.00619
0.8461140.06870.2563
B+BSa −2.44657
k −0.00509
0.8203360.06760.270a −2.44272
k −0.00620
0.8114760.06760.2759a −2.44701
k −0.00650
0.8020040.08400.2835
B+SBa −2.44559
k −0.00545
0.8407700.06930.258a −2.44593
k 0.00619
0.8226250.07590.2624a −2.44650
k −0.00596
0.8190110.07630.2568
UBa 1.02432
k 0.17587
0.7273010.10750.321a −2.43851
k −0.00753
0.7932060.08790.2887a −2.44039
k −0.00588
0.7607790.09560.3030
Wang and SinghB+NaCla −0.14538
b 0.00470
0.9688060.00780.093a −0.18229
b 0.00753
0.9582520.00900.0927a −0.20106
b 0.00923
0.9523170.00930.1085
B+NaHCO3a −0.12891
b 0.00387
0.9696210.00780.086a −0.14996
b 0.00518
0.9597330.00830.0889a −0.17221
b 0.00688
0.9699170.00820.0856
B+KMSa −0.11338
b 0.00296
0.9841600.00470.067a −0.12858
b 0.00385
0.9738210.00730.0838a −0.13922
b 0.00444
0.9715340.00770.0891
B+BSa −0.11487
b 0.00302
0.9654550.00900.087a −0.14015
b 0.00449
0.9510040.01080.1017a −0.14907
b 0.00504
0.9574410.01130.1041
B+SBa 0.11639
b 0.00311
0.97470.00800.088a −0.13925
b 0.00444
0.9521390.00830.0896a −0.14134
b 0.00450
0.9634660.01250.0948
UBa −0.10529
b 0.00263
0.9314250.01740.129a −0.12668
b 0.00376
0.9488150.01350.1131a −0.12937
b 0.00389
0.9471770.01350.1138
MageeB+NaCla 0.69815
k −0.17168
0.9204540.01120.078a 0.77737
k −0.21945
0.8926720.01190.0932a 0.79934
k −0.23753
0.9190420.01270.1096
B+NaHCO3a 0.84125
k −0.20171
0.9241920.00950.095a 0.82652
k −0.21348
0.9381550.00900.0981a 0.85219
k −0.23661
0.9350060.01070.1010
B+KMSa 0.83083
k 0.18646
0.9574170.00640.098a 0.83554
k −0.19996
0.9469520.00770.0864a 0.81648
k −0.20264
0.9409750.00830.0896
B+BSa 0.80982
k −0.18238
0.9363210.01110.104a 0.80091
k −0.19883
0.9295850.01120.1071a 0.78464
k −0.20062
0.9124340.01250.1097
B+SBa 0.79017
k −0.17626
0.93530.01000.103a 0.81469
k −0.20227
0.9101890.01000.1038a 0.74261
k −0.18129
0.9216650.01170.1059
UBa 0.88278
k −0.1936
0.8584830.01750.129a 0.84084
k −0.20018
0.8873850.01330.1124a 0.82281
k −0.19720
0.8818240.01560.1225
k—drying constant; a and b are coefficients.
Table 5. Effective moisture diffusivity (Deff) and activation energy (Ea) of fluidized bed-dried drumstick leaves.
PretreatmentEffective Moisture Diffusivity (Deff)
(m2/s)
Activation Energy (Ea)
(KJ/mol)
FBD 50 °C
B+NaCl2.96 × 10−913.81
B+NaHCO33.27 × 10−913.71
B+KMS3.39 × 10−913.67
BS3.08 × 10−913.75
B+SB3.18 × 10−913.76
UB2.92 × 10−913.85
FBD 60 °C
B+NaCl3.05 × 10−913.96
B+NaHCO33.35 × 10−913.86
B+KMS3.48 × 10−913.81
BS3.16 × 10−913.88
B+SB3.31 × 10−913.90
UB2.96 × 10−913.98
FBD 70 °C
B+NaCl3.16 × 10−914.07
B+NaHCO33.47 × 10−913.97
B+KMS3.59 × 10−913.95
BS3.28 × 10−914.02
B+SB3.45 × 10−913.99
UB3.04 × 10−914.11
Publisher’s Note: MDPI stays neutral with regard to jurisdictional claims in published maps and institutional affiliations.

