
Quantitative vs. Qualitative Assessment of the Effectiveness of the Removal of Vascular Lesions Using the IPL Method—Preliminary Observations
 , , and
Abstract
:1. Introduction
2. Materials and Methods
2.1. Study Participants
2.2. Erythema Reduction Treatments
2.3. Image Acquisition and Mexametry
2.4. Image Processing and Analysis
2.4.1. GLCM Analysis
2.4.2. Quadtree Decomposition
2.5. Statistical Analysis
3. Results
3.1. Mexametry
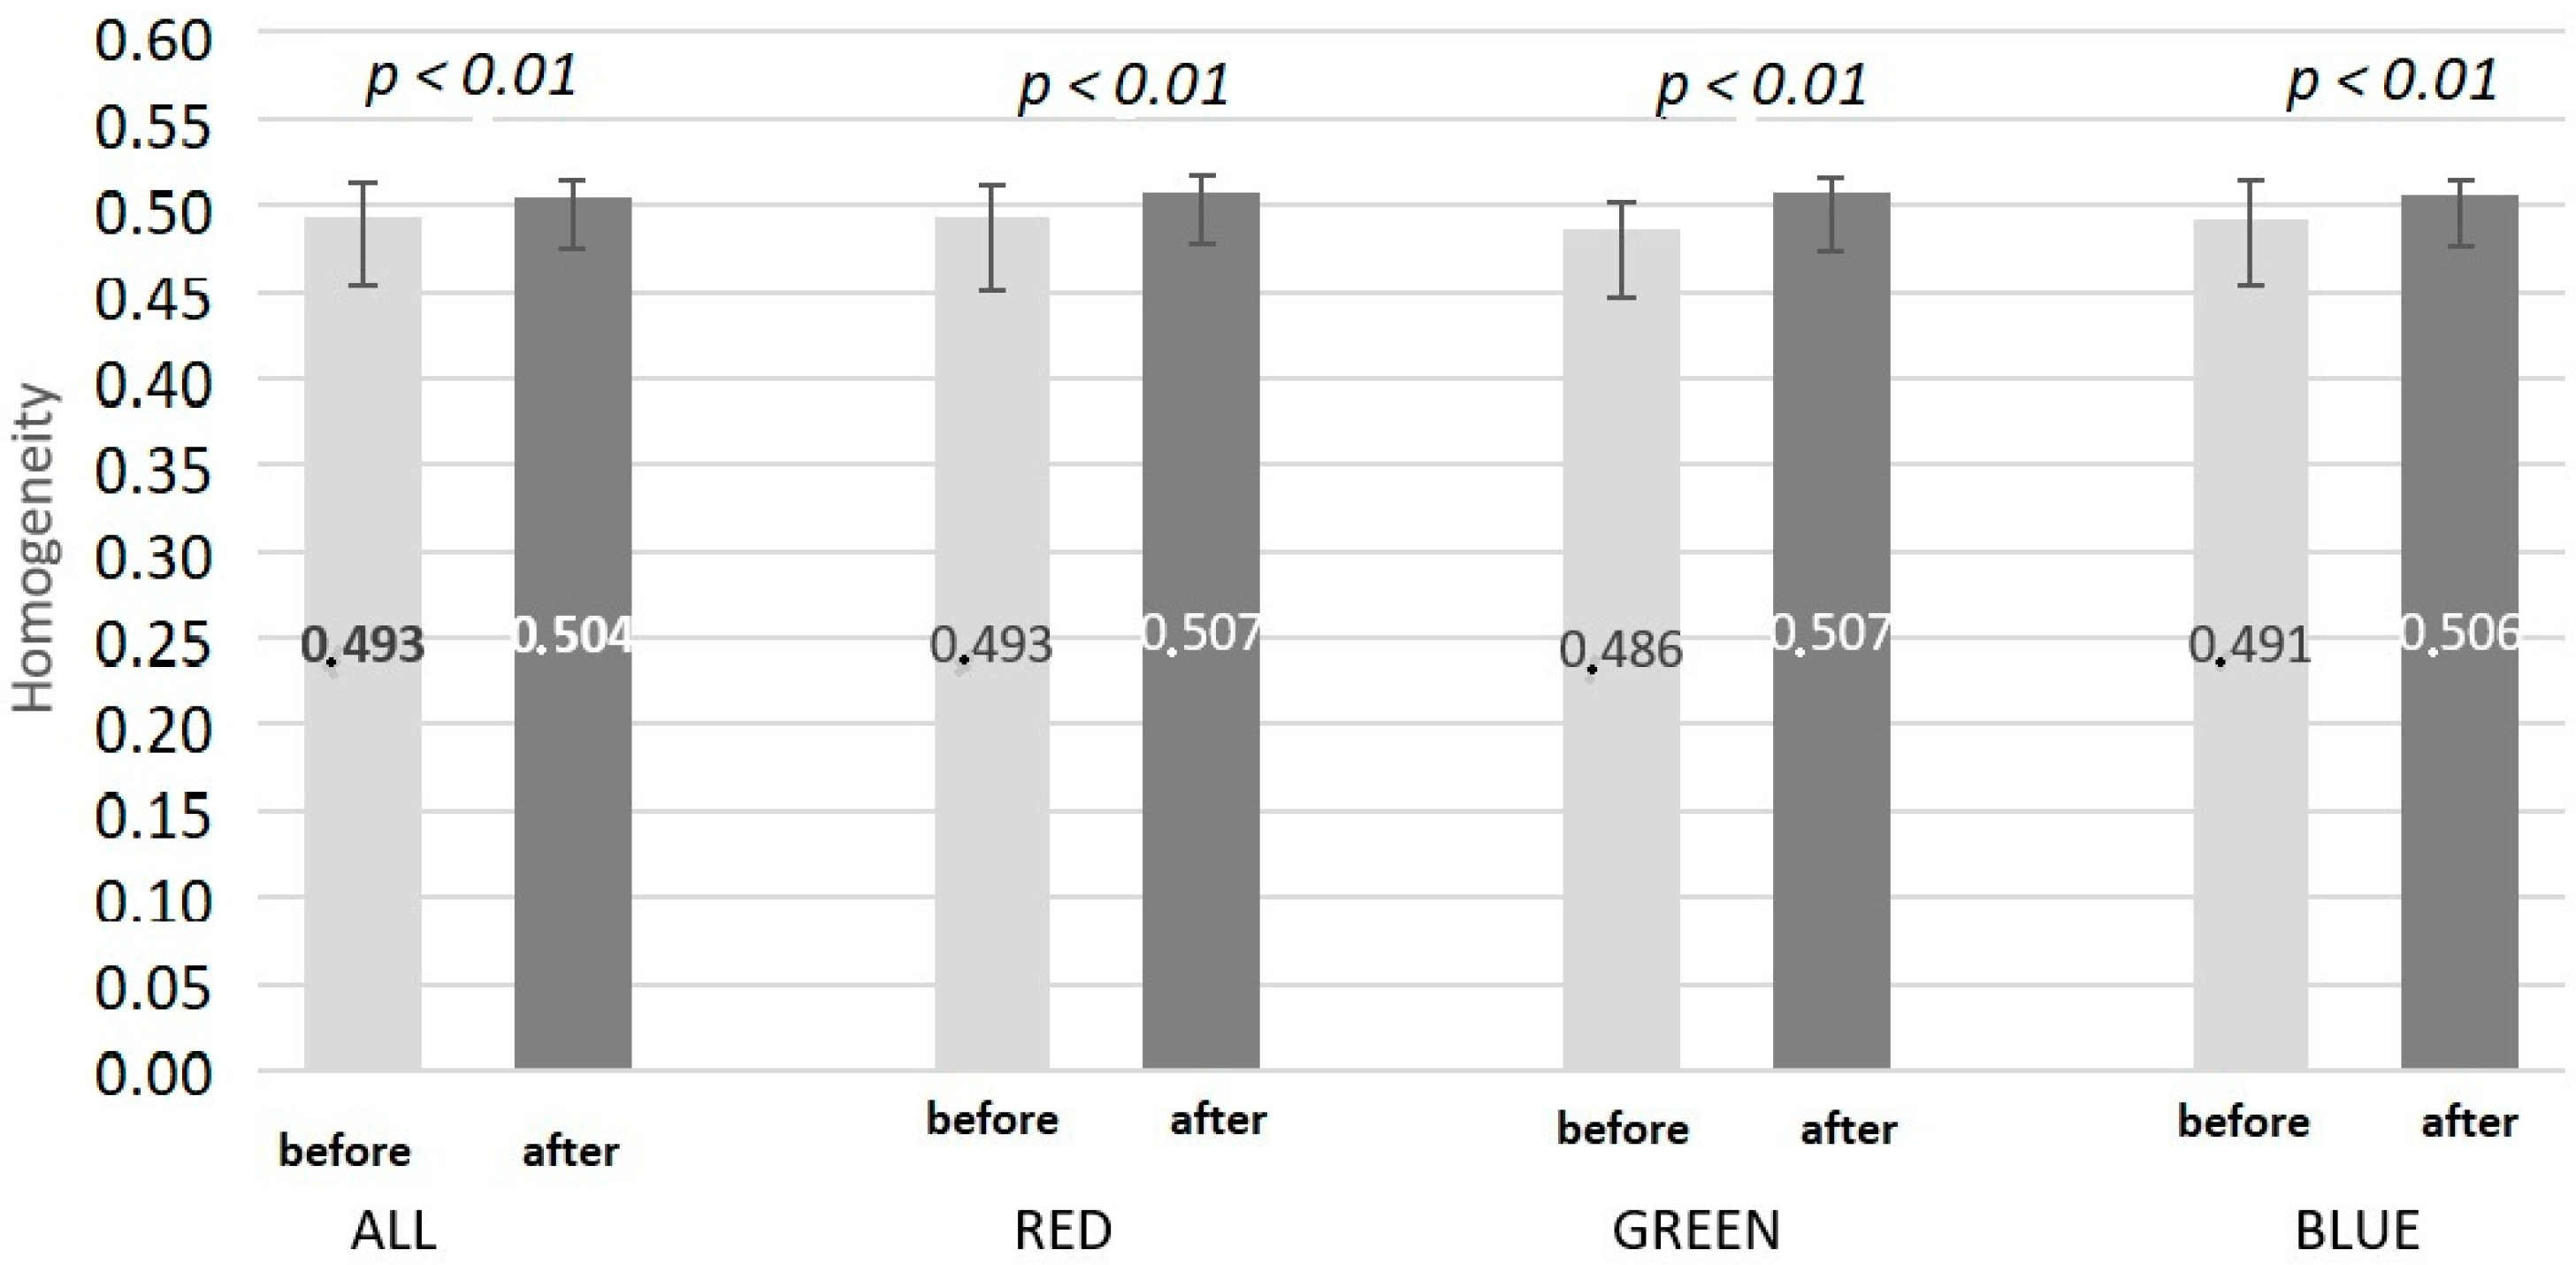
3.2. GLCM Analysis
3.3. Image Brightness Analysis
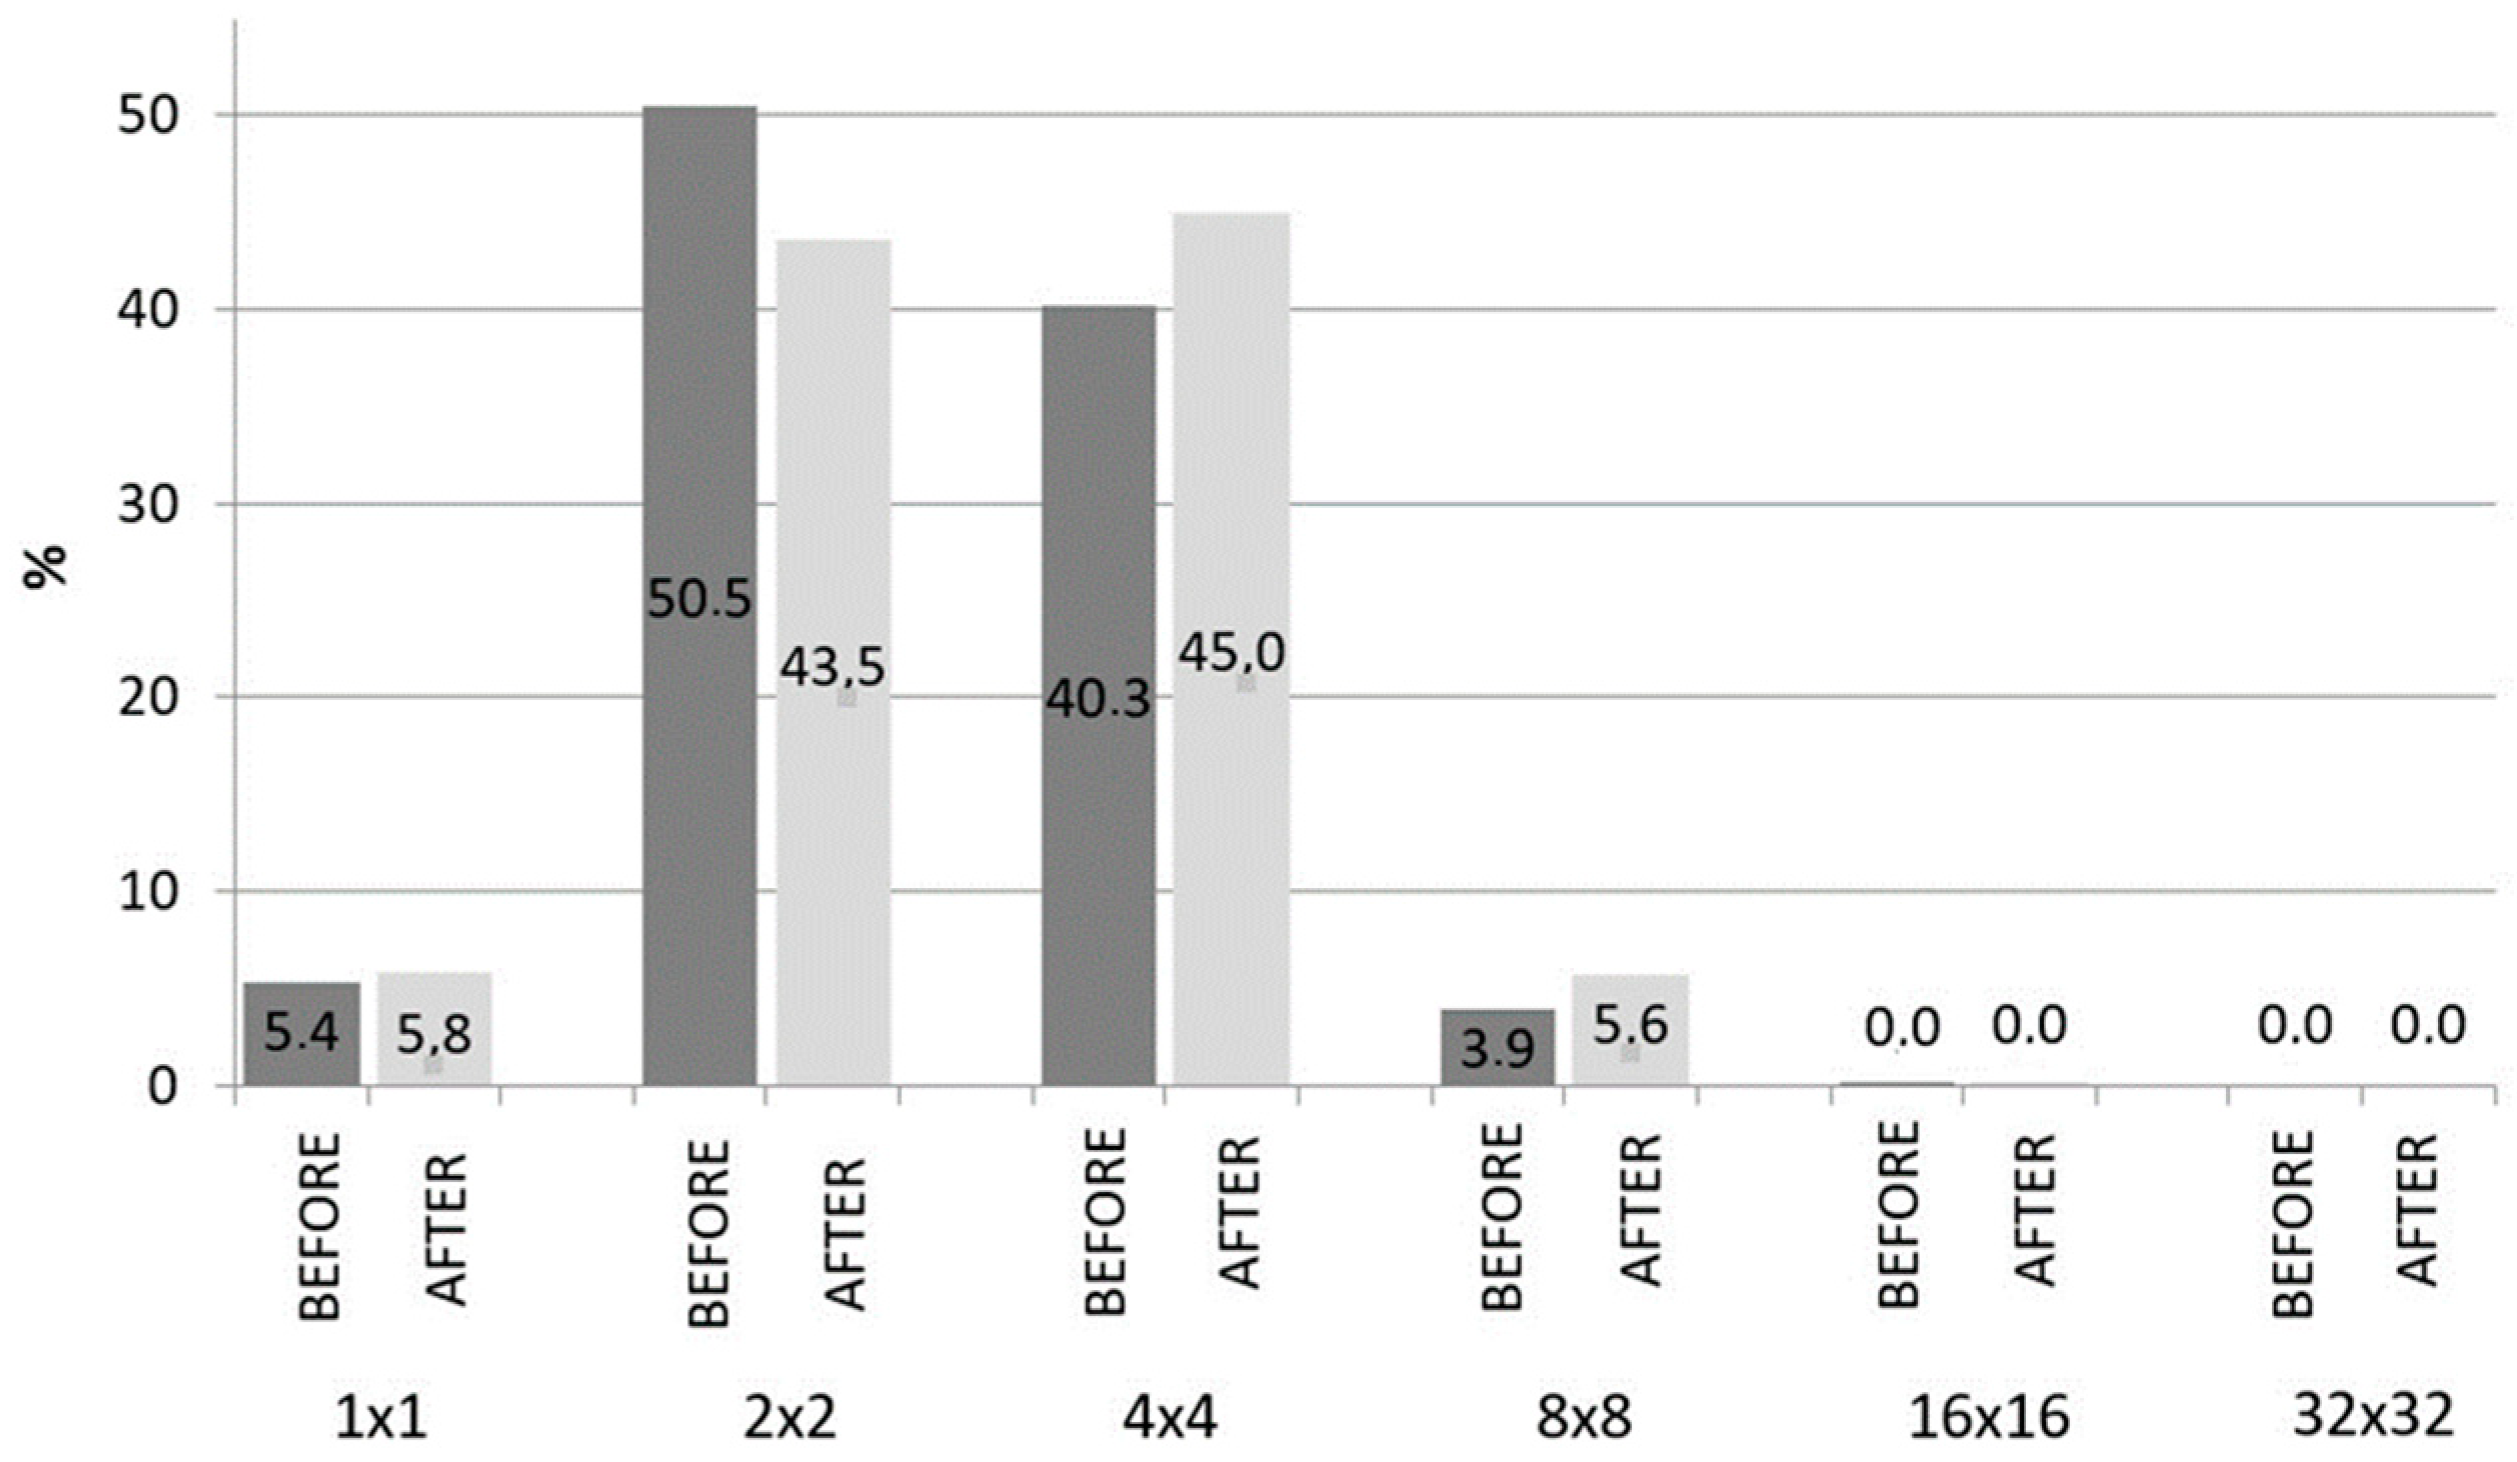
3.4. Quadtree Decomposition
4. Discussion
5. Conclusions
- ○
- Image recording in cross-polarized light enables effective visualization of vascular lesions of the facial skin.
- ○
- A series of three treatments using an IPL light source seems to be sufficient to reduce vascular lesions in the face.
- ○
- GLCM contrast and homogeneity analysis can be an effective method of identifying skin vascular lesions.
- ○
- Identification of GLCM contrast and homogeneity for each image channel enables the separation of vascular lesions from other lesions affecting the examined image parameters.
- ○
- Quadtree decomposition allows for the quantitative identification of skin vascular lesions to a limited extent.
- ○
- The brightness analysis of the images does not allow quantification of the vascular features of the skin.
- ○
- Mexametric measurements do not allow for a quantitative assessment of the skin’s blood vessel response to high-energy light.
Author Contributions
Funding
Institutional Review Board Statement
Informed Consent Statement
Data Availability Statement
Conflicts of Interest
References
- Cannarozzo, G.; Bonciani, D.; Tamburi, F.; Mazzilli, S.; Garofalo, V.; Del Duca, E.; Sannino, M.; Zingoni, T.; Nisticò, S.P. New Insight in Noninvasive Rejuvenation: The Role of a Rhodamine-Intense Pulsed Light System. Photobiomodul. Photomed. Laser Surg. 2019, 37, 539–543. [Google Scholar] [CrossRef] [PubMed]
- Cai, Y.; Zhu, Y.; Wang, Y.; Xiang, W. Intense pulsed light treatment for inflammatory skin diseases: A review. Lasers Med. Sci. 2022, 37, 3085–3105. [Google Scholar] [CrossRef] [PubMed]
- Sales, A.F.S.; Pandolfo, I.L.; de Almeida Cruz, M.; Parisi, J.R.; Garcia, L.A.; Martignago, C.C.S.; Renno, A.C.M.; Vassão, P.G. Intense Pulsed Light on skin rejuvenation: A systematic review. Arch. Dermatol. Res. 2021, 314, 823–838. [Google Scholar] [CrossRef] [PubMed]
- Amiri, R.; Khalili, M.; Mohammadi, S.; Iranmanesh, B.; Aflatoonian, M. Treatment protocols and efficacy of light and laser treatments in post-acne erythema. J. Cosmet. Dermatol. 2022, 21, 648–656. [Google Scholar] [CrossRef]
- Lu, L.; Shi, M.; Chen, Z. Efficacy of IPL therapy for the treatment of acne vulgaris: A meta-analysis. J. Cosmet. Dermatol. 2020, 19, 2596–2605. [Google Scholar] [CrossRef]
- Kim, B.Y.; Moon, H.-R.; Ryu, H.J. Comparative efficacy of short-pulsed intense pulsed light and pulsed dye laser to treat rosacea. J. Cosmet. Laser Ther. 2018, 21, 291–296. [Google Scholar] [CrossRef]
- Guo, Y.; Shan, J.; Zhang, T. Clinical application of intense pulsed light depilation technology in total auricular reconstruction. Lasers Med. Sci. 2017, 32, 1367–1373. [Google Scholar] [CrossRef]
- Saluja, R.; Gentile, R.D. Picosecond Laser: Tattoos and Skin Rejuvenation. Facial Plast. Surg. Clin. N. Am. 2020, 28, 87–100. [Google Scholar] [CrossRef]
- Marcus, B.C. Nonablative and Hybrid Fractional Laser Skin Rejuvenation. Facial Plast. Surg. Clin. N. Am. 2020, 28, 37–44. [Google Scholar] [CrossRef]
- Agarwal, M.; Velaskar, S. Laser Skin Rejuvenation with Fractional 1064 Q-switched Nd:YAG in 252 Patients: An Indian Experience. J. Cosmet. Dermatol. 2020, 19, 382–387. [Google Scholar] [CrossRef]
- Vissing, A.-C.E.; Dierickx, C.; Karmisholt, K.E.; Haedersdal, M. Topical brimonidine reduces IPL-induced erythema without affecting efficacy: A randomized controlled trial in patients with facial telangiectasias. Lasers Surg. Med. 2018, 50, 1002–1009. [Google Scholar] [CrossRef] [PubMed]
- Deng, Q.; Zhang, S.-P.; Deng, Y.-X.; Liu, F.-F.; Shi, W.; Xie, H.-F.; Xiao, Y.; Huang, Y.-X.; Li, J. Willingness-to-Pay and Benefit–Cost Analysis of IPL for Rosacea Treatment: A Cross-Sectional Study in China. Patient Prefer. Adherence 2020, 14, 1843–1852. [Google Scholar] [CrossRef] [PubMed]
- Gao, L.; Qu, H.; Gao, N.; Li, K.; Dang, E.; Tan, W.; Wang, G. A retrospective analysis for facial telangiectasia treatment using pulsed dye laser and intense pulsed light configured with different wavelength bands. J. Cosmet. Dermatol. 2019, 19, 88–92. [Google Scholar] [CrossRef] [PubMed]
- Williams, N.M.; Rajabi-Estarabadi, A.; Aigen, A.R. Use of Intense Pulsed Light Versus Pulsed-Dye Laser in the Treatment of Truncal Telangiectasia. Dermatol. Surg. 2020, 47, 862–863. [Google Scholar] [CrossRef] [PubMed]
- Handler, M.Z.; Bloom, B.S.; Goldberg, D.J. IPL vs. PDL in treatment of facial erythema: A split-face study. J. Cosmet. Dermatol. 2017, 16, 450–453. [Google Scholar] [CrossRef]
- Yepuri, V.; Patil, A.D.; Fritz, K.; Salavastru, C.; Kroumpouzos, G.; Nisticò, S.P.; Piccolo, D.; Sadek, A.; Badawi, A.; Kassir, M.; et al. Light-Based Devices for the Treatment of Facial Erythema and Telangiectasia. Dermatol. Ther. 2021, 11, 1879–1887. [Google Scholar] [CrossRef]
- Tsunoda, K.; Akasaka, K.; Akasaka, T.; Amano, H. Successful treatment of erythematotelangiectatic rosacea with intense pulsed light: Report of 13 cases. J. Dermatol. 2018, 45, 1113–1116. [Google Scholar] [CrossRef]
- Sharma, A.; Kroumpouzos, G.; Kassir, M.; Galadari, H.; Goren, A.; Grabbe, S.; Goldust, M. Rosacea management: A comprehensive review. J. Cosmet. Dermatol. 2022, 21, 1895–1904. [Google Scholar] [CrossRef]
- Kang, C.N.; Shah, M.; Tan, J. Rosacea: An Update in Diagnosis, Classification and Management. Ski. Ther. Lett. 2021, 26, 1–8. [Google Scholar]
- van Zuuren, E.J.; Arents, B.W.M.; van der Linden, M.M.D.; Vermeulen, S.; Fedorowicz, Z.; Tan, J. Rosacea: New Concepts in Classification and Treatment. Am. J. Clin. Dermatol. 2021, 22, 457–465. [Google Scholar] [CrossRef]
- Zhang, H.; Tang, K.; Wang, Y.; Fang, R.; Sun, Q. Rosacea Treatment: Review and Update. Dermatol. Ther. 2021, 11, 13–24. [Google Scholar] [CrossRef] [PubMed]
- Lallas, A.; Argenziano, G.; Longo, C.; Moscarella, E.; Apalla, Z.; Koteli, C.; Zalaudek, I. Polygonal vessels of rosacea are highlighted by dermoscopy. Int. J. Dermatol. 2014, 53, e325–e327. [Google Scholar] [CrossRef] [PubMed]
- Porto, D.A.; Ozog, D.M. The utility of dermoscopy in directing laser therapy. Lasers Surg. Med. 2016, 48, 93–94. [Google Scholar] [CrossRef] [PubMed]
- Fonseca, G.P.; Brenner, F.M.; Muller, C.S.; Wojcik, A.L. Nailfold capillaroscopy as a diagnostic and prognostic method in rosacea. An. Bras. Dermatol. 2011, 86, 87–90. [Google Scholar] [CrossRef] [Green Version]
- Themstrup, L.; Ciardo, S.; Manfredi, M.; Ulrich, M.; Pellacani, G.; Welzel, J.; Jemec, G. In vivo, micro-morphological vascular changes induced by topical brimonidine studied by Dynamic optical coherence tomography. J. Eur. Acad. Dermatol. Venereol. 2016, 30, 974–979. [Google Scholar] [CrossRef] [PubMed]
- Gottlöber, P.; Jansen, T.; Peter, R.U.; Korting, H.C. Perorale Behandlung der Rosacea conglobata mit isotretinoin: Therapiekontrolle mit der 20 MHz-Sonographie. Z. Hautkr. 1997, 72, 24–26. [Google Scholar]
- Mark, K.A.; Sparacio, R.M.; Voigt, A.; Marenus, K.; Sarnoff, D. Objective and quantitative improvement of rosacea-associated erythema after intense pulsed light treatment. Dermatol. Surg. 2003, 29, 600–604. [Google Scholar]
- Jakovels, D.; Spigulis, J. RGB Imaging device for mapping and monitoring of hemoglobin distribution in skin. Lith. J. Phys. 2012, 52, 50–54. [Google Scholar] [CrossRef]
- Choi, J.W.; Kim, B.R.; Lee, H.S.; Youn, S.W. Characteristics of subjective recognition and computer-aided image analysis of facial erythematous skin diseases: A cornerstone of automated diagnosis. Br. J. Dermatol. 2014, 171, 252–258. [Google Scholar] [CrossRef]
- Saknite, I.; Zavorins, A.; Jakovels, D.; Spigulis, J.; Kisis, J. Comparison of single-spot technique and RGB imaging for erythema index estimation. Physiol. Meas. 2016, 37, 333–346. [Google Scholar] [CrossRef]
- Wilczyński, S.; Koprowski, R.; Deda, A.; Janiczek, M.; Kuleczka, N.; Błońska-Fajfrowska, B. Thermographic mapping of the skin surface in biometric evaluation of cellulite treatment effectivess. Skin. Res. Technol. 2016, 0, 1–9. [Google Scholar]
- Ratajczak-Stefańska, V.; Maleszka, R.; Boer, M.; Kiedrowicz, M. Erythematotelangiectatic skin –diagnostics difficulties. Ann. Acad. Med. Stetin. 2009, 55, 58–65. [Google Scholar] [PubMed]
- Kikuchi, K.; Masuda, Y.; Yamashita, T.; Kawai, E.; Hirao, T. Image analysis of skin color heterogeneity focusing on skin chromophores and the age-related changes In facia skin. Ski. Res. Technol. 2015, 2, 175–183. [Google Scholar] [CrossRef]
- Kim, S.J.; Lee, Y.; Seo, Y.J.; Lee, J.H.; Im, M. Comparative Efficacy of Radiofrequency and Pulsed Dye Laser in the Treatment of Rosacea. Dermatol. Surg. 2017, 43, 204–209. [Google Scholar] [CrossRef]
- Kim, J.; Ahn, J.W.; Ha, S.; Kwon, S.H.; Lee, O.; Oh, C. Clinical assessment of rosacea severity: Oriental score vs. quantitative assessment method with imaging and biomedical tools. Ski. Res. Technol. 2017, 23, 186–193. [Google Scholar] [CrossRef] [PubMed]
- Cohen, D.K.; Gonzalez, N.E.; Bloom, B.S.; Goldberg, D.J. Use of a novel 589-nm solid-state laser for treatment of facial erythema. J. Cosmet. Dermatol. 2018, 17, 770–774. [Google Scholar] [CrossRef]
- Clarys, P.; Alewaeters, K.; Lambrecht, R.; Barel, A.O. Skin color measurements: Comparison between three instruments: The Chromameter(R), the DermaSpectrometer(R) and the Mexameter(R). Ski. Res. Technol. 2000, 6, 230–238. [Google Scholar] [CrossRef]
- Baquié, M.; Kasraee, B. Discrimination between cutaneous pigmentation and erythema: Comparison of the skin colorimeters Dermacatch and Mexameter. Ski. Res. Technol. 2014, 20, 218–227. [Google Scholar] [CrossRef]
- Matias, A.R.; Ferreira, M.; Costa, P.; Neto, P. Skin colour, skin redness and melanin biometric measurements: Comparison study between Antera® 3D, Mexameter® and Colorimeter®. Ski. Res. Technol. 2015, 21, 346–362. [Google Scholar] [CrossRef]


| RGB | Red Channel | Green Channel | Blue Channel | ||||||
|---|---|---|---|---|---|---|---|---|---|
| BEFORE | AFTER | BEFORE | AFTER | BEFORE | AFTER | BEFORE | AFTER | ||
| Left cheek | x | 151.3 | 154.8 | 207.9 | 211.3 | 136.6 | 141.0 | 109.0 | 112.1 |
| SD | 10.2 | 14.1 | 11.1 | 14.6 | 12.3 | 16.1 | 9.4 | 13.0 | |
| p | ns | ns | ns | ns | |||||
| Right cheek | x | 156.2 | 157.1 | 213.3 | 213.4 | 141.4 | 143.3 | 113.8 | 114.5 |
| SD | 10.2 | 12.0 | 9.8 | 11.7 | 13.0 | 13.7 | 10.0 | 12.4 | |
| p | ns | ns | ns | ns | |||||
| 1 × 1 | 2 × 2 | 4 × 4 | 8 × 8 | 16 × 16 | 32 × 32 | |||||||
|---|---|---|---|---|---|---|---|---|---|---|---|---|
| BEFORE | AFTER | BEFORE | AFTER | BEFORE | AFTER | BEFORE | AFTER | BEFORE | AFTER | BEFORE | AFTER | |
| Me | 12 | 34 | 111 | 107 | 269 | 263 | 479 | 458 | 79 | 98 | 2 | 1 |
| Q1 | 4 | 8 | 91 | 75 | 240 | 198 | 285 | 179 | 40 | 56 | 0 | 0 |
| Q3 | 41 | 48 | 314 | 166 | 584 | 452 | 660 | 572 | 474 | 348 | 22 | 37 |
| p | ns | ns | =0.05 | <0.05 | ns | ns | ||||||
| 1 × 1 | 2 × 2 | 4 × 4 | 8 × 8 | 16 × 16 | 32 × 32 | |||||||
|---|---|---|---|---|---|---|---|---|---|---|---|---|
| BEFORE | AFTER | BEFORE | AFTER | BEFORE | AFTER | BEFORE | AFTER | BEFORE | AFTER | BEFORE | AFTER | |
| Me | 1092 | 1080 | 10301 | 8129 | 8216 | 8403 | 799 | 1053 | 3 | 6 | 0 | 0 |
| Q1 | 476 | 616 | 4702 | 5394 | 4593 | 5007 | 598 | 833 | 2 | 2 | 0 | 0 |
| Q3 | 1812 | 1392 | 12159 | 11012 | 8708 | 8927 | 1151 | 1394 | 6 | 9 | 0 | 0 |
| p | ns | p < 0.05 | ns | p < 0.05 | ns | ns | ||||||
Publisher’s Note: MDPI stays neutral with regard to jurisdictional claims in published maps and institutional affiliations. |
© 2022 by the authors. Licensee MDPI, Basel, Switzerland. This article is an open access article distributed under the terms and conditions of the Creative Commons Attribution (CC BY) license (https://creativecommons.org/licenses/by/4.0/).
Share and Cite
Lipka-Trawińska, A.; Wilczyński, S.; Deda, A.; Koprowski, R.; Lebiedowska, A.; Wcisło-Dziadecka, D. Quantitative vs. Qualitative Assessment of the Effectiveness of the Removal of Vascular Lesions Using the IPL Method—Preliminary Observations. Processes 2022, 10, 2225. https://doi.org/10.3390/pr10112225
Lipka-Trawińska A, Wilczyński S, Deda A, Koprowski R, Lebiedowska A, Wcisło-Dziadecka D. Quantitative vs. Qualitative Assessment of the Effectiveness of the Removal of Vascular Lesions Using the IPL Method—Preliminary Observations. Processes. 2022; 10(11):2225. https://doi.org/10.3390/pr10112225
Chicago/Turabian StyleLipka-Trawińska, Aleksandra, Sławomir Wilczyński, Anna Deda, Robert Koprowski, Agata Lebiedowska, and Dominika Wcisło-Dziadecka. 2022. "Quantitative vs. Qualitative Assessment of the Effectiveness of the Removal of Vascular Lesions Using the IPL Method—Preliminary Observations" Processes 10, no. 11: 2225. https://doi.org/10.3390/pr10112225