Article

Human-Health and Environmental Risks of Heavy Metal Contamination in Soil and Groundwater at a Riverside Site, China

1
Guangxi Research Institute of Environmental Protection, Nanning 530022, China
2
State Key Laboratory of Geohazard Prevention and Geoenvironment Protection, Chengdu University of Technology, Chengdu 610051, China
3
Guangxi Bossco Environmental Protection Technology Co., Ltd., Nanning 530000, China
*
Authors to whom correspondence should be addressed.
Processes 2022, 10(10), 1994; https://doi.org/10.3390/pr10101994
Submission received: 16 September 2022 / Revised: 26 September 2022 / Accepted: 28 September 2022 / Published: 2 October 2022
(This article belongs to the Special Issue Advances in Remediation of Contaminated Sites: Volume I)

Abstract

:
The contaminated site is considered a high-risk pollution source due to the accumulation of industrial waste and wastewater, which affects the soil and groundwater environment. In this study, through soil and groundwater investigation, we outlined the characteristics of heavy metal contamination in the soil and groundwater of the contaminated site, assessed the health risk of the contaminated site to humans, and established a numerical model to predict the ecological and environmental risks of the site. The results of the study showed that the maximum contamination concentration of pollutants (lead, arsenic, cadmium) in the soil all exceeded the Chinese environmental standard (GB36600-2018, Grade II), that the maximum contamination concentration (cadmium, Cd) of the groundwater exceeded the Chinese environmental standard (GB14848–2017, Grade IV), and that the heavy metal pollution was mainly concentrated in the production area of the site and the waste-residue stockpiles. The total carcinogenic risk and non-carcinogenic hazard quotient of the site’s soil heavy metal contaminants exceed the human acceptable limit, and there is a human health risk. However, the groundwater in the area where the site is located is prohibited from exploitation, and there is no volatility of the contaminants and no exposure pathway to the groundwater, so there is no risk to human health. The simulation prediction results show that, with the passage of time, the site groundwater pollutants as a whole migrate from south to north, affecting the northern surface water bodies after about 12 years, and there is a high ecological and environmental risk. The above findings provide a scientific basis for the study of the soil and groundwater at the riverside contaminated site.

1. Introduction

With the increasing scale of global industrialization and continuous urbanization, the heavy metal pollution of soil and groundwater is becoming more and more serious [1,2], among which the heavy metal pollution of groundwater caused by the random dumping of industrial waste and the infiltration of waste leachate is particularly prominent [3,4]. Heavy metals are well-known environmental pollutants owing to their toxicity, longevity in the atmosphere, and ability to accumulate in the human body via bioaccumulation. Heavy metals can become strongly toxic by mixing with different environmental elements, such as water, soil, and air, and humans and other living organisms can be exposed to them through the food chain, and they cause disease [5]. Heavy metals are often present in an ionic state in soil and groundwater environments, and some of them, such as lead (Pb), arsenic (As), and cadmium (Cd), are carcinogenic, mutagenic, and prone to causing deformities [5,6]. China is one of the world’s largest producers of metal smelting [4,7], with a large number of contaminated sites left behind, and remediation actions for heavy-metal-contaminated sites are imminent [8]. Therefore, the study of heavy-metal-contamination characteristics and risk assessment in soil–groundwater is important for the remediation of heavy-metal-contaminated sites.
Many scholars have studied heavy-metal-contaminated sites in soil and groundwater, mainly focusing on the characteristics of heavy metal contamination in soil and groundwater, contaminant source analysis, risk assessment, and contamination migration and transformation mechanisms [9,10,11]. Li et al. [12] studied the migration mechanism of contaminants in karst groundwater and the main control factors, which provided a scientific basis for the protection of groundwater resources in karst areas. Liu et al. [13] conducted a comprehensive study on the soil contamination characteristics of a large arsenic-slag-contaminated site and its potential risk to the environment and ecosystem. The results of the study showed severe arsenic contamination of the soil at the site, and the mean value of the potential ecological risk index (Er) was estimated to be 606, indicating a potentially serious ecological risk and the need for the remediation of the contaminated site. Zhao et al. [14] used a three-dimensional model sandbox to simulate the contamination transport of the heavy metal Cr (VI) in the unsaturated zone and aquifer. Wu et al. [10] studied the contamination characteristics and ecological risk of heavy metals in the soil of a construction waste landfill. According to the Nemerow integrated contamination index and potential ecological risk assessment, the risk assessment codes indicate that Cd and Mn have the greatest environmental risk. However, most studies on soil and groundwater heavy-metal-contamination characteristics and risk assessment have been conducted with the location of the study area mainly in industrial agglomerations or farmland areas, and fewer studies have been conducted on soil and groundwater contamination characteristics and risk assessment for heavy metal contamination in riverside contaminated site.
With the rapid development of computer technology, numerical simulation has become an important tool to study the migration and transformation of heavy metal pollutants in contaminated sites [15,16]. He et al. [17] used numerical simulation to study the migration of Cu2+ and Zn2+ and the deterrence of bentonite engineering barriers in a tailings pond, and the results showed that the maximum migration distance of heavy metal ions reached 45 m after 5 years, and the deterrence efficiency of 0.5 m thick bentonite engineering barriers for pollutants exceeded 87%. Guo et al. [18] simulated the prediction of groundwater contaminants in an abandoned tannery based on the visual MODFLOW and MT3DMS models, and the simulation results showed that the migration of contaminants mainly occurred in the Quaternary system; Guo et al proposed two methods for calculating the decay rate of contaminant migration time and distance, which provided a basis for the actual investigation of the determination of contaminant migration range and time. At present, most studies have used models to predict the dynamics and trends of heavy metal leachate migration from waste residues [19,20] and the changes in the pollution plume after taking engineering measures [17,21,22], and few researchers have used numerical simulation techniques to consider the risk of heavy metal pollutants to the surrounding ecological environment. In particular, studies on the ecological risk assessment of riverside contaminated sites are much scarcer.
The lead and zinc smelting industry is one of the most common causes of soil heavy metal pollution in China. This paper takes a riverside metal smelter as the research object, obtains soil and groundwater samples through site investigation, combines field tests, analyzes the distribution characteristics of heavy metal contamination in soil and groundwater at the riverside contaminated sites, evaluates the health risk of the site to human beings, and establishes a contamination migration model to reveal the risk of the contaminated site to the surrounding ecological environment.

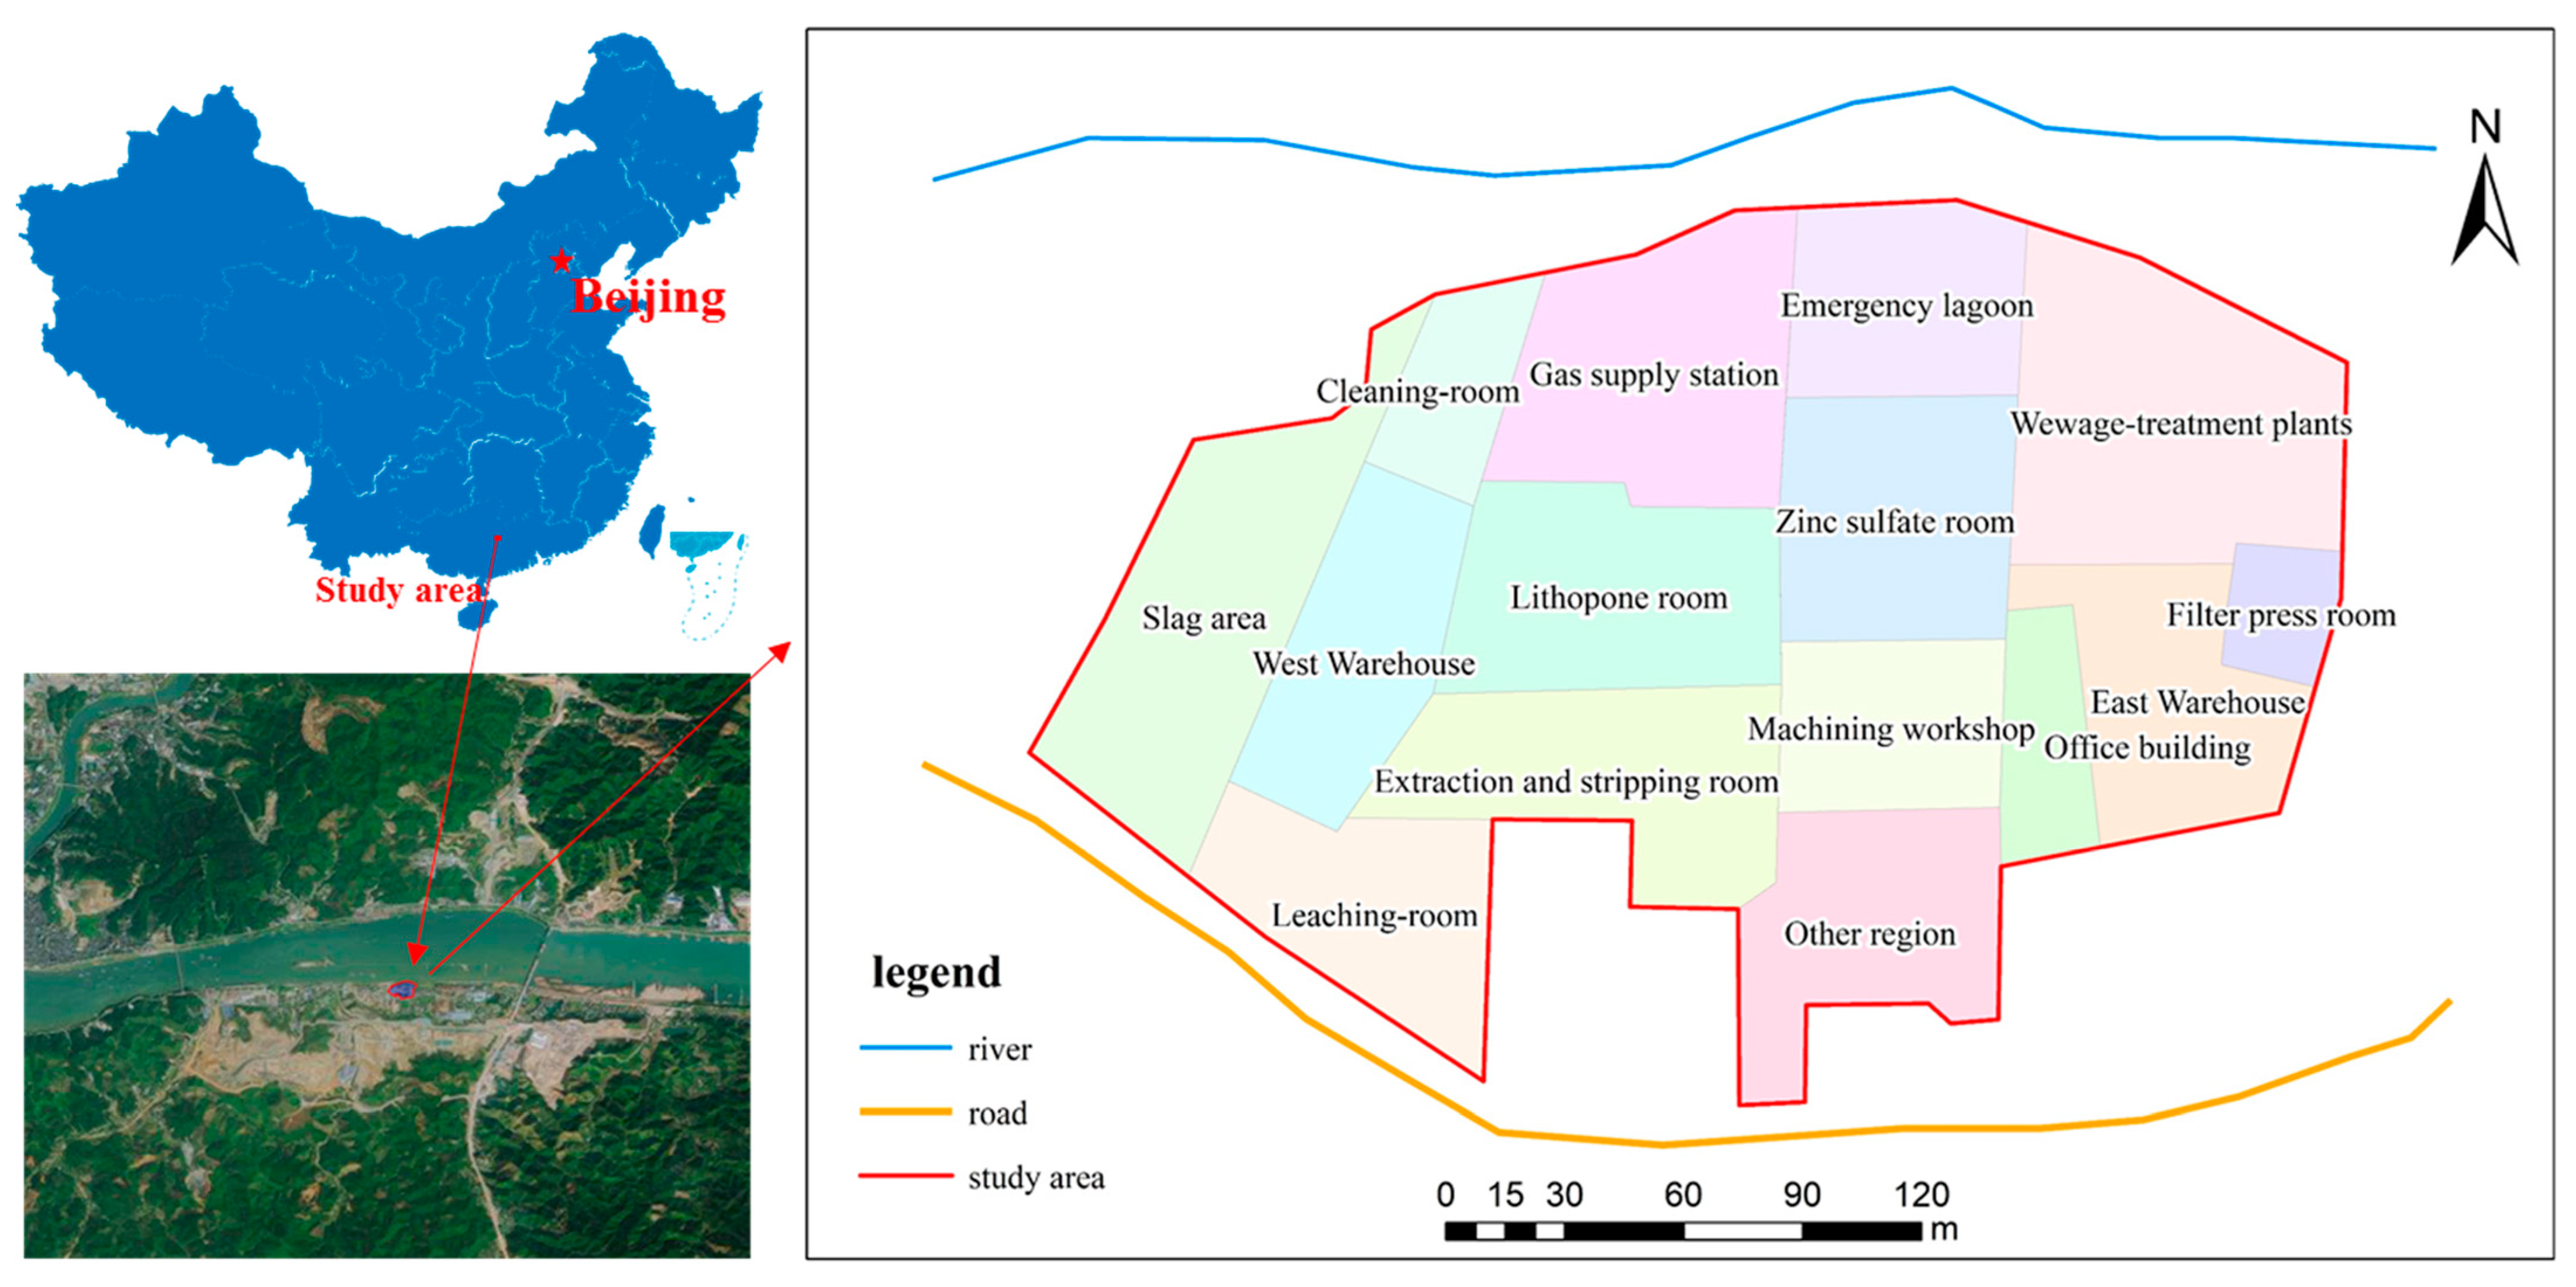
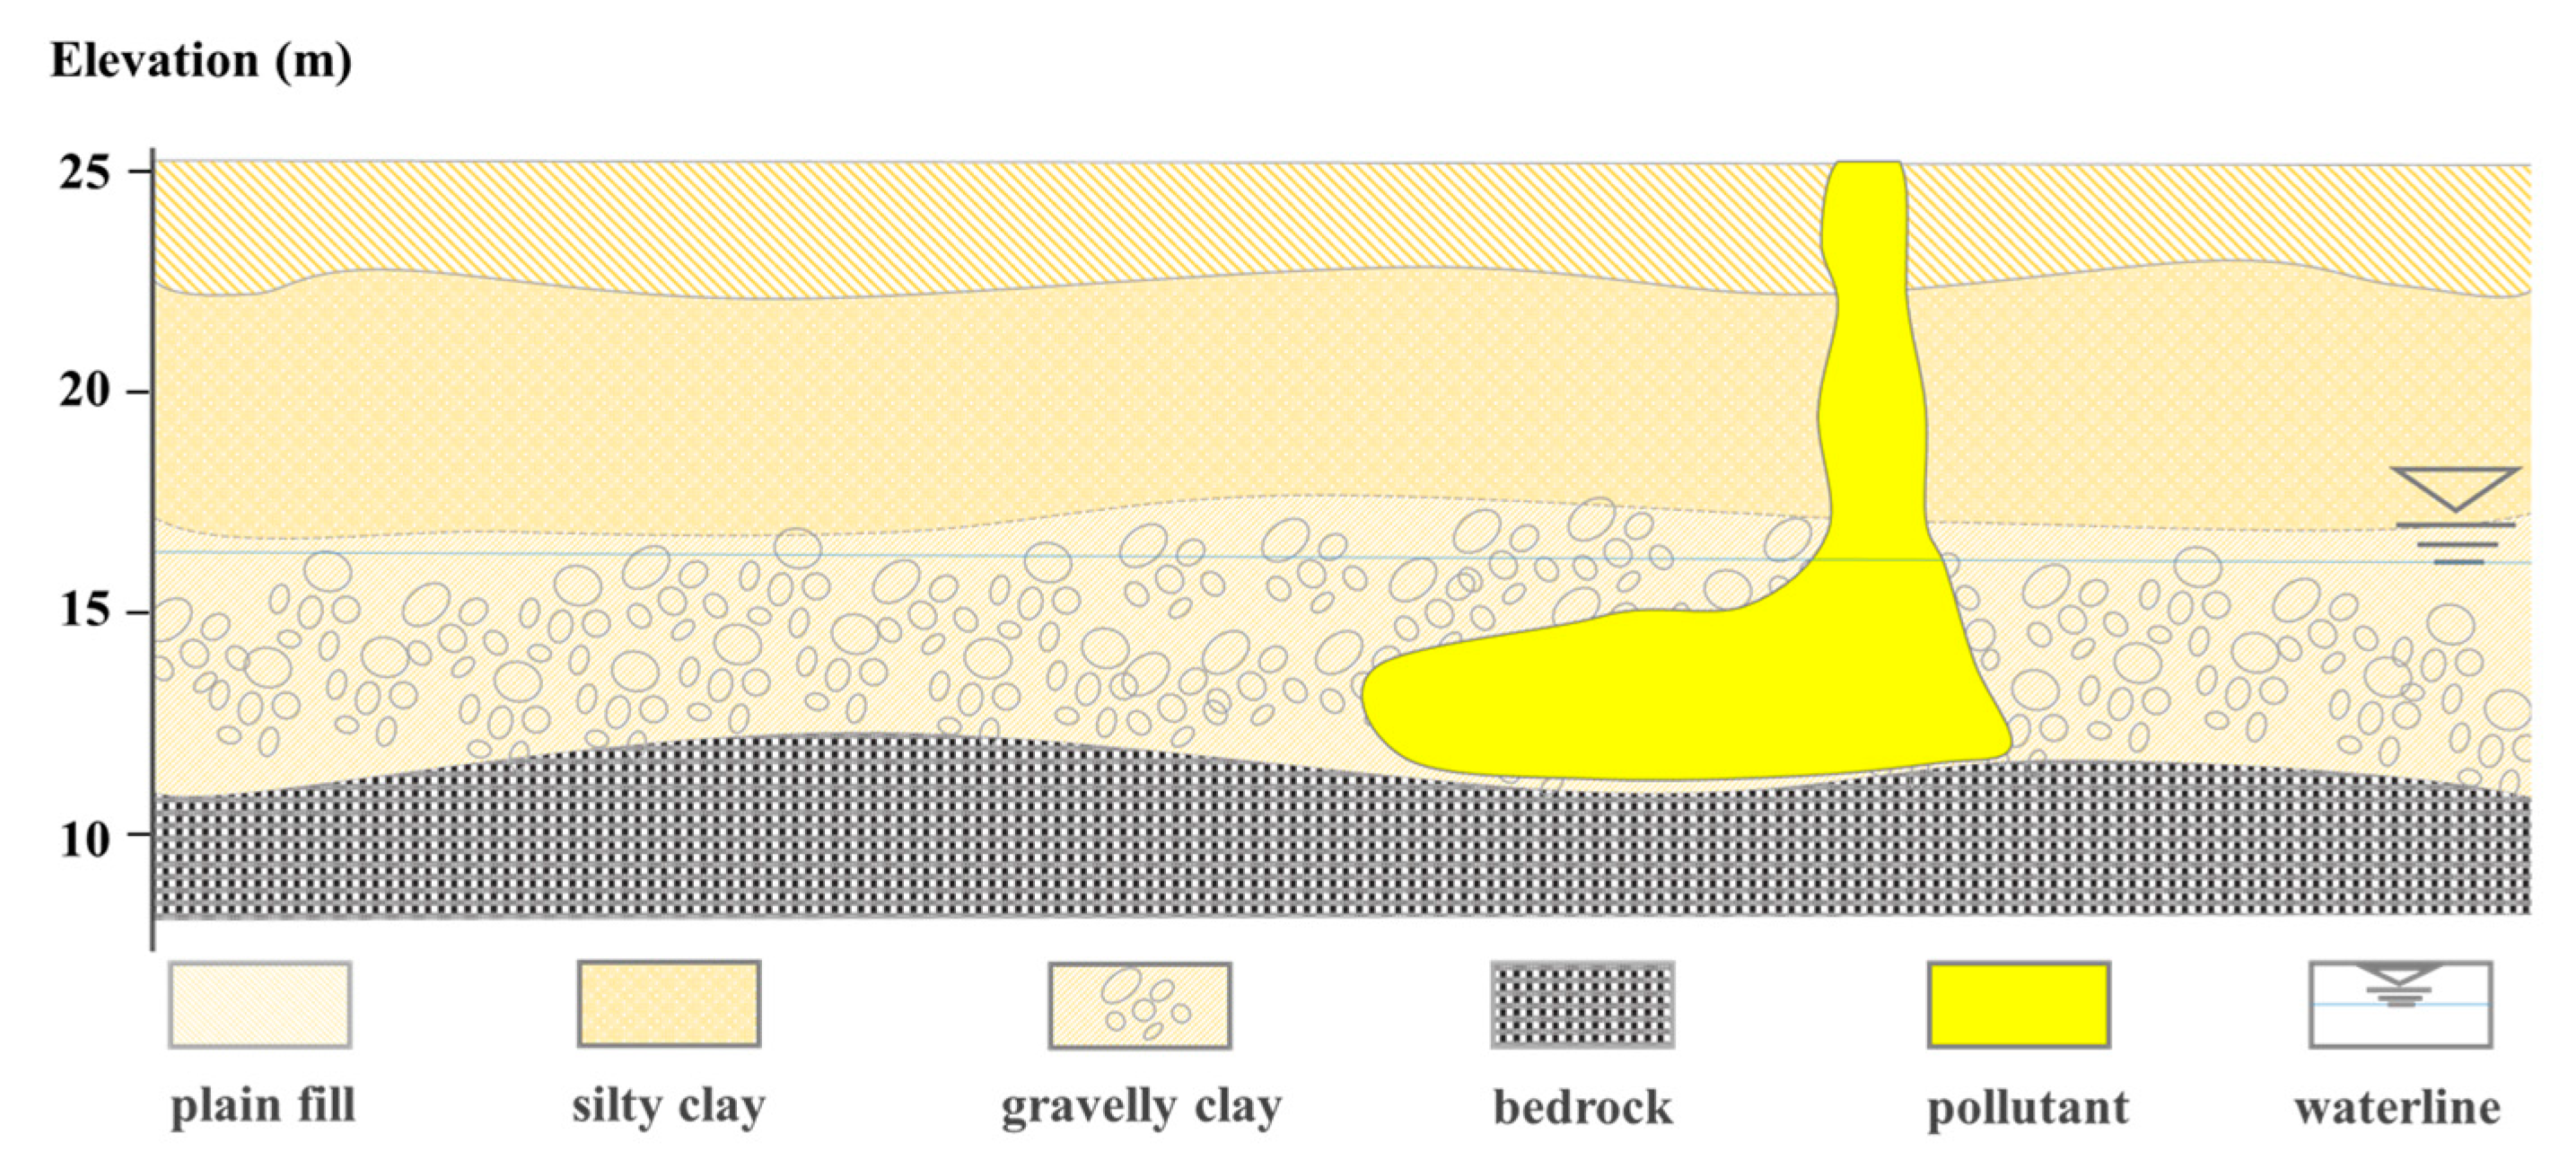
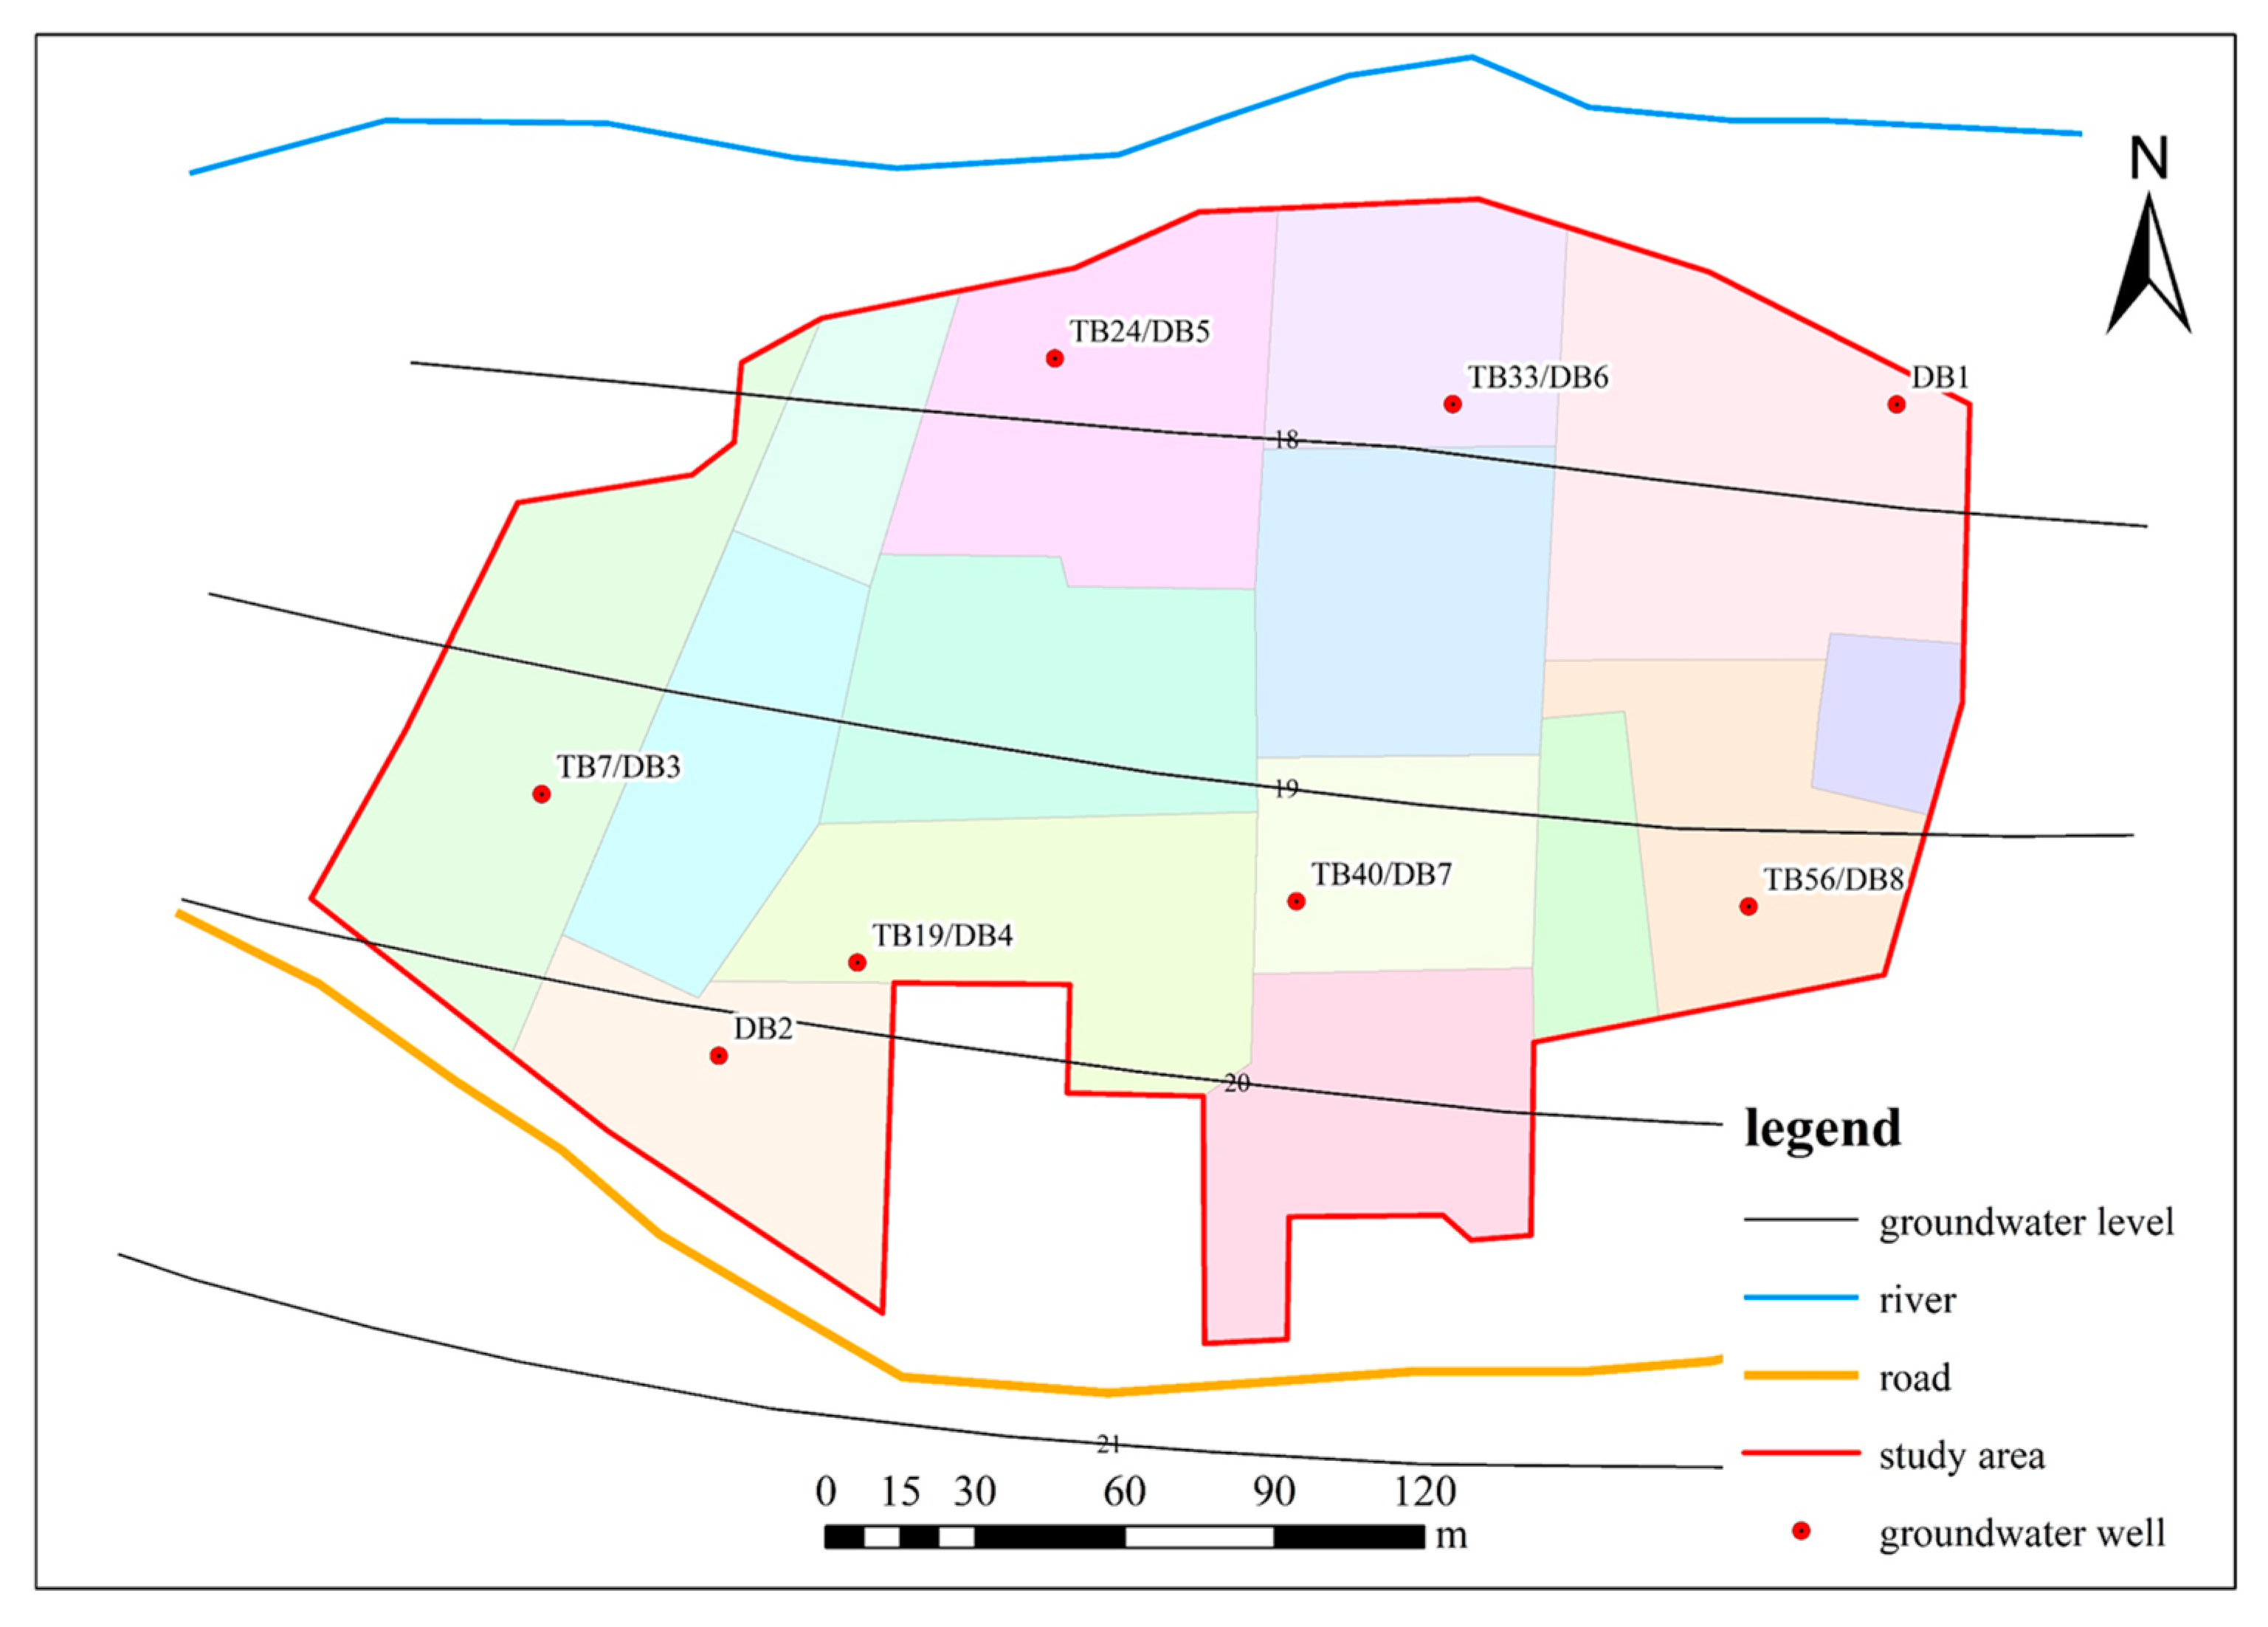
2. Overview of the Survey Area

The site selected in this paper was a riverside nonferrous metal smelter in WuZhou city, China (Figure 1), with an area of 49,086 m2. The production life of the factory was about 60 years. At present, all production activities have been stopped. Its main products were metal indium (refined indium), electrolytic zinc, zinc sulfate, and lithopone. The polluted site had a metal indium hydrometallurgy production line, and the zinc sulfate solution produced was used to produce lithopone and solid zinc sulfate. The waste residue of long-term production was randomly stacked in the factory, resulting in the serious heavy metal pollution of the soil and groundwater in the survey area. The geotechnical layers in the study area are miscellaneous fill, silty clay, boulder clay, and moderate breeze siltstone from top to bottom. Miscellaneous fill soil has the nature of upper stagnant water and receives recharge from atmospheric rainfall and surface runoff. The silty clay layer in the site is relatively water-resistant and has poor water permeability. The gravelly clay layer beneath the silty clay is the main aquifer, which contains moderate pore water and receives the lateral runoff from precipitation and groundwater, and finally drains to the surface river on the north side from south to north.
The river is located in the north of the study area, with a surface water catchment area of 329,700 km2 and a river slope of 1.14‰. According to hydrological historical records and statistics, the highest water level was 27.07 m, the maximum flow was 58,700 m3/s (10 July 1915), the lowest water level was 1.90 m (1 April 1902), and the minimum flow was 720 m3/s (3 March 1942). The average annual runoff is 213.3 billion m3, and the average annual sediment discharge is 69 million tons. The non-flood season is from January to March and October to December, and the flood season is from April to September. The lowest monthly average water level is in January and the highest is in July. The river exits from west to east, and the runoff is about 13 km. The river is rich in water resources, with domestic water and industrial and agricultural water consumption accounting for only 1.3% of the river’s annual average runoff.
The groundwater in the study area is divided into upper stagnant water and pore water. The dynamic characteristics of stagnant groundwater in the upper stagnant water are about 3.2–7.0 m in the depth of groundwater during the flat water period and 26.0–20.9 m in water level elevation, and the average thickness of the aquifer is about 3 m. Due to the discontinuous distribution of stagnant water in the upper stagnant water, the water-level dynamic changes greatly with the seasons, and the water abundance is poor. The initial groundwater depth of the pore water in the study area is 10.0–14.6 m; the water level elevation is 10.0–17.4 m; the stable water level depth of the pore aquifer is about 7.1–15.0 m, and the average aquifer thickness is about 6 m. Furthermore, it has a continuous and stable phreatic surface and medium water abundance, which is the main underground aquifer in the study area (Figure 2).

3. Materials and Methods

3.1. Hydrogeological Test

Hydrogeological tests are mainly pumping tests. The pumping test is a single-hole complete-well steady-flow pumping test. During the test, a stopwatch and electromagnetic flowmeter are used to record the time interval and the flow rate in the pumping process. There was no other observation hole in the test site, so the PW of the pumping well was directly treated as the observation hole, and a water-level meter was used to record water-level changes in the pumping well. The pumping well was DB1 (deep well 19.00 m, and the pumping test was carried out for 16 m). The test lasted for 4 h; the pumping steady flow rate was 12 m3·d−1, and the maximum drawdown was 4.10 m.

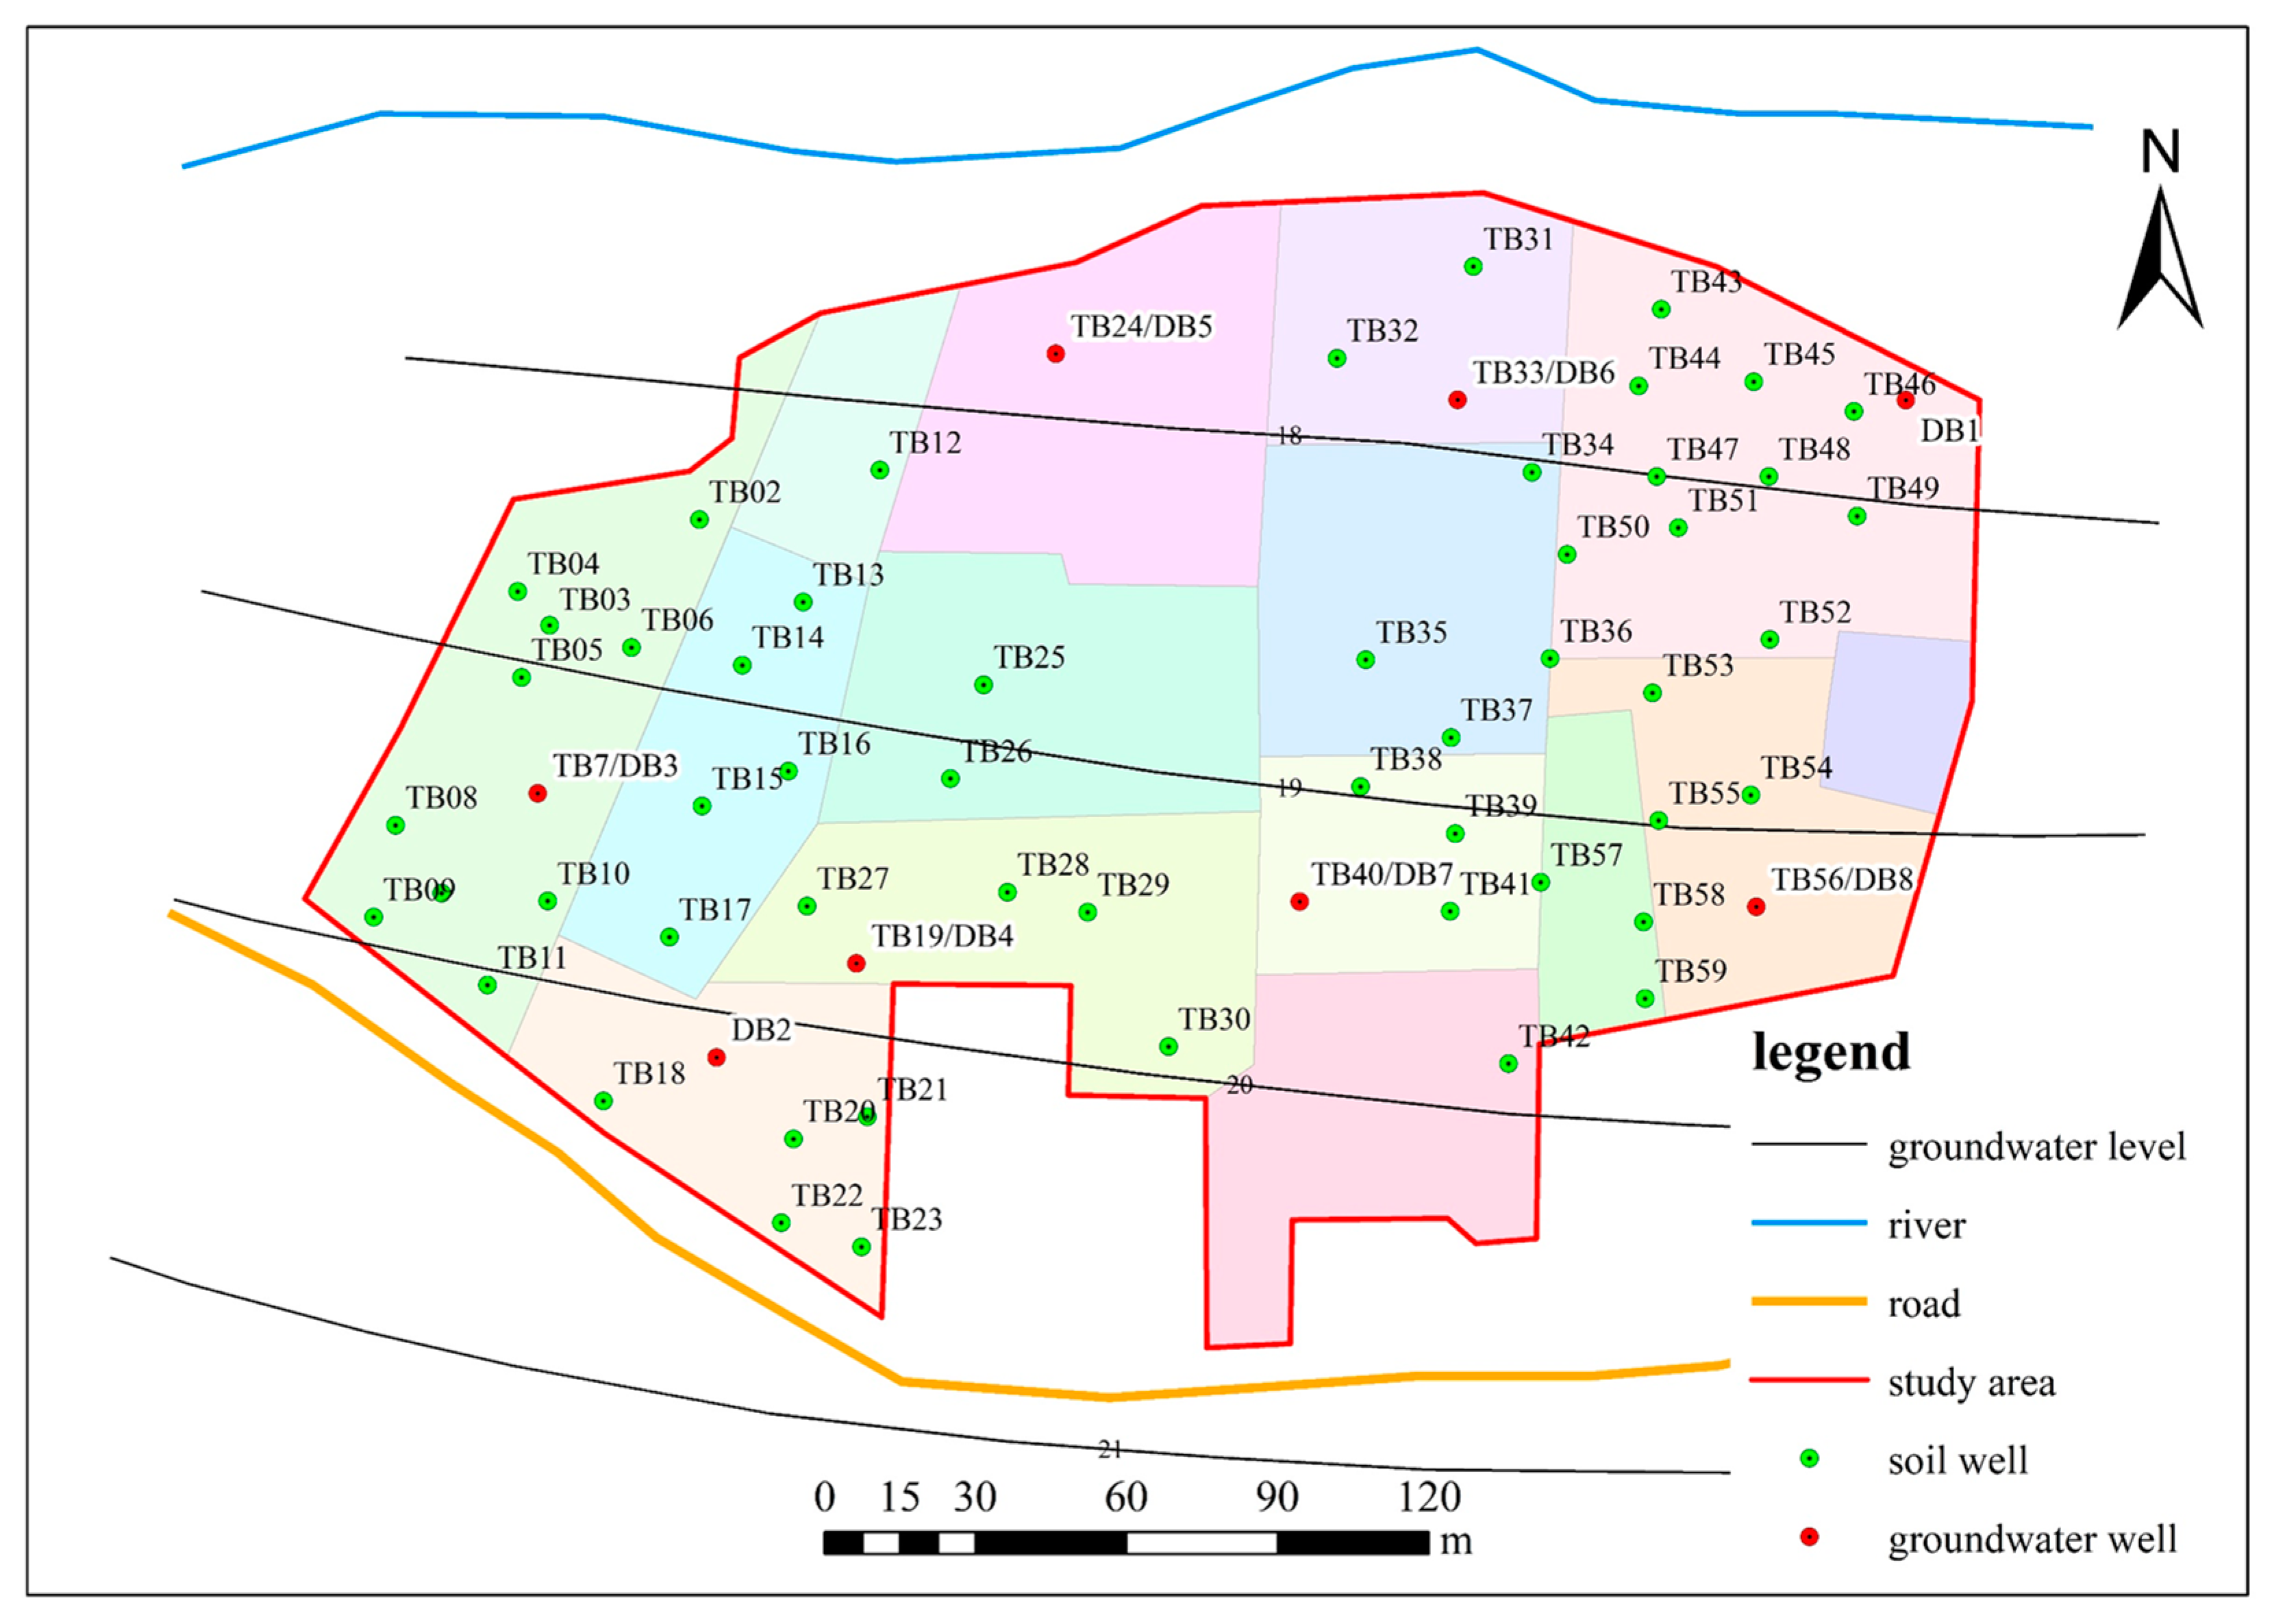
3.2. Soil and Groundwater Investigation

Combined with the use function and pollution characteristics of the site, the stratigraphic structure of the site was investigated. In this study, the impact drilling method was used to establish soil and groundwater monitoring wells and to collect geotechnical samples. During the investigation, 59 soil sampling points and 8 groundwater monitoring wells were designated, and 59 geotechnical samples were collected. The layout of the soil monitoring points was carried out by professional judgment for on-site layout and sampling, and the production workshop, solid waste stack, and its adjacent areas were encrypted. To monitor the vertical distribution of pollutants in the soil, 0–1 m, 1–3 m, 3–6 m, and 6–10 m samples were collected from each soil borehole, and a total of 236 soil samples were collected. The distribution of groundwater sampling points mainly adopted the radiation distribution method. Four groundwater monitoring points were set up near the southern boundary of the site, and four groundwater monitoring points were set up near the northern boundary of the site, that is, near the surface water body. A total of eight groundwater monitoring points were set up, and eight groundwater samples were collected. At the same time, to evaluate the aquifer hydrodynamic conditions and water-richness, groundwater monitoring well DB1 was pumped to test the aquifer permeability coefficient and unit water influx [23]. One geotechnical sample was collected from each soil borehole, and a total of 59 geotechnical test samples were collected to detect the characteristics of natural water content, natural pore ratio, permeability coefficient, bulk density, and particle size distribution in the soil, so as to provide a parameter basis for subsequent risk assessment. The specific site soil and groundwater point layout are shown in Figure 3.

3.3. Sampling Method and Preservation

In the vertical direction, the sampling depth of soil sampling points was 0–10 m below the hardened layer. The soil samples were drilled by a drilling rig, and the soil columns of the sampling points were sampled in layers. A sample was collected at 0–1 m, 1–3 m, 3–6 m, and 6–10 m, respectively. After the samples were numbered, they were packed in polyethylene sealed bags to avoid loss, confusion, and contamination and stored in a low-temperature incubator at 0–4 °C. Before collecting samples, all drilling equipment, sampling devices, and other tools needed to be cleaned to prevent cross-contamination during the sampling process. After sampling, samples were transported to the laboratory for testing. According to the groundwater survey layout scheme, monitoring wells were arranged to collect groundwater samples. The concentration of heavy metals in groundwater was tested to determine the distribution characteristics of groundwater pollution at the site. To ensure the collected water sample was representative, the monitoring well was washed before sampling. After the water level recovered, the pH, conductivity, dissolved oxygen, water temperature, redox potential, and turbidity were monitored on site, and the groundwater samples were collected after the various water-quality parameters tended to be stable. Groundwater was placed in brown wide-mouth bottles with preservatives, sealed, labeled with sampling information, and promptly stored in a low-temperature incubator at 0–4 °C. After sampling, the samples were be transported to the laboratory for testing within the specified time and combined with field pumping test data to determine the aquifer permeability coefficient.

3.4. Sample Detection and Quality Control

After removing debris, drying, and grinding in the laboratory, the collected soil samples were sieved with 0.075 mm nylon. The detection indicators were the characteristic pollutants identified by the previous pollution, including As, Cd, Cu, Hg, Ni, and Pb. Among them, Ni, Pb, Cd, and Cu were measured by an AAS240 atomic absorption spectrophotometer, and As and Hg were measured by an AFS–2202E atomic fluorescence photometer. The detection of groundwater samples was carried out according to the requirements of the Groundwater Quality Standard (GB/T14848–2017). Furthermore, the ion components of As, Cd, Cu, Hg, Ni, and Pb were tested with an inductively coupled plasma spectrometer (ICP–OES, ICAP6300 model).
The reagents used in the testing process were high-grade pure, and the corresponding national quality standards were used for quality control. For ensuring the authenticity and reliability of the experimental data, parallel samples and blank samples were added to the test samples, and the relative deviation of parallel blank samples was required to be less than 10%. The test procedure strictly abided by the test operation specification to reduce the chance of error, so that the parallel sample error was controlled within the permissible range to ensure the stability of the experimental process and the precision of the experimental data.

3.5. Human-Health Risk Assessment Methods

For the human-health risk assessment method of As and Cd heavy metals in soil, the following models are selected for human-health risk assessment. We take into account three exposure routes: ingestion, cutaneous contact, and soil particle inhalation. The three exposure pathways mentioned above can be estimated using average daily doses (ADD), which is calculated as follows:
ADD ing = C × Ing R × CF × EF × ED BW × AT
ADD derm = C × SA × SL × ABF × CF × EF × ED BW × AT
ADD inh = C × Inh R × EF × ED PEF × BW × AT
where ADDing, ADDderm, and ADDinh are, respectively, the daily dosages of soil particles received from oral exposure, dermal contact, and inhalation, mg/(kg·day); C is heavy metal content, mg/kg; IngR is the daily uptake rate, m3/day; CF is the conversion factor, kg/mg or m3/cm3; InhR is the daily absorption rate, m3/day; EF is the annual exposure frequency, d/a; ED is the exposure duration, a; BW is the mean body weight, kg; AT is the mean duration of action, d; PEF is the soil particulate production factor, cm/h; SA is the dermal exposure area, cm2; SL is the skin adhesion factor, mg/(cm2/day); ABF is the skin adsorption factor.
The risk characterization of site heavy metal pollutants, usually the health risk of heavy metals to humans, mainly includes two aspects, carcinogenic effects and non-carcinogenic effects, and the calculation formula is as follows:
CR = ADD × SF
HI = ADD RfD
where CR is the carcinogenic risk; SF is the slope factor; HI is the non-carcinogenic risk; RfD is the reference dose for the non-carcinogenic heavy-metal-exposure pathway. The risk assessment parameters for As and Cd in soil are shown in Table S1.
For heavy metal Pb, the blood lead concentration level evaluation model is generally used for health risk assessment. In this paper, the integrated exposure uptake biokinetic model for lead in children (IEUBK) [24,25], developed and recommended by the US National Environmental Protection Agency (EPA), is used.
The riverside active population is mainly adults and children, so there are four main ways for lead (Pb) in the soil of the study area to enter the human body: children’s intake of outdoor soil Pb, intake of indoor dust Pb, inhalation of air Pb, and drinking water Pb. Using the above model, the probability of children’s blood lead level > 10 μg/dL in the area is obtained by substituting the data. If the probability is less than 5%, it can be judged as having no safety and health risk, and if the probability value is greater than 5%, the judgment is beyond the acceptable health-and-safety risk category for children.
Later, by localizing the data parameters, the method will be used to assess the human-health risks of Pb exposure in children. The absorption of Pb in various environmental media and the total amount of Pb that may be absorbed into children are calculated as follows:
IN soil , outdoor = C soil × WF soil × IR soil + dust
IN dust = C dust , resid × 1 WF soil × IR soil + dust
IN air = C air × VR
IN water = C water × IR soil + water
UP T = ABS diet × IN diet + ABS dust × IN dust + ABS soil × IN soil + ABS air × IN air
where Csoil is the Pb concentration in soil, μg/g; Cdust,resid is the Pb concentration in dust, μg/g; Cair is the Pb concentration in air, μg/m3; Cwater is the Pb concentration in water, μg/L; IRsoil+dust is the daily soil and dust intake of children, g/day. IRwater is the daily water intake of children, L/day. The bioavailability factors for Pb in selected ingested soil and dust, through ingestion, through ingested water, and through the inhalation of air were 30%, 40% to 50%, 60%, and 20% to 40%, respectively. The risk assessment parameters for Pb in soil are shown in Table S2.

3.6. Ecological Health Risk Assessment Method

A conceptual model of the groundwater aquifer was constructed by FeFlow 7.0 to simulate the movement of groundwater and solute in the aquifer with time [26]. When using the numerical simulation method to simulate groundwater flow and solute transport, it is usually necessary to generalize and assume the aquifer to a certain extent to meet the calculation of numerical simulation software:
a: The model aquifer is homogeneous, and the aquifer is isotropic, that is, the hydrogeological parameters of the aquifer are consistent in the three-dimensional direction;
b: Groundwater movement is dominated by horizontal movement, and this study does not consider the exchange and movement of groundwater in the vertical direction and treats groundwater movement as a two-dimensional steady flow in the diving plane, which obeys Darcy’s law;
c: The aquifer mainly receives lateral inflow recharge and rainfall infiltration recharge from the upper reaches of the region, and groundwater evaporation is considered during operation; the discharge method is that groundwater is discharged downstream, and the aquifer has gravity water release;
d: The solutes in the model are heavy metal pollutants, and the model considers the maximum risk, ignores the adsorption–desorption and dissolution in the solute migration process, ignores the reaction and decay of the solute in the aquifer, and only considers the convective dispersion of the solute in the lateral and vertical directions. The simulation parameters are obtained based on hydrogeological tests.
(1) Mathematical model of groundwater flow
By analyzing the hydrogeological conceptual model, based on the equation of seepage continuity and Darcy’s law, we establish a two-dimensional unsteady flow mathematical model corresponding to the simulation area:
x K x h H x + y K y h H y + w = μ s H t
H x ,   y ,   0 = H 0 ,   x ,   y Ω
H x ,   y ,   t = H 1 ,   x ,   y S 1
K H n | S 2 = q x ,   y ,   t ,   x ,   y S 2
where Ω: groundwater seepage area, dimension: L2; H0: initial groundwater level, dimension: L; H1: designated water level, dimension: L; S1: first kind boundary; S2: the second boundary; μs: unit water storage coefficient, dimension: L−1; h: aquifer thickness, dimension: L; Kx, Ky: permeability coefficient in the x and y principal directions, respectively, dimension: LT−1; w: source-sink term, including evaporation, recharge by precipitation infiltration, and well pumping, dimension: T−1; q(x,y,t): indicates the flow rate at different locations at the boundary at different times, dimension: L3T−1; ∂H/∂n: denotes the component of the hydraulic gradient on the boundary normal.
(2) Solute transport model
Assuming that the transport of the solute in the aquifer conforms to Fick’s law, the transport of the solute in the groundwater aquifer is calculated by the coupling of the groundwater flow mathematical model and the solute transport model. The partial differential equation of solute transport is as follows:
R c t = C x Dij c x j + q s θ C S λ C + ρ b θ   C ¯ x i V i C
where C: dissolved phase in groundwater and the concentration of contaminants dissolved in water, kg/L3; Dij: hydrodynamic diffusion coefficient tensor, L/T2; xi: coordinates of migration, m; vi: groundwater seepage velocity, m/T; qs: unit flow rate of the source or sink (general source is positive; sink is negative), 1/T; θ: porosity, dimensionless; Cs: the concentration of the source or sink, M/L3; λ: first-order reaction rate constant, 1/T; ρb: specific gravity of the porous medium, M/L3;   C ¯ : the concentration of pollutants adsorbed on the aqueous medium in the aquifer, kg/L3; R: adsorption retardation factor, dimensionless; T: time, T.

3.7. Data Processing and Analysis

The experimental data processing and statistical analysis were mainly completed by Excel, including data processing and analysis. The spatial characteristics of the data were analyzed by Surfur 11.0, including the spatial interpolation of the total amount and content of each target pollutant. Groundwater pollution migration simulation prediction analysis used FeFlow 7.0.

4. Results and Discussion

4.1. Site Hydrogeological Parameters

The pumping test is an important method to determine aquifer parameters in the field. The boulder clay is the main aquifer, which contains moderate pore water and is widely distributed in the study area. Therefore, this pumping test is mainly carried out in the boulder clay layer. In this pumping test, there were no observation holes, and the aquifer parameters were calculated based on the experimental data of the pumping wells, and the aquifer parameters were determined by the Dupuit formula.
The Dupuit formula method [27] is a commonly used method for determining aquifer parameters in hydrogeological surveys and is shown as Equations (16)–(18).
0.732 Q 2 H s s lg R r = K
R = 2 s HK
T = KH
where K (m·d−1) is the hydraulic conductivity; Q (m3·d−1) is the water yield of the pumping well; s (m) is the drawdown of the water level when the pumping well is stable; R (m) is the influence radius; r (m) is the pumping well radius; H (m) is the thickness of the water-table aquifer; T (m2·d−1) is the transmissivity.
The trial calculation method was adopted in this work. Since the water-level data at the steady state was used in the Dupuit formula, the pumping flow was represented as the final stable flow. The r, Q, H, and s were 0.11 m, 12 m3·d−1, 6 m, and 4.1 m, respectively. The R and K were calculated to be 21 m and 1.09 m·d−1, respectively.

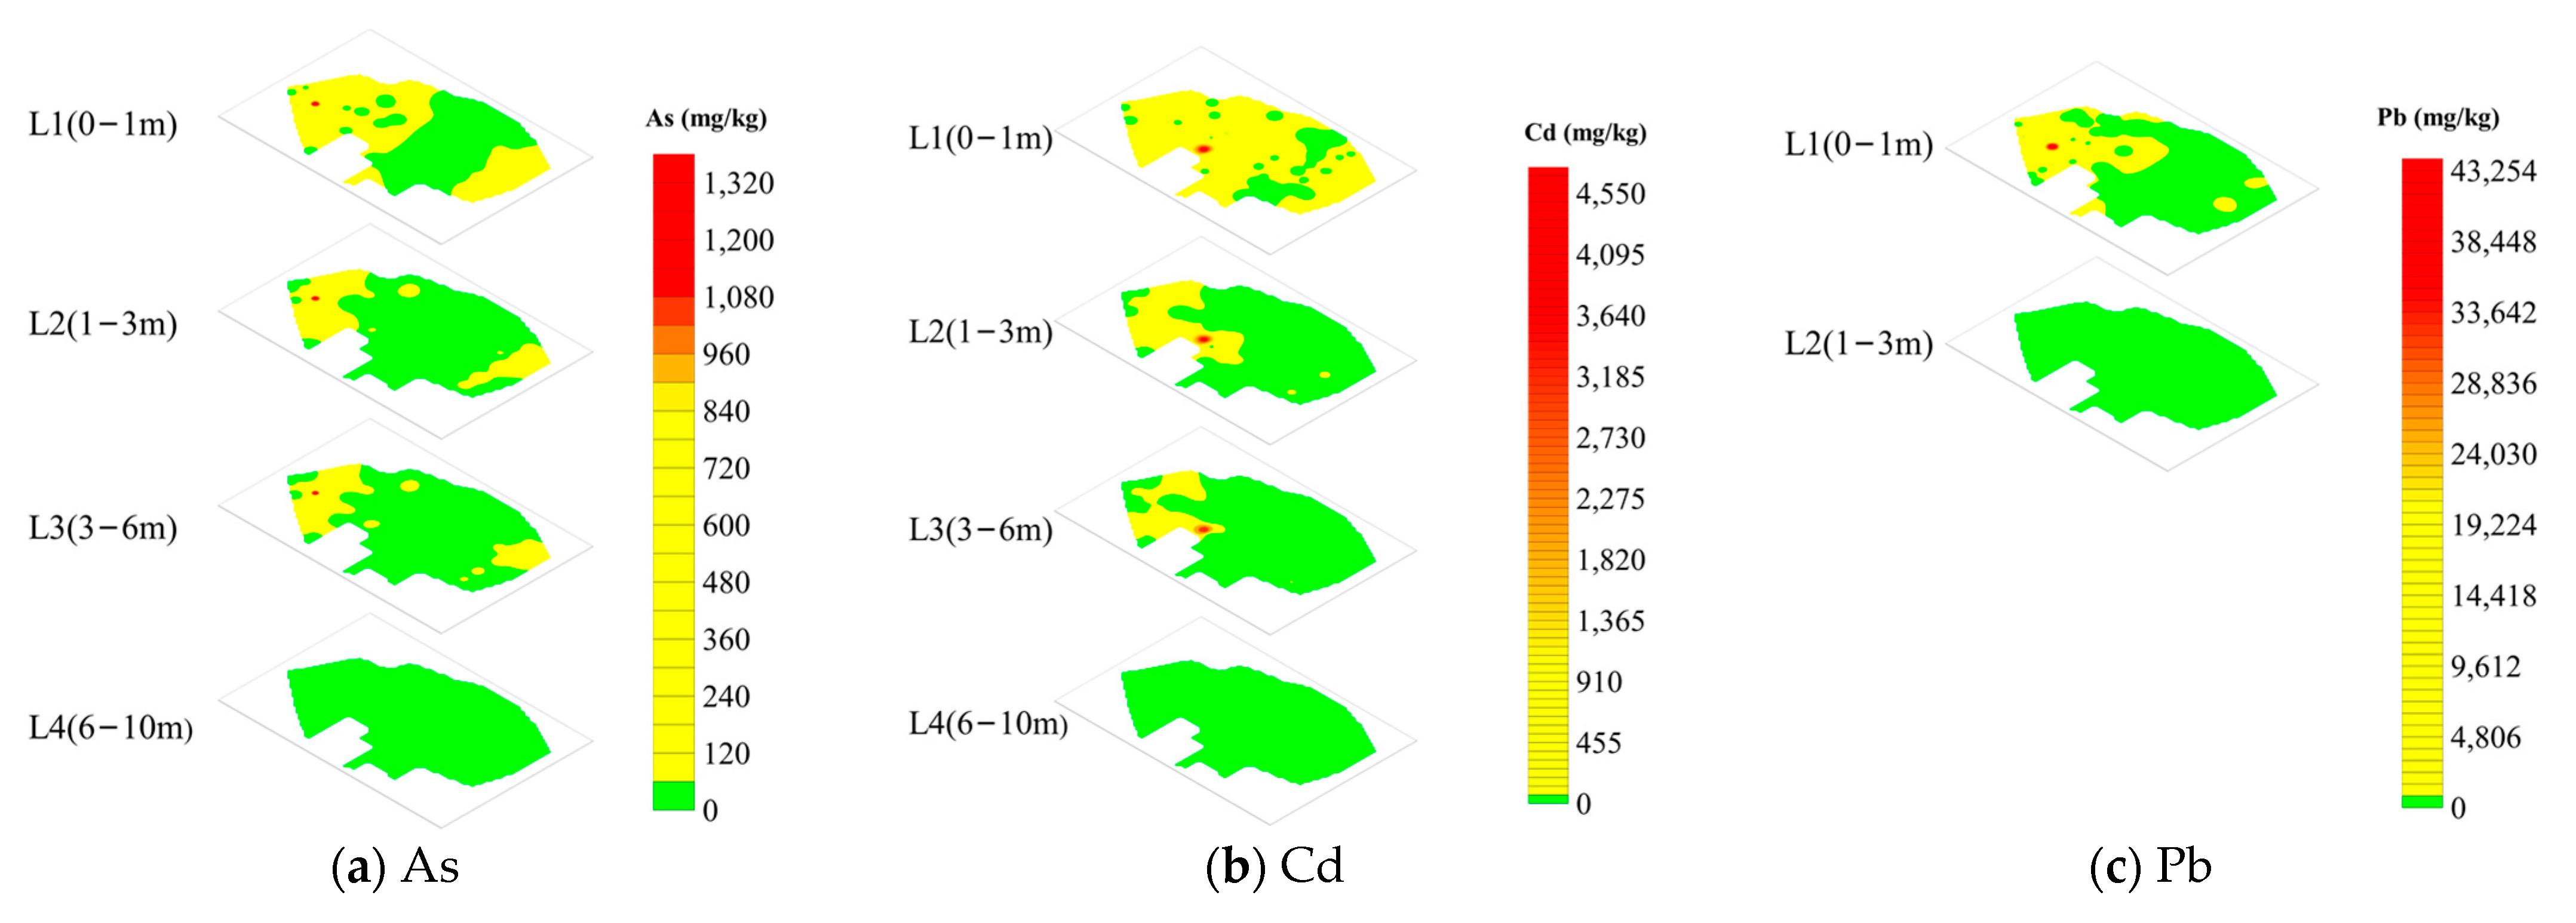
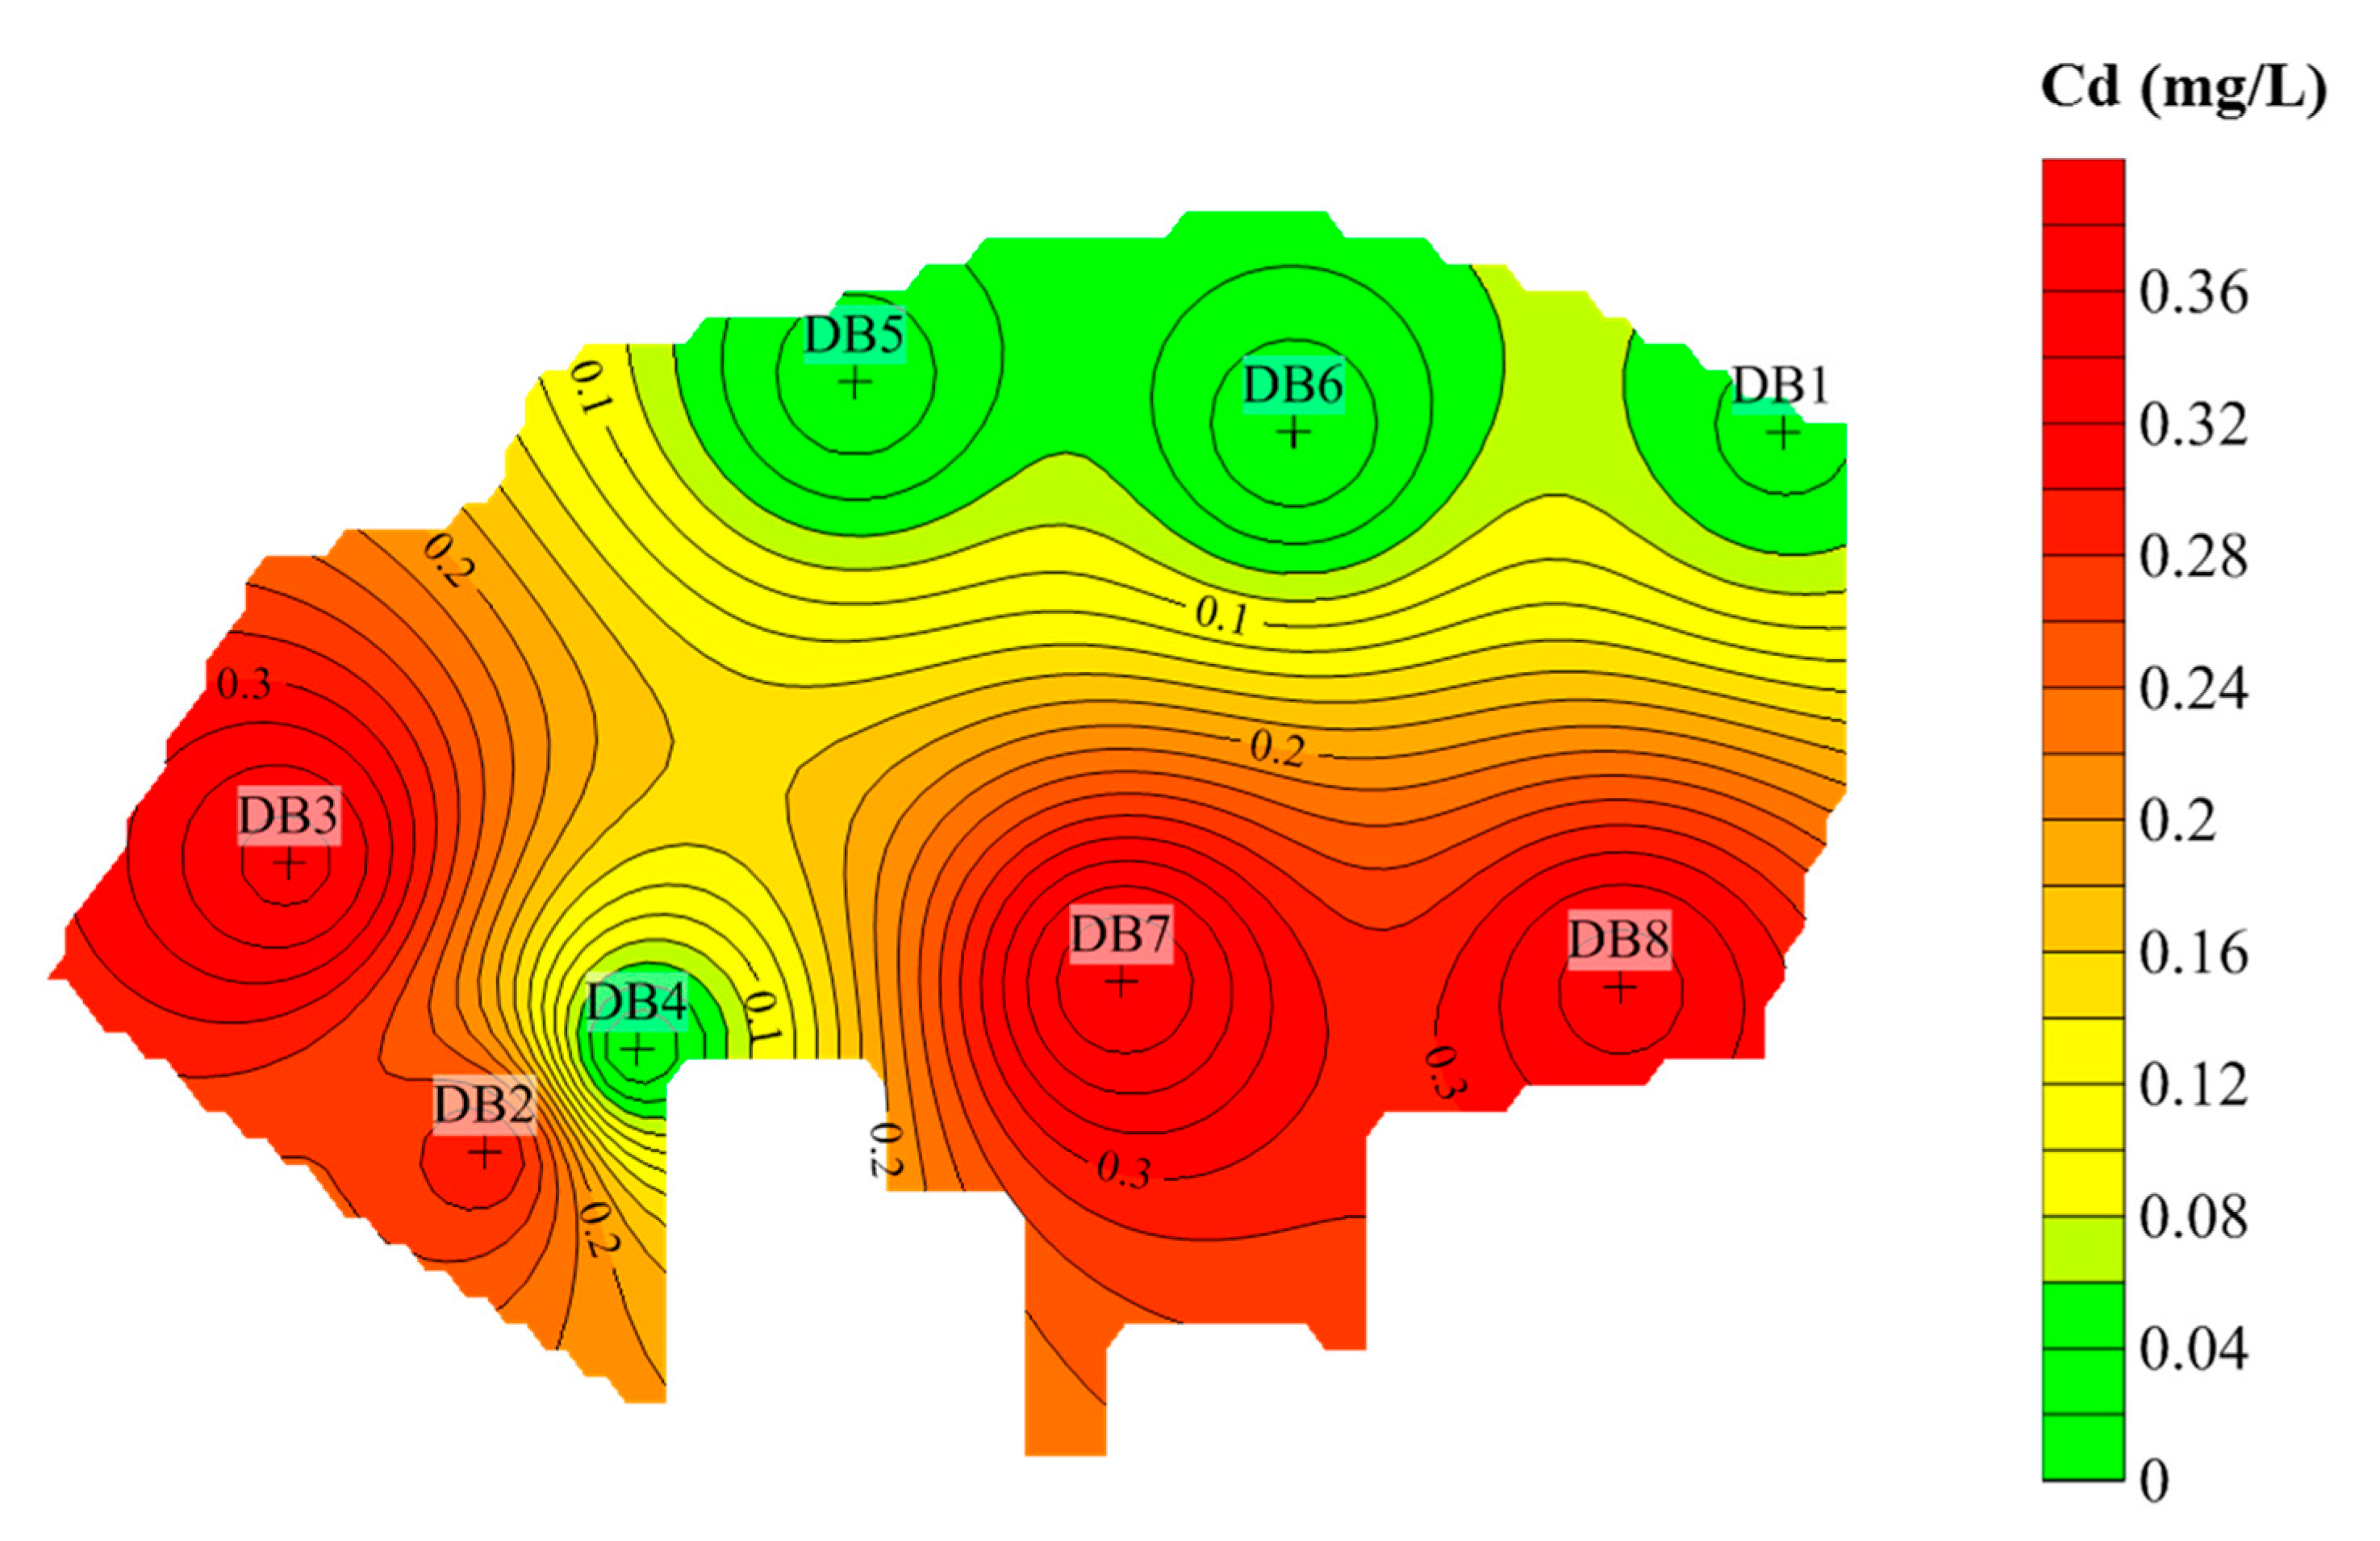
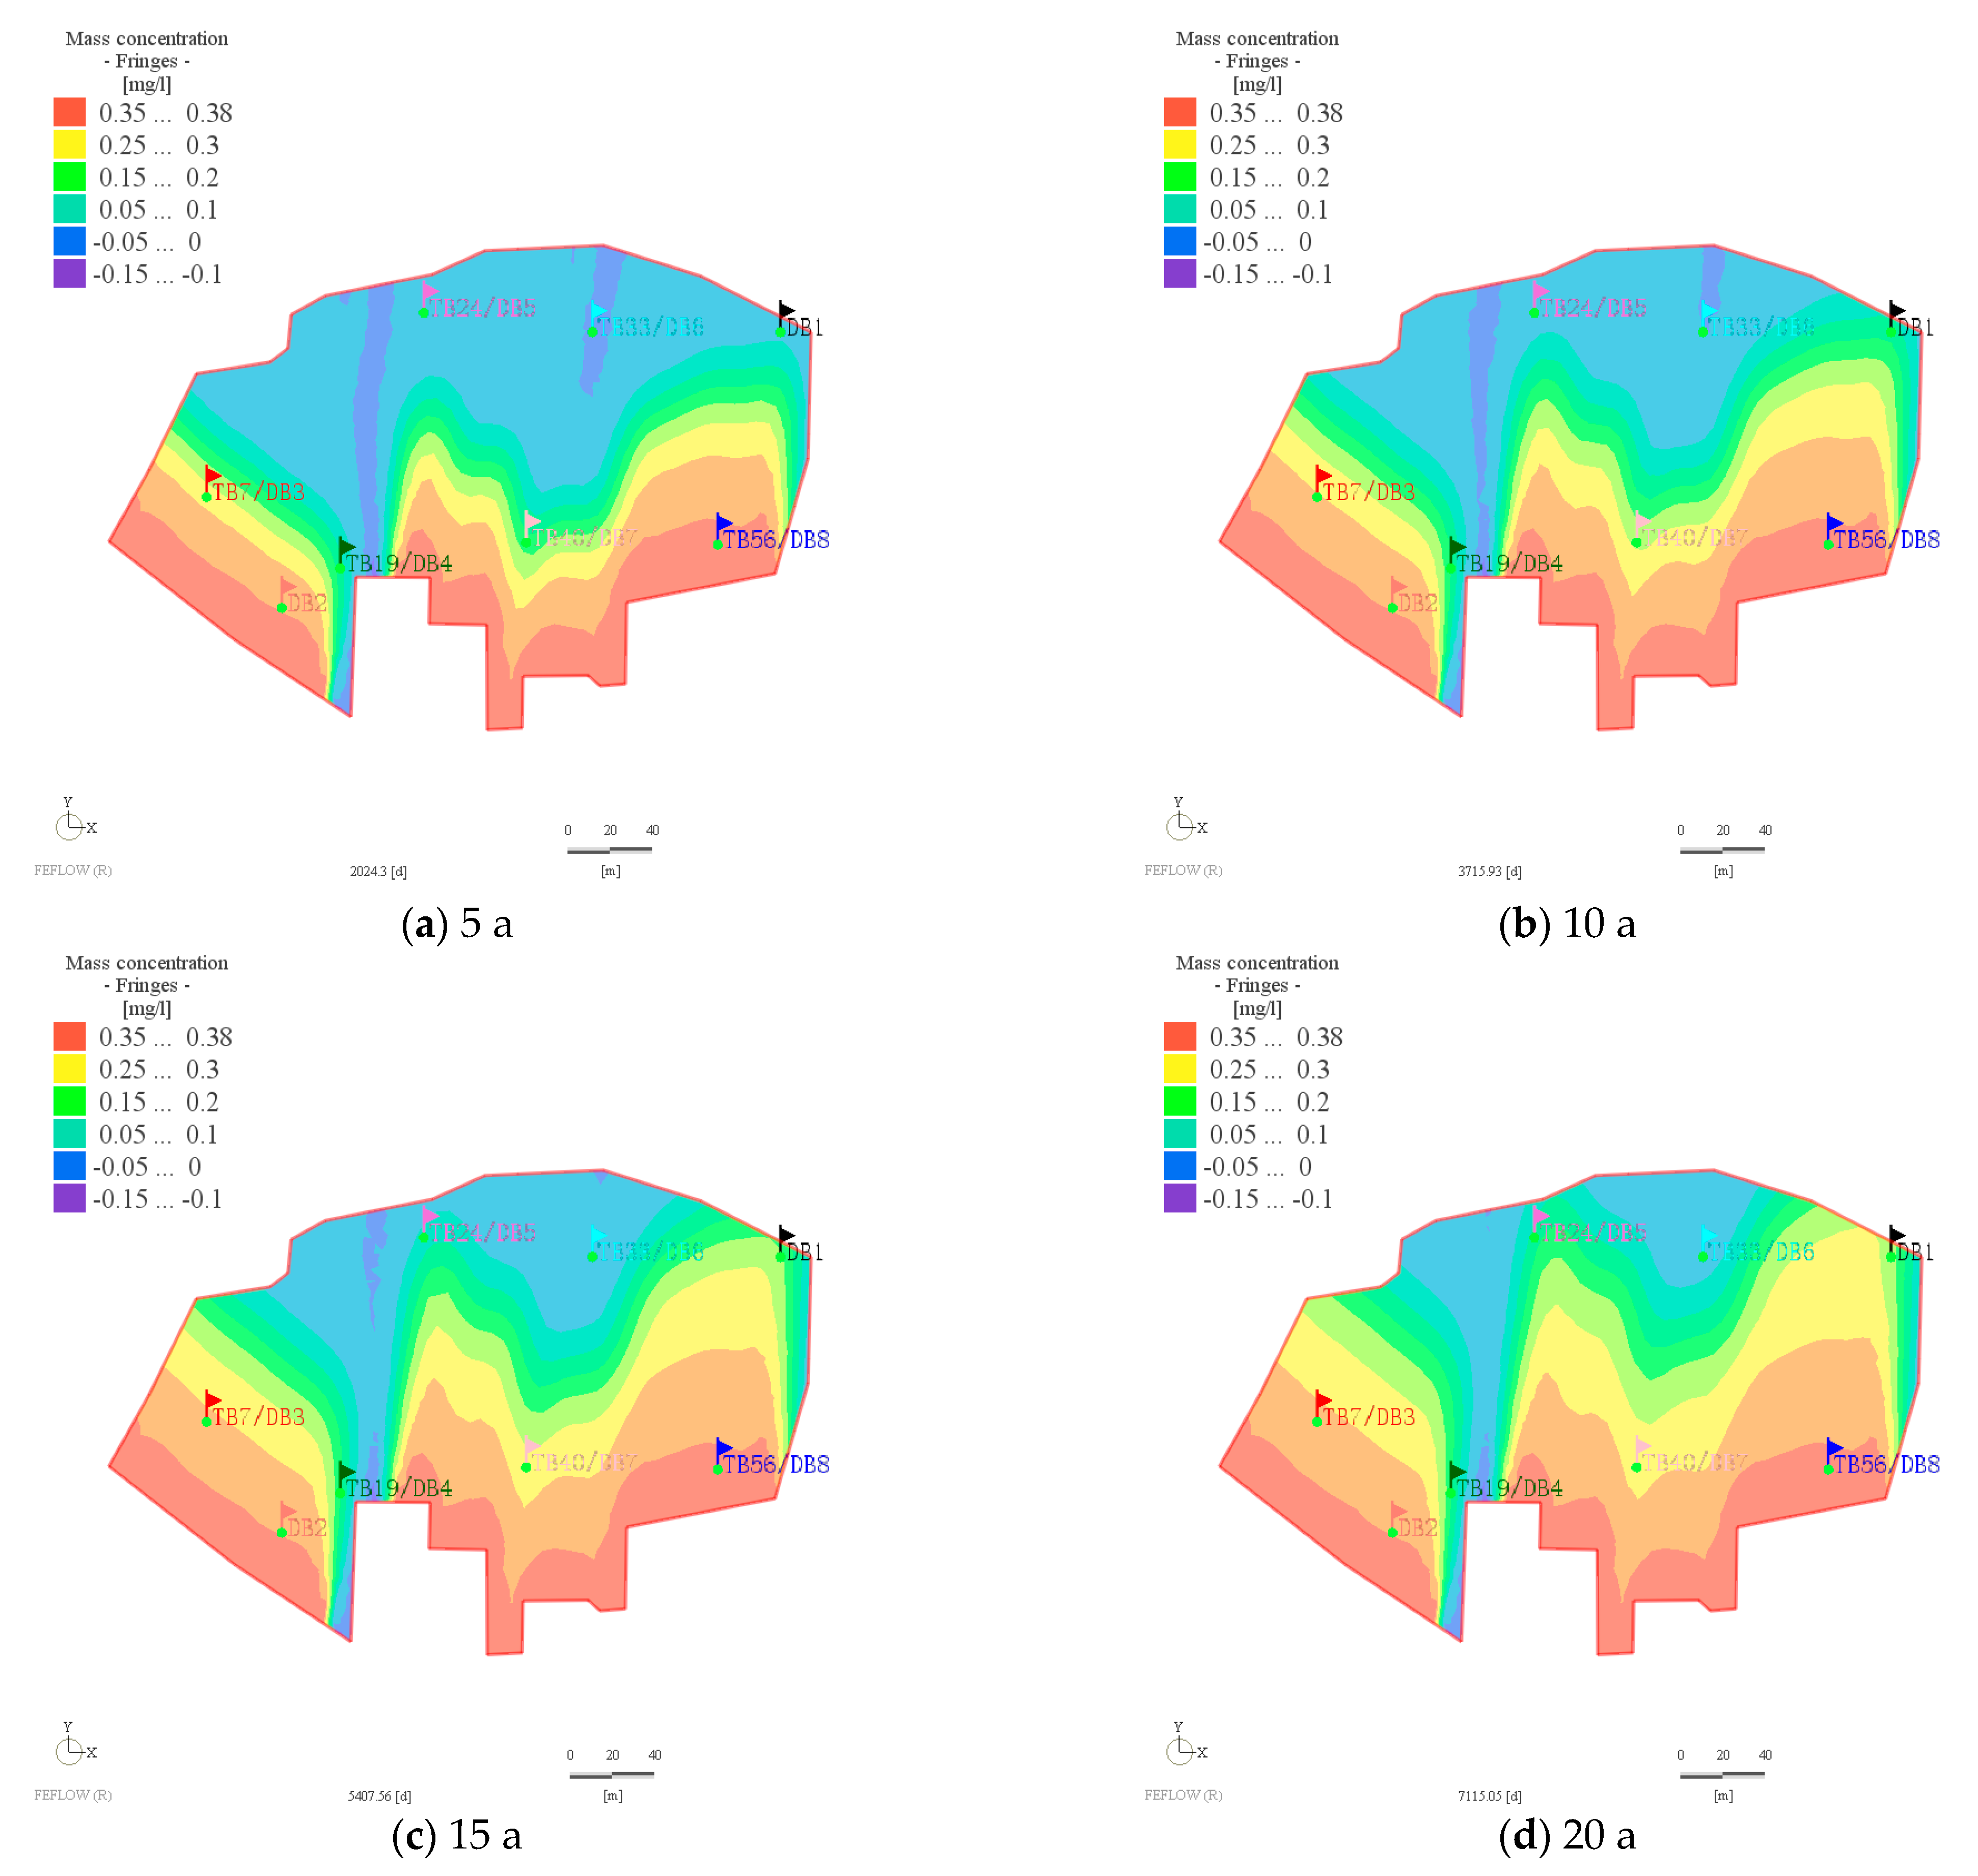
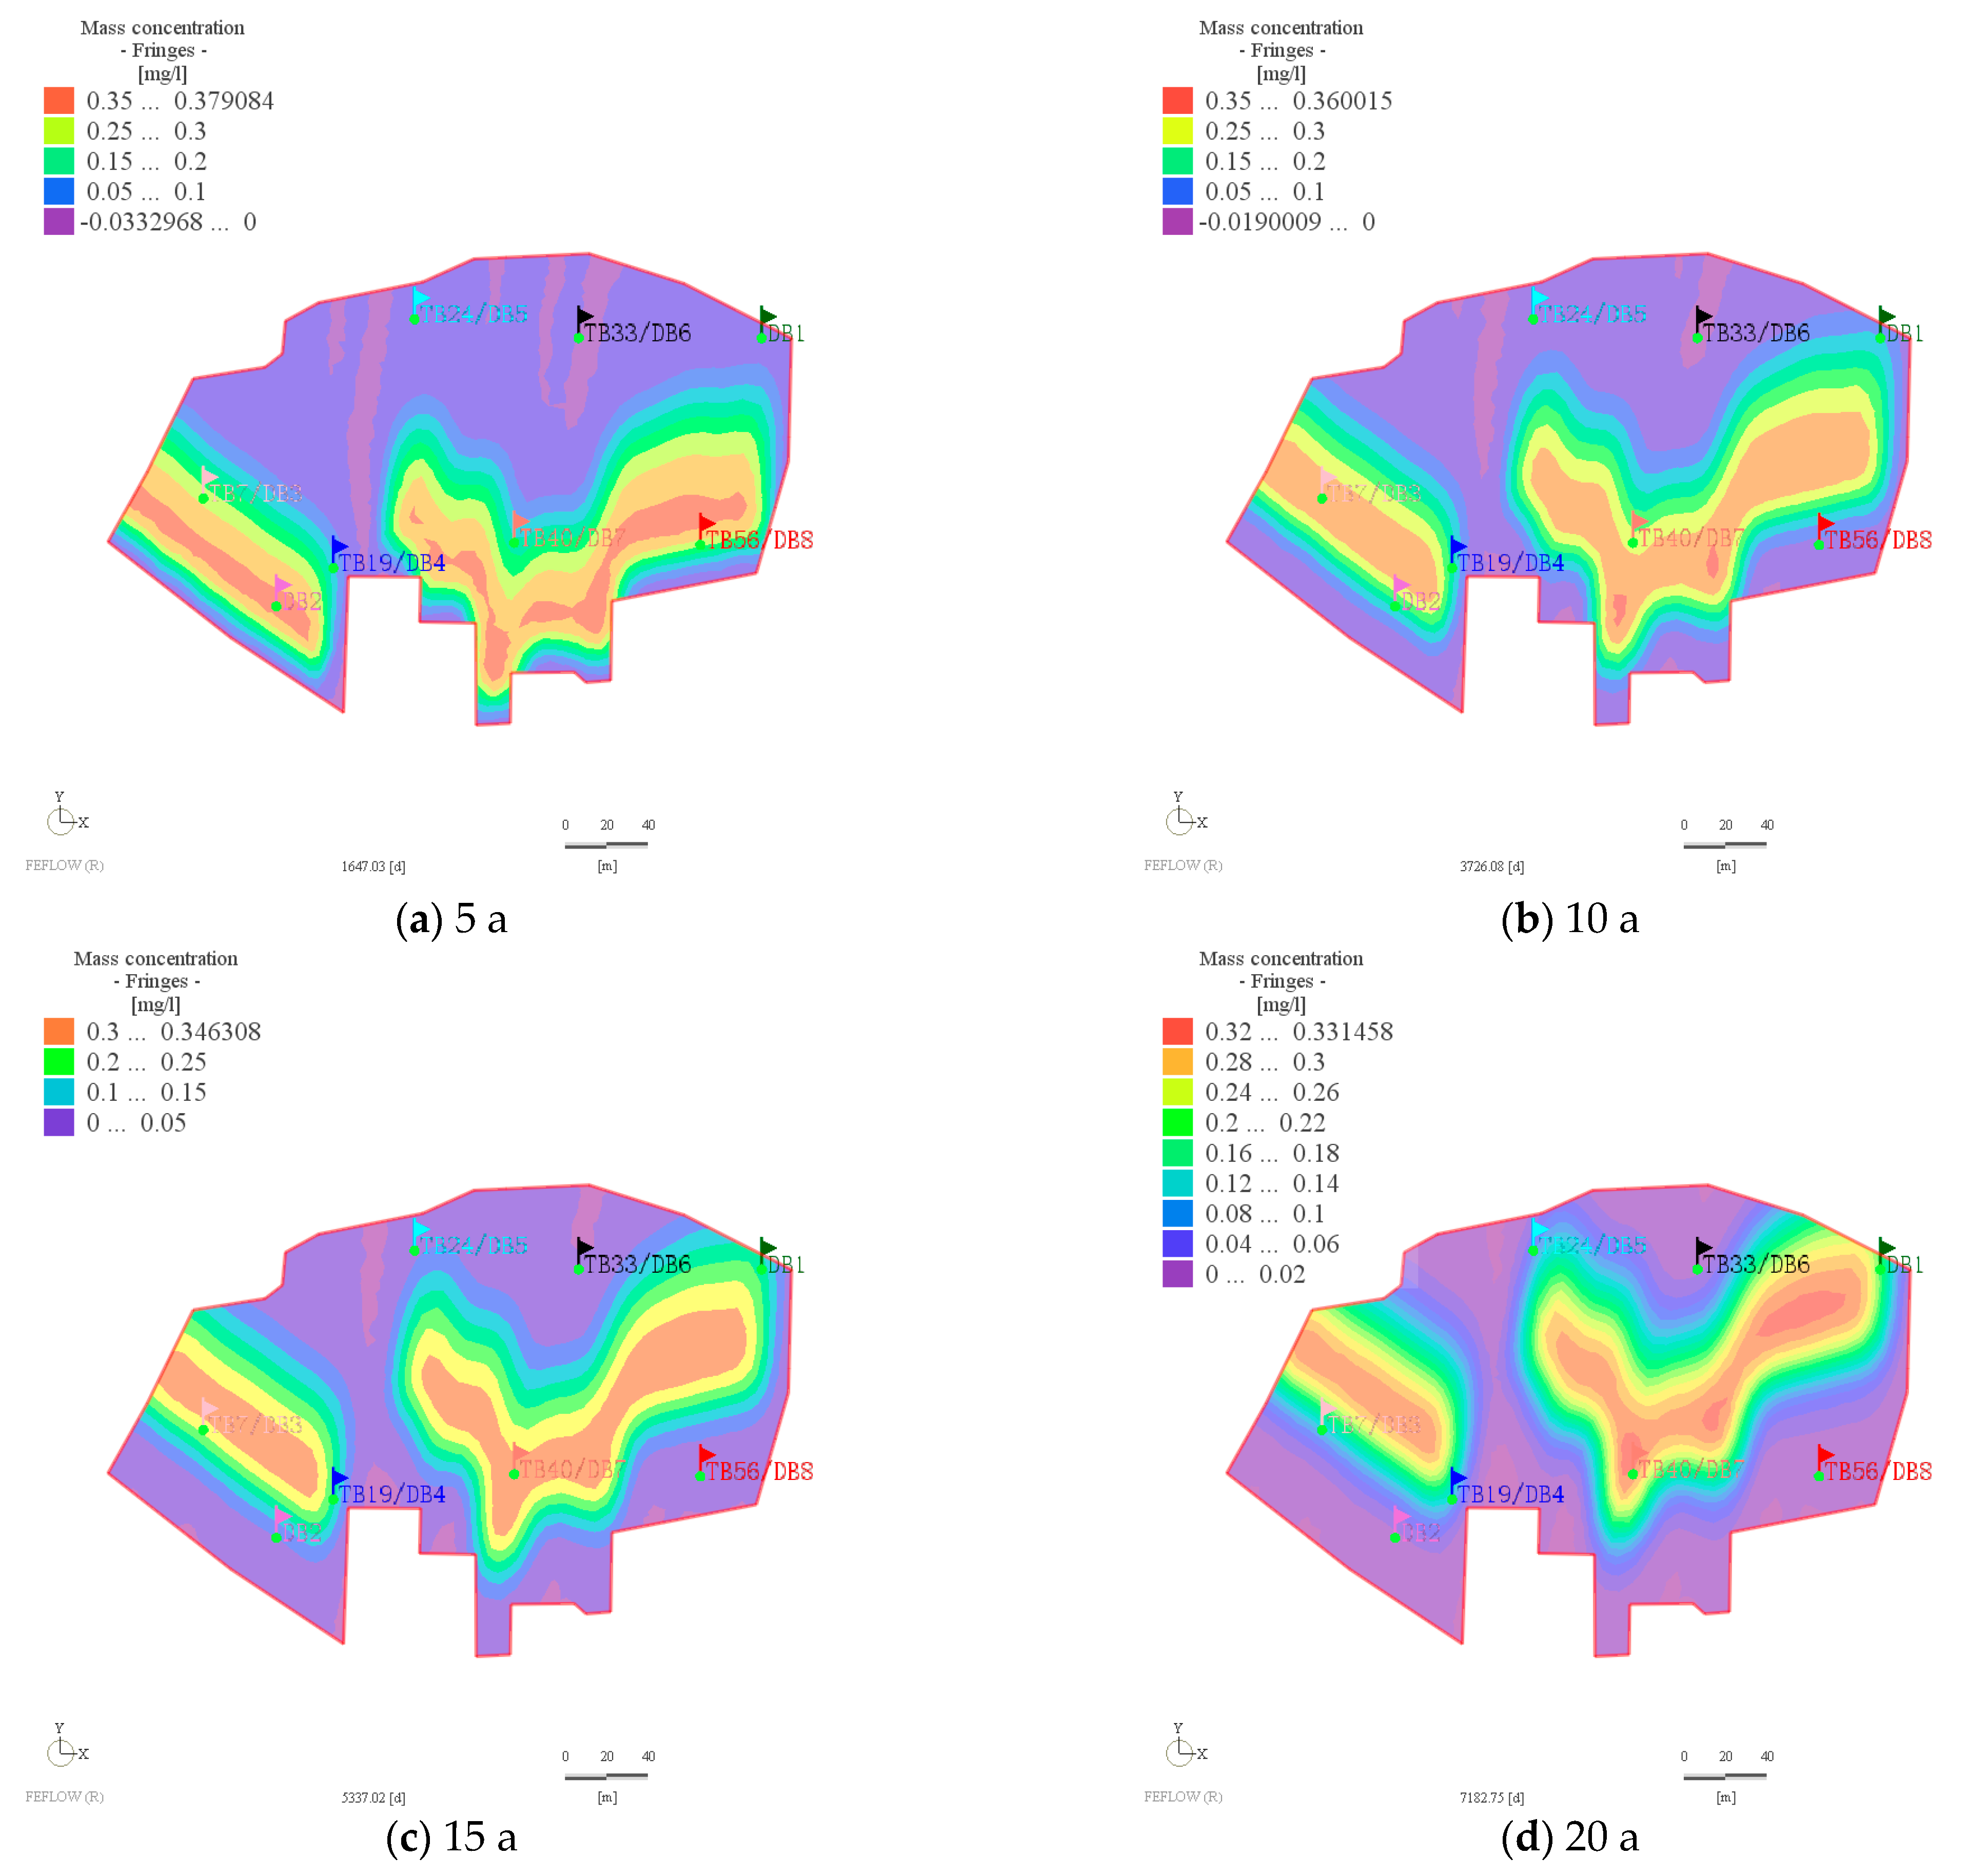
4.2. Site-Distribution Characteristics of Heavy Metal Pollution

In this study, the standard values of soil environmental quality were selected from the China Environmental Quality Standard for Soil (GB36600-2018, Grade II), and those of groundwater environmental quality were selected from the China Quality Standard for Groundwater (GB14848–2017, Grade IV).
(1) Distribution characteristics of heavy metal pollution in the soil
The main soil pollution factors exceeding the standard in the study area were As, Pb, and Cd. The content of As varied from 1.67 to 1586.05 mg/kg, with an average value of 77.61 mg/kg and the maximum extra standard was 25.43 times. The variation range of Pb content was 6.72–46,868.80 mg/kg; the average value was 264.19 mg/kg, and the maximum extra standard was 57.59 times. The counterpart Cd were 0.18–4556.00 mg/kg, 83.86 mg/kg, and 69.09 times, respectively. A distribution map of soil heavy metal pollution was produced by the inverse distance interpolation method through surfer 11.0 software and is shown in Figure 4.
It can be seen from Figure 4 that the heavy metal pollution in the soil was mainly distributed in the production area and the waste storage area of the site, and this may be due to the improper management of enterprises; the waste water and slag were discharged at will in these areas, resulting in the infiltration of the leachate into the soil and becoming the main pollution source. The vertical characteristics of soil heavy metal concentrations of As, Cd, and Pb at each sampling station showed a general trend of decreasing soil heavy metal concentrations with increasing depth, and the peaks of each heavy metal concentration occured in the first (0–1 m) soil layer. The concentration of heavy metals in the second layer of soil (1–3 m) at each point was lower than that in the first layer, which may be related to the hydraulic conductivity of the soil and the significant adsorption and resolution effect [28]. Heavy metals in soils could be infiltrated from the soil surface by precipitation leaching and subsequently migrate deeper into the soil driven by gravity, but they were trapped by adsorption in the low-permeability and more-adsorptive soil layers during migration. Therefore, the concentration of heavy metal in the third layer of soil (3–6 m) was further reduced, and the counterpart fourth layer of soil (6–10 m) was lower than the standard limited value.
The concentration of heavy metals, As, Cd, and Pb, in the soil was the highest in the southwest of the site, which was mainly composed of slag heaps and production workshops. It may be caused by the continuous infiltration of the leachate generated by the leaching of the waste residue into the soil. This indicates that the soil was greatly affected by the production activities of the site. However, with the increase of depth, the structure of the soil layer changes, the hydraulic conductivity decreased, and the adsorption capacity increased. Therefore, heavy metals in the soil were mainly accumulated in the surface layer.
(2) Distribution characteristics of heavy metal pollution in the groundwater
The main products of this enterprise are lithopone and solid zinc sulfate, resulting in the concentration of zinc and barium being higher than other heavy metals. However, it is worth mentioning that, among all the detected indices, the pollutant in the groundwater sample that exceeded the standard was Cd, and the concentration was between 0.0027 and 0.3790 mg/L. The maximum value exceeded the standard limit (0.01 mg/L) by 38 times. The corresponding points were DB2, DB3, DB7, and DB8 (Table 1). The concentrations of other points were less than the limit value. This indicates that the groundwater in the study area has been polluted by the heavy metal Cd.
The distribution map of groundwater heavy metal pollution produced by the inverse distance interpolation method through surfer 11.0 software is shown in Figure 5. Groundwater pollution was mainly distributed at the southern boundary of the study area, and the exceeding standard points were basically located in the slag heap and production workshop. This may be due to the poor management or improper operation of the enterprise in the production process, resulting in pollutants entering the groundwater aquifer and affecting the groundwater quality of the site.

4.3. Human-Health Risk Assessment

For the heavy metal pollutants in the soil, As and Cd, their main exposure pathways were determined to be mouth-intake-soil, skin-contact-with-soil, inhalation of soil particles, and the inhalation of earth pollutant steam.
According to the calculation results, the total carcinogenic risk of the soil pollutants As and Cd in the study area through all exposure pathways exceeded 10−6 of the acceptable carcinogenic risk limit, and the non-carcinogenic hazard quotient exceeded 1 of the acceptable standard limit. Therefore, there is human-health risk in the research soil, and it is necessary to carry out remediation or risk control on the soil.
The maximum concentration of Pb in the soil of the site was 46,868.80 mg/kg, which was substituted into the IEUBK model to calculate the probability that the blood Pb concentration in children exceeded 10 μg/dL. It has been found that the probability was as high as 100%, far higher than the specified safety probability limit of 5%. It indicates that there is a high risk to human health for Pb in the research site.
In summary, there is a high risk to human health for soil in the study area, and it is urgent to clean and remediate the soil; the methods of solidification and stabilization are recommended for the remediation of contaminated soil to reduce the risk to human health. As the groundwater was not developed or utilized in the site, there is no exposure pathway and no human health risk in the groundwater.

4.4. Ecological Health Risk Assessment

FeFlow software was used to construct the numerical modeling of groundwater in the study area, which can identify and predict the ecological health risks. The simulated area of this study area is 49,086 m2, which is discretized into irregular triangular mesh by a triangular prism method. The acquisition of a groundwater flow field and hydrogeological parameters was based on the results of earlier groundwater investigation and a pumping test. Based on this groundwater flow field, solute transport simulation was carried out. The obtained groundwater flow-field map in the study area is shown in Figure 6.
The solute transport model is run using FeFlow software after the parameter input, in which the initial concentration of contaminants is determined based on the results of heavy metal analysis in the groundwater of the study area. Considering the maximum ecological environment risk in this study, the maximum concentration of the characteristic pollutant Cd of 0.38 mg/L was selected as the pollution-source strength and was set at the southern boundary of the site. It is assumed that the characteristic pollutant continues to leak for 20 years. The mapping of the predicted simulation results was done using FeFlow.
According to Figure 7, without any risk-control or remediation measures imposed on the groundwater of the site in the 20-year simulation period, the heavy metal pollutants in the groundwater will migrate from south to north as a whole, and the heavy metal in the groundwater on the east side of the study area will be discharged to the surface water, and the water quality will be affected after about 12 years. The pollution plume in the study area will be discharged to the surface water as a whole about 20 years later, which is determined by the direction of groundwater flow. If pollution remediation or risk-control measures are not imposed in the future, the heavy metal pollutants in groundwater will generate high ecological and environmental risks to the surrounding environment and surface water. The remediation or risk-control measures need to be implemented for the contaminated site.
Figure 8 shows the pollutant transport in the simulation area after the overall implementation of the site-closure cover project and the measures for pollution source removal during the 20-year simulation period. According to the movement of pollutants in 5, 10, 15 and 20 years, the groundwater pollution plume spreads to the north as a whole. Compared with the situation without measures, however, the rainfall infiltration after the implementation of measures is significantly reduced; thus, the groundwater recharge is reduced, and no follow-up pollutant enters the aquifer. With the time increasing, the concentration of Cd in groundwater in the study area gradually decreases under the influence of the self-purification of groundwater. Meantime, the pollutants have not been moved out of the site boundary within 15 years, reducing the ecological environment risk of the surface water in the north, and the surface water quality can be prevented from being affected by the contaminated site within a certain period of time. Although the contaminated site still has certain ecological risks to the surrounding surface water after the implementation of control measures, its impact is significantly weakened. Therefore, it is recommended to implement restoration and risk-control measures on the riverside site to avoid impacting the surrounding contaminated site.

5. Conclusions

In this study, we used field survey and test, indoor test, data analysis, and numerical simulation to characterize the soil and groundwater heavy metal contamination and risk assessment of a riverside site and came to the following main conclusions.
(1) The pollutants that exceed the standard limits for soil heavy metals are As, Pb, and Cd, with the maximum exceedance multiples of 25.43 times, 57.59 times, and 69.09 times, respectively, seriously exceeding the standard limits, and the scope of pollution is mainly distributed in the production area and solid-waste dumping area of the site; the groundwater pollutant of the site is Cd, exceeding the standard limits by 38 times, and the exceedance points are concentrated in the south of the site.
(2) The carcinogenic pollutants and non-carcinogenic hazard quotients of the soil heavy metal pollutants As and Cd exceeded the human acceptable levels, and the results of the blood lead model (ALM) calculations indicated that there was a high human-health risk of Pb in the site and that the site soil needed to be cleaned and restored. The groundwater in the study area does not pose any human health risk.
(3) A contaminant-migration-prediction model was used to evaluate the ecological and environmental risks caused by contaminated soil and groundwater at the site. The main environmental risk of the site is that the pollutant Cd in the site will migrate into the surface water and affect the water-quality safety. After taking engineering measures, although the groundwater contamination plume will still affect the surface water body on the north side, its ecological and environmental risks are lower than when no restoration or control measures are taken, so it is recommended to carry out soil and groundwater restoration or risk control for this riverside site.
The results of this study will contribute to improved contaminated soil groundwater risk-control measures and remediation decisions aimed at reducing the environmental risk to contaminated site receptors. In the follow-up study, the contaminant levels in soil and groundwater in the study area will be continuously monitored to verify the accuracy of the results of this study.

Supplementary Materials

The following supporting information can be downloaded at: https://www.mdpi.com/article/10.3390/pr10101994/s1: Table S1: The risk assessment parameters for As and Cd in soil. Table S2: The risk assessment parameters for Pb in soil.

Author Contributions

Data curation, Y.L.; formal analysis, D.L.; funding acquisition, J.D.; investigation, Y.L., H.W. and J.D.; methodology, D.L., H.W., S.L., J.D. and X.C.; software, S.L. and Y.H.; supervision, J.D. and S.P.; writing—original draft, D.L.; writing—review and editing, S.P. All authors have read and agreed to the published version of the manuscript.

Funding

This research was funded by the Guangxi Key R & D Program, grant number R2022-01-126.

Institutional Review Board Statement

Not applicable.

Informed Consent Statement

Not applicable.

Data Availability Statement

The data discussed in this work are presented in the form of tables and figures in the article, and no data are withheld. All of the data can be accessed from the journal article.

Conflicts of Interest

The authors declare no conflict of interest.

References

  1. Duan, Q.; Lee, J.; Liu, Y.; Chen, H.; Hu, H. Distribution of Heavy Metal Pollution in Surface Soil Samples in China: A Graphical Review. B. Environ. Contam. Tox. 2016, 97, 303–309. [Google Scholar] [CrossRef]
  2. Zhong, T.; Xue, D.; Zhao, L.; Zhang, X. Concentration of heavy metals in vegetables and potential health risk assessment in China. Environ. Geochem. Health 2017, 40, 313–322. [Google Scholar] [CrossRef]
  3. Li, P.; Lin, C.; Cheng, H.; Duan, X.; Lei, K. Contamination and health risks of soil heavy metals around a lead/zinc smelter in southwestern China. Ecotox. Environ. Saf. 2015, 113, 391–399. [Google Scholar] [CrossRef]
  4. Shen, F.; Liao, R.; Ali, A.; Mahar, A.; Guo, D.; Li, R.; Xining, S.; Awasthi, M.K.; Wang, Q.; Zhang, Z. Spatial distribution and risk assessment of heavy metals in soil near a Pb/Zn smelter in Feng County, China. Ecotox. Environ. Saf. 2017, 139, 254–262. [Google Scholar] [CrossRef] [PubMed]
  5. Salazar-Camacho, C.; Salas-Moreno, M.; Marrugo-Madrid, S.; Paternina-Uribe, R.; Marrugo-Negrete, J.; Díez, S. A human health risk assessment of methylmercury, arsenic and metals in a tropical river basin impacted by gold mining in the Colombian Pacific region. Environ. Res. 2022, 212, 113120. [Google Scholar] [CrossRef]
  6. Briffa, J.; Sinagra, E.; Blundell, R. Heavy metal pollution in the environment and their toxicological effects on humans. Heliyon 2020, 6, e04691. [Google Scholar] [CrossRef]
  7. Li, Z.; Ma, Z.; van der Kuijp, T.J.; Yuan, Z.; Huang, L. A review of soil heavy metal pollution from mines in China: Pollution and health risk assessment. Sci. Total. Environ. 2014, 468–469, 843–853. [Google Scholar] [CrossRef]
  8. Song, Y.; Kirkwood, N.; Maksimović, Č.; Zheng, X.; O’Connor, D.; Jin, Y.; Hou, D. Nature based solutions for contaminated land remediation and brownfield redevelopment in cities: A review. Sci. Total Environ. 2019, 663, 568–579. [Google Scholar] [CrossRef]
  9. Li, Z.; Pan, F.; Xiao, K.; Li, H.; Zheng, C.; Wang, X.; Zhang, Y.; Wang, Q.; Zhang, L. An integrated study of the spatiotemporal character, pollution assessment, and migration mechanism of heavy metals in the groundwater of a subtropical mangrove wetland. J. Hydrol. 2022, 612, 128251. [Google Scholar] [CrossRef]
  10. Wu, G.; Wang, L.; Yang, R.; Hou, W.; Zhang, S.; Guo, X.; Zhao, W. Pollution characteristics and risk assessment of heavy metals in the soil of a construction waste landfill site. Ecol. Inform. 2022, 70, 101700. [Google Scholar] [CrossRef]
  11. Wu, Y.; Li, X.; Yu, L.; Wang, T.; Wang, J.; Liu, T. Review of soil heavy metal pollution in China: Spatial distribution, primary sources, and remediation alternatives. Resour. Conserv. Recycl. 2022, 181, 106261. [Google Scholar] [CrossRef]
  12. Li, B.; Zhang, H.; Long, J.; Fan, J.; Wu, P.; Chen, M.; Liu, P.; Li, T. Migration mechanism of pollutants in karst groundwater system of tailings impoundment and management control effect analysis: Gold mine tailing impoundment case. J. Clean. Prod. 2022, 350, 131434. [Google Scholar] [CrossRef]
  13. Liu, G.; Zhou, X.; Li, Q.; Shi, Y.; Guo, G.; Zhao, L.; Wang, J.; Su, Y.; Zhang, C. Spatial distribution prediction of soil As in a large-scale arsenic slag contaminated site based on an integrated model and multi-source environmental data. Environ. Pollut. 2020, 267, 115631. [Google Scholar] [CrossRef]
  14. Zhao, X.; Li, Z.; Wang, D.; Xu, X.; Tao, Y.; Jiang, Y.; Zhang, T.; Zhao, P.; Li, Y. Pollution characteristics, influencing factors and health risks of personal heavy metals exposure: Results from human environmental exposure study in China. Build. Environ. 2022, 220, 109217. [Google Scholar] [CrossRef]
  15. Alexander, A.C.; Ndambuki, J.M. Optimal design of groundwater pollution management systems for a decanting contaminated site: A simulation-optimization approach. Groundw. Sustain. Dev. 2021, 15, 100664. [Google Scholar] [CrossRef]
  16. Janža, M. Optimization of well field management to mitigate groundwater contamination using a simulation model and evolutionary algorithm. Sci. Total Environ. 2022, 807, 150811. [Google Scholar] [CrossRef]
  17. He, L.; Huang, G.H.; Lu, H.W. A simulation-based fuzzy chance-constrained programming model for optimal groundwater remediation under uncertainty. Adv. Water Resour. 2008, 31, 1622–1635. [Google Scholar] [CrossRef]
  18. Guo, S.; Wu, H.; Tian, Y.; Chen, H.; Wang, Y.; Yang, J. Migration and fate of characteristic pollutants migration from an abandoned tannery in soil and groundwater by experiment and numerical simulation. Chemosphere 2021, 271, 129552. [Google Scholar] [CrossRef]
  19. Badmus, G.O.; Ogungbemi, O.S.; Enuiyin, O.V.; Adeyeye, J.A.; Ogunyemi, A.T. Delineation of leachate plume migration and appraisal of heavy metals in groundwater around Emirin dumpsite, Ado-Ekiti, Nigeria. Sci. Afr. 2022, 17, e01308. [Google Scholar] [CrossRef]
  20. Slack, R.J.; Gronow, J.R.; Hall, D.H.; Voulvoulis, N. Household hazardous waste disposal to landfill: Using LandSim to model leachate migration. Environ. Pollut. 2007, 146, 501–509. [Google Scholar] [CrossRef]
  21. Yang, Y.; Wu, J.; Luo, Q.; Wu, J. An effective multi-objective optimization approach for groundwater remediation considering the coexisting uncertainties of aquifer parameters. J. Hydrol. 2022, 609, 127677. [Google Scholar] [CrossRef]
  22. Seyedpour, S.M.; Kirmizakis, P.; Brennan, P.; Doherty, R.; Ricken, T. Optimal remediation design and simulation of groundwater flow coupled to contaminant transport using genetic algorithm and radial point collocation method (RPCM). Sci. Total Environ. 2019, 669, 389–399. [Google Scholar] [CrossRef] [PubMed] [Green Version]
  23. Sun, K. Formulating surrogate pumping test data sets to assess aquifer hydraulic conductivity. J. Hydrol. X 2018, 1, 100004. [Google Scholar] [CrossRef]
  24. Gulson, B.; Taylor, A.; Stifelman, M. Lead exposure in young children over a 5-year period from urban environments using alternative exposure measures with the US EPA IEUBK model—A trial. Environ. Res. 2018, 161, 87–96. [Google Scholar] [CrossRef]
  25. Laidlaw, M.A.S.; Mohmmad, S.M.; Gulson, B.L.; Taylor, M.P.; Kristensen, L.J.; Birch, G. Estimates of potential childhood lead exposure from contaminated soil using the US EPA IEUBK Model in Sydney, Australia. Environ. Res. 2017, 156, 781–790. [Google Scholar]
  26. Pham, H.T.; Rühaak, W.; Schuster, V.; Sass, I. Fully hydro-mechanical coupled Plug-in (SUB+) in FEFLOW for analysis of land subsidence due to groundwater extraction. SoftwareX 2019, 9, 15–19. [Google Scholar] [CrossRef]
  27. Bakker, M.; Hemker, K. A Dupuit formulation for flow in layered, anisotropic aquifers. Adv. Water. Resour. 2002, 25, 747–754. [Google Scholar] [CrossRef]
  28. Qi, C.; Xu, X.; Chen, Q.; Liu, H.; Min, X.; Fourie, A.; Chai, L. Ab initio calculation of the adsorption of As, Cd, Cr, and Hg heavy metal atoms onto the illite(001) surface: Implications for soil pollution and reclamation. Environ. Pollut. 2022, 312, 120072. [Google Scholar]
Figure 1. Location in the study area.
Processes 10 01994 g001
Figure 2. The stratigraphic structure in the study area.
Processes 10 01994 g002
Figure 3. Layout of soil and groundwater points in the study area.
Processes 10 01994 g003
Figure 4. Distribution of soil heavy metal pollution in the study area. (a) Spatial distribution of As concentration. (b) Spatial distribution of Cd concentration. (c) Spatial distribution of Pb concentration.
Processes 10 01994 g004
Figure 5. Distribution of Cd pollution concentration in the groundwater in the study area.
Processes 10 01994 g005
Figure 6. Groundwater flow-field map in the study area.
Processes 10 01994 g006
Figure 7. Pollutant transport in the simulation area: change of pollutant concentration in groundwater during (a) 5, (b) 10, (c) 15 and (d) 20 years.
Processes 10 01994 g007
Figure 8. Pollutant transport in the simulation area after the implementation of engineering measures: change of pollutant concentration in groundwater during (a) 5, (b) 10, (c) 15 and (d) 20 years.
Processes 10 01994 g008
Table 1. Test results of the groundwater samples in the study area.
Heavy MetalDB1DB2DB3DB4DB5DB6DB7DB8StandardDetection Limits
Pb (mg/L)0.00230.00250.00340.00340.00220.00250.00420.00380.10.001
Cd (mg/L)0.00330.29800.36800.00270.00670.00390.37900.34900.010.001
Cr (mg/L)<0.00011<0.00011<0.00011<0.00011<0.00011<0.00011<0.00011<0.000110.10.00011
Zn (mg/L)0.22400.21302.52502.63900.20800.22602.68002.547050.004
Fe (mg/L)<0.01<0.01<0.010.2600<0.01<0.01<0.01<0.0120.01
As (mg/L)0.00160.00160.00130.00120.00160.00140.00130.00130.050.001
Hg (mg/L)0.00010.00010.00010.00010.00010.00020.00010.00020.0020.0001
Ba (mg/L)0.05700.05510.06590.06291.08001.25000.06240.062940.01
Publisher’s Note: MDPI stays neutral with regard to jurisdictional claims in published maps and institutional affiliations.

