Article

Experimental and Numerical Studies of Fine Quartz Single-Particle Sedimentation Based on Particle Morphology

1
Department of Materials Science and Engineering, Anhui University of Science and Technology, Huainan 232001, China
2
Hefei Gotion High-Tech Power Energy Co., Ltd., Hefei 230000, China
3
School of Chemical Engineering and Technology, China University of Mining and Technology, Xuzhou 221116, China
*
Authors to whom correspondence should be addressed.
Processes 2022, 10(10), 1981; https://doi.org/10.3390/pr10101981
Submission received: 31 August 2022 / Revised: 23 September 2022 / Accepted: 28 September 2022 / Published: 1 October 2022
(This article belongs to the Special Issue Computational Modeling of Multiphase Flow (II))

Abstract

:
The sedimentation characteristics of quartz particles affect their separation and settling dehydration processes. Particle morphology determines the sedimentation equilibrium velocity. In this paper, the sedimentation of a single quartz particle is characterized by employing experimental and CFD-DEM approaches. SEM served to examine quartz particles measuring 30–500 μm, and they exhibited flaky–blocky morphologies with an average long–middle axis ratio of 1.6. Consistent with the SEM-detected morphological features of the quartz particles, suggested here is a simpler drag coefficient model, followed by verification of the model with experimental data. The results show that the velocity of a quartz particle in the non-settling direction had a fluctuation of ±0.2 mm/s. The fluctuation reached 0.4 mm/s at varying settlement release angles. The order in which the particles reached sedimentation equilibrium velocity during the settlement process was double-cone, single-cone, and square when the initial velocity was greater than sedimentation equilibrium velocity. Furthermore, the long–middle axis ratio of quartz particles diminished as their equilibrium sedimentation velocities rose. Given that the quartz particles ranged from 30 to 50 μm in size, the long–middle axis ratio wielded no discernible effect on the sedimentation equilibrium velocity.

1. Introduction

Large amounts of mine wastewater are being generated throughout the world, from industries such as metal mines, marble mines, coal mines, etc. [1,2,3]. In order to reduce the pollution of tailings discharge and enhance the quality of clarified water, the treatment of mine wastewater has become more and more important. Of all the usual mine wastewater treatments, the method known as physical sedimentation clarification is the most effective and least polluting [4]. Kynch [5] originally posited the sedimentation theory, and since then, research on fine mineral particles has made steady progress. Among the forces acting on particles, drag force is one of the most important ones guiding particles’ sedimentation [6]. However, most drag formulas are derived from empirical correlations [7,8]. Quartz is the Earth’s crust’s second most abundant element (27.7% by mass) [9,10,11]. It often coexists with other minerals in the form of gangue minerals. Mine effluent has a comparatively high concentration of fine quartz [12,13,14]. Consequently, more research on, firstly, the resistance model and, secondly, the properties of fine quartz sedimentation is required to efficiently treat mine wastewater.
Several researchers have analyzed the sedimentation features of mineral particles. Lu et al. [15] provided a non-contact continuous measurement method using visible light to acquire real-time sample images automatically during the sedimentation process. They produced a particle sedimentation dynamic equation. Rosa et al. [16] numerically examined how the non-dimensional parameters affected the sedimentation velocity of small heavy particles that were not interacting. Shahi and Kuru [17] proposed an empirical model that could predict sedimentation velocity after precisely measuring the sedimentation velocity of sand particles in water and employing Particle Image Shadowgraph (PIS) technology. However, as was already noted, such investigations turned the particles into spherical shapes when, in reality, most mineral particles lack sphericity [18].
In recent years, in order to improve the accuracy of research on the sedimentation velocity of mineral particles, more and more attention has been paid to non-spherical particles [19], focusing on the impact of particle morphology [20,21] on particle motions. Sun et al. [22] implemented the triaxial method to describe the equivalent diameter of rock debris and investigated the drag coefficient and sedimentation velocity of a single non-spherical particle in Newtonian fluids. Ma and Zhao [23] explored the fluidization of disk-like particles by combining the Computational Fluid Dynamics and Discrete Element Method (CFD-DEM) with the Hölzer/Sommerfeld drag force model. Molaei et al. [24] researched the effect of particle shape on the mixing of binary mixtures of ellipsoids and spheres using this strategy, and they noted that drag force plays a central role in determining particle motion that appears in particle–fluid flow systems. From the perspective of particle morphology, different shapes of particles (i.e., spherical and non-spherical) influence solid particle behaviors [25]. Consequently, the particle morphology’s influence on the sedimentation velocity is significant and needs to be explained in detail.
With the rapid advances in computer technologies and numerical algorithms, many discrete- or continuum-based numerical methods have been proposed to simulate liquids [26]. Among these methods, CFD-DEM has proven to be highly reliable in simulating liquid/gas–solid two-phase flows [27,28,29,30,31]. Specifically, the CFD-DEM approach solves particle motion using Newton’s laws of motion and, at the same time, solves the fluid phase by local averaged Navier–Stokes equations. The momentum exchange between them is determined via the local averaged drag correlations. Wang et al. [32] demonstrated the excellent accuracy, good stability, and high efficiency of their proposed CFD-DEM approach, and they applied it to study gas–solid hydrodynamics in fluidized beds. Sun et al. [33] integrated into the CFD-DEM approach the diffusion-based coarse-graining method, demonstrating that it could be effective in simulating fluid–solid systems. Such abundant applications proved the reasonability and feasibility of the CFD-DEM approach.
At present, published research is still limited on the setting characteristics of fine quartz particles when utilizing CFD-DEM based on particle morphology. One of the main reasons for this is that fine quartz particles with morphological diversity have no suitable drag models. So far, the drag coefficient force models have been proposed mainly for regular or irregular non-spherical particles. However, most of these force models are empirical formulas, and they are not applicable to the special conditions of fine quartz particle sedimentation. In fact, many researchers [34,35,36,37,38,39,40,41,42] have modified and verified the validity of the drag coefficient force model and applied it to different characteristics of non-spherical particles.
With this in mind, in this work, we first analyzed the morphology of quartz particles using SEM, summarized the relationship between long–middle axis ratio and particle size, and statistically analyzed the proportion of regular non-spherical particles. On this basis, combined with the Di Felice and Chien drag model, the drag model regarding fine quartz particles was modified, and five particles were randomly selected by means of simulation and experiment to confirm the effectiveness of the newly modified drag model. Then, the effects of release angle and surrounding topography on sedimentation velocity were simulated by employing the newly modified drag coefficient force model. Finally, according to the long–middle axis ratio range obtained via SEM analysis, the sedimentation equilibrium velocity of quartz particles with different long–middle axis ratios was predicted by means of simulation.

2. Materials and Methods

2.1. Morphological Analysis of Samples

The quartz sample was obtained from Fengyang Dongsheng Quartz Sand Co. Ltd., China. The purity of the sample met the experimental requirements (Supplementary Material Table S1 and Figure S1). Quartz samples were randomly selected, and each particle size fell within the range 250–500 μm, 125–250 μm, 75–125 μm, 45–75 μm, or 30–45 μm. The samples of each particle size were constantly divided until the particles numbered approximately 500. Each sample was put on a glass slide which was slightly shaken so that each particle’s largest single layer was in fact parallel to the horizontal plane. For morphological analysis, a JSM-6610LV scanning electron microscope (acceleration voltage 20 kV, high vacuum mode) was used, and one SEM image is depicted in Figure 1. ImageJ software was used to analyze the sample long–middle axis ratio (A) and morphological classification [43].
In this research, the upper limit of the particle size was maintained at 500 μm [44,45,46]. Other exploratory research has concluded that when the quartz particle size is 500 μm, the sedimentation equilibrium velocity of the particle in steady-state water is 82.17 mm/s. The Stokes formula asserts that sedimentation equilibrium velocity decreases when the particle size also decreases. When the quartz particle size falls to 30 μm, the sedimentation equilibrium velocity of the particle is lower than 1 mm/s. The main goal of this research is to create a theoretical basis for classifying particle group sedimentation by studying the behavior of single-particle sedimentation. When the particle size is less than 30 μm, the sedimentation equilibrium velocity is too minute, and there is an order of magnitude difference in the particle sedimentation equilibrium speed between 30 μm and 500 μm. Therefore, the particle size range was set to 30–500 μm.
Usually, mining wastewater is treated by natural sedimentation, and the flow field environment is in a low-Reynolds-number laminar flow state. For this reason, the present study focuses on the sedimentation process of particles with their own peripheral morphologies, release angles, and long–middle axis ratios in static water. In order to establish the particle model more accurately, the morphologies of the quartz particles were analyzed, including long–middle axis ratio analysis and morphological classification analysis of these particles. Here, the sizes of the long axis, the middle axis, and the short axis correspond, respectively, to the length, width, and height of the particle.

2.1.1. Long–Middle Axis Ratio Analysis

In each particle size range, 100 effective particles were chosen randomly from the SEM pictures for statistical analysis, and the results are illustrated in Figure 2. The average long–middle axis ratios of 250–500 μm, 125–250 μm, 75–125 μm, 45–75 μm, and 30–45 μm quartz particles were, respectively, 1.6260, 1.6102, 1.5951, 1.5890, and 1.6486. The average ratio of the long–middle axes did not change much with a decline in particle size. If it is assumed that a single significant digit is retained after the decimal point, then the long–middle axis average ratio of the particles in all of the five particle size ranges is 1.6.
The test sample of each particle size range was continuously and uniformly shrunk to 500 particles. The number of images taken by SEM was more than one and contained all 500 particle morphologies. The statistical analysis of 100 particle morphologies accounted for 20% of the SEM images, so the samples are representative. Based on what is reported in the statistical analysis chart, the ratio of the long–middle axes of 30–500 μm quartz particles was between 1 and 3, which proves that the quartz particles were, in fact, block-shaped particles.

2.1.2. Morphological Classification Analysis

According to the analysis of pictures taken by SEM, it emerged that the quartz particles exhibited a flaky shape with a certain regularity. The length of the short axis was about half that of the middle axis, so in this study we simplified the model in the description of Ap. Among the many morphologies that quartz particles have, single-cone, square, and double-cone particles account for a relatively high proportion. As Figure 3 shows, the quartz particles were morphologically classified into different particle size ranges as follows: 250–500 μm, 125–250 μm, 75–125 μm, 45–75 μm, and 30–45 μm. Meanwhile, the percentages of unclassified particles according to the morphology were 8.9286, 8.6539, 8.9431, 7.1795, and 8.7719, respectively. Single-cone, square, and double-cone particles each accounted for more than 20% in each particle size range, and the morphological quantity from large to small was single-cone, square, and double-cone. The peripheral morphologies of single-cone, square, and double-cone particles are shown in Figure S2, while the remaining particles were of unclassified peripheral morphology.
Based on the above analysis, in the case of ignoring the surface roughness, flaky–blocky quartz particles accounted for a relatively high proportion of the quartz particle group, and the morphology has a certain representativeness. The morphology type and long–middle axis ratio of the quartz particles provides a reliable basis for ensuring that the subsequent numerical simulations are accurate.

2.2. Test Platform and Test Process

The transparent acrylic cube sedimentation barrel in the test device was 50 × 10 × 300 mm3 (length × width × height). For measuring the particle sedimentation process, an area of 50 × 10 × 10 mm3 (length × width × height) was chosen, as depicted by the light blue line in Figure 4. When the test commenced, the particle was released at the top of the sedimentation barrel, and the high-speed camera started recording. The complete particle motion in the measuring area was recorded, and this was completed with an i-SPEED 3 type high-speed video camera (Olympus UK Ltd., United Kingdom). It was armed with a 47.62 pixels/mm resolution and could achieve 4000 frames per second. Furthermore, i-SPEED suit software was used for analysis of the particle sedimentation velocity [47].
According to the formula for sedimentation equilibrium velocity, the particle reaches its equilibrium state once the settlement distance of 250 mm is reached. During the high-speed camera’s recording of the 10 mm particle sedimentation process, 20 trajectory points were chosen, and their immediate sedimentation velocity was subjected to analysis. The average value of instantaneous velocity is known as the particle sedimentation equilibrium velocity. Test errors were minimized as much as possible by conducting every measurement three times. Deionized water (Milli-Q water) with a resistance capacity of 18.25 MΩ/cm was used, and all measurements were undertaken at 20 °C and pH 7.0 [48].

3. Mathematical Model

Each individual particle’s motion was directly tracked by employing the discrete element method, while the local averaged continuity and momentum equations of the continuum solved the issue of fluid flow [49]. The particle–fluid interaction force mainly incorporates drag force Fd, viscous force, and pressure gradient force, which is explained by the fluid shear stress tensor and other non-dominant forces such as Magnus force and Basset force, and virtual mass force [50].

3.1. Governing Equations for Particle Phase

Utilizing Newton′s laws of motion, the motion of an individual particle p with mass mp and moment of inertia Ip is calculated in a Lagrangian frame [51] as follows:
m P d v P d t = m P g + F c , p + F p f , p
I P d ω P d t = T P
where vp and ωp are, respectively, the transitional and angular velocity of the individual particle p, Fc,p denotes the particle–wall contact, Tp is the torque arising from the contact force, and g represents gravitational force acceleration.

3.2. Governing Equations for Fluid Phase

The CFD solver is based on the Eulerian approach whereby each computational cell is calculated. The fluid phase is governed by the locally averaged Navier–Stokes equation for an incompressible fluid, with equations governing continuity and momentum as written below [52]:
t ( α f ρ f ) + ( α f ρ f v f ) = 0
( α f ρ f v f ) t + ( α f ρ f v f v f ) = α f P 1 Δ V f F p f , p α f τ f + α f ρ f g
where αf represents the liquid volume fraction, ρf denotes fluid density, vf is the averaged fluid velocity, ∇P stands for the pressure gradient, ∆Vf is a fluid cell of volume, and τf is the viscous stress tensor, which is documented as follows [53]:
τ f = μ f [ ( v f ) + ( v f ) 1 ] + ( λ 2 3 μ ) ( v f ) I ¯

3.3. Interaction Force between Fluid and Particle

The fluid–particle interaction force acting on particle is Fpf,p is written as:
F p f , p = V p P + V p τ f + α f F d
where Vp is the particle volume, and Fd is drag force in the direction of the relative velocity between the fluid and particle. Referring to the drag of a particle in a particle system, Di Felice’s (1994) proposed drag coefficient force model [54] was implemented:
F d = F d 0 α f ( γ + 1 )
where Fd0 is the fluid drag force acting on a particle when no other particles are evident. This is written as:
F d 0 = 1 2 ρ f C D π d p 2 4 α f 2 | v f v P | ( v f v P )
where CD represents the fluid drag coefficient, dP is the equivalent diameter of the particle, and vf and vP are, respectively, the fluid velocity and particle velocity. Based on the Chien [55] drag coefficient force model as a reference, this paper proposes a new modified drag coefficient force model, as shown below:
C D = 8 R e P , α + 67.289 e 0.503 ϕ q
where the quartz particle sphericity, Φq, is actually the ratio between the surface areas of the equivalent sphere Asph and particle Ap. These are given as follows [56]:
ϕ q = A s p h A p
A s p h = π ( d p ) 2
A p = 4 π l 2 m 2 + l 2 s 2 + m 2 s 2 3
where l, m, s, respectively, are the long axis, the middle axis, and the short axis of the particle. According to the particle morphology analysis, in this study, we assume s = 1 2 m . Therefore, Formula (12) is simplified to Formula (13):
A p = 2 π m 5 l 2 + m 2 3
The simplified drag coefficient force model can be obtained by two-dimensional image display technology. Compared with the drag model, which needs to test the three-dimensional size of particles, the new model has more advantages. The accuracy of the simplified model is verified in the following sections.
In the drag coefficient equation, Re P , α is the Reynolds number of the particle for the drag force, which is written as follows [57]:
R e P , α = ρ f d P α f | v f v P | μ f
where μf stands for the fluid’s dynamic viscosity, and the value of γ in Equation (8) is stated as:
γ = 3.7 0.65 exp [ ( 1.5 log 10 Re P , α ) 2 2 ]

3.4. Simulation Details

SolidWorks 15.0 was used to establish the test model of the three-dimensional model of the settling device, i.e., 50 × 50 × 150 mm3. Meanwhile, ANSYS Mesh 18.0 was employed to construct the mesh with a regular hexahedron grid. This is because the maximum equivalent diameter of the fine mineral particles was 500 μm. In order to ensure the number of particles with statistical significance in a cell grid, the minimum volume of the grid should be more than triple the particles’ maximum volume, and the element size can be divided by the length. So, the minimum element size was set to 1 mm after the independence verification. The element size, in turn, was increased to reduce the mesh density. When the element size was 5 mm, the number of elements was relatively small, i.e., 3872. Therefore, only four element sizes—1, 2, 2.5, and 5 mm—were made for the grid. The second-order central difference scheme was used in this research for the convection term and diffusion term, while the Crank–Nicolson second-order scheme was deployed for the time term. A phase-coupled simple algorithm was employed to solve particle motion by displaying integrity. The simulated fluid was made viscous and incompressible, and the wall was in what is known as the no-slip condition. The magnitude of the shear modulus was to the 6th power. All simulation parameters were implemented in Fluent 18.0 and EDEM 2018.

4. Results and Discussion

4.1. Validation of the Drag Coefficient Model

Several forces guide the free sedimentation of particles in water, for instance, buoyancy, drag, gravity, and so on. Drag force is a key factor for momentum transfer in the solid and liquid phases; furthermore, its accuracy directly affects the accuracy of numerical simulation results. This paper proposes a new modified drag coefficient force model based on particle morphology, and we establish its accuracy through experiments and numerical simulations (modified and unmodified drag coefficient force models).
As Figure 5 shows, five quartz particles with different long–middle axis ratios were randomly selected from each particle size range for a free sedimentation experiment. Their lengths (l) were 168 μm, 68 μm, 777 μm, 56 μm, and 712 μm; their widths (m) were 135 μm, 52 μm, 473 μm, 32 μm, and 339 μm; and their long–middle axis ratios (A) were 1.25, 1.31, 1.64, 1.74, and 2.10. A simplified particle model for numerical simulation was constructed based on the morphology of the quartz particles selected in the experiment. Note that the simplified particle model is shown in Figure S2. Then, the process of free sedimentation of a single particle was simulated. In the experiment and simulation, the terminal velocity was selected for comparative analysis with the particle reaching the sedimentation equilibrium state. The experimental data are represented by Exp., Sim-1 represents the simulation results for the modified drag coefficient model (as shown in the mathematical model), and Sim-2 represents the simulation results of the unmodified Chien drag coefficient model. The instantaneous velocity of the five quartz particles is depicted in Figures S3–S7.
In comparison to the simulation results of the uncorrected drag coefficient model, the sedimentation equilibrium velocity obtained when utilizing the modified drag coefficient model agrees more with the actual measured sedimentation equilibrium velocity. The modified drag coefficient model can predict the sedimentation velocity of quartz particles relatively accurately, and the relative error can be controlled within 5%. As particle size shrinks, the drag coefficient model’s effect on sedimentation equilibrium velocity decreases, and the relative error is also diminished.
The length of the short axis was adjusted so that it was half of the main axis due to the reduced model. Quartz particles’ actual short-axis lengths can range from larger than half of the middle axis to less than half of the middle axis. As a result, the findings produced by the updated drag coefficient model cannot exactly correspond to the data that were actually measured. However, the simulation outcomes using the modified drag coefficient model are more accurate than the simulation results employing the original drag force model when compared to the sedimentation equilibrium velocity data recorded in actual experiments. Additionally, the fact that there is not a significant difference between the settlement equilibrium velocity calculated using the changed drag coefficient model and the actual measured settlement equilibrium speed indicates the importance of the revised drag coefficient model.

4.2. Particle Release Angle

In mine wastewater, most quartz particles exist as non-spherical phenomena. During the sedimentation of the quartz particle group, the included angle between each particle coordinate system and the global coordinate system may change with time. Differences may occur in the sedimentation equilibrium velocity of a single non-spherical particle with various angles. Herein, the Y-axis direction (the direction of particle gravity sedimentation) was randomly selected as a reference, and the effect of different quartz particle release angles on the sedimentation process was predicted by using the simplified drag coefficient model.
Suppose that the local coordinate system of the particle is defined as 0xyz, the global coordinate system is defined as 0XYZ, and both coordinate systems have the same origin of 0. Using the direction cosine matrix (DCM), the angle between the y direction of the particle and the Y direction in the global coordinate system was set to 0°, 30°, 45°, 60°, and 90°, respectively (Figure 6). The angle between the x direction of the particle and the X direction in the global coordinate system was kept consistent, while the angle between the z direction of the particle and the Z direction in the global coordinate system changed when particles changed in the y direction.
It can be seen from the Y-axis direction of the global coordinate system that the initial release velocity of a particle exerts no influence on the sedimentation equilibrium velocity value of particles. However, the differentiation between the initial velocity and sedimentation equilibrium velocity directly affects the time required to reach the sedimentation equilibrium velocity during a particle’s settlement process.
In the settling process of a large-sized particle, the effect of angle on sedimentation velocity is less significant when compared to particle mass and volume. Referring to the analysis of particle velocity in the X-axis direction, the velocity value of a particle fluctuates relatively little between 0° and 45°, by ±0.2 mm/s. Furthermore, when the release angle is 45°~90°, the fluctuation increases as the angle also increases, and the value range is about ±0.4 mm/s. In the Z-axis direction, when the release angle is 45°~60°, the fluctuation amplitude of the particle velocity value nearly doubles.

4.3. Peripheral Appearance

We can see from the Y-axis direction in the global coordinate system that when the initial velocity of particles is greater than the sedimentation equilibrium velocity, the order of particles from the initial velocity to the sedimentation equilibrium velocity is double cone, single cone, and square. Judging by the X-axis and Z-axis directions, the fluctuation value of particle velocity is within ±0.2 mm/s, which is consistent with the release angle of 0° shown in Figure 7.
The particles impact the local water layer during the sedimentation process, and when they break away from the local water layer, wake flow is formed behind the particles. When the particle moves downward instantaneously, the tail of the original resting position will form a vacuum region, and this vacuum region will instantly have an inflow of external water. However, the vacuum is under negative pressure. The front impingement surface of the particle is smaller, and the resistance is subsequently less. The smaller the particle tail surface, the smaller the vacuum negative-pressure area. Therefore, considering only the difference in the particles’ surrounding morphology, the order that the particles reveal in reaching the sedimentation equilibrium velocity is as follows: double cone, single cone, and square cone.

4.4. Long–Middle Axis Ratio

According to the analysis results of SEM photographs, the maximum ratio of the length of the long axis to the length of the middle axis of quartz particles was 2.6, and the minimum ratio was 1.0. Different particle models were established (shown in Figure 8). It was assumed that the value of the short axis of the particle is half the value of the middle axis of the particle, the value of the middle axis of the particle is fixed, and the value of the particle’s long axis is altered. The effects of different particle models on the particle’s sedimentation equilibrium velocity were studied.
When the particle size is constant, the long–middle axis ratio causes a decrease in the particle sedimentation equilibrium velocity. The effect of particle long–middle axis ratio on sedimentation equilibrium velocity diminishes as the particle size also decreases. In order to further understand the relationship between the long–middle axis ratio and the sedimentation velocity, the instantaneous velocity of particles was studied, as shown in Figures S8–S12. In the scenario where the particle size is small or the long–middle axis ratio is close to 1, the particle can quickly reach a sedimentation equilibrium state. When the long–middle axis ratio increases, the spherical coefficient increases, the drag coefficient increases, and the drag also increases. Therefore, the effective gravity of the particles in the vertical direction decreases, resulting in a drop in the particle’s sedimentation equilibrium velocity. The association between the sedimentation equilibrium velocity and the long–middle axis ratio is consistent with the derived formula. When D < 50 μm, particle long–middle axis ratio has almost no effect on sedimentation equilibrium velocity.

5. Conclusions

A combination of experiments and CFD-DEM was performed in order to study the morphological characteristics of quartz particles and the factors of single-particle quartz′s sedimentation velocity in mine wastewater. The following conclusions can be made:
(1)
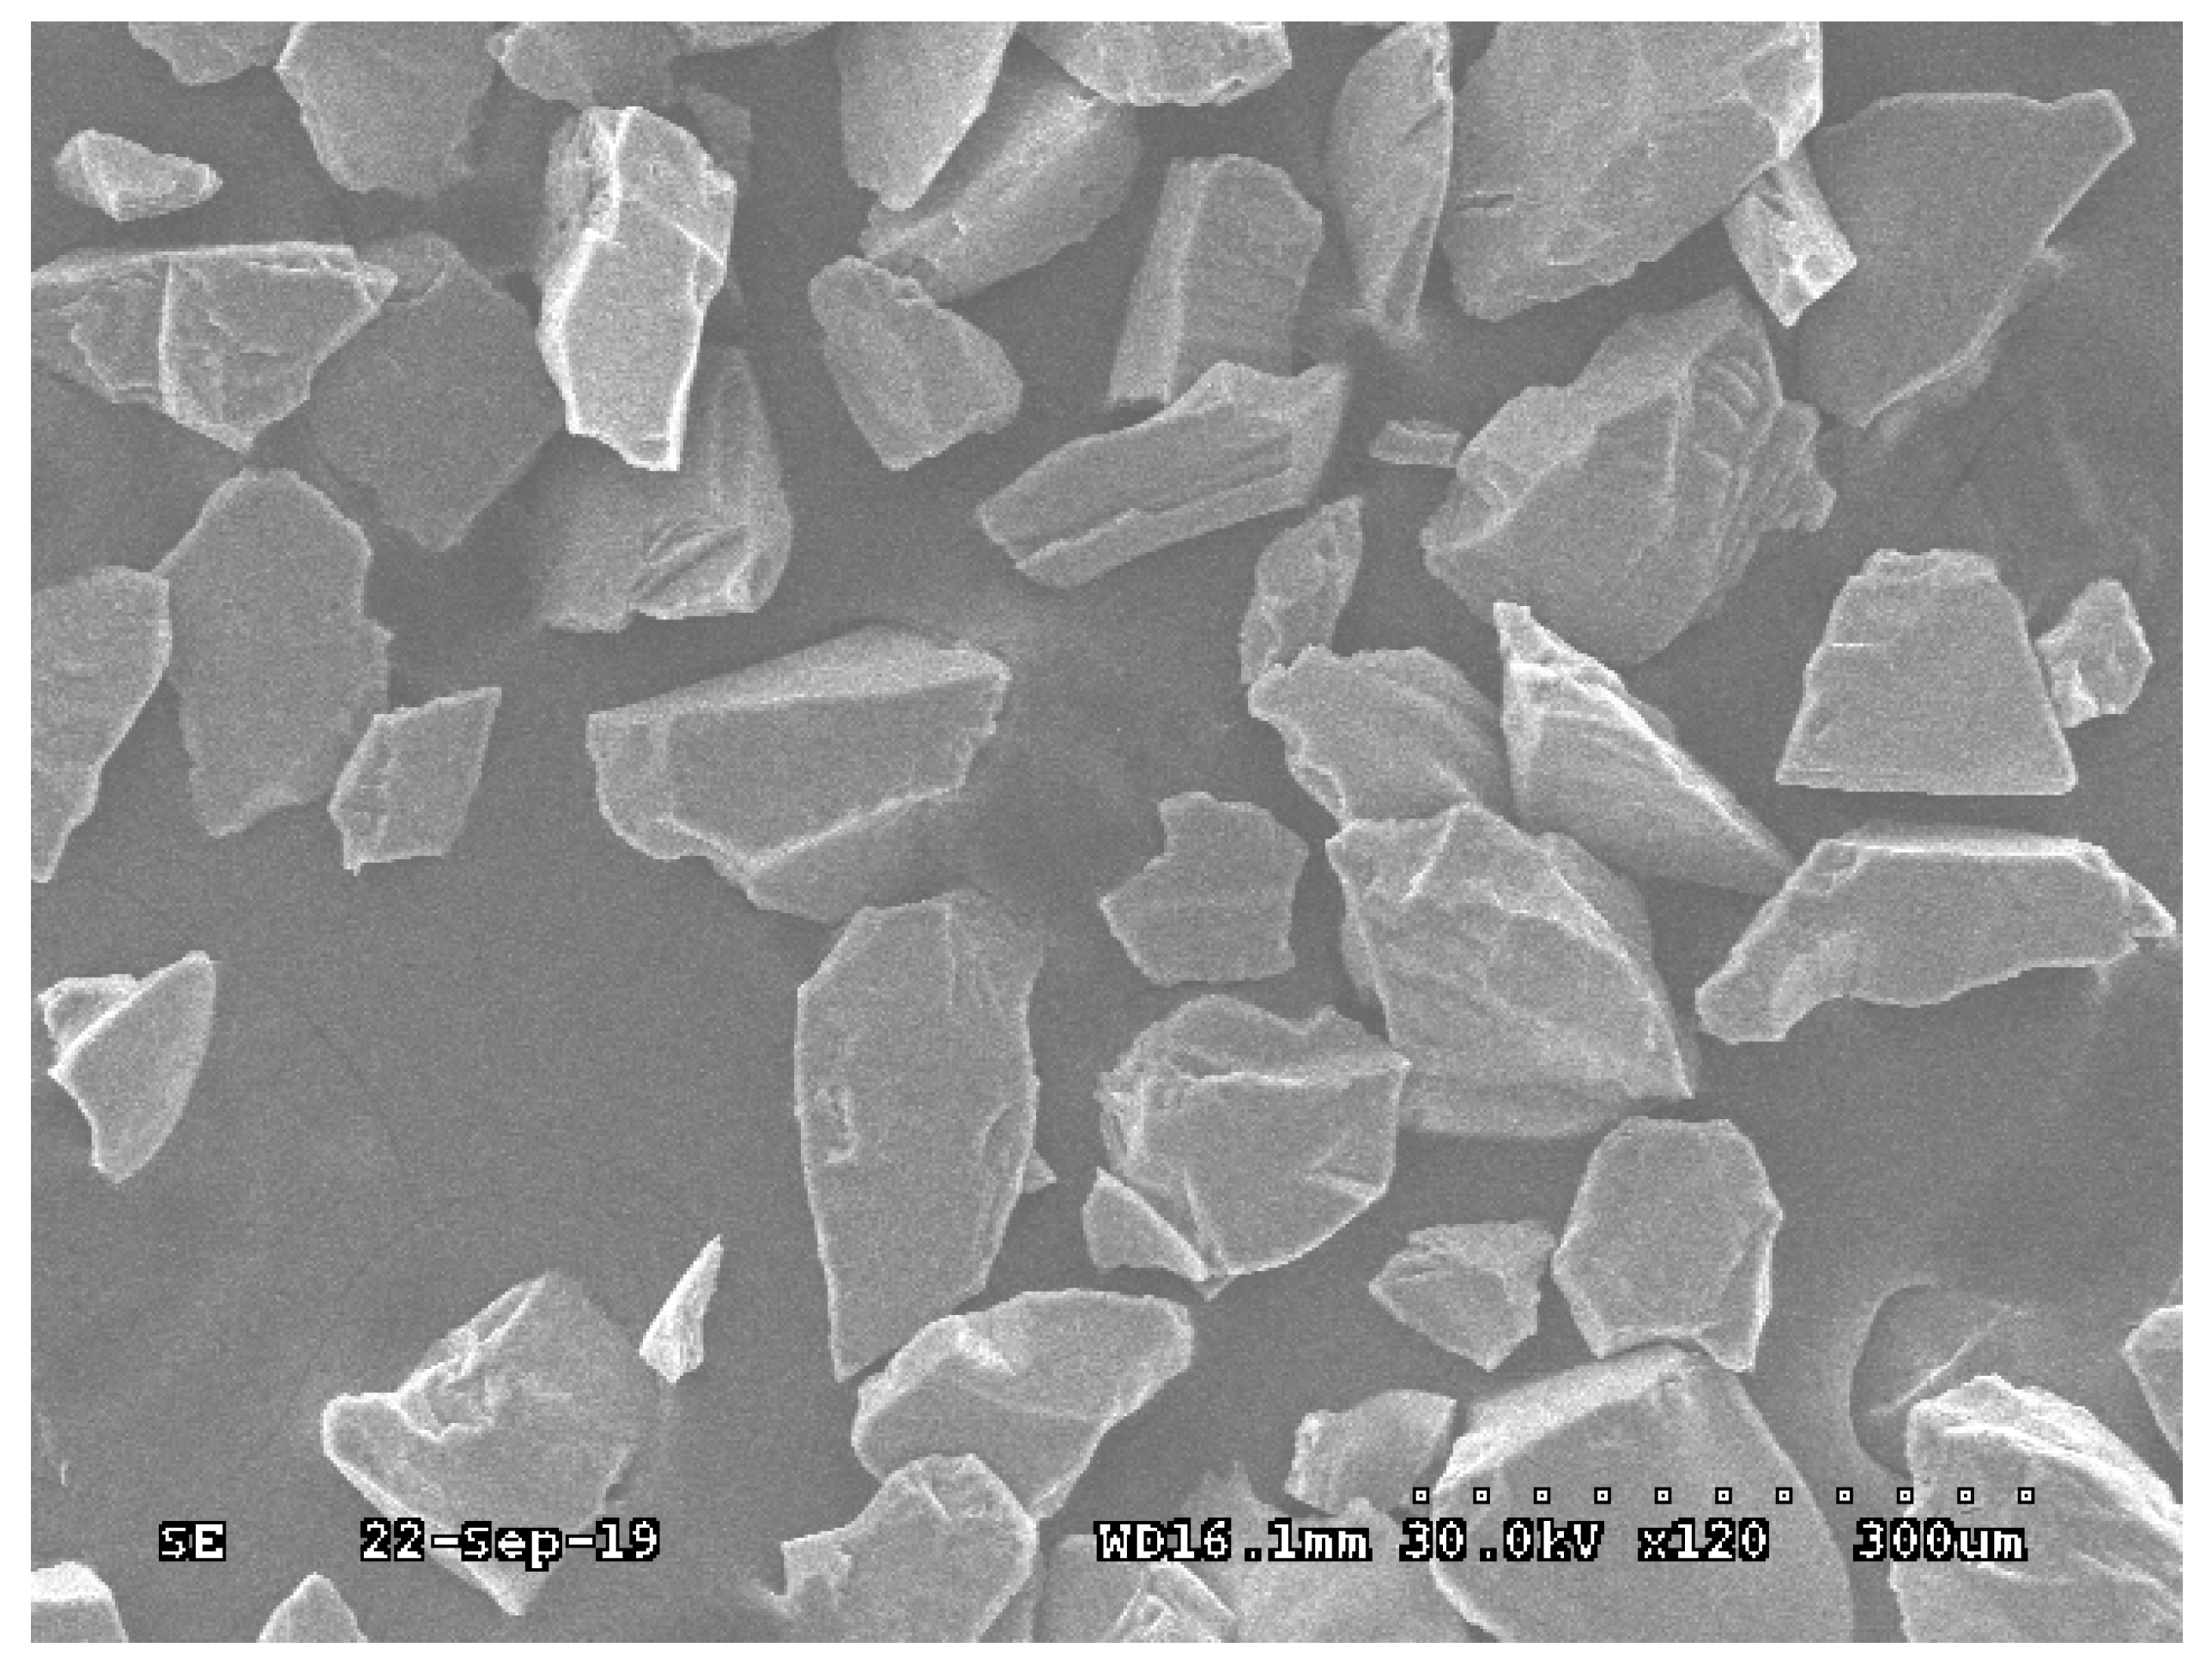
The quartz particles were flakey–blocky in character, and the long–middle axis ratio of 30–500 μm quartz particles was 1.6. Moreover, from large to small in proportion, the quartz particles′ morphological classifications were single-cone, square, and double-cone, each of which accounted for more than 20%.
(2)
According to the SEM analysis results, it was assumed that the short-axis length is half of the middle-axis length, and a simplified drag force model of single quartz particles was proposed. As verified by comparative analysis of experiments and simulations, the new drag force model based on particle morphology is suitable for numerical studies of single-quartz-particle sedimentation in mine wastewater.
(3)
In 30–500 μm quartz particles, the quartz particle velocity in the non-settling direction fluctuated by ±0.2 mm/s, and the maximum fluctuation value increased to ±0.4 mm/s under the influence of different release angles. When the initial velocity is greater than the sedimentation equilibrium velocity, the order in which the particles reach the sedimentation equilibrium velocity during the settlement process is double-cone, single-cone, and square.
(4)
With increasing quartz particles’ long–middle axis ratio, the sedimentation equilibrium velocity wanes, and the time required for the particle to reach the sedimentation equilibrium state increases. When the quartz particle size reaches 30–50 μm, the long–middle axis ratio has little effect on the sedimentation equilibrium velocity.

Supplementary Materials

The following supporting information can be downloaded at: https://www.mdpi.com/article/10.3390/pr10101981/s1, Figure S1. XRD analysis of quartz; Figure S2. Schematic diagram of particle peripheral morphology definition and simplified model; Figure S3. The instantaneous velocities of particles changes when the length is 56 μm and the width is 32 μm; Figure S4. The instantaneous velocities of particles changes when the length is 68 μm and the width is 52 μm; Figure S5. The instantaneous velocities of particles changes when the length is 168 μm and the width is 135 μm; Figure S6. The instantaneous velocities of particles changes when the length is 712 μm and the width is 339 μm; Figure S7. The instantaneous velocities of particles changes when the length is 777 μm and the width is 473 μm; Figure S8. Instantaneous velocities of particles with different long-middle axis ratios in an effective particle size of about 30 μm; Figure S9. Instantaneous velocities of particles with different long-middle axis ratios in an effective particle size of about 60 μm; Figure S10. Instantaneous velocities of particles with different long-middle axis ratios in an effective particle size of about 125 μm; Figure S11. Instantaneous velocities of particles with different long-middle axis ratios in an effective particle size of about 250 μm; Figure S12. Instantaneous velocities of particles with different long-middle axis ratios in an effective particle size of about 500 μm. Table S1: XRF analysis of quartz.

Author Contributions

Conceptualization, C.L.; methodology, K.L.; software, K.L. and X.B.; validation, C.L. and B.R.; formal analysis, J.C.; resources, X.B.; data curation, B.R.; writing—original draft preparation, K.L.; writing—review and editing, C.L.; supervision, L.L.; project administration, J.C.; funding acquisition, F.M. and C.L. All authors have read and agreed to the published version of the manuscript.

Funding

This research was funded by the National Natural Science Foundation of China (No. 52104243 and 51874011), Anhui Provincial Natural Science Foundation (2108085QE212), Key Research and Development Plan Projects in Anhui Province (202004a07020044), University-Level Key Projects of Anhui University of Science and Technology (xjzd2020–21), and Talent Introduction Fund of Anhui University of Science and Technology (13200007).

Institutional Review Board Statement

Not applicable.

Informed Consent Statement

Not applicable.

Data Availability Statement

Not applicable.

Acknowledgments

On behalf of my co-authors, we would like to express our great appreciation to the editor and reviewers.

Conflicts of Interest

The authors declare no conflict of interest.

References

  1. Lin, Z.; Sun, X.; Wang, Q.; Cao, J.; Wang, C.; Kuang, Y. Evaluation of the effect of hydraulic shear intensity on coal-slime water flocculation in a gradient fluidized bed. Powder Technol. 2020, 360, 392–397. [Google Scholar] [CrossRef]
  2. Dede, O.H.; Dede, C.; Sakar, S.; Sazak, M.; Ozer, H. Investigation of treatment process and treatment sufficiency of marble mine wastewater: A case study in Turkey. Environ. Dev. Sustain. 2020, 22, 6505–6512. [Google Scholar] [CrossRef]
  3. Samaniego, J.O.; Tanchuling, M.A.N. Sedimentation tests of small scale gold mining wastewater. Int. J. Sci. Technol. Res. 2018, 7, 73–80. [Google Scholar]
  4. Zhu, Z.; Xiong, X.; Liang, C.; Zhao, M. On the flocculation and settling characteristics of low- and high-concentration sediment suspensions: Effects of particle concentration and salinity conditions. Environ. Sci. Pollut. Res. 2018, 25, 14226–14243. [Google Scholar] [CrossRef] [PubMed]
  5. Kynch, G.J. A theory of sedimentation. Trans. Faraday Soc. 1952, 48, 166–176. [Google Scholar] [CrossRef]
  6. Yang, C.-Y.; Ding, Y.; York, D.; Broeckx, W. Numerical simulation of sedimentation of microparticles using the discrete particle method. Particuology 2008, 6, 38–49. [Google Scholar] [CrossRef]
  7. Zhu, H.P.; Zhou, Z.Y.; Yang, R.Y.; Yu, A.B. Discrete particle simulation of particulate systems: Theoretical developments. Chem. Eng. Sci. 2007, 62, 3378–3396. [Google Scholar] [CrossRef]
  8. Rotondi, M.; Di Felice, R.; Pagliai, P. Validation of fluid–particle interaction force relationships in binary-solid suspensions. Particuology 2015, 23, 40–48. [Google Scholar] [CrossRef]
  9. Wu, H.; Zheng, L.; Zhan, J.; Du, N.; Liu, W.; Ma, J.; Su, L.; Wang, L. Recycling silicon-based industrial waste as sustainable sources of Si/SiO2 composites for high-performance Li-ion battery anodes. J. Power Sources 2020, 449, 227513. [Google Scholar] [CrossRef]
  10. Ng, W.S.; Connal, L.A.; Forbes, E.; Mohanarangam, K.; Franks, G.V. In situ study of aggregate sizes formed in chalcopyrite-quartz mixture using temperature-responsive polymers. Adv. Powder Technol. 2018, 29, 1940–1949. [Google Scholar] [CrossRef]
  11. Abaka-Wood, G.B.; Addai-Mensah, J.; Skinner, W. A study of selective flotation recovery of rare earth oxides from hematite and quartz using hydroxamic acid as a collector. Adv. Powder Technol. 2018, 29, 1886–1899. [Google Scholar] [CrossRef]
  12. El Zrelli, R.; Rabaoui, L.; Ben Alaya, M.; Castet, S.; Zouiten, C.; Bejaoui, N.; Courjault-Radé, P. Decadal effects of solid industrial wastes on the coastal environment: Gulf of Gabes (Tunisia, Southern Mediterranean Sea) as an example. Estuarine, Coast. Shelf Sci. 2019, 224, 281–288. [Google Scholar] [CrossRef]
  13. Min, F.; Chen, J.; Peng, C.; Chen, C. Promotion of Coal Slime Water Sedimentation and Filtration via Hydrophobic Coagulation. Int. J. Coal Prep. Util. 2018, 41, 815–829. [Google Scholar] [CrossRef]
  14. Ahmed, S.A.; Metwally, M.-E.A.; Zakey, S.E. Utilizing industrial waste-water as alkali activator in sand-cement kiln dust bricks. Constr. Build. Mater. 2018, 182, 284–289. [Google Scholar] [CrossRef]
  15. Lu, X.; Liao, Z.; Li, X.; Wang, M.; Wu, L.; Li, H.; York, P.; Xu, X.; Yin, X.; Zhang, J. Automatic monitoring and quantitative characterization of sedimentation dynamics for non-homogenous systems based on image profile analysis. Powder Technol. 2015, 281, 49–56. [Google Scholar] [CrossRef]
  16. Rosa, B.; Parishani, H.; Ayala, O.; Wang, L.P. Settling velocity of small inertial particles in homogeneous isotropic turbulence from high-resolution DNS. Int. J. Multiphase Flow 2016, 83, 217–231. [Google Scholar] [CrossRef] [Green Version]
  17. Shahi, S.; Kuru, E. An experimental investigation of settling velocity of natural sands in water using Particle Image Shadowgraph. Powder Technol. 2015, 281, 184–192. [Google Scholar] [CrossRef]
  18. Akhshik, S.; Behzad, M.; Rajabi, M. CFD-DEM simulation of the hole cleaning process in a deviated well drilling: The effects of particle shape. Particuology 2016, 25, 72–82. [Google Scholar] [CrossRef]
  19. Guo, Y.; Yang, Y.; Yu, X. Influence of particle shape on the erodibility of non-cohesive soil: Insights from coupled CFD–DEM simulations. Particuology 2018, 39, 12–24. [Google Scholar] [CrossRef]
  20. Wang, L.; Li, R.; Wu, B.; Wu, Z.; Ding, Z. Determination of the coefficient of rolling friction of an irregularly shaped maize particle group using physical experiment and simulations. Particuology 2018, 38, 185–195. [Google Scholar] [CrossRef]
  21. Yang, L.; Zhang, J.; Yuan, H.; Mei, N. Analysis of the motion of small-scale ellipsoidal particles in a horizontal laminar flow field. Particuology 2018, 40, 44–51. [Google Scholar] [CrossRef]
  22. Sun, X.; Zhang, K.; Chen, Y.; Li, W.; Qu, J. Study on the settling velocity of drilling cuttings in the power law fluid. Powder Technol. 2020, 362, 278–287. [Google Scholar] [CrossRef]
  23. Ma, H.; Zhao, Y. Investigating the fluidization of disk-like particles in a fluidized bed using CFD-DEM simulation. Adv. Powder Technol. 2018, 29, 2380–2393. [Google Scholar] [CrossRef]
  24. Mola, I.; Yu, A.; Zhou, Z. Particle scale modelling of mixing of ellipsoids and spheres in gas-fluidized beds by a modified drag correlation. Powder Technol. 2018, 343, 619–628. [Google Scholar] [CrossRef]
  25. Zhao, Y.; Xu, L.; Umbanhowar, P.B.; Lueptow, R.M. Discrete element simulation of cylindrical particles using super-ellipsoids. Particuology 2020, 46, 55–66. [Google Scholar] [CrossRef]
  26. Yu, A.; Wu, C.-Y. Editorial for the special issue on simulation and modelling of particulate systems. Powder Technol. 2017, 314, 1. [Google Scholar] [CrossRef]
  27. Jiang, Z.; Rieck, C.; Bück, A.; Tsotsas, E. Modeling of inter- and intra-particle coating uniformity in a Wurster fluidized bed by a coupled CFD-DEM-Monte Carlo approach. Chem. Eng. Sci. 2020, 211, 115289. [Google Scholar] [CrossRef]
  28. Ma, L.; Wei, L.; Pei, X.; Zhu, X.; Xu, D. CFD-DEM simulations of particle separation characteristic in centrifugal compounding force field. Powder Technol. 2019, 343, 11–18. [Google Scholar] [CrossRef]
  29. Zhao, Y.; Xu, L.; Zheng, J. CFD-DEM simulation of tube erosion in a fluidized bed. AIChE J. 2017, 63, 418–437. [Google Scholar] [CrossRef]
  30. Ren, B.; Zhong, W.; Chen, Y.; Chen, X.; Jin, B.; Yuan, Z.; Lu, Y. CFD-DEM simulation of spouting of corn-shaped particles. Particuology 2012, 10, 562–572. [Google Scholar] [CrossRef]
  31. Marchelli, F.; Moliner, C.; Bosio, B.; Arato, E. A CFD–DEM study of the behaviour of single-solid and binary mixtures in a pyramidal spouted bed. Particuology 2019, 42, 79–91. [Google Scholar] [CrossRef]
  32. Wang, S.; Luo, K.; Yang, S.; Hu, C.; Fan, J. Parallel LES-DEM simulation of dense flows in fluidized beds. Appl. Therm. Eng. 2017, 111, 1523–1535. [Google Scholar] [CrossRef]
  33. Sun, R.; Xiao, H. Diffusion-based coarse graining in hybrid continuum–discrete solvers: Theoretical formulation and a priori tests. Int. J. Multiph. Flow 2015, 77, 142–157. [Google Scholar] [CrossRef] [Green Version]
  34. Zhang, D.; Hu, S.; Zhang, R.; Jiang, X.; Zhang, C.; Yin, H.; Wang, C.; Qu, X. Development of an explicit formula for predicting the drag coefficients of equiaxed dendrites. Comput. Mater. Sci. 2020, 172, 109319. [Google Scholar] [CrossRef]
  35. Zhang, H.; Xiong, B.; An, X.; Ke, C.; Chen, J. Numerical prediction on the drag force and heat transfer of non-spherical particles in supercritical water. Powder Technol. 2019, 361, 414–423. [Google Scholar] [CrossRef]
  36. Yan, S.; He, Y.; Tang, T.; Wang, T. Drag coefficient prediction for non-spherical particles in dense gas–solid two-phase flow using artificial neural network. Powder Technol. 2019, 354, 115–124. [Google Scholar] [CrossRef]
  37. Wang, Y.; Zhou, L.; Wu, Y.; Yang, Q. New simple correlation formula for the drag coefficient of calcareous sand particles of highly irregular shape. Powder Technol. 2018, 326, 379–392. [Google Scholar] [CrossRef]
  38. Samantaray, S.K.; Mohapatra, S.S.; Munshi, B. Experimental findings and analysis of terminal velocity and drag coefficient of Raschig Ring in vertical and inclined channel. Powder Technol. 2018, 340, 440–448. [Google Scholar] [CrossRef]
  39. Ke, C.; Shu, S.; Zhang, H.; Yuan, H. Drag coefficient and averaged Nusselt number of a scalene prolate ellipsoid. Appl. Math. Model. 2018, 64, 556–571. [Google Scholar] [CrossRef]
  40. He, L.; Tafti, D. Variation of drag, lift and torque in a suspension of ellipsoidal particles. Powder Technol. 2018, 335, 409–426. [Google Scholar] [CrossRef]
  41. Song, X.; Xu, Z.; Li, G.; Pang, Z.; Zhu, Z. A new model for predicting drag coefficient and settling velocity of spherical and non-spherical particle in Newtonian fluid. Powder Technol. 2017, 321, 242–250. [Google Scholar] [CrossRef]
  42. He, L.; Tafti, D.K.; Nagendra, K. Evaluation of drag correlations using particle resolved simulations of spheres and ellipsoids in assembly. Powder Technol. 2017, 313, 332–343. [Google Scholar] [CrossRef]
  43. Liu, C.; Min, F.; Liu, L.; Chen, J.; Du, J. Mechanism of hydrolyzable metal ions effect on the zeta potential of fine quartz particles. J. Dispers. Sci. Technol. 2017, 39, 298–304. [Google Scholar] [CrossRef]
  44. Liu, L.; Min, F.; Lu, F.; Zhang, M.; Song, S. A Novel Method for The Determination Of The Point Of Zero Net Proton Charge Of Colloidal Kaolinite In Aqueous Solutions. Surf. Rev. Lett. 2016, 23, 1650023. [Google Scholar] [CrossRef]
  45. Zhu, H.; Valdivieso, A.L.; Zhu, J.; Song, S.; Min, F.; Arroyo, M.A.C. A study of bubble size evolution in Jameson flotation cell. Chem. Eng. Res. Des. 2018, 137, 461–466. [Google Scholar] [CrossRef]
  46. Zhu, H.; Valdivieso, A.L.; Zhu, J.; Min, F.; Song, S.; Huang, D.; Shao, S. Effect of dodecylamine-frother blend on bubble rising characteristics. Powder Technol. 2018, 338, 586–590. [Google Scholar] [CrossRef]
  47. Peng, Z.; Galvin, K.; Doroodchi, E. Influence of inclined plates on flow characteristics of a liquid-solid fluidised bed: A CFD-DEM study. Powder Technol. 2019, 343, 170–184. [Google Scholar] [CrossRef]
  48. Jiang, Z.; Hagemeier, T.; Bück, A.; Tsotsas, E. Color-PTV measurement and CFD-DEM simulation of the dynamics of poly-disperse particle systems in a pseudo-2D fluidized bed. Chem. Eng. Sci. 2018, 179, 115–132. [Google Scholar] [CrossRef]
  49. Zhao, Y.; Ding, Y.; Wu, C.; Cheng, Y. Numerical simulation of hydrodynamics in downers using a CFD–DEM coupled approach. Powder Technol. 2010, 199, 2–12. [Google Scholar] [CrossRef]
  50. Hwang, B.; Park, H.S.; Jung, W.H.; Lee, M.; Kim, M.H. Numerical validation and investigation for the sedimentation of solid particles in liquid pool using the CFD-DEM coupling algorithm. Nucl. Eng. Des. 2019, 355, 110364. [Google Scholar] [CrossRef]
  51. Peng, Z.; Joshi, J.B.; Moghtaderi, B.; Khan, S.; Evans, G.M.; Doroodchi, E. Segregation and dispersion of binary solids in liquid fluidised beds: A CFD-DEM study. Chem. Eng. Sci. 2016, 152, 65–83. [Google Scholar] [CrossRef]
  52. Di Felice, R. The voidage function for fluid-particle interaction systems. Int. J. Multiph. Flow 1994, 20, 153–159. [Google Scholar] [CrossRef]
  53. Chien, S.-F. Settling Velocity of Irregularly Shaped Particles. SPE Drill. Complet. 1994, 9, 281–289. [Google Scholar] [CrossRef]
  54. Dioguardi, F.; Mele, D. A new shape dependent drag correlation formula for non-spherical rough particles. Experiments and results. Powder Technol. 2015, 277, 222–230. [Google Scholar] [CrossRef]
  55. Qiu, L.-C.; Wu, C.-Y. A hybrid DEM/CFD approach for solid-liquid flows. J. Hydrodyn. 2014, 26, 19–25. [Google Scholar] [CrossRef]
  56. Zhu, Z.; Yin, W.; Yang, B.; Fu, Y.; Xue, J. Reduction of the slime contamination on fine coking coal by using the reverse-and-direct flotation process. Colloids Surfaces A Physicochem. Eng. Asp. 2019, 579, 123681. [Google Scholar] [CrossRef]
  57. Zhu, X.-N.; Nie, C.-C.; Wang, S.-S.; Xie, Y.; Zhang, H.; Lyu, X.-J.; Qiu, J.; Li, L. Cleaner approach to the recycling of metals in waste printed circuit boards by magnetic and gravity separation. J. Clean. Prod. 2019, 248, 119235. [Google Scholar] [CrossRef]
Figure 1. SEM image of a quartz sample.
Processes 10 01981 g001
Figure 2. Statistical analysis of the quartz particles’ long–middle axis ratios.
Processes 10 01981 g002
Figure 3. Statistical analysis of the quartz particles’ morphology type.
Processes 10 01981 g003
Figure 4. HD sedimentation photography system.
Processes 10 01981 g004
Figure 5. Comparison of experimental data and numerical simulation of sedimentation equilibrium velocities of different long–middle axis ratios.
Processes 10 01981 g005
Figure 6. Three-dimensional velocity variation diagram of particles at different release angles.
Processes 10 01981 g006
Figure 7. Three-dimensional velocity variation diagram of particles with different peripheral morphologies.
Processes 10 01981 g007
Figure 8. The relationship diagram of different long–middle axis ratios and particle sedimentation equilibrium velocity.
Processes 10 01981 g008
Publisher’s Note: MDPI stays neutral with regard to jurisdictional claims in published maps and institutional affiliations.

