Article

Towards an Uncertainty-Aware Visualization in the Digital Humanities †

by
Roberto Therón Sánchez
*,
Alejandro Benito Santos
,
Rodrigo Santamaría Vicente
and
Antonio Losada Gómez
Visual Analytics Group (VisUSAL), Department of Computer Science and Automation, University of Salamanca, 37008 Salamanca, Spain
*
Author to whom correspondence should be addressed.
This paper is an extended version of our paper published in TEEM’18, Salamanca, Spain, 24–26 October 2018.
Informatics 2019, 6(3), 31; https://doi.org/10.3390/informatics6030031
Submission received: 3 June 2019 / Revised: 26 July 2019 / Accepted: 2 August 2019 / Published: 10 August 2019
(This article belongs to the Collection Uncertainty in Digital Humanities)

Abstract

:
As visualization becomes widespread in a broad range of cross-disciplinary academic domains, such as the digital humanities (DH), critical voices have been raised on the perils of neglecting the uncertain character of data in the visualization design process. Visualizations that, purposely or not, obscure or remove uncertainty in its different forms from the scholars’ vision may negatively affect the manner in which humanities scholars regard computational methods as useful tools in their daily work. In this paper, we address the issue of uncertainty representation in the context of the humanities from a theoretical perspective, in an attempt to provide the foundations of a framework that allows for the construction of ecological interface designs which are able to expose the computational power of the algorithms at play while, at the same time, respecting the particularities and needs of humanistic research. To this end, we review past uncertainty taxonomies in other domains typically related to the humanities and visualization, such as cartography and GIScience. From this review, we select an uncertainty taxonomy related to the humanities that we link to recent research in visualization for the DH. Finally, we bring a novel analytics method developed by other authors (Progressive Visual Analytics) into question, which we argue can be a good candidate to resolve the aforementioned difficulties in DH practice.

1. Introduction

The importance of computational tools in the work of researchers in the humanities has been continuously increasing and the definition of the digital humanities (DH) has been reformulated accordingly, as DH research must be integrated with practices within and beyond academia [1]. Both research and practice have been adopting new methodologies and resources which render definitions obsolete quite rapidly. In our work, we adhere to the characterization of DH as “the application and/or development of digital tools and resources to enable researchers to address questions and perform new types of analyses in the humanities disciplines” [2]. This symbiosis means that the application of humanities methods to research into digital objects or phenomena [1] is another way to look at DH research.
At any rate, the computational methods that are available to humanities scholars are very rich and may intervene at different stages of the life cycle of a project. Some examples of computational methods applied in DH research are the analysis of large data sets and digitized sources, data visualization, text mining, and statistical analysis of humanities data. We are aware that the diversity of fields that fall under the broad outline of what constitutes DH research brings many different and valid goals, methods, and measurements into the picture and, so, there is no general set of procedures that must be conducted to qualify as DH research. However, any intervention of computational tools in research is bound to deal with data, which will go through several processes and modifications throughout the life cycle of the project, even in cases where the research itself is not data-driven. From the inception of the project to the generation of knowledge, the intervention of computational tools transforms data by means of processes that may increase the uncertainty of the final results. Furthermore, during the life cycle of the project, there are many situations in which the scholars and/or stakeholders need to make decisions to advance the research, based on incomplete or uncertain data [2]. This will, in turn, yield another level of uncertainty inherently associated to a particular software or computational method.
The motivation of this paper is to examine when such decision making under uncertainty occurs in DH projects where data transformations are performed. This work is part of the PROVIDEDH (PROgressive VIsual DEcision Making for Digital Humanities) research project, which aims to enhance the design process of visual interactive tools that convey the degree of uncertainty of humanistic data sets and related computational models used. Visualization designs, in this manner, are expected to progressively adapt to incorporate newer, more complete (or more accurate) data as the research effort develops.
The rest of the paper is organized as follows: In Section 2, we introduce the types of uncertainty as defined in reliability theory, as this provides a mature and sound body of work upon which to build our research. In Section 3, we examine DH humanities research and practice in a first attempt to characterize the sources of uncertainty in DH. Section 4 is devoted to discussing how management and processing of data in DH research and practice is subject to uncertainty. Section 5 presents a progressive visual analysis proposal that approaches DH projects or experiences in which uncertainty and decision-making play a big role, with the intention of providing some hints on how mitigate the impact of uncertainty on the results. Finally, in Section 6, we outline the main conclusions of our work, which can be used to scaffold the support of decision-making under uncertainty in DH.

2. Uncertainty Taxonomies

The characterization of uncertainties has been thoroughly investigated in the literature, with major emphasis in areas such as risk analysis, risk management, reliability engineering [3,4,5,6], and decision-making and planning [7], with contributions from many other fields: Operational research [8], software engineering [9], management [10], ecology [11], environmental modelling [12], health care [13], organizational behavior [14], and uncertainty quantification [15], to name a few.
In order to design effective systems to help humanists make decisions under conditions of uncertainty, it is key to reflect on the notion and implications of uncertainty itself. Identifying the stages of the analysis pipeline is of vital importance for the conception of data structures, algorithms, and other mechanisms that allow the final representation in a user interface.
We mentioned how the categorization and assessment of uncertainty have produced many academic contributions from different areas of human knowledge, ranging from statistics and logic to philosophy and computer science, to name a few. Drawing from its parent body of research, cartography and GEOVisualization/GIScience scholars have typically developed a special interest in providing taxonomies for uncertainty in all its forms. Carefully presenting uncertain information in digital maps has been identified as key for analysts to make more-informed decisions on critical tasks for the well-being of society, such as storm and flood control, census operations, and the categorization of soil and crops. Given that, to the best of our knowledge, an uncertainty taxonomy for visualization in the humanities is yet to be proposed, in this section we review past approaches to uncertainty taxonomies proposed in the visualization community. First, we review the GIScience body of literature, because it is closely related to visualization and the humanities, mainly due to the works on visual semiotics theory by prominent cartographers such as Bertin, MacEachren, or Fisher, which we comment on below. Furthermore, we also describe past attempts to categorize uncertainty in the scientific visualization realm, which we argue are more closely related to modern data analysis pipelines.

2.1. Uncertainty in GIScience

The notable contributions by MacEachren [16] and Fisher [17] supposed a great breakthrough in the conceptualization of spatial uncertainty in informational systems, which have been progressively adapted to other bodies of research in recent times. For example, MacEachren’s first taxonomy of uncertainty revolved around the juxtaposition of the concepts of quality and uncertainty. MacEachren reflected, in his study, on the different manners in which uncertainty could be introduced into the data analysis pipeline (e.g., data collection and binning) and presented concepts like accuracy (the “exactness” of data) and precision (“the degree of refinement with which an operation is performed or a measurement taken”), which have been regularly linked to uncertainty in more recent research, up to the present day. Another important contribution of this author was to provide visual guidelines for depicting uncertainty, based on previous work by the world-renowned French cartographer and theorist Jacques Bertin, mostly known for his work on visual semiotics in the 1960s. As a result, MacEachren presented different treats that could be used to depict uncertainty in numerical or nominal information. Among these treats, he pointed out the use of color saturation (color purity) to indicate the presence of uncertainty, a semiotic that is widely accepted nowadays. Finally, the author introduced other notions on how and when to present uncertainty in the visualizations and on the value of providing such uncertainty information in an analytic process. Regarding the former, the uncertainty can be presented in three ways: Side-by-side, in a sequential manner, or employing bi-variate maps. In the first approach, two different (and possibly co-ordinated) views are put side-by-side, one depicting the actual information that is subject of study while the other presents the uncertainty values linked to each of the data points in the first. In the sequential approach, the interactive approach resides in the alternate presentation of the views explained in the previous case. Finally, bi-variate maps represent data and the associated uncertainty within the same view. For the evaluation of uncertainty visualization, the author stressed the difficulty in assessing uncertainty depictions in purely exploratory approaches, when the initial message to communicate is unknown to the designer and, therefore, communication effectiveness standards are rendered inadequate in this case. In order to solve the question, in a rather practical vision, he appeals to the evaluation of the utility that this depiction has in “decision-making, pattern-recognition, hypothesis generation or policy decisions”. This is in line with many of the dictates of user-centered design, in which the identification of concrete needs and subjective emotions in the final users is considered a key element of the design process [18].
Uncertainty has various interpretations in different fields and, in our research, we refer to uncertainty as “a complex characterization about data or predictions made from data that may include several concepts, including error, accuracy, validity, quality, noise, and confidence and reliability” [19]. According to Dubois [20], knowledge can be classified, depending on its type and sources, as generic (repeated observations), singular (situations like test results or measurements), or coming from beliefs (unobserved singular events). Uncertainty is often classified [21,22,23] into two categories: Aleatoric and epistemic uncertainty.

2.1.1. Aleatoric Uncertainty

This uncertainty exists due to the random nature of physical events. This type of uncertainty refers to the inherent uncertainty due to probabilistic variability and, thus, is modeled by probability theory. It is also known as statistical uncertainty, stochastic uncertainty, type A uncertainty, irreducible uncertainty, variability uncertainty, and objective uncertainty. It mainly appears in scientific domains and is usually associated with objective knowledge coming from generic knowledge or singular observations. The main characteristic of aleatory uncertainty is that it is considered to be irreducible [24]. In our adaptation of Fisher’s taxonomy to the digital humanities, we identify aleatoric uncertainty as algorithmic uncertainty, which is introduced by, for example, the probabilistic nature of the algorithms at play and therefore cannot be reduced. This concept is further explained in Section 3.1.

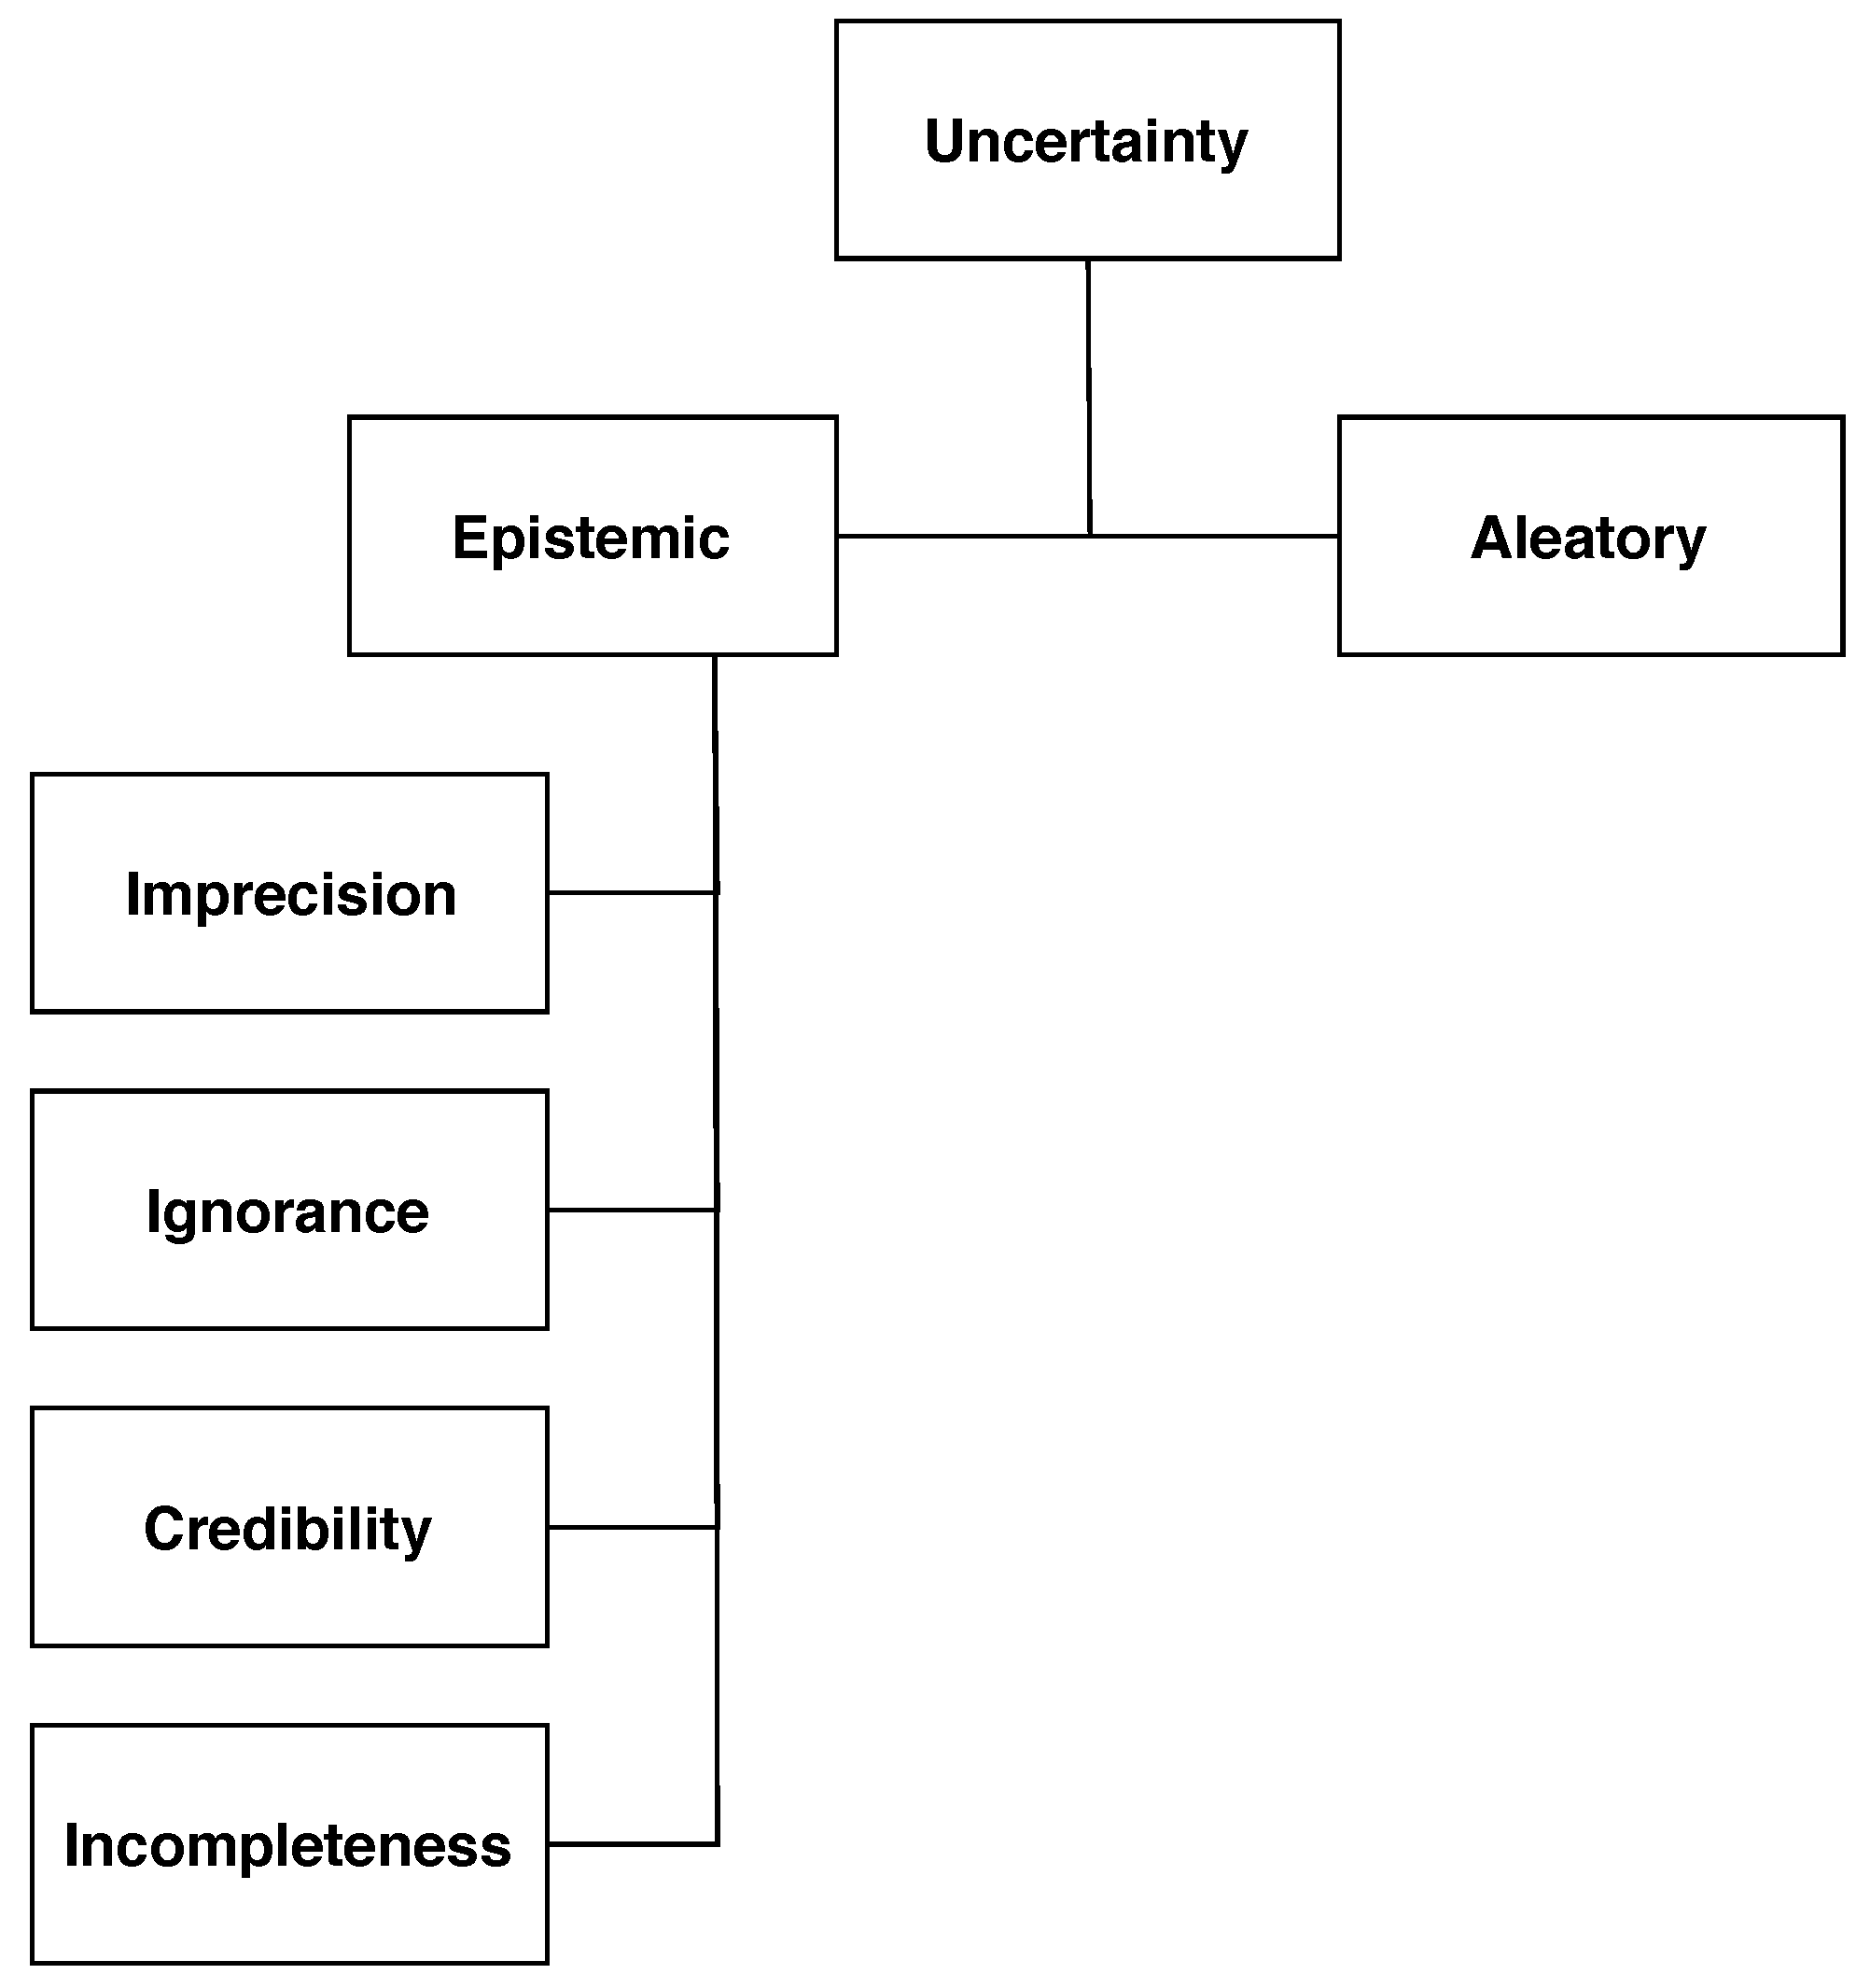
2.1.2. Epistemic Uncertainty

This type of uncertainty results from a lack of knowledge or its imprecise character and is associated with the user performing the analysis. It is also known as systematic uncertainty, subjective uncertainty, type B uncertainty, reducible uncertainty, or state of knowledge. It is mainly found with subjective data based on beliefs and can be modeled with the belief function theory, as introduced by Arthur P. Dempster [25]. This kind of uncertainty is specifically related to decision-making processes and, as such, may be found both in scientific (usually associated with hypothesis testing) and humanities (associated with disputed theories or events) research. The main characteristic of epistemic uncertainty is that it is considered to be reducible, due to the fact that new information can reduce or eliminate it.
Also emerging from GIScience, Fisher presented, in 1999, three types of uncertainty in his proposal: Error, vagueness, and ambiguity, which he framed in relation to the problem of definition. The difficulty resides in defining the class of object under examination and the individual components of such a class. Fisher argued that the problem of defining uncertainty was one of this kind and provided a taxonomy that depends on whether the class of objects and the objects are initially well or poorly defined. If the class of objects and its participants are well-defined, then the uncertainty is probabilistic (or aleatoric). Aleatoric uncertainty is inherent to the physical properties of the world and is irreducible. The correct way to tackle probabilistic uncertainty is to provide a probability distribution which characterizes it and this solution can be found in the mathematical and statistical literature. On the other hand, the class and the individuals can not be well-defined, in what is called vagueness or ambiguity. Vagueness is a manifestation of epistemic uncertainty, which is considered to be reducible if the information on the subject is completed, and is the kind of uncertainty that is addressed by analytics and decision-making support systems. Vagueness has been addressed many times in the past and is usually modeled using fuzzy set theory, among other approaches [26].
Yet another problem might arise in the assignment of individuals to the different classes of the same universe, in what is called ambiguity. More concretely, whenever an individual may belong to two or more classes, it is a problem of discord. If the assignment to one class or another is open to interpretation, the authors will refer to it as non-specificity. These two categorizations are presented at the bottom of Fisher’s taxonomy of uncertainty, which is reproduced in Figure 1.

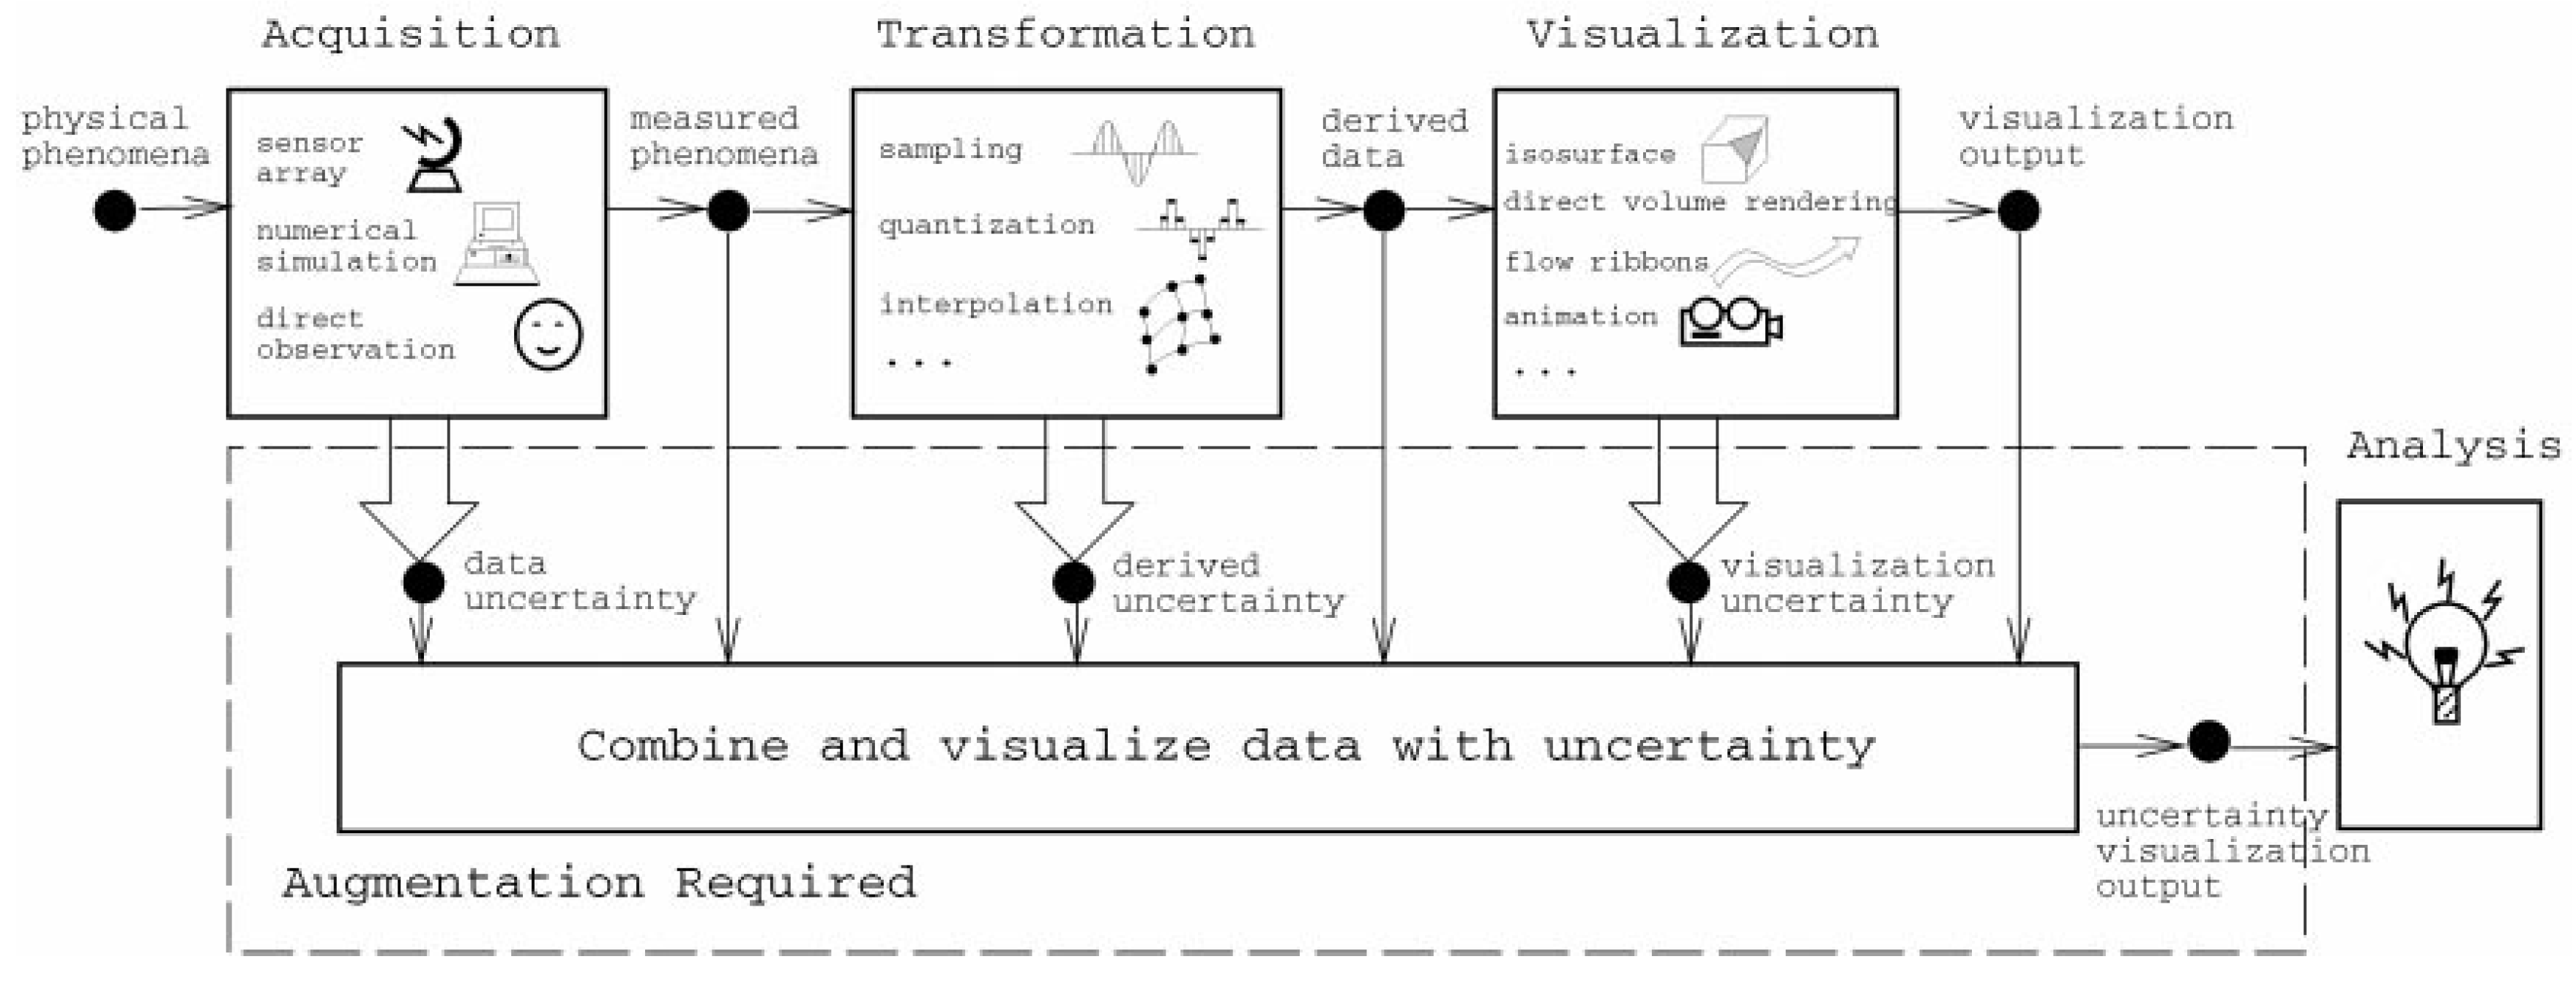
2.2. Sources of Uncertainty in Data Analysis

Concurrently with the works presented in the previous section, contributions by authors from other fields of computing started to appear. In the case of scientific/information visualization, contributions by Pang et al. [27] are worth of mention. In their paper, the authors surveyed different visualization techniques which addressed the issue of uncertainty at various levels. Concretely, they proposed the use of glyphs, animations, and other treats to made users aware of the varying degrees and locations of uncertainty in the data. The taxonomy that they employed was derived from a standard definition given at the time of writing (NIST standards report ’93). The report classified uncertainty into four well-defined categories: Statistical (mean or standard deviation), error (a difference between measures), range (intervals in which the correct value must reside), and scientific judgment (uncertainty arising from expert knowledge and that was formed out of the other three). While the latter was not considered in their study, they incorporated the first three into a data analysis pipeline that is shown in Figure 2.
  • Uncertainty in acquisition: All data sets are, by definition, uncertain due to their bounded variability. The source of this variability can be introduced by the lack of precision of the electronic devices capturing the information (e.g., a telescope), emerge from a numerical calculation performed according to a model (e.g., the limited precision of computers in representing very large numbers), or induced by human factors; for example, due to differences in perception of the individuals reporting the information through direct observation.
  • Uncertainty in transformation: Appears due to the conversions applied to the data in order to produce meaningful knowledge. This could be related to the imprecise calculation of new attributes when applying clustering, quantization, or resampling techniques.
  • Uncertainty in visualization: The process of presenting the information to the final user is also subject to introducing uncertainty. The rendering, rasterization, and interpolation algorithms at play that produce the graphical displays of information are also prone to errors. Furthermore, there is usually a performance/accuracy trade-off present at this stage: The more reliable and accurate a visualization is, the more computational resources it will employ and, almost always, the performance times will decay substantially. As has been noted by some authors, this has a negative effect on the way humans grasp the information contained in the data and can even invalidate the whole approach to data analysis [28,29,30].
Recent research has shown that the black-box approach, which is followed in many current visual analytics systems, has serious implications on decision-making and should be avoided at all costs [31]. The veracity of the visualizations should not be spontaneously assumed by users and visualization designers and must be addressed with state-of-the-art techniques which are able to maintain an adequate balance between performance, accuracy, and interactivity in the visualizations. As we discuss in the following sections, we identify progressive visual analytics (PVA) as a potential candidate to present uncertainty in a data analysis pipeline and resolve these issues.
Regarding the effect of uncertainty on the analysis task, in a more recent work [32], the authors commented on the approach to uncertainty and offered a more updated model of uncertainty, which can be better related to the modern big data analytics paradigm. These authors introduced, in this model, the notion of lineage or provenance, which refers to the chain of trust that is associated with any sort of data. The purpose of the lineage is to capture the uncertainty introduced by the source of information, especially when the acquisition is performed by human individuals (credibility). Humans are not only subject to cognitive bias and complex heuristics when the decision-making involves risk [33,34], but also have the ability to lie and deceive (intentionally or not) under a variety of circumstances. The authors of this paper argue that this uncertain information reported by human factors should be bound to the data as a base value of uncertainty. This information should serve as the base value for other types of uncertainty introduced at later stages of analysis (for example, every time the data are transformed).
The authors also commented on the effect of time delays between the occurrence of an event and the information acquisition related to that event. The longer the time in between these two, the more uncertainty is added due to different factors, such as changes in memory or inability to decide on the recency of a set of similar reports. Finally, the authors also provided a concise description of the analyst’s goals in the decision-making under uncertainty, which is “to minimize the effects of uncertainties on decisions and conclusions that arise from the available information”. In order to ensure this effect, it is key to “identify and account for the uncertainty and ensure that the analyst understands the impacts of uncertainty”. In this process, two key tasks, according to the authors, are “to find corroborating information from multiple sources with different types of uncertainty” and “to make use of stated assumptions and models of the situation”. The latter case refers to the ability to model the data, in order to allow the discovery of patterns, gaps, and missing information, a transformation that can also introduce more kinds of uncertainty.

2.3. Implications for Decision-Making in the Digital Humanities

As explained in the introduction, our research is focused on investigating opportunities to support decision-making in DH research and practice by means of interactive visualization tools. Given the exposed dual nature of uncertainty, the second type of uncertainty (epistemic) offers an opportunity to enhance DH research and support stakeholders in assessing the level of uncertainty of a project at any given moment. Moreover, aleatoric uncertainty, which we pose as algorithmic uncertainty in a typical data analysis pipeline (Figure 2), should also be communicated to enhance the comprehensibility of methods and results.
On the one hand, epistemic uncertainty can be modeled with belief function theory, which defines a theory of evidence that can be seen as a general framework for reasoning with uncertainty. On the other hand, recent efforts can be found in the literature that have focused on the adaptation and proposal of data provenance models for DH ecosystems [35,36], and which are often used to record the chain of production of digital research results, in order to increase transparency in research and make such results reproducible [37]. These models can also be enhanced, in order to convey the level of uncertainty at any link in the chain. This would provide an opportunity to make decisions related to a change in the research direction, if, for instance, at some point, the conclusion is incompatible with what the humanist feels to be solid ground epistemically, or new information is introduced that mitigates a given uncertainty level.

3. Modeling Uncertainty in the Digital Humanities

Although, to the best of our knowledge, a taxonomy of sources of uncertainty in DH has not yet been proposed, there is no doubt that, in this realm, there are multiple sources of uncertainty to be found. It is our aim to contribute to paving the way towards a taxonomy of uncertainty sources in DH by identifying and discussing some instances of sources of uncertainty related to data in DH research and practice. To this end, building upon Fisher’s taxonomy presented in the previous section, we identify four notions as sources of epistemic uncertainty that we have detected in a great majority of DH works: Imprecision (inability to express an exact value of a measure), ignorance (inability to express knowledge), incompleteness (when not all situations are covered), and credibility (the weight an agent can attach to its judgment).
A proposal of a general uncertainty taxonomy for the DH can be built on top of these categories or notions (Figure 1), which are described in greater detail in the following. Also, to complete the description of Fisher’s notions, we provide examples of each category in the context of four different DH projects: Uncertainty in GIScience [38], a data set of French medieval texts [39], information related to early holocaust data [40], and an approach to the presence of uncertainties in visual analysis [41].

3.1. Aleatoric Uncertainty

According to the definition of aleatoric uncertainty provided in the previous sections, this kind of uncertainty is irreducible and, therefore, we can reformulate it and link it to the different sources of uncertainty identified by Pang et al. Namely, aleatoric uncertainty becomes algorithmic uncertainty in our proposal, and is related to the probabilistic nature of the computational techniques at play. Take, for example, the set of language/topic models, such as word2vec or Latent Dirichlet Allocation (LDA), which have become recently popular among DH practitioners [42]. These algorithms are inherently probabilistic, which means their output is given as a probability density function (PDF). Therefore, it would make no sense to try to reduce this uncertainty, but rather the analytics system should be responsible for communicating it to the user in the most realistic possible manner.

3.2. Epistemic Uncertainty

Epistemic uncertainty occurs in poorly-defined objects, as explained by Fisher. This uncertainty can be reduced through, for example, research on a data set and, under our approach, it is subject to individual interpretation. For example, a scholar might decide he or she is not confident of working with a certain primary source, either because he or she is unfamiliar with the topic or simply because the source is excessively deteriorated, or similar. We argue that it is important to capture these partial interpretations and fixate them to the research object (e.g., a data set) such that the same researcher or others can, for example, follow a reasoning chain when trying to replicate an experiment. Below, we present the categories of epistemic uncertainty, as described by Fisher, and corroborate their theoretical applicability in the context of real DH scenarios.

3.2.1. Imprecision

Imprecision refers to the inability to express the definitive accurate value of a measure or to a lack of information allowing us to precisely obtain an exact value. Ideally, we would be able to study and research the topic we are dealing with while working with a data set, in order to sort out any uncertainties and remove them from it, but, in most cases, we will find barriers that will prevent that. In three of the cited DH projects [38,39,40], imprecision is present in different forms. One instance of the presence of uncertainty due to imprecision is that related to time and dates, such as that related to the medieval texts introduced in [39]. Not every one of the texts had this problem but, in multiple instances, a concrete date on which they were written was not available. Instead, they were represented in idiosyncratic ways (e.g., between 1095–1291, first half of the 14th century, before 1453, and so on), making for a very strong presence of uncertainty to assess.

3.2.2. Ignorance

Ignorance can be partial or total, and is related to the fact that information could have been incorrectly assessed by the person gathering or organizing the data. It is also possible that people, not fully sure about how to deal with data and feeling insecure about it, ignore some information and generate uncertainty during the evaluation and decision processes.
Mostly due to the passage of time (in the scope of DH) and the fact that new knowledge becomes available with new experiences and research projects being completed and becoming available, we are able to find information that makes that which we had at the inception of our projects outdated or misread/misunderstood at the time. Interpretation issues can also be considered in this category or notion, given that not everybody may have the same perspective on the same data, depending on its context, which can affect its certainty.
In iterative research projects unexpected results may also be reached. In this scenario, if the person analyzing the data is insecure and his or her expectations are not on par with what was generated, it is possible that some uncertainty is generated. This uncertainty can turn into the ignorance of the result, providing a new data set being wrongly assessed. This issue was tackled by Seipp et al. [41], in relation to the presence of uncertainties in visual analytics. One of the main issues in visual analysis is the possibility of misinterpretation and, in order to avoid it, the data quality needs to be appropriately represented. Even with that, the results can be misleading, and the analyst may not be able to interpret them correctly and become encouraged to ignore them and potentially introduce uncertainty into further iterations if the perceived values differ from the real values conveyed by the visualization.

3.2.3. Credibility/Discord

Probably one of the strongest sources of uncertainty is the credibility of any data set or person involved in its assessment, which can be crucial to the presence (or lack) of uncertainty. This concept can be linked to that of biased opinions, which are related to personal visions of the landscape, which can make for wild variations between different groups and individuals, given their backgrounds. Moreover, this also refers to the level of presence of experts that take charge of the preparation or gathering of data, its usage, research on it, and so on. The more weight an agent bears, the less (in principle) unpredictability is expected to be present in the data. This notion is also important when working on open projects with studies that allow external agents to contribute in different ways, given that their knowledge of the matter at hand could be very different from that of others, and this must be taken into consideration when dealing with their input, as they could potentially introduce other types of uncertainty into the project and alter the results of the research. This last type of research can be related to that carried out by Binder et al. for the GeoBib project [40]. Given its open nature, in which people could contribute new information or modify readily available data. As each individual joins the system with a different background, experience, and knowledge, the information entered in the database can be related to the same record but may be completely different, depending on who introduces it. It is the researchers’ work to assess how credible each input is, depending on where it comes from.

3.2.4. Incompleteness

Finally, the notion of incomplete data is a type of uncertainty that can be related to that of imprecise values. We can never be totally sure of anything, and that mostly has to do with the lack of knowledge (imprecision) that comes from the impossibility of knowing every possible option available. When dealing with a data set comprised of logs of visitors of a library in Dublin [38], the authors found records that included names of places that are neither longer existing nor traceable, due to their renaming or simply due to the person recording the instance used a name bound to his or her own knowledge. This makes it impossible to geo-localize those places, making for an ultimately incomplete (and, also, imprecise if wrong coordinates are assigned instead of leaving blank fields) data set.

4. Data and Uncertainty in Digital Humanities

It is assumed that science advances on a foundation of trusted discoveries [43] and the scientific community has traditionally pursued the reproducibility of experiments, with transparency as a key factor to grant the scrutiny and validation of results. Recently, the importance of disclosing information on data handling and computational methods used in the experiments has been recognized, since access to the computational steps taken to process data and generate findings is as important as access to the data themselves [44]. On the contrary, humanities research has a different relationship with data. Given the nature of this research, data are continuously under assessment and different interpretative perspectives. Edmond and Nugent [45] argued that “An agent encountering an object or its representation perceives and draws upon the data layer they apprehend to create their own narratives”, understanding by narrative “the story we tell about data”. The collaboration between humanities and computer science has opened new ways of doing research, but has also brought many challenges to overcome. Related to our research, we focus on the role of data in DH, as humanities data are both massive and diverse, and provide enormous analytical challenges for humanities scholars [46]. In [46], the authors identified four humanities challenges related to the ways in which perspectives, context, structure, and narration can be understood. Those challenges open up many opportunities to collect, store, analyze, and enrich the multi-modal data used in the research. Among the research opportunities identified in the paper, two are especially relevant to our discussion: (a) Understanding changes in meaning and perspective, and (b) representing uncertainty in data sources and knowledge claims; both being inherently related to the notion of uncertain data. On one hand, humanities research is subject to changes in the data over time and across groups or scholars. When new sources or documents are discovered, new interpretations are elaborated and understanding of the research objects are highly dependent on the particular theoretical positions of the scholars. On the other hand, those changes in meaning and perspective arise from the availability of sources and reference material, so its highly important for the scholars to be able to assess the nature of the data related to what may be missing, ambiguous, contradictory, and so on. This, as expected, generates uncertainty in how the data is ultimately handled and analyzed, depending on the data processing procedures and associated provenance.

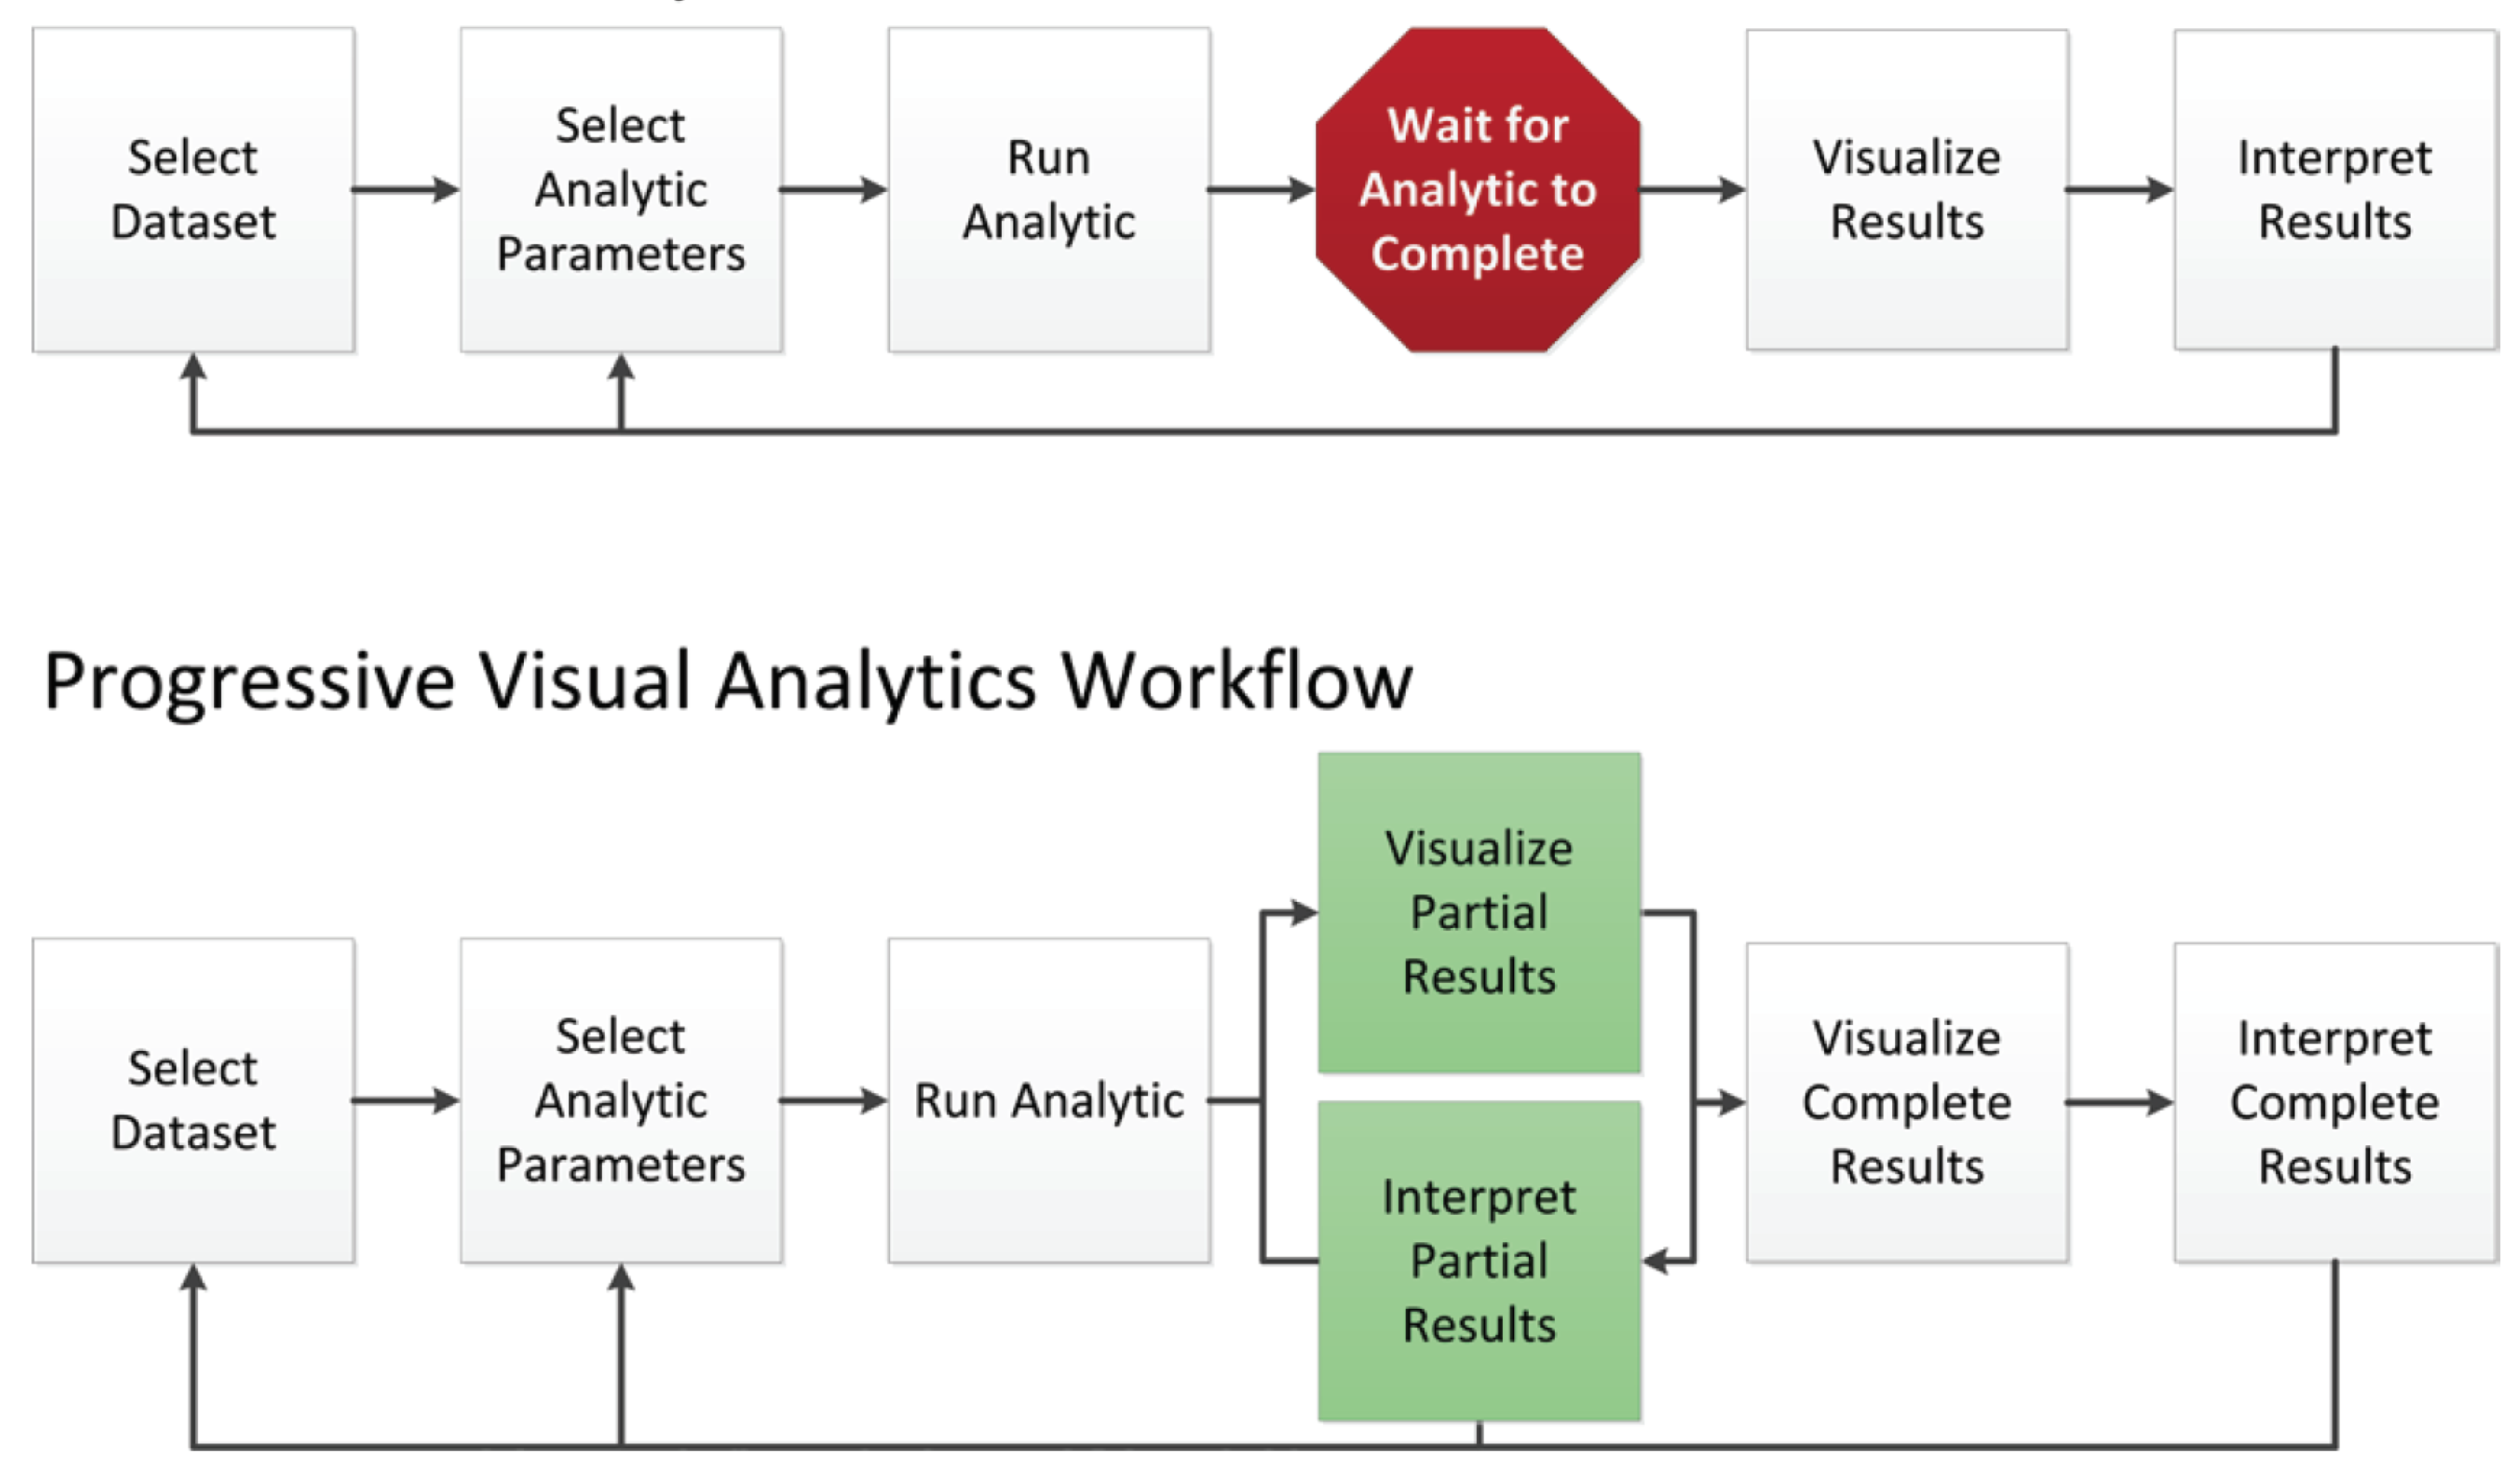
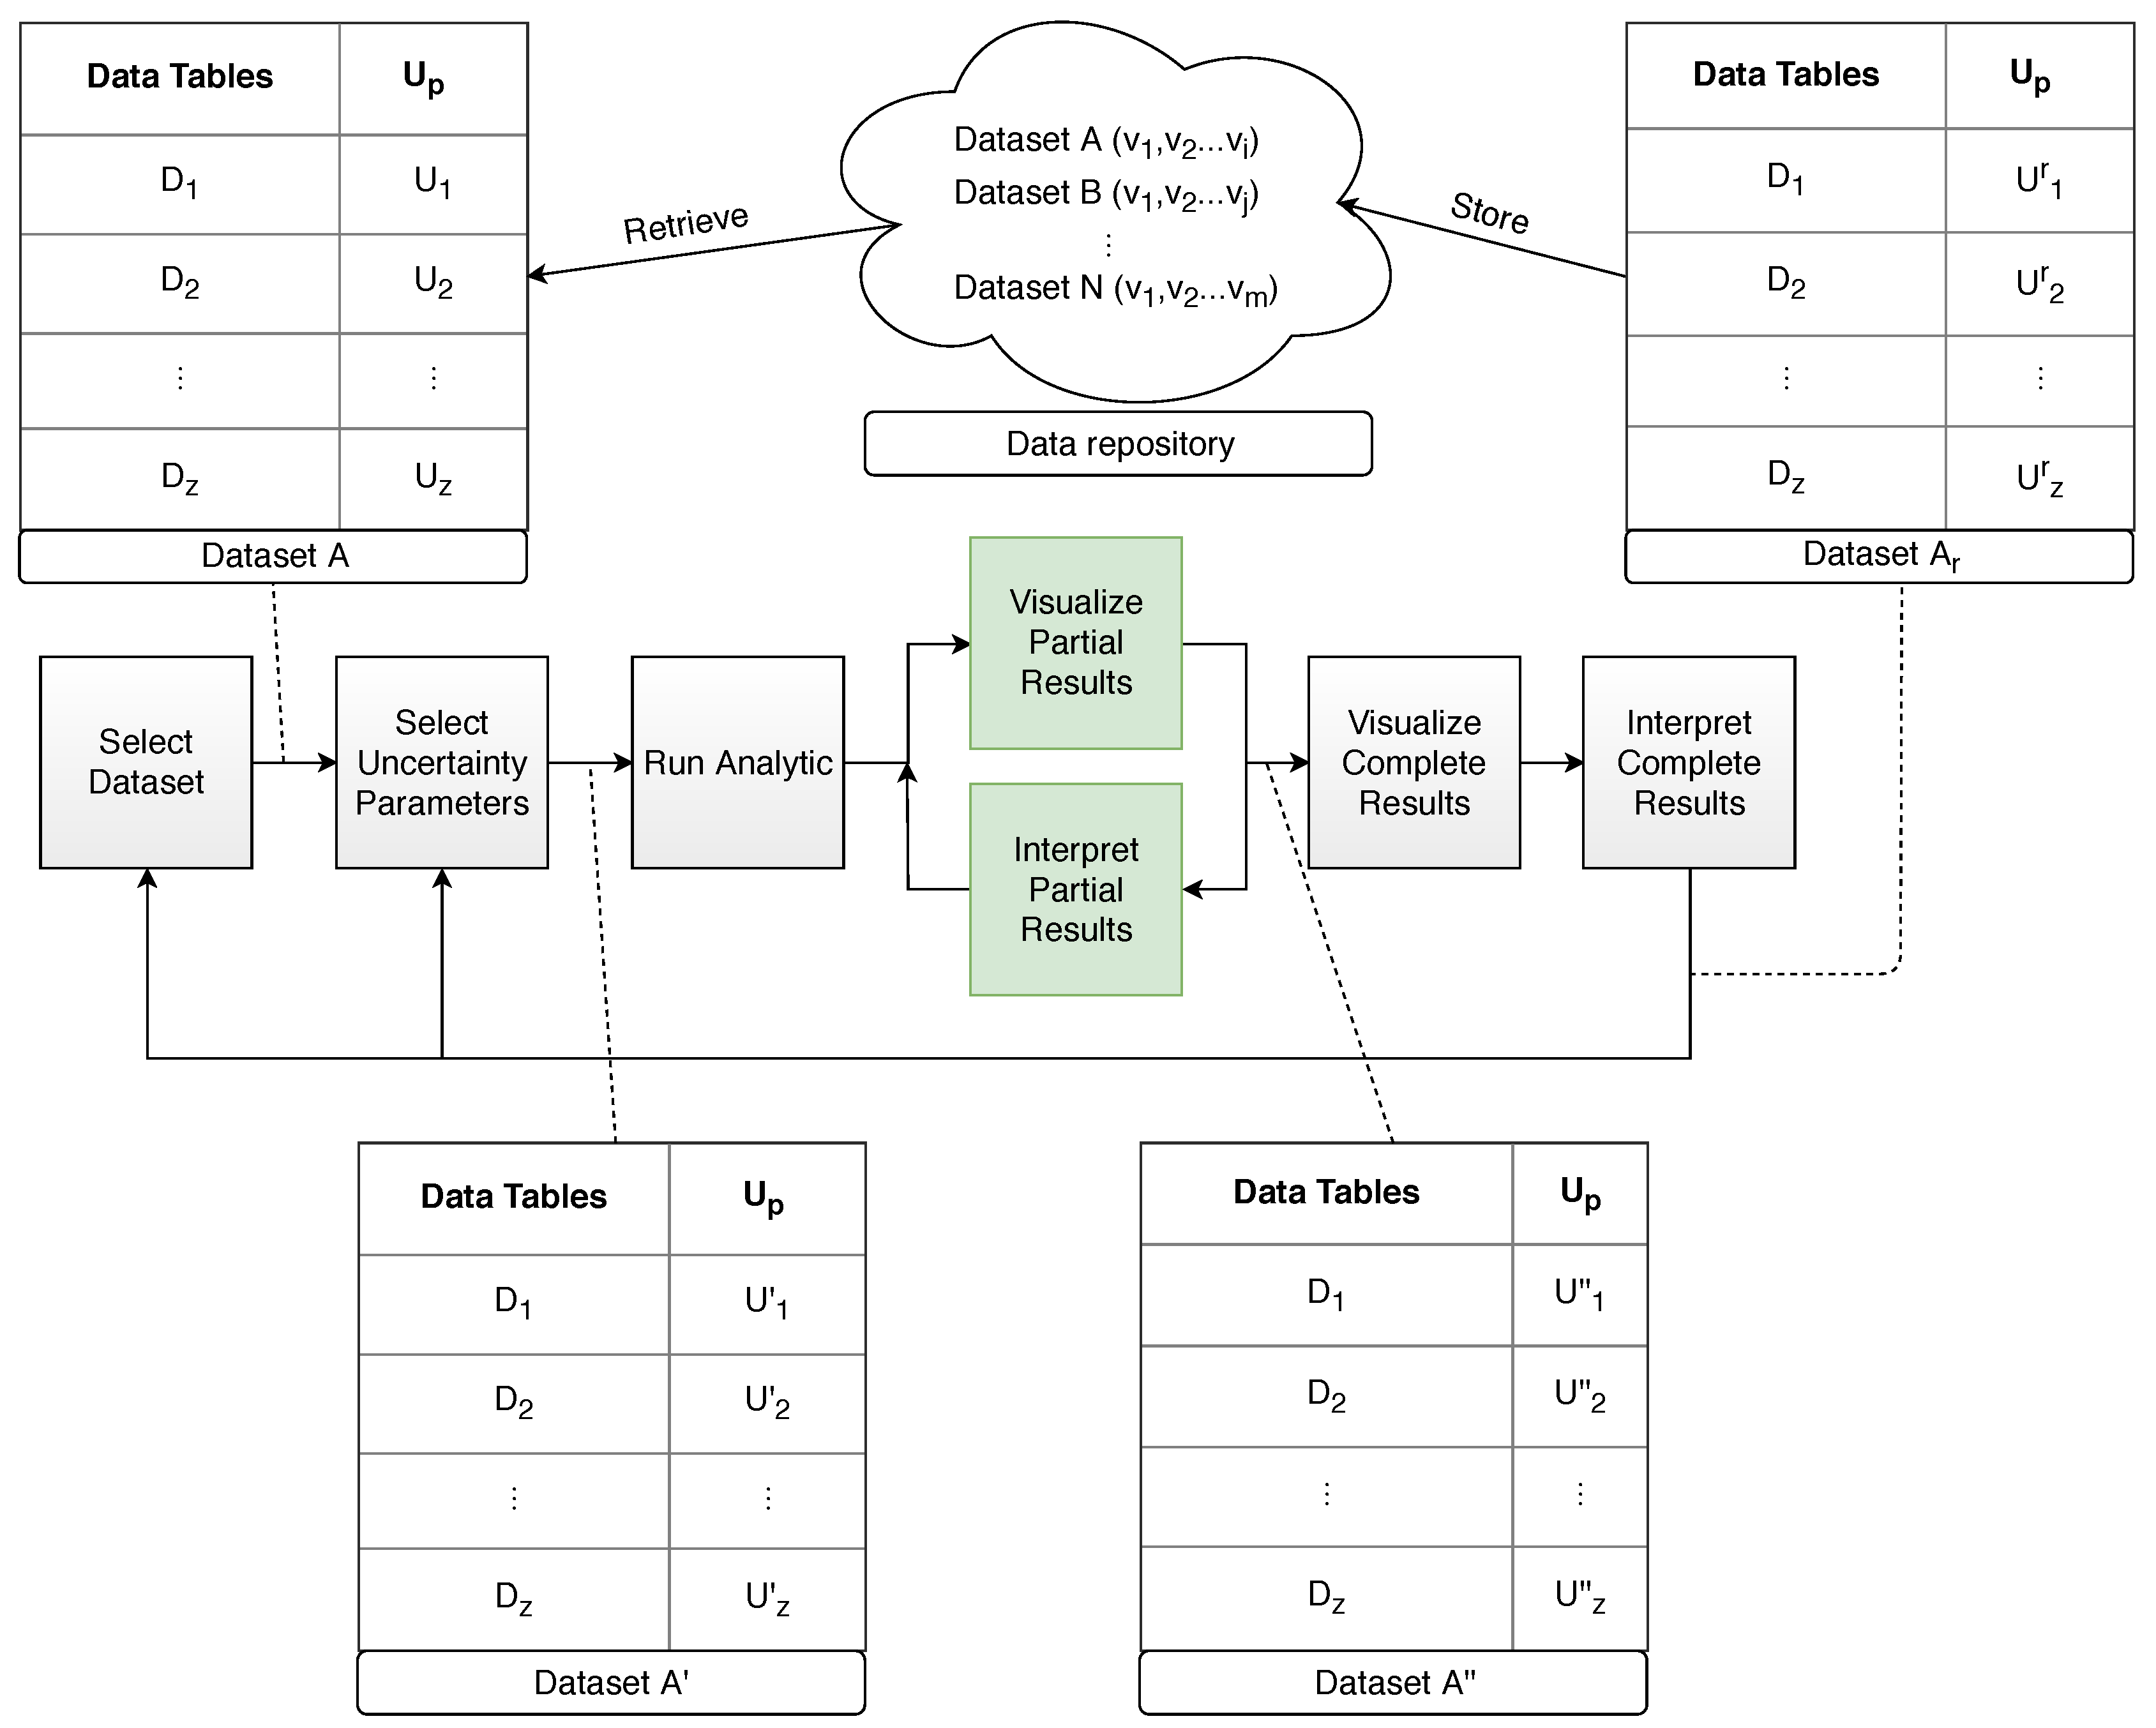
5. Managing Uncertainty Through Progressive Visual Analytics

The usefulness and suitability of visually-supported computer techniques are a proven fact, and one can refer to the growing number of publications, papers, dissertations, and talks touching upon the subject in recent years. However, many of these proposals are still regarded with a skeptical eye by prominent authors in the field and are considered by some “a kind of intellectual Trojan horse” that can be harmful to the purposes of the humanistic research [47]. These critiques appeal to the inability of these techniques to present categories in qualitative information as subject to interpretation, “riven with ambiguity and uncertainty” and they call for “imaginative action and intellectual engagement with the challenge of rethinking digital tools for visualization on basic principles of the humanities”. These claims point to a major issue in DH: On one hand, humanities scholars are keen on employ computational methods to assist them in their research but, on the other hand, such computational methods are often too complex to be understood in full and adequately applied. In turn, acquiring this knowledge generally would require an investment of time and effort that most scholars are reluctant to commit to and would invalidate the need for any kind of multidisciplinary co-operation. As a consequence, algorithms and other computational processes are seen as black boxes that produce results in an opaque manner, a key fact that we identify as one of the main causes of the controversy and whose motivations are rooted at the very foundations of HCI. However, in the same way that users are not expected to understand the particularities of the HTTP and 4G protocols in order to access an online resource using their mobile phones, algorithmic mastery should not be an entry-level requirement for DH visual analytics either. In a similar approach, such analytics systems should not purposely conceal information from the user when mistakenly assuming that (a) the user is completely illiterate on these subjects and/or, maybe even with more harmful consequences, (b) the user is unable to learn. For example, Ghani and Deshpande [48], in their research dating from 1994, identified the sense of control over one’s environment as a major factor affecting the experience of flow. We argue that it is precisely the lack of control over the algorithms driving the visualizations that might be frustrating DH practitioners.
In Section 2, we commented on the different sources that can be identified in the data analysis pipeline, as presented by [27]. Therefore, it is key that a DH analyst is able to identify this uncertainty at these stages, in order to be able to make informed decisions. Furthermore, we have seen how algorithms, models, and computations can introduce uncertainty in the analysis task which, rather than being neglected, should be appropriately presented to the user at all times. For these reasons, a hypothetical visual analytics pipeline should expose this uncertainty at all times in an effective manner, regardless of the size of the data being analyzed. On the other hand, this goal can be difficult to achieve if the inclusion of this uncertainty in the pipeline results in greater latency times that may diminish the analytic capabilities of the system. In the context of this problem, we frame our proposal of an exploration paradigm for the DH, which aims to bring scientific rigor and reproducibility into the field without impeding intellectual work as intended by humanities scholars. As was presented in previous sections, the tasks of categorization, assessment, and display of uncertainty, in all its forms, play a key role in the solving of the aforementioned issues. In order to provide an answer to this question, we draw on recent research by authors in the CS field to construct a theoretical framework on which the management of uncertainty is streamlined in all phases of the data analysis pipeline: Progressive Visual Analytics (PVA).
PVA is a computational paradigm [31,49] that refers to the ability of information systems to deliver their results in a progressive fashion. As opposed to sequential systems, which are limited by the intrinsic latency of the algorithms in action, PVA systems, by definition, are always able to offer partial results of the computation. The inclusion of this feature is of major importance to avoid the well-known issues of exploratory analysis related to human perception, such as continuity, flow, and attention preservation, among others [29], and enhances the notion of direct manipulation of abstract data in the final user of the system [50]. This paradigm also brings important advantages related to the ability to break with the black-box vision of the algorithms commented upon earlier in this text [31]: There are many examples online and in the literature that illustrate how, by observing the visual results of the execution of an algorithm, users are able to understand how it works in a better manner [51]. Not only is this useful in an educational sense, but also in a practical one: Progressive Analytics often produces steerable computations, allowing users to intervene in the ongoing execution of an algorithm and make more informed decisions during the exploration task [31]. Figure 3 depicts PVA and the concept of steerable computation, as envisioned by Stolper et al. in their paper [49].
In our case, this would allow a fast re-computation of results according to a set of well-defined series of beliefs or certainties on the data, with important benefits related to the problems presented in [47]. Therefore, the challenge lies in re-implementing the typical DH workflows and algorithms in a progressive manner, allowing for a fast re-evaluation of beliefs to spark critical thinking and intellectual work under conditions of uncertainty. In order to develop this conversion, good first candidates are the typical graph layout and force-directed methods, as (a) they have been typically implemented in a progressive manner [52] and (b) they have been considered important to enable research in the humanities [46]. Other good candidates fall into the categories of dimensionality reduction (t-SNE [53]), pattern-mining (SPAM [49]), or classification (K-means [54]); although, in principle, any algorithm is susceptible to conversion, following the guides explained in [31]. For example, a complete list of relevant methods for the humanities could be compiled from the contributions by Wyatt and Millen [46]. In Figure 4, we show a modification of the progressive visualization workflow proposed by Stolper et al. [49], in which we treat the data set as a first-class research object that can be labeled, versioned, stored, and retrieved, by employing a data repository. Our proposal also draws on the ideas by Fekete and Primet [54] and we model uncertainty as a parameter Up of the progressive computation F p defined by the authors.
Initially, a data set A is loaded, which will consist of a series of data tables, each one associated with a concrete uncertainty parameter which might or might not exist, yet, and that was, in case of existence, assigned in a previous session by the same or another user. At the beginning of the session, the user may choose to modify the subjective uncertainty parameters (from Fisher’s taxonomy, Figure 1), according to his experience or newer research, or leave them as they are. We call this the initial user perspective P, which is a series of uncertainty parameters U 1 z related to each of the data tables D 1 z . As the workflow progresses, the user will modify this perspective, subsequently obtaining P , P , and so on. Once the workflow is finished, the data set A r , along with the final user perspective P r , is stored in the data repository for later use and becomes a research object that can be referenced, reused, and reproduced, in a transparent fashion.

6. Conclusions

In this paper, we reviewed past taxonomies related to uncertainty visualization in an attempt to adapt them to the DH domain. Although the DH represent an exciting new field of collaboration between practitioners with substantially different backgrounds, there are still major issues that need to be addressed as briefly as possible, in order to achieve better results. In order to overcome these challenges, we draw on a relatively new data visualization paradigm that breaks with the black-box perception of the algorithm which we argue is blocking collaboration in many research areas. The progressive workflow model in our proposal is a first approach to the problem of uncertainty in the DH analysis pipeline. We have seen a great surge of PA in the CS and visualization communities in recent years, but its applicability in a DH context is yet to be proven with adequate use-cases and evaluations.

Author Contributions

Conceptualization, R.T.S.; formal analysis, R.T.S., A.B.S. and R.S.V.; investigation, R.T.S., A.B.S., R.S.V. and A.L.G.; writing—original draft preparation, R.T.S., A.B.S. and A.L.G.; writing—review and editing, R.T.S. and A.B.S.; supervision, R.T.S.; project administration, R.T.S.; funding acquisition, R.T.S.

Funding

This work has received funding within the CHIST-ERA programme under the following national grant agreement PCIN-2017-064 (MINECO Spain).

Conflicts of Interest

The authors declare no conflict of interest.

Abbreviations

The following abbreviations are used in this manuscript:
DHDigital Humanities
PVAProgressive Visual Analytics
CSComputer Science

References

  1. Warwick, C.; Terras, M.; Nyhan, J. Digital Humanities in Practice; Facet Publishing: London, UK, 2012. [Google Scholar]
  2. Anne, K.; Carlisle, T.; Dombrowski, Q.; Glass, E.; Gniady, T.; Jones, J.; Lippincott, J.; MacDermott, J.; Meredith-Lobay, M.; Rockenbach, B.; et al. Building Capacity for Digital Humanities: A Framework for Institutional Planning; ECAR Working Group Paper; ECAR: Louisville, CO, USA, 2017. [Google Scholar]
  3. Hoffman, F.O.; Hammonds, J.S. Propagation of uncertainty in risk assessments: The need to distinguish between uncertainty due to lack of knowledge and uncertainty due to variability. Risk Anal. 1994, 14, 707–712. [Google Scholar] [CrossRef] [PubMed]
  4. Ferson, S.; Ginzburg, L.R. Different methods are needed to propagate ignorance and variability. Reliab. Eng. Syst. Saf. 1996, 54, 133–144. [Google Scholar] [CrossRef]
  5. Helton, J.C. Uncertainty and sensitivity analysis in the presence of stochastic and subjective uncertainty. J. Stat. Comput. Simul. 1997, 57, 3–76. [Google Scholar] [CrossRef]
  6. Riesch, H. Levels of uncertainty. In Essentials of Risk Theory; Springer: Dordrecht, The Netherlands, 2013; pp. 29–56. [Google Scholar]
  7. Lovell, B. A Taxonomy of Types of Uncertainty. Ph.D. Thesis, Portland State University, Portland, OR, USA, 1995. [Google Scholar]
  8. Zimmermann, H.J. An application-oriented view of modeling uncertainty. Eur. J. Oper. Res. 2000, 122, 190–198. [Google Scholar] [CrossRef]
  9. Ramirez, A.J.; Jensen, A.C.; Cheng, B.H. A taxonomy of uncertainty for dynamically adaptive systems. In Proceedings of the 7th International Symposium on Software Engineering for Adaptive and Self-Managing Systems, Zurich, Switzerland, 4–5 June 2012; pp. 99–108. [Google Scholar]
  10. Priem, R.L.; Love, L.G.; Shaffer, M.A. Executives’ perceptions of uncertainty sources: A numerical taxonomy and underlying dimensions. J. Manag. 2002, 28, 725–746. [Google Scholar] [CrossRef]
  11. Regan, H.M.; Colyvan, M.; Burgman, M.A. A taxonomy and treatment of uncertainty for ecology and conservation biology. Ecol. Appl. 2002, 12, 618–628. [Google Scholar] [CrossRef]
  12. Refsgaard, J.C.; van der Sluijs, J.P.; Højberg, A.L.; Vanrolleghem, P.A. Uncertainty in the environmental modelling process—A framework and guidance. Environ. Model. Softw. 2007, 22, 1543–1556. [Google Scholar] [CrossRef]
  13. Han, P.K.; Klein, W.M.; Arora, N.K. Varieties of uncertainty in health care: A conceptual taxonomy. Med. Decis. Mak. 2011, 31, 828–838. [Google Scholar] [CrossRef]
  14. Howell, W.C.; Burnett, S.A. Uncertainty measurement: A cognitive taxonomy. Organ. Behav. Hum. Perform. 1978, 22, 45–68. [Google Scholar] [CrossRef]
  15. Potter, K.; Rosen, P.; Johnson, C.R. From Quantification to Visualization: A Taxonomy of Uncertainty Visualization Approaches. In Uncertainty Quantification in Scientific Computing; Dienstfrey, A.M., Boisvert, R.F., Eds.; IFIP Advances in Information and Communication Technology; Springer: Berlin/Heidelberg, Germany, 2012; pp. 226–249. [Google Scholar]
  16. MacEachren, A.M. Visualizing Uncertain Information. Cartogr. Perspect. 1992, 13, 10–19. [Google Scholar] [CrossRef]
  17. Fisher, P.F. Models of uncertainty in spatial data. Geogr. Inf. Syst. 1999, 1, 191–205. [Google Scholar]
  18. Cooley, M. Human-Centered Design. In Information Design; MIT Press: Cambridge, MA, USA, 2000; pp. 59–81. [Google Scholar]
  19. Nusrat, E. A Framework of Descriptive Decision-Making under Uncertainty Using Depster-Shafer Theory and Prospect Theory. Ph.D. Thesis, Nagaoka University of Technology, Niigata, Japan, 2013. [Google Scholar]
  20. Dubois, D. Representation, propagation, and decision issues in risk analysis under incomplete probabilistic information. Risk Anal. 2010, 30, 361–368. [Google Scholar] [CrossRef] [PubMed]
  21. Der Kiureghian, A.; Ditlevsen, O. Aleatory or epistemic? Does it matter? Struct. Saf. 2009, 31, 105–112. [Google Scholar] [CrossRef]
  22. Simon, C. Data Uncertainty and Important Measures; ISTE Ltd/John Wiley and Sons Inc: Hoboken, NJ, USA, 2017. [Google Scholar]
  23. Matthies, H.G. Quantifying uncertainty: Modern computational representation of probability and applications. In Extreme Man-Made and Natural Hazards in Dynamics of Structures; Springer: Dordrecht, The Netherlands, 2007; pp. 105–135. [Google Scholar]
  24. Bae, H.R.; Grandhi, R.V.; Canfield, R.A. An approximation approach for uncertainty quantification using evidence theory. Reliab. Eng. Syst. Saf. 2004, 86, 215–225. [Google Scholar] [CrossRef]
  25. Dempster, A.P. Upper and lower probabilities induced by a multivalued mapping. Ann. Math. Stat. 1967, 38, 325–339. [Google Scholar] [CrossRef]
  26. Gonzalez-Perez, C. (Ed.) Vagueness. In Information Modelling for Archaeology and Anthropology: Software Engineering Principles for Cultural Heritage; Springer International Publishing: Cham, Switzerland, 2018; pp. 129–141. [Google Scholar]
  27. Pang, A.T.; Wittenbrink, C.M.; Lodha, S.K. Approaches to Uncertainty Visualization. Vis. Comput. 1997, 13, 370–390. [Google Scholar] [CrossRef]
  28. Miller, R.B. Response Time in Man-Computer Conversational Transactions. In Proceedings of the December 9-11, 1968, Fall Joint Computer Conference, Part I; AFIPS ’68 (Fall, Part I); ACM: New York, NY, USA, 1968; pp. 267–277. [Google Scholar] [CrossRef]
  29. Nielsen, J. Response Time Limits. 2010. Available online: http://www.nngroup.com/articles/response-times-3-important-limits (accessed on 3 June 2019).
  30. Shneiderman, B. Response Time and Display Rate in Human Performance with Computers. ACM Comput. Surv. 1984, 16, 265–285. [Google Scholar] [CrossRef]
  31. Mühlbacher, T.; Piringer, H.; Gratzl, S.; Sedlmair, M.; Streit, M. Opening the black box: Strategies for increased user involvement in existing algorithm implementations. IEEE Trans. Vis. Comput. Graph. 2014, 20, 1643–1652. [Google Scholar] [CrossRef] [PubMed]
  32. Thomson, J.; Hetzler, E.; MacEachren, A.; Gahegan, M.; Pavel, M. A Typology for Visualizing Uncertainty. Proc. SPIE 2005, 5669, 146–158. [Google Scholar] [CrossRef]
  33. Kahneman, D.; Tversky, A. Prospect Theory: An Analysis of Decision under Risk. Econometrica 1979, 47, 263–291. [Google Scholar] [CrossRef]
  34. Tversky, A.; Kahneman, D. Judgment under uncertainty: Heuristics and biases. Science 1974, 185, 1124–1131. [Google Scholar] [CrossRef] [PubMed]
  35. Küster, M.W.; Ludwig, C.; Al-Hajj, Y.; Selig, T. TextGrid provenance tools for digital humanities ecosystems. In Proceedings of the 5th IEEE International Conference on Digital Ecosystems and Technologies (DEST 2011), Daejeon, Korea, 31 May–3 June 2011; pp. 317–323. [Google Scholar]
  36. Burgess, L.C. Provenance in Digital Libraries: Source, Context, Value and Trust. In Building Trust in Information; Springer: Cham, Switzerland, 2016; pp. 81–91. [Google Scholar]
  37. Walkowski, N.O. Evaluating Research Practices in the Digital Humanities by Means of User Activity Analysis. In Proceedings of the Digital Humanities, DH2017, Montreal, QC, Canada, 8–11 August 2017; pp. 1–3. [Google Scholar]
  38. Sanchez, L.M.; Bertolotto, M. Uncertainty in Historical GIS. In Proceedings of the 1st International Conference on GeoComputation, Leeds, UK, 4–7 September 2017. [Google Scholar]
  39. Jänicke, S.; Wrisley, D.J. Visualizing uncertainty: How to use the fuzzy data of 550 medieval texts. In Proceedings of the Digital Humanities, Lincoln, NE, USA, 16–19 July 2013. [Google Scholar]
  40. Binder, F.; Entrup, B.; Schiller, I.; Lobin, H. Uncertain about Uncertainty: Different ways of processing fuzziness in digital humanities data. In Proceedings of the Digital Humanities, Lausanne, Switzerland, 7–12 July 2014. [Google Scholar]
  41. Seipp, K.; Ochoa, X.; Gutiérrez, F.; Verbert, K. A research agenda for managing uncertainty in visual analytics. In Proceedings of the Mensch und Computer 2016—Workshopband, Aachen, Germany, 4–7 September 2016. [Google Scholar]
  42. Meeks, E.; Weingart, S.B. The Digital Humanities Contribution to Topic Modeling. J. Digit. Humanit. 2012, 2, 1–6. [Google Scholar]
  43. McNutt, M. Reproducibility; American Association for the Advancement of Science: Washington, DC, USA, 2014. [Google Scholar]
  44. Stodden, V.; McNutt, M.; Bailey, D.H.; Deelman, E.; Gil, Y.; Hanson, B.; Heroux, M.A.; Ioannidis, J.P.; Taufer, M. Enhancing reproducibility for computational methods. Science 2016, 354, 1240–1241. [Google Scholar] [CrossRef] [PubMed]
  45. Edmond, J.; Folan, G.N. Data, Metadata, Narrative. Barriers to the Reuse of Cultural Sources. In Research Conference on Metadata and Semantics Research; Springer: Cham, Switzerland, 2017; pp. 253–260. [Google Scholar]
  46. Wyatt, S.; Millen, D. Meaning and Perspective in the Digital Humanities; A White Paper for the establishment of a Center for Humanities and Technology (CHAT); Royal Netherlands Academy of Arts & Sciences (KNAW): Amsterdam, The Netherlands, 2014. [Google Scholar]
  47. Drucker, J. Humanities Approaches to Graphical Display. Digit. Humanit. Q. 2011, 5, 1–21. [Google Scholar]
  48. Ghani, J.A.; Deshpande, S.P. Task Characteristics and the Experience of Optimal Flow in Human—Computer Interaction. J. Psychol. 1994, 128, 381–391. [Google Scholar] [CrossRef]
  49. Stolper, C.D.; Perer, A.; Gotz, D. Progressive Visual Analytics: User-Driven Visual Exploration of In-Progress Analytics. IEEE Trans. Vis. Comput. Graph. 2014, 20, 1653–1662. [Google Scholar] [CrossRef] [PubMed]
  50. Shneiderman, B. Direct manipulation: A step beyond programming languages. Computer 1983, 16, 57–69. [Google Scholar] [CrossRef]
  51. Bostock, M. Visualizing Algorithms. 2014. Available online: http://bost.ocks.org/mike/algorithms (accessed on 3 June 2019).
  52. Bostock, M.; Ogievetsky, V.; Heer, J. D3 Data-Driven Documents. IEEE Trans. Vis. Comput. Graph. 2011, 17, 2301–2309. [Google Scholar] [CrossRef] [PubMed]
  53. Pezzotti, N.; Lelieveldt, B.P.F.; van der Maaten, L.; Höllt, T.; Eisemann, E.; Vilanova, A. Approximated and User Steerable tSNE for Progressive Visual Analytics. IEEE Trans. Vis. Comput. Graph. 2017, 23, 1739–1752. [Google Scholar] [CrossRef]
  54. Fekete, J.D.; Primet, R. Progressive Analytics: A Computation Paradigm for Exploratory Data Analysis. arXiv, 2016; arXiv:1607.05162. [Google Scholar]
Figure 1. Fisher’s taxonomy of uncertainty [17], adapted by [22].
Informatics 06 00031 g001
Figure 2. Sources of uncertainty in the data analysis pipeline [27].
Informatics 06 00031 g002
Figure 3. Progressive Visual Analytics (PVA) model proposed by Stolper [49].
Informatics 06 00031 g003
Figure 4. An uncertainty-aware progressive visualization workflow model for the Digital Humanities proposed by the authors and based on the contributions by Stolper [49] and Fekete [54].
Informatics 06 00031 g004

