
Proposal of the Indonesian Framework for Telecommunications Infrastructure Based on Network and Socioeconomic Indicators

Abstract
:1. Introduction
2. Theory
2.1. The Indonesian Profile and Policy Direction

2.2. Connectivity and Society
2.3. ITU Framework of Universal Access
2.4. Telecommunication Indicators on the Framework
2.5. Socioeconomic Indicators on the Framework
2.6. Regulatory Comparisons with Other Countries
3. The Proposal
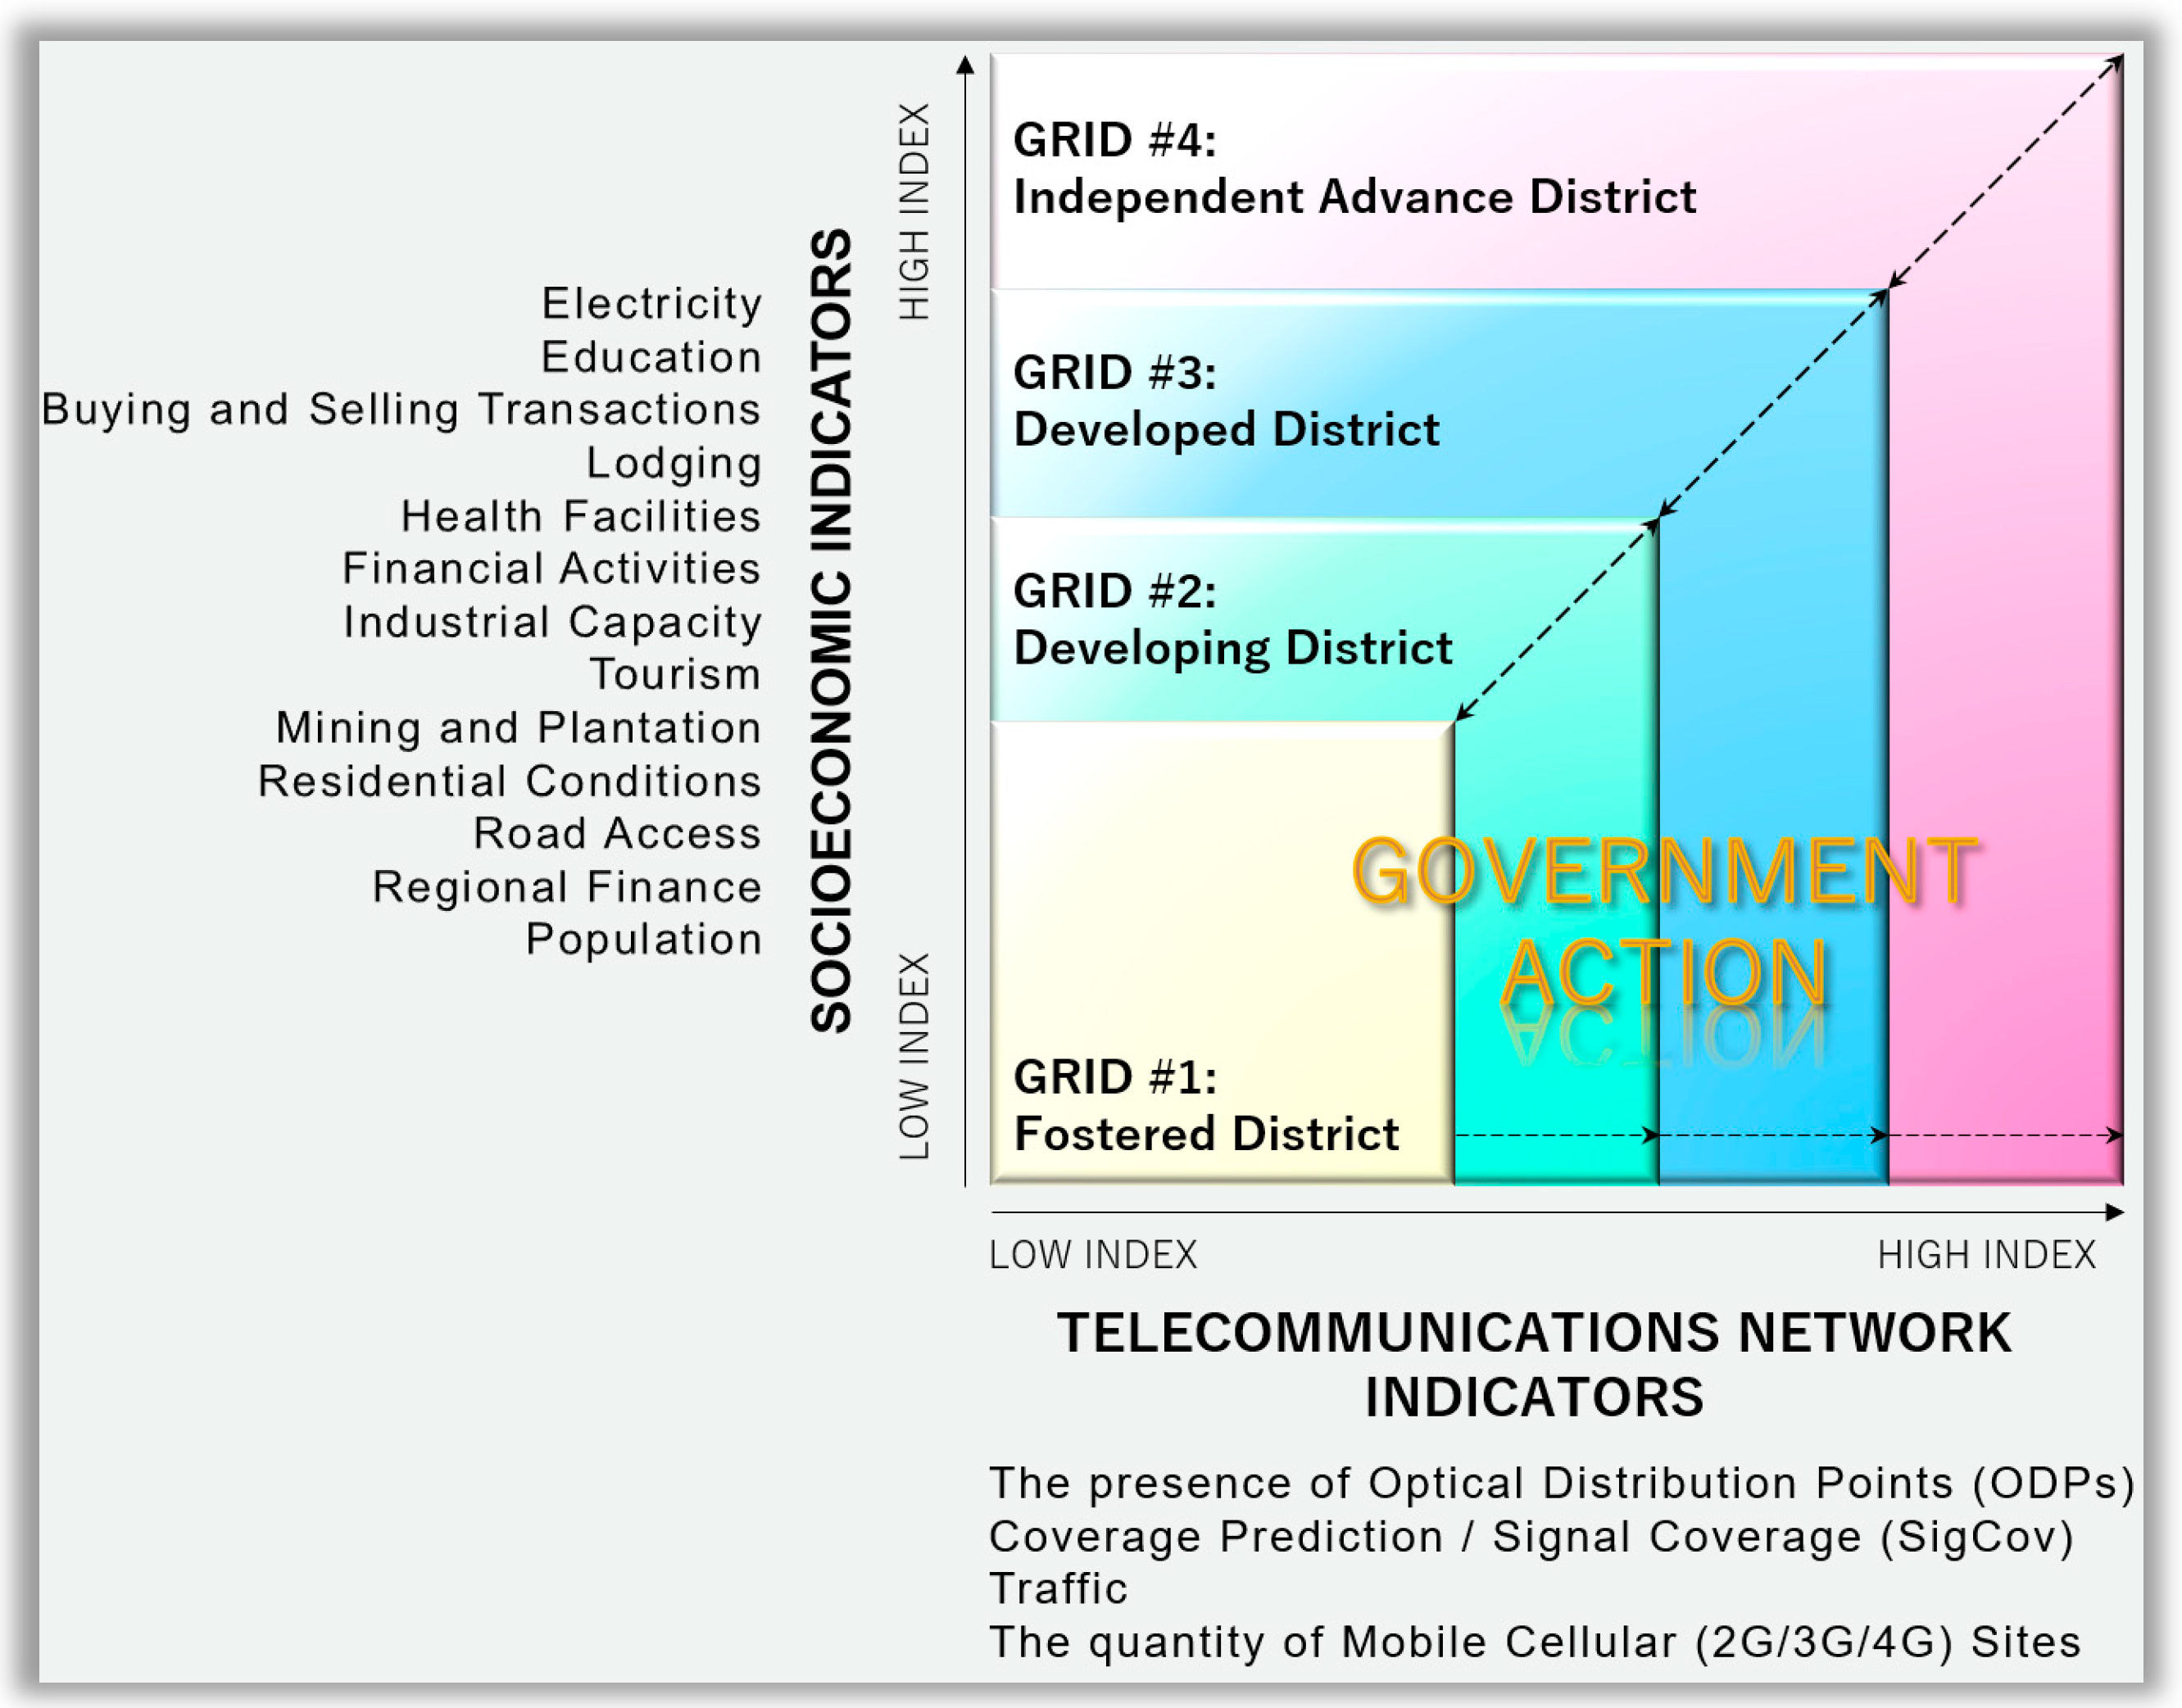
3.1. The Proposed Framework
3.2. Validation and Benefit of the Framework
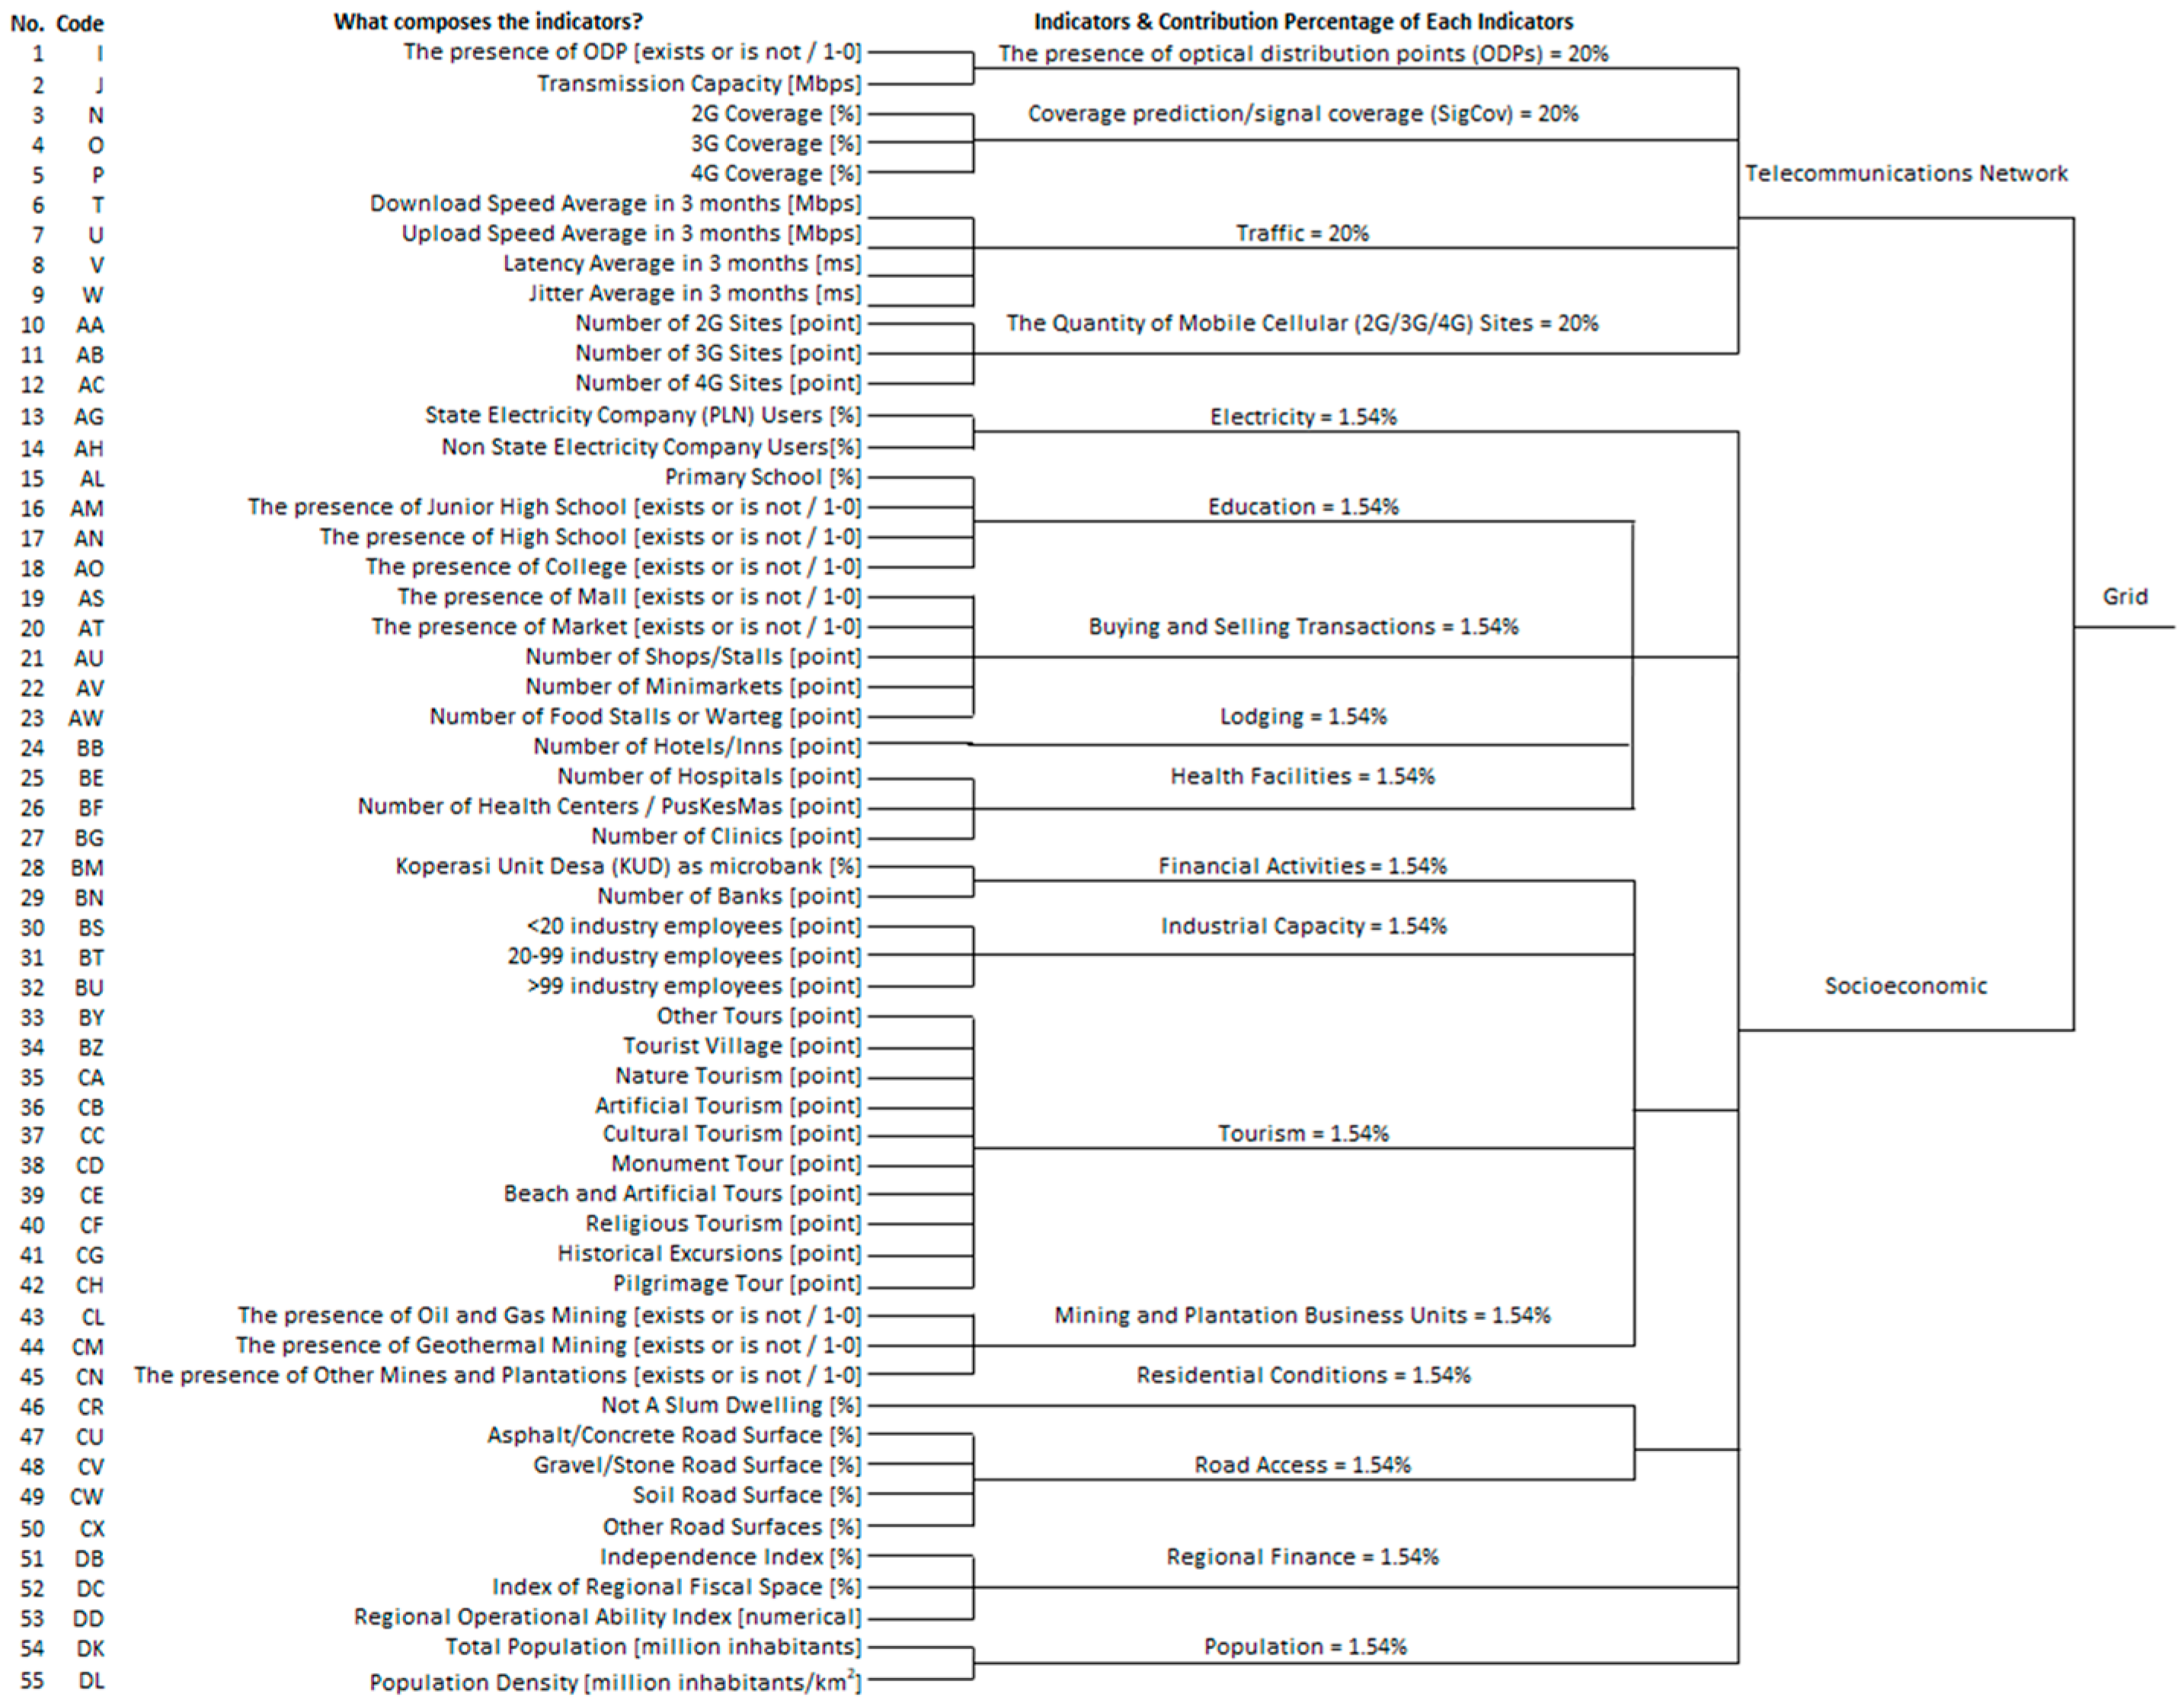
3.3. Determining Grids Based on 17 Indicators
- Availability of services to suit the public’s needs for 4G technology-based telecommunications’ connectivity.
- In public facilities such as village government centres, economic activity centres (markets), industrial centres, health facilities, and educational places, locals can utilize the availability/coverage of telecoms access services using 4G technology.
- The number of cells/sites will provide information on the network capacity (Mbps).
- Quantity of subscribers if two networks share the same spectrum, but only one has a large subscriber base, in which case the network with the larger subscriber base will often have a poorer network experience due to the increased network load.
- Type of transportation network: networks with enough spectrum but inadequate transport networks will provide a bad user experience.

| Indicator | Indicator Name | Postulate to Determine the Grid-Reference Index G1, G2, G3, G4 | Explanation |
|---|---|---|---|
| 1 | Telecommunications Network: The presence of optical distribution points (ODPs) | G1 = 0 Mbps, 0 Mbps < G2 < 1000 Mbps, 1000 Mbps ≤ G3 < 2048 Mbps, G4 ≥ 2048 Mbps. G(x) = IF(x = 0;1; IF(x < 1000;2; IF(x <= 2048; 3; 4))) | G1 if there is no fiber optic network distribution point (ODP) or the transmission capacity is 0 Mbps. G2 if ODP has a maximum transmission capacity of 1 Gbps. G3 if an ODP has a transmission capacity between 1000 Mbps and 2048 Mbps (or 1000 E1 [57]). G4 if the transmission capacity of ODP is greater than 2048 Mbps [58] (for 5G deployment). |
| 2 | Telecommunications Network: Coverage prediction/signal coverage (SigCov) | Mean aggregates: Filtering: If the data column N = {2G Coverage}, O = {3G Coverage}, and P = {4G Coverage}. Then G1 = 0; 0 < G2 ≤ 33.3; 33.3 < G3 ≤ 66.7; G4 > 66.7 G(x) = IF(x > 66.7; 4; IF(x > 33.3; 3; IF(x > 0; 2; 1))) | G1 when there is no signal for communication. G2 when the average signal coverage reaches approximately one-third of the grid region. G3 when the average signal coverage reaches between one-third and two-thirds of the grid region. G4 when the average signal coverage reaches between two-thirds and the entire grid. After calculating the aggregate of the N-O-P set’s average data using the desktop analysis coverage prediction (SigCov) [11], this grid is categorized. |
| 3 | Telecommunications Network: Traffic | Mean aggregates: Filtering: If the data column T = {DL speed average in 3 months}, U = {UL speed average in 3 months}, V = {latency average in 3 months}, and W = {jitter average in 3 months}. Then G1 = 0; 0 < G2 ≤ 33.3; 33.3 < G3 ≤ 66.7; G4 > 66.7 G(x) = IF(x > 66.7; 4; IF(x > 33.3; 3; IF(x > 0;2;1))) | G1 if no traffic is present. G2 if the average traffic volume does not exceed one-third of the maximum throughput capacity. G3 if the average traffic is between one-third and two-thirds of the throughput capacity. G4 if the traffic volume averages two-thirds of the maximum throughput capacity. After calculating the aggregate average of T-U-V-W data [59], this grid is categorized. |
| 4 | Telecommunications Network: The quantity of mobile cellular (2G/3G/4G) sites | Weighting: If the data column AA = {2G BTS}, AB = {3G NodeB}, and AC = {4G eNodeB}. Then G(AA, AB, AC) = 0.3AA + 0.2AB + 0.5AC Filtering: G1 = 0; G2 ≤ 12.90; 12.91< G3 ≤ 63.60; G4 ≥ 63.61 G(x)= IF(x ≥ 63.61; 4; IF(x ≥ 12.91; 3; IF(x > 0;2;1))) | G1 if there is no 2G BTS/3G NodeB/4G eNodeB pole with a null representation. G2 if between 1 and 13 site antennas exist (equivalent to a cut point of 12.9). G3 if 14–64 site antennas are present (worth 12.91–63.60). G4 if more than 64 site antennas are present (more than 63.60 cut points). After calculating the weighting of the AA-AB-AC dataset, this grid is categorized [60,61]. For data profiling information, there are 1044 blank spot areas; if the remainder (6188 out of 7232) is divided by 3, the normal distribution cut points are 12.9 and 63.6. |
| 5 | Socioeconomic: Electricity | Total: Filtering: If the data column AG = {electricity users from state electricity companies (PLN)}, and AH = {electricity users are not from state electricity companies (personal/private/non-PLN)}. Then G1 ≤ 80; 80< G2 ≤ 90; 90< G3 ≤ 95; G4 > 95 G(x) = IF(x > 95; 4; IF(x > 90; 3; IF(x > 80; 2; 1))) | G1 if less than 80% of households have electricity. G2 if 80–90% of households have electricity [62]. G3 if 90–95% of households have electricity [62]. G4 if more than 95% of households have electricity. After calculating the total number of electricity consumers using the AG and AH sets, this grid is categorized. |
| 6 | Socioeconomic: Education | Filtering: If the data column AL = {elementary school}, AM = {junior high school}, AN = {high school}, and AO = {college}.Then , G4~AO = 1; G3~AN = 1; G2~AM = 1; G1~AO = AN = AM = 0 G(AM, AN, AO) = IF(AO = 1; 4; IF(AN = 1; 3; IF(AM = 1; 2; 1))) or | G1 if there is no junior high school, high school, or college. G2 if at least one junior high school exists. G3 if at least one high school exists. G4 if at least one college is present [63]. |
| If AO = 1 Then Gx = 4 Else If AN = 1 Then Gx = 3 Else If AM = 1 Then Gx = 2 Else Gx = 1 | |||
| 7 | Socioeconomic: Buying and selling transactions | Mean aggregates: Filtering: If the data column AS = {the existence of mall}, AT = [64], AU = {number of shops or stalls}, AV = {number of minimarkets}, and AW = {number of food stalls or warteg}. Then G1 ≤ −0.44; −0.43≤ G2 ≤ 0; 0.01≤ G3 ≤ 0.36; G4 ≥ 0.37 G(x) = IF(x > 0.36; 4; IF(x > 0; 3; IF(x > −0.44; 2; 1))) | G1 if the transaction size falls within the bottom quartile (≤−0.44). G2 is between −0.43 and 0. G3 when between 0.01 and 0.36. G4 when on the rightmost quartile (≥0.37). After calculating the arithmetic mean of the AS–AT–AU–AV dataset, this grid is categorized. The concept of equal weighting for the location of economic activity is significant because it places emphasis on the size of transactions [65]. Due to the normalization of different units, the minus value occurs at the quartile cut point. |
| 8 | Socioeconomic: Lodging | Filtering: If the data column BB = {quantity of hotels/inns}, then G1 = 0; 1 ≤ G2 < 10; 10 ≤ G3 < 50; G4 ≥ 50. G(x) = IF(x < 1; 1; IF(x < 10;2;IF(x < 50; 3; 4))) | G1 if no hotel or inn is available. G2 if 1–9 hotels/inns are present. G3 if there are 10–49 hotels/inns. G4 if there are ≥ 50 hotels/inns. Scaling with cut points of 10 and 50 accounts for the granularity of the data and the fact that “the quality of employees, the season, and the concentration of competition in tourist destinations contributed most to the success of the lodging industry [66]”. |
| 9 | Socioeconomic: Health facilities | Filtering: If the data column BE = {number of hospitals}, BF = {number of health centres or puskesmas}, and BG = {number of clinics}. Then x N or | G1 if no health facilities are available. G2 if at least one clinic and/or health centre is present. G3 if only one hospital exists. G4 if there are multiple hospitals. The grid-based categorization of BE–BF–BG health facilities [67] takes into account the differences in clinical practice between urban and rural hospital clinics, community health centres, and private practices. |
| 10 | Socioeconomic: Financial activities | Filtering: If the data column BM = {percentage of KUD}, and BN = {number of banks}. Then x N or G(BM,BN) = IF(BN > 1; 4; IF(BN = 1; 3; IF(BM = 1; 2; 1))) | G1 if there is neither a microbank nor a bank. G2 if there is at least one microbank. G3 if there is a single bank. G4 if there is more than one bank. Regarding the categorization of the grid, banks and microbanks are the formal institutions that engage in financial activities, including the storage of funds [64]. An Indonesian cooperative, a so-called Koperasi Unit Desa (KUD), is a microbank in this context. |
| 11 | Socioeconomic: Industrial capacity | Filtering If the data column BS = {<20 persons}, BT = {20–99 persons}, and BU = {>99 persons}. Then x G(BU, BT, BS) = IF(BU ≥ 1; 4; IF(BT ≥ 1; 3; IF(BS ≥ 1.2; 1))) | G1 if no industry is able to absorb workers. G2 if the industry employs fewer than twenty people. G3 if it is a medium-sized industry employing 20–99 people. G4 if it is a large-scale industry with more than 99 employees. The categorization of the industrial capacity grid takes into account the number of employees [68] with scaling cut points of 20 and 99 individuals. |
| 12 | Socioeconomic: Tourism | Total: Filtering: If the data column BY = {other tours}, BZ = {tourist village}, CA = {nature tourism}, CB = {artificial tourism}, CC = [69],CD = {monument tour}, CE = {beach and artificial tours}, CF = {religious tourism}, CG = {historical excursions}, and CH = {pilgrimage tour}. Then G1 = 0; G2 ≤ 2; G3 ≤ 5; G4 > 5 G(x) = IF(x = 0; 1; IF(x ≤ 2; 2; IF(x ≤ 5; 3; 4))) | Default to G1 if no form of tourism can be created. If there are one or two tourist attractions, use G2. Use G3 if three to five tourist attractions are present. Use G4 if there are more than five tourist attractions. Multiple tourism variants (BY, BZ, CA, CB, CC, CD, CE, CF, CG, and CH) and locations will influence the economic growth [70,71,72]. |
| 13 | Socioeconomic: Mining and plantation business units | Filtering: If the data column CL = {the existence of oil and gas mining}, CM = {the existence of geothermal mining}, and CN = {the existence of other mines and plantations}. Then x G(CL, CM, CN) = IF(CL = 1; 4; IF(CM = 1; 3; IF(CN = 1; 2; 1))) | If there is no mining and plantation business unit, G1 should be used. G2 should be used if a plantation business unit exists. G3 if a geothermal mining business unit exists. G4 if an oil and gas mining business unit exists. Grid categorization is based on the fact that island nations rely on CL-CM-CN mining and CN plantations for economic growth [69]. |
| 14 | Socioeconomic: Residential conditions | Filtering: If the data column CR = {not a slum dwelling}, then G1 ≤ 90; 90 < G2 ≤ 95; 95 < G3 ≤ 99; G4 > 99. G(x) = IF(x > 99; 4; IF(x > 95; 3; IF(x > 90; 2; 1))) | G1 if the proportion of non-slum settlements is 90%. G2 if the proportion of non-slum settlements falls between 90 and 95%. G3 if the percentage of non-slum settlements ranges from 95 to 99%. G4 if greater than 99% of all settlements are not slums. The scaling with cut points 90, 95, and 99 takes into account the granularity of the data (the majority is greater than 90 percent) where residential conditions are closely related to road access as an investment factor [73]. |
| 15 | Socioeconomic: Road access | Filtering: If the data column CU = {asphalt/concrete road surface}, CV = {gravel/stone road surface}, CW = {soil road surface}, and CX = {other road surfaces}. Then x N G(CU,CV,CW,CX) = IF(CU = 100; 4; IF(CU < 100; 3; IF(CV ≤ 100; 2; 1))) | G1 for non-commercial. G2 for low commercial. G3 for medium commercial. G4 for high commercial. The state of road access (CU, CV, CW, and CX) is considered to be an investment factor [73]. Adding together the data for asphalt/concrete road surface, gravel/stone, soil, and others yields a total of 100%. |
| 16 | Socioeconomic: Regional finance | Mean aggregates: Filtering: If the data column DH = {z-score mean index}, then G1 ≤ −0.671; −0.671< G2 ≤ 0; 0 < G3 ≤ 0.671; G4 > 0.671. G(x) = IF(x > 0.671; 4; IF(x > 0; 3; IF(x > −0.671; 2; 1))) | G1 if the average index is below −0.671. If the average index is between −0.671 and 0, G2 is denoted. If the average index is between 0 and 0.671, G3 is used. G4 is assigned if the average index exceeds 0.671%. This grid is categorized after calculating the aggregate average data on the potential and financial independence of a region that has been normalized to account for different units [74,75,76,77]. |
| 17 | Socioeconomic: Population | Filtering: If the data column DK = {population}, and DL = {population density}. Then G1 < 250; 250 ≤ G2 ≤ 499; 500 ≤ G3 ≤ 999; G4 ≥1000. G(x) = IF(x < 250; 1; IF(x < 500;2;IF(x < 1000; 3; 4))) | G1 if the population density is less than 250 people per square kilometre. G2 if there are between 250 and 499 inhabitants per square kilometre. G3 if there are between 500 and 999 inhabitants per square kilometre. G4 if the number of people per square kilometre is less than 1000. Population is closely related to the number of residents and the number of residents per km2 (area), which can be used to calculate the population’s maximum density [78]. |
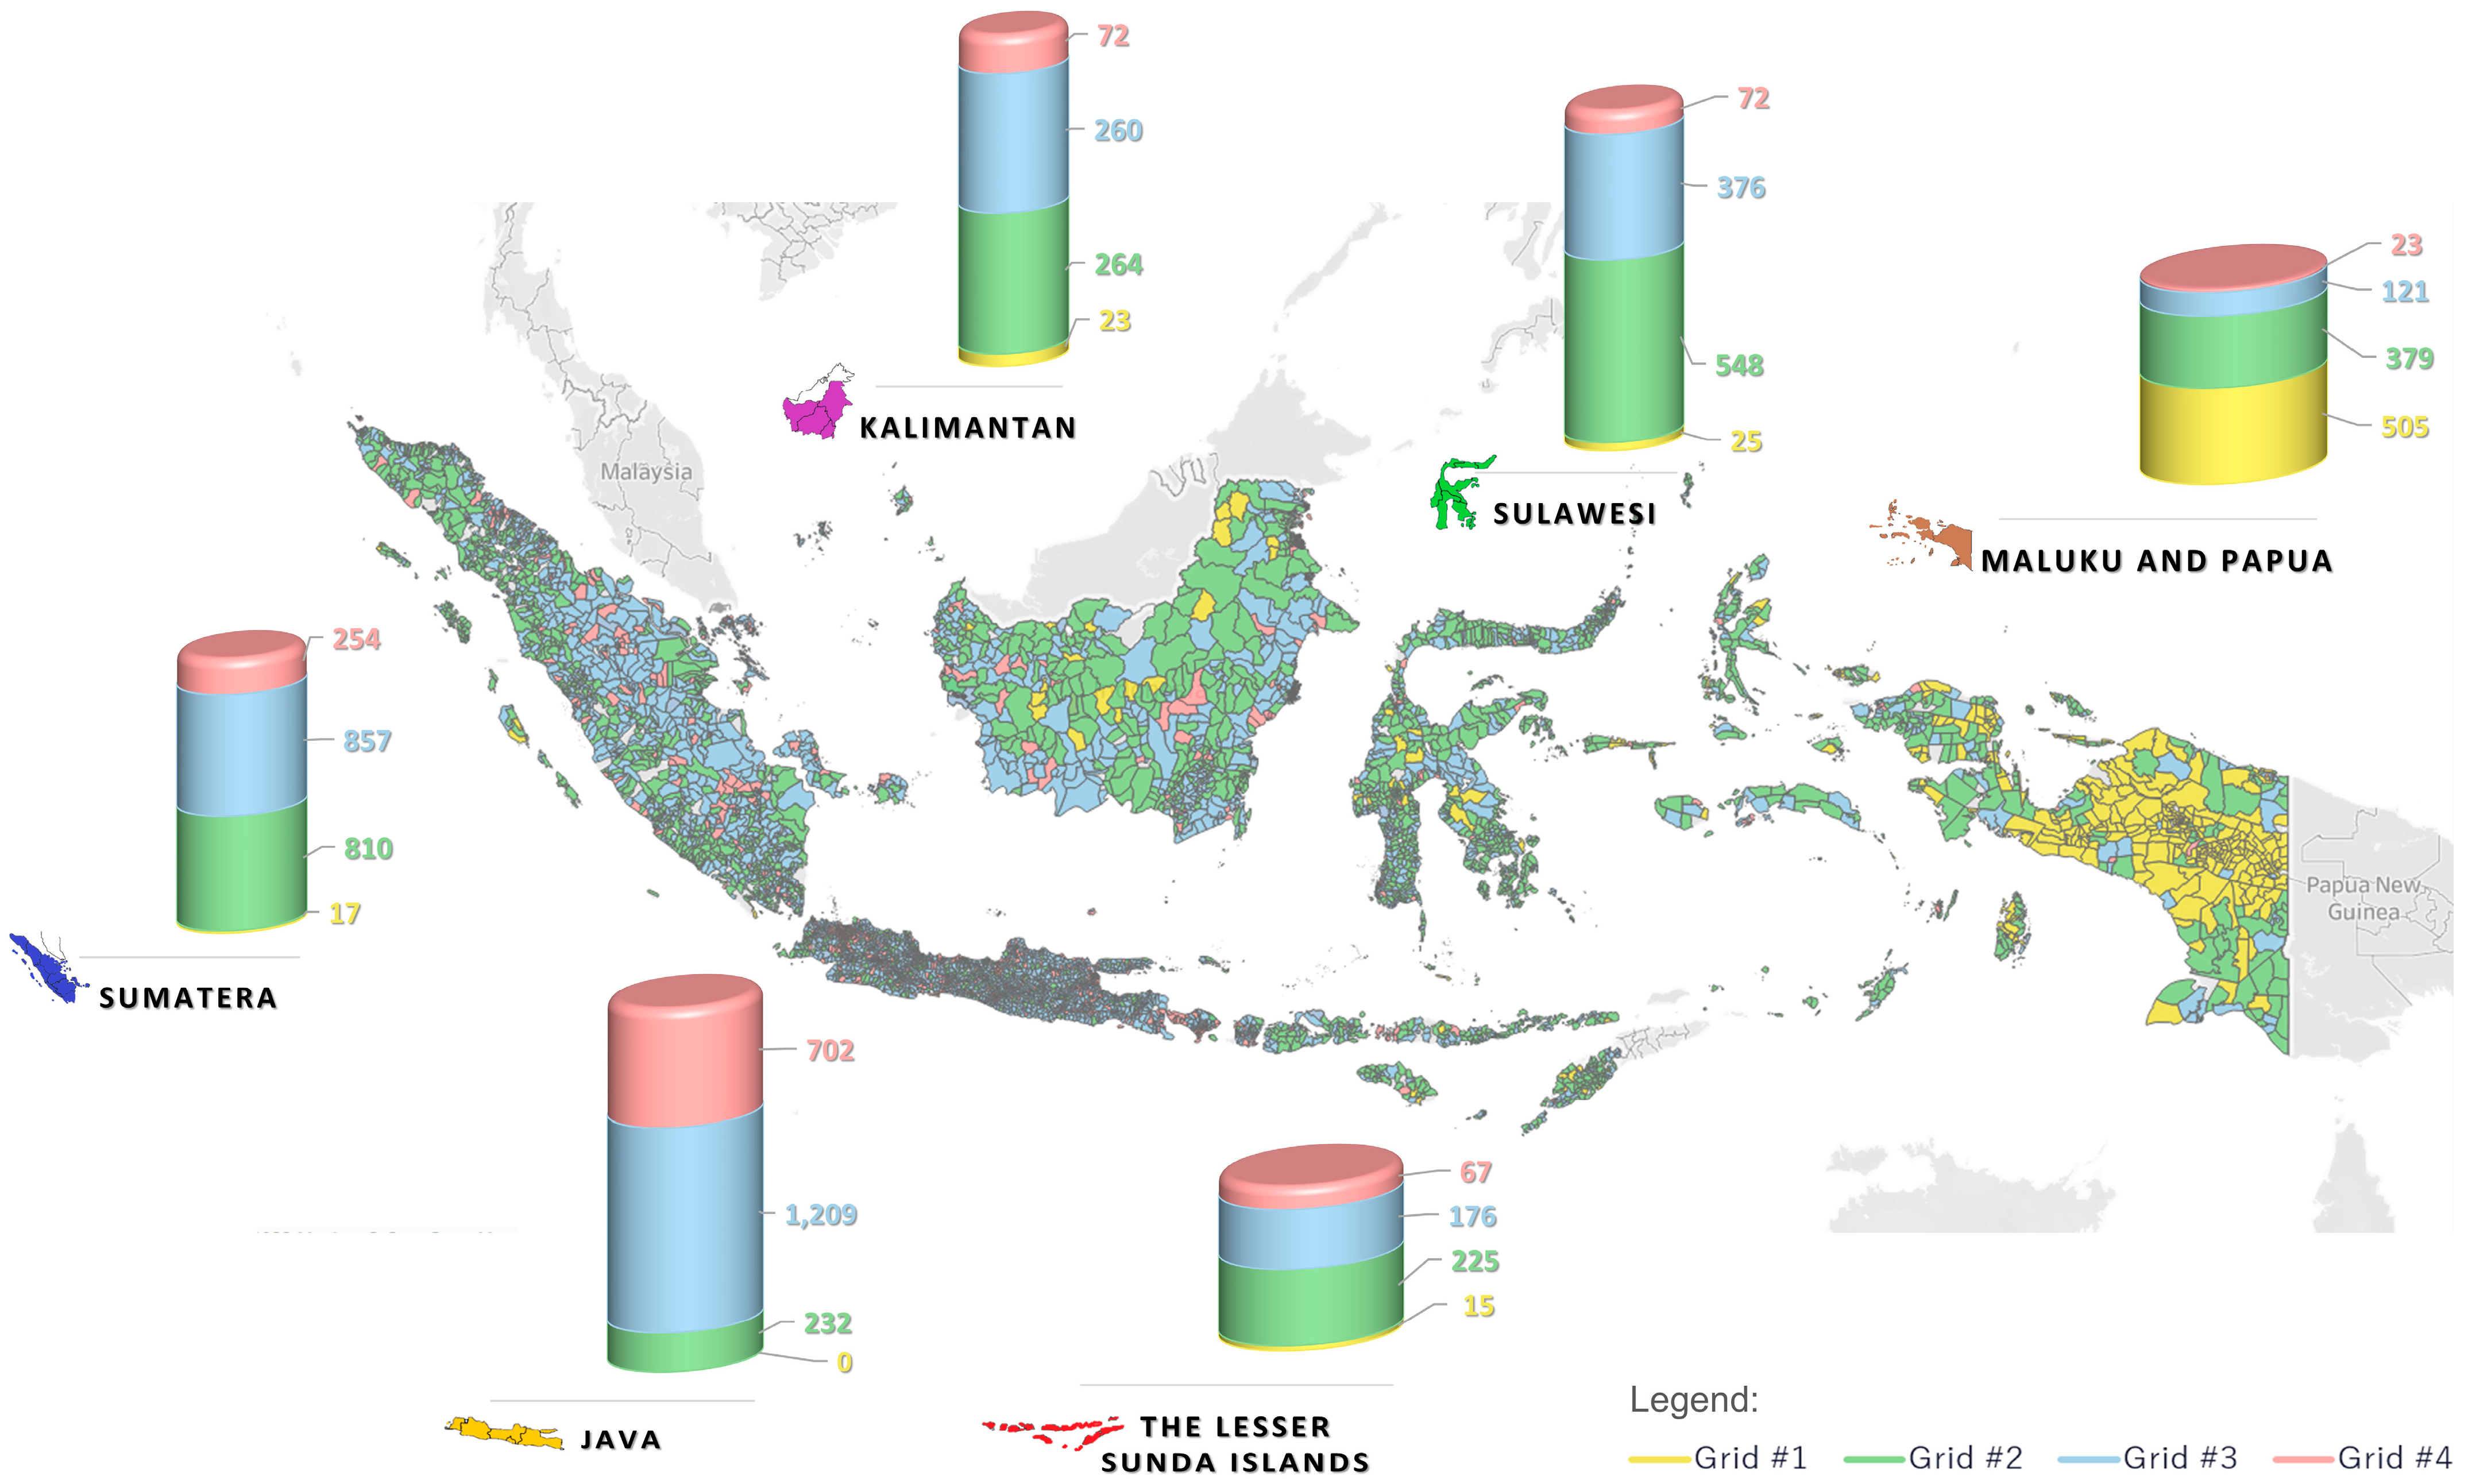
4. Visualization Results
5. Conclusions
6. Future Studies
- Propose that Grid #5 might be defined as having 100% household penetration. The number of grids proposed in this manuscript is four. Hence, there is no Grid #5. However, if the term affordability is added to a new grid, specifically Grid #5, we think it is not required, as it has already been included into the socioeconomic dimension. Affordability is related to the total purchasing power of the population. While Quality of Service (QoS) relates to the telecommunication signal traffic, such as downlink speed, uplink speed, throughput/bit rate, and jitter. Grids #1–#4 indicate whether a district is fostered, developing, developed, or independent advanced. If Grid #5 exists, it must have superior conditions than Grid #4 (independent advanced).
- Suggest employing the Blue Ocean and/or cost leadership strategy [54] to reach “low demand potential” in grid #2 for the future research and implementation. The assessment of the low demand potential in grid #2 is based on the framework’s socioeconomic axes. The Blue Ocean strategy is a strategy that takes cellular companies out of the red ocean of bloody (risky environment of ruthless) competition that occurs in high demand potential by building a market sector where there are no competitors yet, making the term competition obsolete. We can begin by defining market segments, developing canvas methodologies, developing customer levels, and devising answers to probable implementation difficulties.
- Investigate technology trends, such as low-Earth-orbiting satellites and small-scale mesh networks, to see whether these technologies may challenge any of this paper’s underlying assumptions.
Supplementary Materials
Author Contributions
Funding
Institutional Review Board Statement
Informed Consent Statement
Data Availability Statement
Acknowledgments
Conflicts of Interest
References
- Radeef, A. “Push” and “Pull” Factors in Telecommunication Industry”. 2017. Available online: https://www.researchgate.net/publication/342729086_Push_and_Pull_Factors_in_telecommunication_industry (accessed on 25 December 2022).
- Al-Mashraie, M.; Chung, S.H.; Jeon, H.W. Customer switching behavior analysis in the telecommunication industry via push-pull-mooring framework: A machine learning approach. Comput. Ind. Eng. 2020, 144, 106476. [Google Scholar] [CrossRef]
- ICT Regulation Toolkit Module 4: Universal Access and Service; Infodev_World_Bank_and_International_Telecommunication_Union. 2010. Available online: http://www.ictregulationtoolkit.org (accessed on 24 December 2022).
- Anderson, J.L.; Markides, C.; Kupp, M. The Last Frontier: Market Creation in Conflict Zones, Deep Rural Areas, and Urban Slums. Calif. Manag. Rev. 2010, 52, 6–28. [Google Scholar] [CrossRef] [Green Version]
- Schneir, J.R.; Ajibulu, A.; Konstantinou, K.; Bradford, J.; Zimmermann, G.; Droste, H.; Canto, R. A business case for 5G mobile broadband in a dense urban area. Telecommun. Policy 2019, 43, 101813. [Google Scholar] [CrossRef] [Green Version]
- Schneir, J.R.; Konstantinou, K.; Bradford, J.; Zimmermann, G.; Droste, H.; Palancar, R.C.; Ajibulu, A. Cost assessment of multi-tenancy for a 5G broadband network in a dense urban area. Digit. Policy Regul. Gov. 2020, 22, 53–70. (In English) [Google Scholar] [CrossRef]
- BPS. “Total Area and Number of Islands by Province, 2019,” Statistics Indonesia. 2019. Available online: https://www.bps.go.id/indikator/indikator/view_data_pub/0000/api_pub/UFpWMmJZOVZlZTJnc1pXaHhDV1hPQT09/da_01/1 (accessed on 10 December 2021).
- BPS. “The 2020 Population Census,” Statistics Indonesia. 2021. Available online: https://www.bps.go.id/pressrelease/2021/01/21/1854/hasil-sensus-penduduk-2020.html (accessed on 10 December 2021).
- BPS. “Village Potential Data Collection Results (Podes) 2018,” Statistics Indonesia. 2018. Available online: https://www.bps.go.id/pressrelease/2018/12/10/1536/hasil-pendataan-potensi-desa--podes--2018.html (accessed on 6 February 2022).
- “Digital 2021 Indonesia,” We Are Social and Hootsuite: Vancouver, Canada. 2021. Available online: https://datareportal.com/reports/digital-2021-indonesia (accessed on 8 April 2022).
- Q3 2019 Mobile Coverage Prediction Report (in the Original Language (Bahasa): “Laporan Coverage Prediction Seluler Q3 2019”); An Offline Government Database; Direktorat Pengendalian Ditjen PPI Kominfo: Jakarta, Indonesia, 2020.
- OOKLA. “Speedtest Global Index,” OOKLA, October 2021. Available online: https://www.speedtest.net/global-index#mobile (accessed on 9 December 2021).
- OpenSignal. “INDONESIA, Mobile Network Experience Report June 2021 (in the Original Language (Bahasa): “INDONESIA, Laporan Pengalaman Jaringan Seluler Juni 2021”),” in “June 2021” 2021. Available online: https://www.opensignal.com/in/reports/2021/06/indonesia/mobile-network-experience (accessed on 2 January 2022).
- OpenSignal. “INDONESIA, Mobile Network Experience Report December 2021 (in the Original Language (Bahasa): “INDONESIA, Laporan Pengalaman Jaringan Seluler Desember 2021”),” in “December 2021” 2021. Available online: https://www.opensignal.com/in/reports/2021/12/indonesia/mobile-network-experience (accessed on 2 January 2022).
- Burdansyah, C. “Blankspots in Hundreds of Lampung Villages Worried Officials and Locals (in the Original Language (Bahasa): “Ratusan Desa di Lampung Blankspot, Aparat dan Warga Gusar”).” Tribunnews. Available online: https://www.tribunnews.com/regional/2021/05/03/ratusan-desa-di-lampung-blankspot-aparat-dan-warga-gusar (accessed on 9 June 2022).
- Government Regulation on Postal, Telecommunications and Broadcasting (in the Original Language (Bahasa): “Peraturan Pemerintah Tentang Pos, Telekomunikasi, dan Penyiaran”), 46, 2 February 2021. Available online: https://peraturan.bpk.go.id/Home/Details/161970/pp-no-46-tahun-2021 (accessed on 4 June 2022).
- Minister Regulation on Ministry of Communications and Informatics Strategic Plan Year 2020–2024 (in the Original Language (Bahasa): “Peraturan Menteri Komunikasi dan Informatika Nomor 2 Tahun 2021 tentang Rencana Strategis Kementerian Komunikasi dan Informatika Tahun 2020–2024”), 2. Kementerian Komunikasi dan Informatika: Jakarta, Indonesia, 2021; pp. 51–52. Available online: https://peraturan.bpk.go.id/Home/Details/169164/permenkominfo-no-nomor-2-tahun-2021-tahun-202 (accessed on 5 January 2023).
- “Enabling Rural Coverage: Regulatory and Policy Recommendations to Foster Mobile Broadband Coverage in Developing Countries,” GSM Associations. 2018. Available online: https://www.gsma.com/mobilefordevelopment/resources/enabling-rural-coverage-report/ (accessed on 29 September 2022).
- Regulation of the Minister of Communication and Informatics’ of the Republic of Indonesia on “the Use of Technology in the 450 MHz, 900 MHz, 2.1 GHz, and 2.3 GHz Radio Frequency Bands for the Implementation of Cellular Networks” (in the original language (Bahasa): Peraturan Menteri Komunikasi dan Informatika tentang “Penggunaan Teknologi pada Pita Frekuensi Radio 450 MHz, 900 MHz, 2.1 GHz, dan 2.3 GHz untuk Penyelenggaraan Jaringan Bergerak Seluler”) Kemenkominfo 12. 2017. Available online: https://peraturanpedia.id/peraturan-menteri-komunikasi-dan-informatika-nomor-12-tahun-2017/ (accessed on 5 January 2023).
- Regulation of the Minister of Communication and Informatics’ of the Republic of Indonesia on “the Use of Radio Frequency Spectrum in the 2.3 GHz Band” (in the Original Language (Bahasa): Peraturan Menteri Komunikasi dan Informatika Tentang “Penggunaan Spektrum Frekuensi Radio pada Pita 2.3 GHz”) Kemenkominfo 4. 2020. Available online: https://jdih.kominfo.go.id/produk_hukum/view/id/755/t/peraturan+menteri+komunikasi+dan+informatika+nomor+4+tahun+2020 (accessed on 5 January 2023).
- Regulation of the Minister of Communication and Informatics’ of the Republic of Indonesia on “Redeployment of the 1800 MHz Radio Frequency Band for Cellular Network” (in the Original Language (Bahasa): Peraturan Menteri Komunikasi dan Informatika tentang “Penataan Pita Frekuensi Radio 1800 MHz untuk Keperluan Penyelenggaraan Jaringan Bergerak Seluler”) Kemenkominfo 19. 2015. Available online: https://peraturan.bpk.go.id/Home/Details/151083/permenkominfo-no-19-tahun-2015 (accessed on 5 January 2023).
- Regulation of the Minister of Communication and Informatics’ of the Republic of Indonesia on “Redeployment of the 800 MHz Radio Frequency Band for Cellular Network” (in the Original Language (Bahasa): Peraturan Menteri Komunikasi dan Informatika tentang “Penataan Pita Frekuensi Radio 800 MHz untuk Keperluan Penyelenggaraan Jaringan Bergerak Seluler”), Kemenkominfo 30. 2014. Available online: https://peraturanpedia.id/peraturan-menteri-komunikasi-dan-informatika-nomor-30-tahun-2014/ (accessed on 5 January 2023).
- brs. “Licensing of Radio Frequency Spectrum (in the Original Language (Bahasa): Perizinan Spektrum Frekuensi Radio).” Kemenkominfo. Available online: https://www.kominfo.go.id/index.php/content/detail/3345/Perizinan%20Spektrum%20Frekuensi%20Radio/0/layanan_kominfo (accessed on 23 December 2022).
- Regulation of the Minister of Finance of the Republic of Indonesia on the Procedures for the Appointment of the Collectors, Collection, Remittance, and Filing of Value Added Tax on the Utilization of Intangible Taxable Goods and/or Taxable Services from Outside of the Customs and Excises Territory within the Customs and Excises Territory through Electronic Commerce, Kemenkeu 48. 2020. Available online: https://peraturan.bpk.go.id/Home/Details/136933/pmk-no-48pmk032020 (accessed on 5 January 2023).
- Plate, J.G. “Digital Platform Tax Can Improve Indonesia’s Telecoms Infrastructure (in the original language (Bahasa): “Pajak Platform Digital Bisa Bangun Infrastruktur Telekomunikasi Indonesia”).” Kemenkominfo. Available online: https://www.kominfo.go.id/content/detail/22852/pajak-platform-digital-turut-bangun-infrastuktur-telekomunikasi-indonesia/0/berita_satker (accessed on 25 December 2022).
- Regional Regulation on “the Management and Utilization of Information and Communication Technology” (in the Original Language (Bahasa): “Peraturan Daerah (PERDA) tentang “Pengelolaan dan Pemanfaatan Teknologi Informasi dan Komunikasi”), Provincial-Government-of-Yogyakarta-Special-Region 3. 2019. Available online: https://peraturan.bpk.go.id/Home/Details/108373/perda-no-3-tahun-2019 (accessed on 30 October 2022).
- Regional Regulation on “Telecommunication Tower Planning and Control” (in the Original Language (Bahasa): “Peraturan Daerah (PERDA) Tentang “Penataan dan Pengendalian Menara Telekomunikasi”), Semarang-Regency 2. 2017. Available online: https://peraturan.bpk.go.id/Home/Details/94967/perda-kota-semarang-no-2-tahun-2017 (accessed on 5 January 2023).
- Hikmaturokhman, A.; Ramli, K.; Suryanegara, M.; Ratna, A.A.P.; Rohman, I.K.; Zaber, M. A Proposal for Formulating a Spectrum Usage Fee for 5G Private Networks in Indonesian Industrial Areas. Informatics 2022, 9, 44. Available online: https://www.mdpi.com/2227-9709/9/2/44 (accessed on 14 February 2023). [CrossRef]
- Profile and Guide to the Implementation of the Mapping Movement, Index Calculation, and Awards for Digital Cities/Districts in the Republic of Indonesia (ICT Pura Program) (in the Original Language (Bahasa): “Profil dan Panduan Pelaksanaan Gerakan Pemetaan, Penghitungan Indeks, dan Penghargaan terhadap Kota/Kabupaten Digital di Republik Indonesia (Program ICT Pura)”), Ministry of Communication and Informatics 248. 2011. Available online: https://123dok.com/document/y4eplv9q-profil-dan-panduan-pelaksanaan-program-ict-pura.html (accessed on 5 January 2023).
- Antoni, Y.; Asvial, M. Strategy of National Fiber Optic Backbone Network Utilization Enhancement in Rural Area of Indonesia. In Proceedings of the 2019 IEEE International Conference on Innovative Research and Development (ICIRD), Jakarta, Indonesia, 28–30 June 2019; pp. 1–8. (In English). [Google Scholar] [CrossRef]
- Socialization of Palapa Ring Integration—Efforts To Accelerate Digital Transformation (in the original language (Bahasa): “Sosialisasi Palapa Ring Integrasi—Upaya Percepatan Transformasi Digital”); Telecommunication and Information Accessibility Agency (BAKTI): Jakarta, Indonesia, 2022.
- “PALAPA RING Broadband in 57 Regencies/Cities through the Pattern of Government Cooperation with Business Entities in Infrastructure Provision (PPP) (in the Original Language (Bahasa): “PALAPA RING Broadband di 57 Kabupaten/Kota melalui Pola Kerjasama Pemerintah dengan Badan Usaha dalam Penyediaan Infrastruktur (KPBU)”)”. KOMINFO: Jakarta, Indonesia, 2021. Available online: https://www.baktikominfo.id/assets/uploads/ar_palapa_ring_sept_2021-min.pdf (accessed on 8 April 2022).
- Christina, A.; Gunawan, D.; Suryanegara, M. “An Indonesian District-Level Database Comprised of 17 Telecommunication Network and Socioeconomic Indicators (in the original language (Bahasa): “Basis Data Kecamatan Se-Indonesia Berdasarkan 17 Indikator Jaringan Telekomunikasi Dan Sosial Ekonomi”) with Copyright Number EC002022107232 “; Ministry of Law and Human Rights: Jakarta, Indonesia, 2022; Available online: https://pdki-indonesia.dgip.go.id/detail/EC002022107232?type=copyright&keyword=Basis+Data+Kecamatan+Se-Indonesia+Berdasarkan+17+Indikator+Jaringan+Telekomunikasi+Dan+Sosial+Ekonomi (accessed on 1 January 2023).
- Sachs, J.; Schmidt-Traub, G.; Kroll, C.; Durand-Delacre, D.; Teksoz, K. SDG Index and Dashboards 2017 Results in Excel; United Nations: New York, NY, USA, 2017; Available online: https://www.sdgindex.org/reports/sdg-index-and-dashboards-2017/ (accessed on 2 February 2023).
- ITU. ICT Development Index 2017; International Telecommunication Union: Geneva, Switzerland, 2017; Available online: https://www.itu.int/net4/ITU-D/idi/2017/index.html#idi2017rank-tab (accessed on 2 February 2023).
- Rankings—The Overall Performance of All 193 UN Member States; United Nations: New York, NY, USA. 2022. Available online: https://dashboards.sdgindex.org/rankings (accessed on 1 February 2023).
- Bris, A.; Cabolis, C. “IMD World Digital Competitiveness Ranking 2022,” International Institute for Management Development. 2022. Available online: https://www.imd.org/centers/world-competitiveness-center/rankings/world-digital-competitiveness/#:~:text=Summary%20country%20profiles%20are%20available%20in,the%20profiles%20in%20our%20online%20database%3A&text=Summary%20country%20profiles%20are,in%20our%20online%20database%3A&text=profiles%20are%20available%20in,the%20profiles%20in%20our (accessed on 1 February 2023).
- “Network Coverage Outlook.” Telefonaktiebolaget LM Ericsson. Available online: https://www.ericsson.com/en/reports-and-papers/mobility-report/dataforecasts/network-coverage (accessed on 14 February 2023).
- Nuwer, R. “The Last Places on Earth Without the Internet” BBC. Available online: https://www.bbc.com/future/article/20140214-the-last-places-without-internet (accessed on 14 February 2023).
- Inquiry Concerning the Deployment of Advanced Telecommunications Capability to All Americans in a Reasonable and Timely Fashion, and Possible Steps to Accelerate Such Deployment Pursuant to Section 706 of the Telecommunications Act of 1996, as Amended. FCC USA: Washington, DC, USA, 2012. Available online: https://docs.fcc.gov/public/attachments/FCC-12-90A1.pdf (accessed on 14 February 2023).
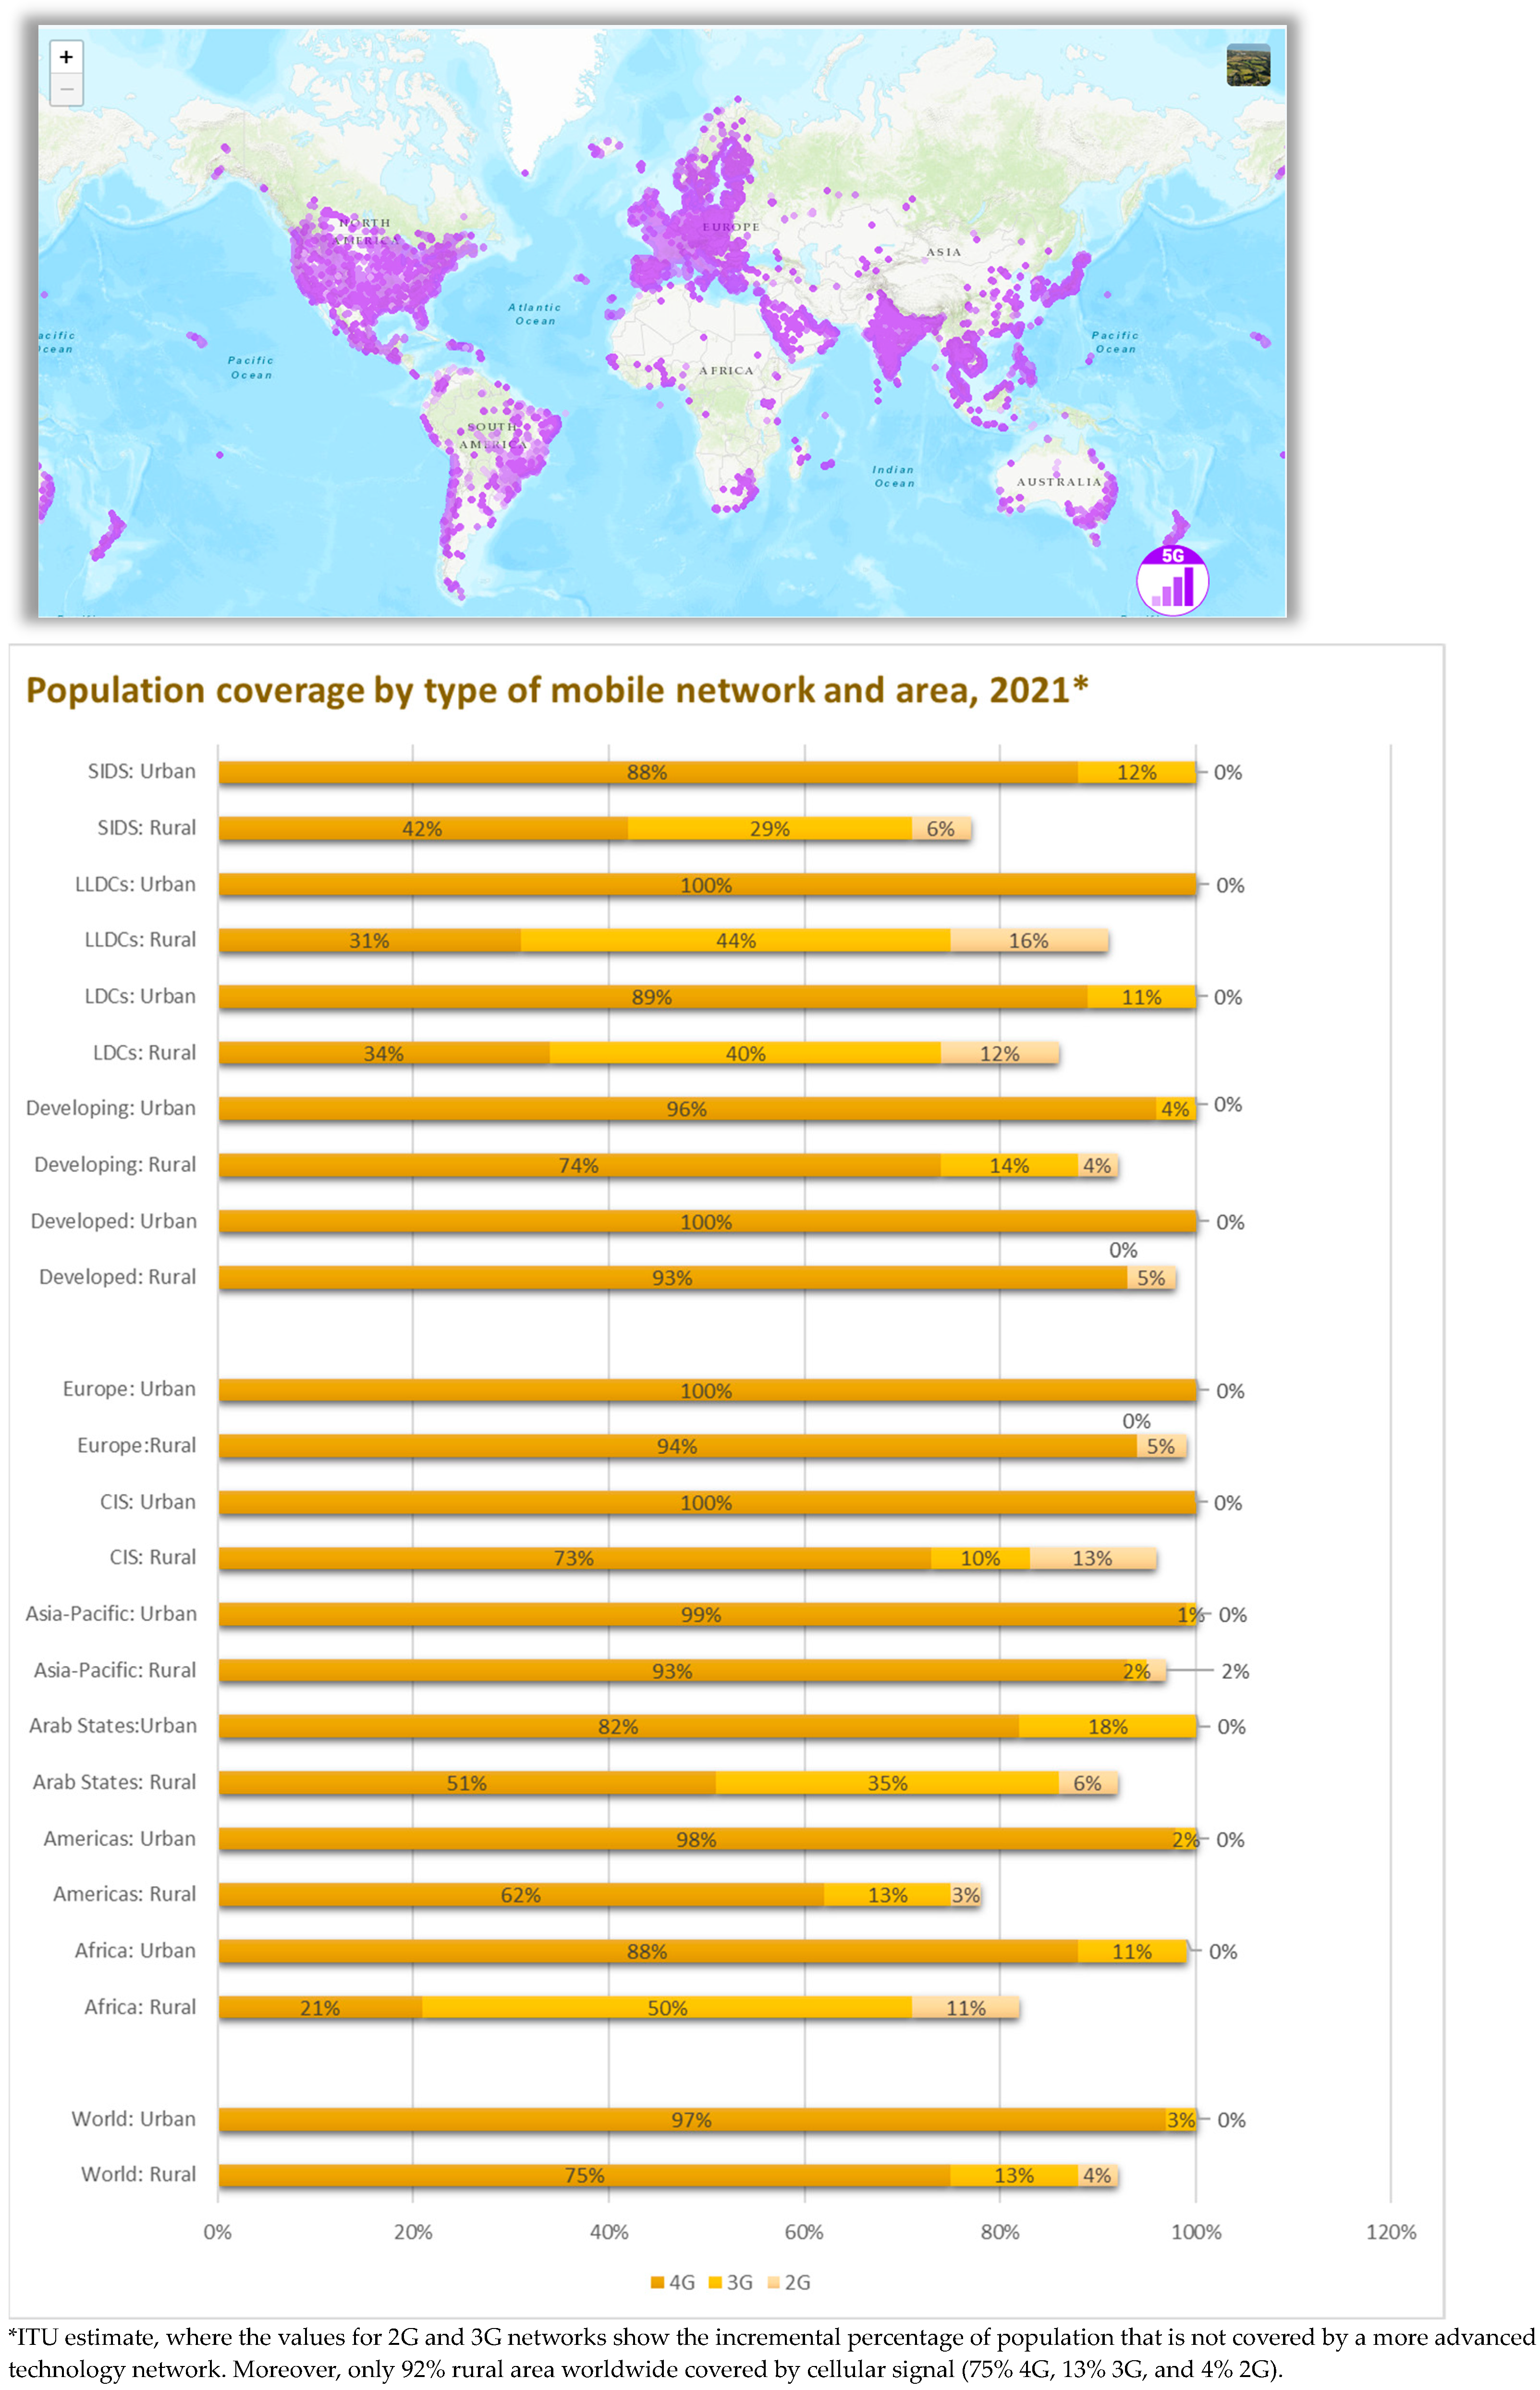
- ITU. Population Coverage by Type of Mobile Network and Area, 2021*; International Telecommunication Union: Geneva, Switzerland, 2021; Available online: https://www.itu.int/itu-d/reports/statistics/2021/11/15/mobile-network-coverage/ (accessed on 12 January 2023).
- Perrin, A.; Atske, S. “7% of Americans Don’t Use the Internet. Who Are They?”. Pew Research Center. Available online: https://www.pewresearch.org/fact-tank/2021/04/02/7-of-americans-dont-use-the-internet-who-are-they/ (accessed on 12 January 2023).
- “5G Coverage Map Worldwide,” ed: Nperf. 2023. Available online: https://www.nperf.com/en/map/5g (accessed on 15 February 2023).
- The Wonderful of Waerebo Village. Tripadvisor: East Nusa Tenggara, Indonesia, 2022. Available online: https://www.tripadvisor.com/AttractionProductReview-g1777483-d17645917-The_Wonderful_of_Waerebo_Village-Labuan_Bajo_Flores_East_Nusa_Tenggara.html (accessed on 14 February 2023).
- Hayes, A. Wae Rebo Village, a Remote Community in Flores, Indonesia. Only Accessible with a 3 to 4 h Hike. Available online: https://unsplash.com/photos/EV2tTLVsiKU (accessed on 15 February 2023).
- Navas-Sabater, J.; Dymond, A.; Juntunen, N. Telecommunications and Information Services for the Poor: Toward a Strategy for Universal Access; no. Book, Whole; World Bank Publications: Washington, DC, USA, 2001. (In English) [Google Scholar]
- Stern, P.A.; Townsend, D. “New Models for Universal Access in Latin America,” in “Regulatel/World Bank (PPIAF)/ECLAC Project on Universal Access for Telecommunications in Latin America “ World Bank. 2006. Available online: http://www.kiwanja.net/database/document/report_universal_access_LA.pdf (accessed on 27 September 2022).
- Williams, M.D.J.; Mayer, R.; Minges, M. Africa’s ICT Infrastructure: Building on the Mobile Revolution; no. Book, Whole; World Bank Publications: Herndon, VA, USA, 2011. (In English) [Google Scholar]
- Households with Broadband Access. 2020. Available online: https://data.oecd.org/broadband/households-with-broadband-access.htm (accessed on 21 June 2022).
- ITU. DataHub, International Telecommunication Union. Available online: https://datahub.itu.int/indicators/ (accessed on 1 September 2022).
- Tsilipanos, K.; Neokosmidis, I.; Varoutas, D. Modeling Complex Telecom Investments: A System of Systems Approach. IEEE Trans. Eng. Manag. 2015, 62, 631–642. [Google Scholar] [CrossRef]
- Straub, S. Infrastructure and Growth in Developing Countries: Recent Advances and Research Challenges; University of Edinburgh and World Bank: Scotland, UK, 2008. [Google Scholar] [CrossRef]
- Snieska, V.; Zykiene, I. Socio-Economic Impact of Infrastructure Investments. Eng. Econ. 2009, 3, 160–164. [Google Scholar]
- Mentari, O.; Situmorang, A.C. Cellular Operator Strategic in A Coronavirus Pandemic. In Proceedings of the 8th International Seminar and Conference on Learning Organization (ISCLO), Virtual, 11 November 2020; Hutami, R.R.F., Ed.; Telkom University: Bandung, Indonesia, 2020; pp. 160–164. Available online: https://isclo.telkomuniversity.ac.id/welcome-8th-isclo-2020/ (accessed on 18 February 2023).
- Christina, A.; Gunawan, D.; Suryanegara, M. “Pseudocode Categorization of Indonesian Districts Using a 4 × 4 Matrix of Telecommunication and Socioeconomic Networks (in the Original Language (Bahasa): “Pseudocode Kategorisasi Kecamatan Se-Indonesia Berdasarkan Matriks 4 × 4 Jaringan Telekomunikasi Dan Sosial Ekonomi”) with Copyright Number EC002022107233 “, ed. Indonesia: Ministry of Law and Human Rights. 2022. Available online: https://pdki-indonesia.dgip.go.id/detail/EC002022107233?type=copyright&keyword=Pseudocode+Kategorisasi+Kecamatan+se-Indonesia+berdasarkan+Matriks+4x4+Jaringan+Telekomunikasi+dan+Sosial+Ekonomi (accessed on 1 January 2023).
- Presidential Regulation of the Republic of Indonesia concerning the Determination of Disadvantaged Regions in 2020–2024 (in the original language (Bahasa): “Peraturan Presiden Republik Indonesia tentang Penetapan Daerah Tertinggal Tahun 2020-2024”, Ministry of Law and Human Rights 63. 2020. Available online: https://peraturan.bpk.go.id/Home/Details/136563/perpres-no-63-tahun-2020 (accessed on 14 April 2022).
- “E1 Transmits Data at Speeds of up to 2048 mbps Over”. Northeastern Mindanao College. Available online: https://www.coursehero.com/file/p324ovj3/E1-transmits-data-at-speeds-of-up-to-2048-Mbps-over-two-pairs-of-twisted-wires/ (accessed on 1 January 2022).
- Rahul. “Transport Network for O-RAN,” ed: Itelcotech.com. 2021. Available online: https://itelcotech.com/?p=488 (accessed on 8 April 2022).
- Connely, B. How Ookla Ensures Accurate, Reliable Data: A Guide to Our Metrics and Methodology (Updated for 2021). OOKLA. Available online: https://www.ookla.com/articles/how-ookla-ensures-accurate-reliable-data-2021 (accessed on 1 January 2022).
- Wisnubroto, K. “ICT Infrastructure Equity Supports Digital Transformation Acceleration (in the Original Language (Bahasa): “Pemerataan Infrastruktur TIK Dukung Akselerasi Transformasi Digital”),” E.I.S. Ratna Nuraini, Ed. ed: Portal Informasi Indonesia. 2022. Available online: https://indonesia.go.id/kategori/editorial/3580/pemerataan-infrastruktur-tik-dukung-akselerasi-transformasi-digital (accessed on 2 October 2022).
- Mediana. “Ministry of Communication and Informatics: 3G Services will Be Phased Out (in the Original Language (Bahasa): “Kemkominfo: Layanan 3G akan Dimatikan secara Bertahap”),” Telekomunikasi, 29 Desember 2021. Available online: https://www.kompas.id/baca/ekonomi/2021/12/29/kemkominfo-layanan-3g-akan-dimatikan-secara-bertahap/ (accessed on 9 December 2022).
- “The Indonesian Electricity System—A Brief Overview,” Differ. 2020. Available online: https://repit.files.wordpress.com/2013/04/the-indonesia-electricity-system-feb-2012.pdf (accessed on 22 December 2022).
- Mulyani, S. The Importance of Higher Education for Indonesia (in the Original Language (Bahasa): “Pentingnya Pendidikan Tinggi Bagi Indonesia”). ed: Kementerian Keuangan Republik Indonesia. 2018. Available online: https://www.kemenkeu.go.id/publikasi/berita/pentingnya-pendidikan-tinggi-bagi-indonesia/ (accessed on 9 December 2022).
- Cull, R.; Demirgüç-Kunt, A.; Morduch, J. Banks and Microbanks. J. Financial Serv. Res. 2013, 46, 1–53. [Google Scholar] [CrossRef]
- Layton, R.A. Towards a theory of marketing systems. Eur. J. Mark. 2011, 45, 259–276. [Google Scholar] [CrossRef]
- Vivel-Búa, M.; Lado-Sestayo, R.; Otero-González, L. Impact of location on the probability of default in the Spanish lodging industry. Tour. Econ. 2015, 22, 593–607. [Google Scholar] [CrossRef]
- Mölstad, S.; Hovelius, B.; Kroon, L.; Melander, A. Prescription of antibiotics to out- patients in hospital clinics, community health centres and private practice. Eur. J. Clin. Pharmacol. 1990, 39, 9–12. [Google Scholar] [CrossRef] [PubMed]
- Zimmermann, K.F. Flexibility in the face of demand fluctuations: Employment, capacity utilization, and industry structure. Int. J. Ind. Organ. 1995, 13, 179–193. [Google Scholar] [CrossRef]
- Browne, C. Pacific Island Economies; no. Book, Whole; International Monetary Fund: Washington, DC, USA, 2006. [Google Scholar]
- Cortés-Jiménez, I. Which type of tourism matters to the regional economic growth? The cases of Spain and Italy. Int. J. Tour. Res. 2008, 10, 127–139. [Google Scholar] [CrossRef]
- Tsartsara, S.I. Definition of a new type of tourism niche—The geriatric tourism. Int. J. Tour. Res. 2018, 20, 796–799. [Google Scholar] [CrossRef]
- Aliyev, V. Halal Tourism—The Type of Tourism Required in Azerbaijan. J. Environ. Manag. Tour. 2021, 12, 1576–1585. [Google Scholar] [CrossRef] [PubMed]
- Winarso, H. Access to main roads or low cost land? Residential land developers’ behaviour in Indonesia. Bijdr. tot de taal-, land- en Volkenkd./J. Humanit. Soc. Sci. Southeast Asia 2002, 158, 653–676. [Google Scholar] [CrossRef]
- National Regional Revenue and Expenditure Budget (APBD) Posture: Data on the Realization of District/City Budgets throughout Indonesia in 2018 (in the original language (Bahasa): “Postur APBD Nasional: Data Realisasi APBD Kabupaten/Kota Seluruh Indonesia Tahun 2018”), DJPK Ministry of Finance. Available online: https://djpk.kemenkeu.go.id/portal/data/apbd (accessed on 1 April 2022).
- “District/City Independence Level (in the Original Language (Bahasa): “Tingkat Kemandirian Kabupaten/Kota”).” Badan Pusat Statistik. Available online: https://sirusa.bps.go.id/sirusa/index.php/indikator/928 (accessed on 25 December 2019).
- Regional Fiscal and Poverty Index in the framework of the Central and Regional Joint Affairs Funding Plan for Poverty Reduction for Fiscal Year 2014 (in the Original Language (Bahasa): “Indeks Fiskal dan Kemiskinan Daerah Dalam Rangka Perencanaan Pendanaan Urusan Bersama Pusat dan Daerah untuk Penanggulangan Kemiskinan Tahun Anggaran 2014”), Kemenkeu 74. 2013. Available online: https://djpk.kemenkeu.go.id/attach/pmk-nomor-74pmk-072013/PMK%2074%20TAHUN%202013%20tentang%20Indeks%20Fiskal%20dan%20Kemiskinan%20Daerah%20kecil_opt.pdf (accessed on 14 April 2022).
- Regional Fiscal Capacity Map (in the Original Language (Bahasa): “Peta Kapasitas Fiskal Daerah”), Kemenkeu 107. 2018. Available online: https://peraturan.bpk.go.id/Home/Details/137200/pmk-no-107pmk072018 (accessed on 14 April 2022).
- Su, H.; Wei, H.; Zhao, J. Density effect and optimum density of the urban population in China. Urban Stud. 2016, 54, 1760–1777. [Google Scholar] [CrossRef]
- Essiambre, R.-J.; Kramer, G.; Winzer, P.J.; Foschini, G.J.; Goebel, B. Capacity Limits of Optical Fiber Networks. J. Lightwave Technol. 2010, 28, 662–701. [Google Scholar] [CrossRef]


| Our Telecommunication Network Indicators | SDG Indicators * | ITU Connectivity Concerns [50] | Our Data Source |
|---|---|---|---|
| The presence of optical distribution points (ODPs) | - | Backbone/core infrastructure | MNOs |
| Coverage prediction/signal coverage (SigCov) | 9.c.1. Proportion of population covered by a mobile network. | Access | MNOs |
| Traffic | - | Quality of service (QoS) | OOKLA crowdsourcing |
| The quantity of mobile cellular (2G/3G/4G) sites | - | - | MNOs |
| Propose Indicators | SDG Indicators * | Country Report [50] from ITU Indicators | Indicators from Research Paper | Our Data Source |
|---|---|---|---|---|
| Electricity | 7.1.1. Population with access to electricity. | The proportion of households with electricity in Indonesia and Thailand is 99%. | Investor CAPEX [51,52]. | Statistics Indonesia |
| Education | - | Education is needed to possess several ICT skills. | OPEX [51]. | Statistics Indonesia |
| Buying and Selling Transactions | - | - | Balancing market to achieve revenue [51]. | Statistics Indonesia. |
| Lodging | - | - | Demand forecast [51]. | Statistics Indonesia. |
| Health Facilities | 3.8.1. Coverage of essential health services. | - | Reciprocal impact on infrastructure. [52] | Statistics Indonesia. |
| Financial Activities | 8.10.1a Number of banks. | - | Demand forecast [51]. | Statistics Indonesia. |
| Industrial Capacity | - | - | Reciprocal impact on infrastructure [52]. | Statistics Indonesia. |
| Tourism | - | - | Reciprocal impact on infrastructure [52]. | Statistics Indonesia. |
| Mining and Plantation Business Units | - | - | Reciprocal impact on infrastructure [52]. | Statistics Indonesia. |
| Residential Conditions | 11.1.1 Slums. | - | Demand forecast [51]. | Statistics Indonesia. |
| Road Access | - | - | Investor CAPEX [51,52]. | Statistics Indonesia. |
| Regional Finance | - | - | Pricing [51]. | Ministry of Finance and Statistics Indonesia. |
| Population | - | Demographic trends are rising in Indonesia, India, Malaysia, Thailand, and Korea (Rep. of). | Demand forecast [51]. | Ministry of Internal Affairs. |
| Regulation | Indonesia | India | Malaysia | Thailand | Korea (Rep. of) |
|---|---|---|---|---|---|
| Regulatory Incentives for Telecom/ICT Operators | 2022: No, there are no targeted incentives. | 2022: Yes, for other operators. | 2021: Yes, for all operators (including virtual operators). | 2022: Yes, for facility/infrastructure operators. | 2021: No, there are no targeted incentives. |
| Spectrum Licenses Technology-Neutral | 2022: Some. | 2022: Yes. | 2021: Yes. | 2022: Yes. | 2021: Some. |
| Mechanisms for Assigning 4G Spectrum | 2018: Auction. | 2020: Auction. | 2020: First come, first served/spectrum allocated as part of the license. | 2020: Auction. | 2020: Auction. |
| ICT Policy that Includes Broadband Exists | 2016: Indonesia Broadband Plan. https://kominfo.go.id/content/detail/6859/program-prioritas-konektivitas-pita-lebar/0/pp_broadband (accessed on 5 January 2023) | National Digital Communications Policy, 2018. https://dot.gov.in/sites/default/files/EnglishPolicy-NDCP.pdf (accessed on 5 January 2023) National Broadband Mission 2019. https://dot.gov.in/national-broadband-mission (accessed on 5 January 2023) | 2021: 11th Malaysia Plan. http://www.skmm.gov.my/Sectors/Broadband/National-Broadband-Initiative.aspx (accessed on 5 January 2023) | 2022: National Digital Economy and Society Development Plan and Policy. www.mdes.go.th (accessed on 5 January 2023) | 2021: The Sixth Master Plan for National Informatization to Realize Intelligent Information Society. https://www.msit.go.kr/web/msipContents/contentsView.do?cateId=_tsta5511&artId=1557222 (accessed on 5 January 2023) |
| The Timeframe and the Name for the Implementation of the National Broadband Policy | 2014–2019: Indonesia National Broadband Plan. www.bappenas.go.id (accessed on 8 January 2023) | Every 5 years: BharatNet. www.bbnl.nic.in (accessed on 8 January 2023) | March 2010: National Broadband Initiative. https://www.mcmc.gov.my/sectors/broadband/national-broadband-initiative (accessed on 8 January 2023) | 2019–2037: Digital Economy. https://www.onde.go.th/ (accessed on 8 January 2023) | 2013: Ultra Broadband Convergence Network. http://www.kcc.go.kr (accessed on 8 January 2023) |
| Goals of National Broadband Plan | Promote the adoption of broadband services and applications. | Build nation-wide broadband infrastructure. | Build nation-wide broadband infrastructure. | Promote the adoption of broadband services and applications. | Promote the provision of public services using broadband. |
| Internet Access Is Recognized as a Legal Right | 2022: Yes | 2022: No. | 2021: No. | 2022: No. | 2021: Yes. |
| Has Your Country Established Any Other Financing Mechanisms (e.g., Special Rural Access Concessions, Tax Incentives, etc.) for the Provision of Universal Service/Access? | 2022: Yes. | 2022: Yes. | 2021: No. | 2022: No. | 2021: No. |
| Financing of National Broadband plan | 2022: Universal service fund (USF). | 2022: Universal service fund. | 2021: Universal service fund. | 2022: Universal service fund. | 2010: Government grants of other direct financial subsidies. |
| Projects Financed by USFs | 2022: Connecting local government offices. | 2022: Connecting persons with disabilities. | 2016: Multi-purpose telecentres. | 2022: Connecting persons with disabilities. | N/A |
| Municipal Network initiatives | 2022: Yes. | 2022: Yes. | N/A | 2022: No. | 2021: No. |
| Managing Authority of USF | 2022: Regulatory Agency. | 2022: Regulatory Agency. | 2021: Regulatory Authority. | 2022: Regulatory Authority. | N/A |
| Sabater | Stern | Mayer | ITU | Proposed Model | |
|---|---|---|---|---|---|
| Framework Name | Telecommunications & Information Services for the Poor. | The Gaps Model. | Coverage Gap Analysis Framework. | Distinctions within the Access Gap. | Indonesian Framework for Telecommunications Infrastructure based on Network and Socioeconomic Indicators. |
| Reference | [46] | [47] | [48] | [3] | - |
| Proposed Year | 2002 | 2006 | 2009 | 2010 | 2023 |
| Dimensions | Poverty and geographical isolation. | Needs and availability, area, and household. | Demand and supply. | Household and geographical reach. | Socioeconomic reach (demand or needs) and geographical reach (supply or availability of telecommunications networks). |
| Number of Grid Categories | 5 | 5 | 3 | 4 | 4 |
| Concept | People who can afford it can have personal access in their homes. Fewer resources and increasingly difficult geographic locations can lead to market inefficiency and access gaps. | Penetration is concentrated in high-income and low-cost regions. In inefficient market locations, a market gap begins to develop, leading to an access gap in areas where costs are high, and income is low. | A model that divides locations into existing coverage areas, market efficiency gaps, and coverage area gaps (sustainable and universal). | Communities flourish when they are situated in areas with access coverage and networks. Nevertheless, flourishing communities can be situated in market efficiency gaps, smart subsidy zones, and access gap zones. | In the Indonesian context, there are district areas that are already modernising or could be developed rapidly (Grid #4), developed areas (Grid #3), developing areas (Grid #2), and underdeveloped/non-commercial/blank spot areas (Grid #1). |
| Framework Benefits | Providing equal access to ICTs is now a universal principle. | It is becoming a universal concept to expand ICT access for all. This concept is a model proposal in Latin America that connects market forces, regulatory decisions, and finance to the growth of the telecommunications market, particularly in high-income, low-cost, and population-dense areas. | It is becoming a universal concept to facilitate equal access to ICT. This principle has been applied to the development of ICT infrastructure in Africa by means of market profiling and the deployment of fiber optic infrastructure. | Equal ICT access is a universal concept that is included in the ICT Regulation Toolkit. | It is a universal principle to provide equitable ICT access, which can be applied to fit the Indonesian context. |
| Grid | Definition | Government Action |
|---|---|---|
| Grid #1: Fostered District | In fostered districts, the backhaul network is not yet available, and several environmental factors complicate its construction. Due to the relatively low potential for traffic demand and relatively high operational costs, backhaul networks leading to the access network on Grid #1 are more likely to be constructed and managed by the government. | The government should develop policy actions to provide telecommunications access. These actions include schemes such as special subsidies or incentives; private telecommunications providers are tasked with connecting the network on Grid #1 to the national cellular network and promoting digital literacy. |
| Grid #2: Developing District | Developing districts are development areas with relatively low demand potential, which telecommunications operators evaluate from an economic standpoint. Grid #2 is less desirable due to the large deficit margin between the potential for obtaining demand traffic and the estimated cost of building and an operating telecommunications infrastructure. | In Grid #2, the backhaul network is not yet available; therefore, the government should play an active role as an enabler or facilitator in providing a backhaul network. For a backhaul network, optical fiber or microwave links should be prioritized. On the access side, a base transceiver station (BTS) is constructed by the telecommunications provider after the government provides the backhaul. The backhaul and constructed BTS infrastructure must be usable by a variety of telecommunications providers, such as cellular operators and Internet service providers (ISPs). For mobile services, the government can assist by establishing a clear legal umbrella for inter-operator roaming and spectrum sharing, allowing the multi-operator radio access network (MORAN) and multi-operator core network (MOCN) schemes to be implemented without the risk of becoming entangled in legal disputes. |
| Grid #3: Developed District | Grid #3 areas are those where backbones and backhauls are available but remain under the control of a small number of network administrators, making access difficult. | In Grid #3, the government (both central and regional) must provide incentives in the form of regulatory cost relaxation and affirmative policies, such as encouraging open access to existing backbone/backhaul networks or passive infrastructure sharing. In addition, telecommunications providers are encouraged to build on Grid #3 by committing to coverage and service quality (QoS). |
| Grid #4: Independent Advanced District | Independent advanced districts are modern areas in which high demand, backbone, and backhaul penetration are sufficiently pervasive. In this type of district, competition is sufficiently robust for telecommunications service providers to provide excellent service. | For Grid #4, there does not need to be a coverage development commitment, but there should be a QoS commitment. Therefore, regulators should ensure that operators maintain a high QoS. |
| No. | Instruments for Policy and Regulation | Explanation | Grid* | |||
|---|---|---|---|---|---|---|
| #1 | #2 | #3 | #4 | |||
| 1. | Infrastructure sharing. | From passive infrastructure to open access for telecommunications networks, operators are expected to share their network capacity with other operators in a fair manner. | ☑ | ☑ | ||
| 2. | It is feasible to have a neutral host that constructs networks in rural areas to be rented to telecommunications companies, such as cellular operators and ISPs. | This neutral host could be created by local entrepreneurs in partnership with the local government (Pemda) because, based on the number of entrepreneurs in Jakarta, developing a network in this region may be deemed unprofitable due to the national consumer profile. The local businesses or local governments who are more concerned with the requirements of the local community would have a different perspective, and it is believed that the on-net revenue from cellular operators or ISPs that rent their network capacity is sufficient. | ☑ | ☑ | ☑ | |
| 3. | Reorientation of development commitments within telecom network operating licenses. | As of now, the development commitment is still based on the MNOs’ business strategy. It emphasizes economic factors in terms of demand potential. Governments should determine the places to be developed, notably in grid #3 and grid #2′s priority grid. | ☑ | ☑ | ||
| 4. | Utilization of a more adaptable radio frequency spectrum, such as by permitting spectrum leasing. | Since the development of most national MNOs is concentrated in metropolitan cities, rural frequency permits have not been optimized. Under such conditions, a spectrum leasing program for neutral hosts at the local level temporarily utilizing the allocation of frequencies of national cellular operators based on government-approved business-to-business (B2B) agreements is feasible. In this spectrum leasing model, the frequency right-of-use fee (BHP) is not required to be billed twice, as the frequency permit is still associated with the national mobile operator. | ☑ | ☑ | ||
| 5. | Reducing regulatory costs to lower rural development costs. | BHP frequency, BHP telecommunications, and USO payments are regulatory fees of the central government’s non-tax state revenue (PNBP) that are directly associated with telecommunications providers. In addition, there are tower taxes, telecommunication tower building permission (IMB) fees, etc., imposed by municipal governments. The rationalization of such components might be seen as a means of promoting rural development. It requires careful calculation so that it is not classified as a state loss, for instance, by converting PNBP deposits into the obligation to build a number of new BTS on grids #1 and #2 (“pay or play”) or by calculating the tax increases from telecommunications providers after rationalizing the components of these regulatory costs. | ☑ | ☑ | ||
| 6. | Encouraging the active participation of local governments in providing support, particularly access to passive infrastructure and territorial planning. | Since the regional spatial plan (RTRW) preparation stage, local governments have been encouraged to involve MNOs, particularly cellular operators, in planning candidates for the placement of telecommunication towers that are in line with network planning on the cellular operator side. The objective is to ensure that the BTS construction is optimal in terms of coverage, electrical power supply, and environmental safety. | ☑ | ☑ | ☑ | ☑ |
| 7. | Scheme for asymmetrical interconnection | It is feasible to apply a higher termination rate to rural communications due to the higher operational and development costs associated with rural locations. | ☑ | ☑ | ||
| 8. | Subsidizing the subscription prices for rural residents’ telecommunications services. | Providing rural residents with government subsidies so that retail rates for communication services in these areas can be reduced. On the other hand, telecom companies may guarantee that a portion of their income comes from government subsidies. This will at the very least reduce network running costs. | ☑ | ☑ | ||
| 9. | 5G densification. | Utilization of public utilities (electric poles, bus stops, traffic lights, streetlights, etc.) for 5G feature optimization (enhanced mobile broadband (eMBB), ultra-reliable low-latency communication/URLLC, massive machine type communication (mMTC)). This necessitates coordination between ministries and institutions (K/L). | ☑ | |||
| The Grid-Reference Index of Telecommunications Network Indicators | |||||
|---|---|---|---|---|---|
| G1 | G2 | G3 | G4 | ||
| The Grid Reference-Index of Socioeconomic Indicators | G1 | Grid #1 | Grid #2 | Grid #2 | Grid #2 |
| G2 | Grid #2 | Grid #2 | Grid #3 | Grid #3 | |
| G3 | Grid #2 | Grid #3 | Grid #3 | Grid #4 | |
| G4 | Grid #2 | Grid #3 | Grid #4 | Grid #4 | |
| Column | A | B | C | ||
|---|---|---|---|---|---|
| Row | Telco Network | Socioeconomic | Final Grid | Pseudocode Application | |
| 2 | G1 | G1 | #1 | =IF(AND(A2=1;B2=1);1;IF(AND(A2=2;B2=2);2;IF(AND(A2=3;B2=3);3;IF(AND(A2=4;B2=4);4;IF(AND(A2≥2;B2≥2);IF(AND(A2≥3;B2≥3);4;3);2))))) | |
| 3 | G1 | G2 | #2 | =IF(AND(A3=1;B3=1);1;IF(AND(A3=2;B3=2);2;IF(AND(A3=3;B3=3);3;IF(AND(A3=4;B3=4);4;IF(AND(A3≥2;B3≥2);IF(AND(A3≥3;B3≥3);4;3);2))))) | |
| 4 | G1 | G3 | #2 | =IF(AND(A4=1;B4=1);1;IF(AND(A4=2;B4=2);2;IF(AND(A4=3;B4=3);3;IF(AND(A4=4;B4=4);4;IF(AND(A4≥2;B4≥2);IF(AND(A4≥3;B4≥3);4;3);2))))) | |
| 5 | G1 | G4 | #2 | =IF(AND(A5=1;B5=1);1;IF(AND(A5=2;B5=2);2;IF(AND(A5=3;B5=3);3;IF(AND(A5=4;B5=4);4;IF(AND(A5≥2;B5≥2);IF(AND(A5≥3;B5≥3);4;3);2))))) | |
| 6 | G2 | G1 | #2 | =IF(AND(A6=1;B6=1);1;IF(AND(A6=2;B6=2);2;IF(AND(A6=3;B6=3);3;IF(AND(A6=4;B6=4);4;IF(AND(A6≥2;B6≥2);IF(AND(A6≥3;B6≥3);4;3);2))))) | |
| 7 | G2 | G2 | #2 | =IF(AND(A7=1;B7=1);1;IF(AND(A7=2;B7=2);2;IF(AND(A7=3;B7=3);3;IF(AND(A7=4;B7=4);4;IF(AND(A7≥2;B7≥2);IF(AND(A7≥3;B7≥3);4;3);2))))) | |
| 8 | G2 | G3 | #3 | =IF(AND(A8=1;B8=1);1;IF(AND(A8=2;B8=2);2;IF(AND(A8=3;B8=3);3;IF(AND(A8=4;B8=4);4;IF(AND(A8≥2;B8≥2);IF(AND(A8≥3;B8≥3);4;3);2))))) | |
| 9 | G2 | G4 | #3 | =IF(AND(A9=1;B9=1);1;IF(AND(A9=2;B9=2);2;IF(AND(A9=3;B9=3);3;IF(AND(A9=4;B9=4);4;IF(AND(A9≥2;B9≥2);IF(AND(A9≥3;B9≥3);4;3);2))))) | |
| 10 | G3 | G1 | #2 | =IF(AND(A10=1;B10=1);1;IF(AND(A10=2;B10=2);2;IF(AND(A10=3;B10=3);3;IF(AND(A10=4;B10=4);4;IF(AND(A10≥2;B10≥2);IF(AND(A10≥3;B10≥3);4;3);2))))) | |
| 11 | G3 | G2 | #3 | =IF(AND(A11=1;B11=1);1;IF(AND(A11=2;B11=2);2;IF(AND(A11=3;B11=3);3;IF(AND(A11=4;B11=4);4;IF(AND(A11≥2;B11≥2);IF(AND(A11≥3;B11≥3);4;3);2))))) | |
| 12 | G3 | G3 | #3 | =IF(AND(A12=1;B12=1);1;IF(AND(A12=2;B12=2);2;IF(AND(A12=3;B12=3);3;IF(AND(A12=4;B12=4);4;IF(AND(A12≥2;B12≥2);IF(AND(A12≥3;B12≥3);4;3);2))))) | |
| 13 | G3 | G4 | #4 | =IF(AND(A13=1;B13=1);1;IF(AND(A13=2;B13=2);2;IF(AND(A13=3;B13=3);3;IF(AND(A13=4;B13=4);4;IF(AND(A13≥2;B13≥2);IF(AND(A13≥3;B13≥3);4;3);2))))) | |
| 14 | G4 | G1 | #2 | =IF(AND(A14=1;B14=1);1;IF(AND(A14=2;B14=2);2;IF(AND(A14=3;B14=3);3;IF(AND(A14=4;B14=4);4;IF(AND(A14≥2;B14≥2);IF(AND(A14≥3;B14≥3);4;3);2))))) | |
| 15 | G4 | G2 | #3 | =IF(AND(A15=1;B15=1);1;IF(AND(A15=2;B15=2);2;IF(AND(A15=3;B15=3);3;IF(AND(A15=4;B15=4);4;IF(AND(A15≥2;B15≥2);IF(AND(A15≥3;B15≥3);4;3);2))))) | |
| 16 | G4 | G3 | #4 | =IF(AND(A16=1;B16=1);1;IF(AND(A16=2;B16=2);2;IF(AND(A16=3;B16=3);3;IF(AND(A16=4;B16=4);4;IF(AND(A16≥2;B16≥2);IF(AND(A16≥3;B16≥3);4;3);2))))) | |
| 17 | G4 | G4 | #4 | =IF(AND(A17=1;B17=1);1;IF(AND(A17=2;B17=2);2;IF(AND(A17=3;B17=3);3;IF(AND(A17=4;B17=4);4;IF(AND(A17≥2;B17≥2);IF(AND(A17≥3;B17≥3);4;3);2))))) | |
| The Indicators of Telecommunications Network | Total | |||||
|---|---|---|---|---|---|---|
| G1 | G2 | G3 | G4 | |||
| Socioeconomic Indicators | G1 | Grid #1 = 585 (8.1%) | Grid #2 = 188 (2.6%) | Grid #2 = 102 (1.4%) | Grid #2 = 39 (0.5%) | 914 (12.6%) |
| G2 | Grid #2 = 384 (5.3%) | Grid #2 = 1600 (22.1%) | Grid #3 = 652 (9.0%) | Grid #3 = 163 (2.3%) | 2799 (38.7%) | |
| G3 | Grid #2 = 116 (1.6%) | Grid #3 = 1016 (14.0%) | Grid #3 = 1039 (14.4%) | Grid #4 = 381 (5.3%) | 2552 (35.3%) | |
| G4 | Grid #2 = 29 (0.4%) | Grid #3 = 129 (1.8%) | Grid #4 = 409 (5.7%) | Grid #4 = 400 (5.5%) | 967 (13.4%) | |
| Total | 1114 (15.4%) | 2933 (40.6%) | 2202 (30.4%) | 983 (13.6%) | 7232 (100%) | |
| Actual Value (Correct Answer) | |||||
|---|---|---|---|---|---|
| Positive | Negative | ||||
| DKI Jakarta | Nation-wide Random Sampling | DKI Jakarta | Nation-Wide Random Sampling | ||
| Predicted Value (Model) | Positive | 42 | 56 | 2 | 0 |
| Negative | 0 | 7 | 0 | 0 | |
| DKI Jakarta | Nation-Wide Random Sampling | |
|---|---|---|
| Accuracy | 95.5% | 89% |
| Error Rate | 4.5% | 11% |
| No. | Research Questions | Key Observations |
|---|---|---|
| 1. | Is the telecommunications infrastructure being constructed in geographically isolated and socioeconomically depressed regions in order to attract residents and stimulate economic growth? | This situation requires a framework that can serve as a regulatory reference, particularly in determining the region’s category for telecommunication infrastructure. |
| 2. | Or is the telecommunications industry following the provider/business approach, whereby they wait until the region is economically viable before investing in infrastructure excellence? |
Disclaimer/Publisher’s Note: The statements, opinions and data contained in all publications are solely those of the individual author(s) and contributor(s) and not of MDPI and/or the editor(s). MDPI and/or the editor(s) disclaim responsibility for any injury to people or property resulting from any ideas, methods, instructions or products referred to in the content. |
© 2023 by the authors. Licensee MDPI, Basel, Switzerland. This article is an open access article distributed under the terms and conditions of the Creative Commons Attribution (CC BY) license (https://creativecommons.org/licenses/by/4.0/).
Share and Cite
Situmorang, A.C.; Suryanegara, M.; Gunawan, D.; Juwono, F.H. Proposal of the Indonesian Framework for Telecommunications Infrastructure Based on Network and Socioeconomic Indicators. Informatics 2023, 10, 44. https://doi.org/10.3390/informatics10020044
Situmorang AC, Suryanegara M, Gunawan D, Juwono FH. Proposal of the Indonesian Framework for Telecommunications Infrastructure Based on Network and Socioeconomic Indicators. Informatics. 2023; 10(2):44. https://doi.org/10.3390/informatics10020044
Chicago/Turabian StyleSitumorang, Anna Christina, Muhammad Suryanegara, Dadang Gunawan, and Filbert H. Juwono. 2023. "Proposal of the Indonesian Framework for Telecommunications Infrastructure Based on Network and Socioeconomic Indicators" Informatics 10, no. 2: 44. https://doi.org/10.3390/informatics10020044