
Risk Factors Influencing Fatal Powered Two-Wheeler At-Fault and Not-at-Fault Crashes: An Application of Spatio-Temporal Hotspot and Association Rule Mining Techniques


Abstract
:1. Introduction
1.1. Background
1.2. Summary and Critique of the Literature
1.3. Study Objective and Contribution
- Where are the spatio-temporal hotspot locations of fatal PTW crashes in South Korea concentrated, and what are the trends associated with them?
- What are the chains of factors associated with PTW crashes at critical crash hotspots?
- Do the elements of the chains of risk factors influencing fatal PTW crashes at critical hotspots differ when the fault status of the PTW rider is considered?
2. Materials and Methods
2.1. Study Framework
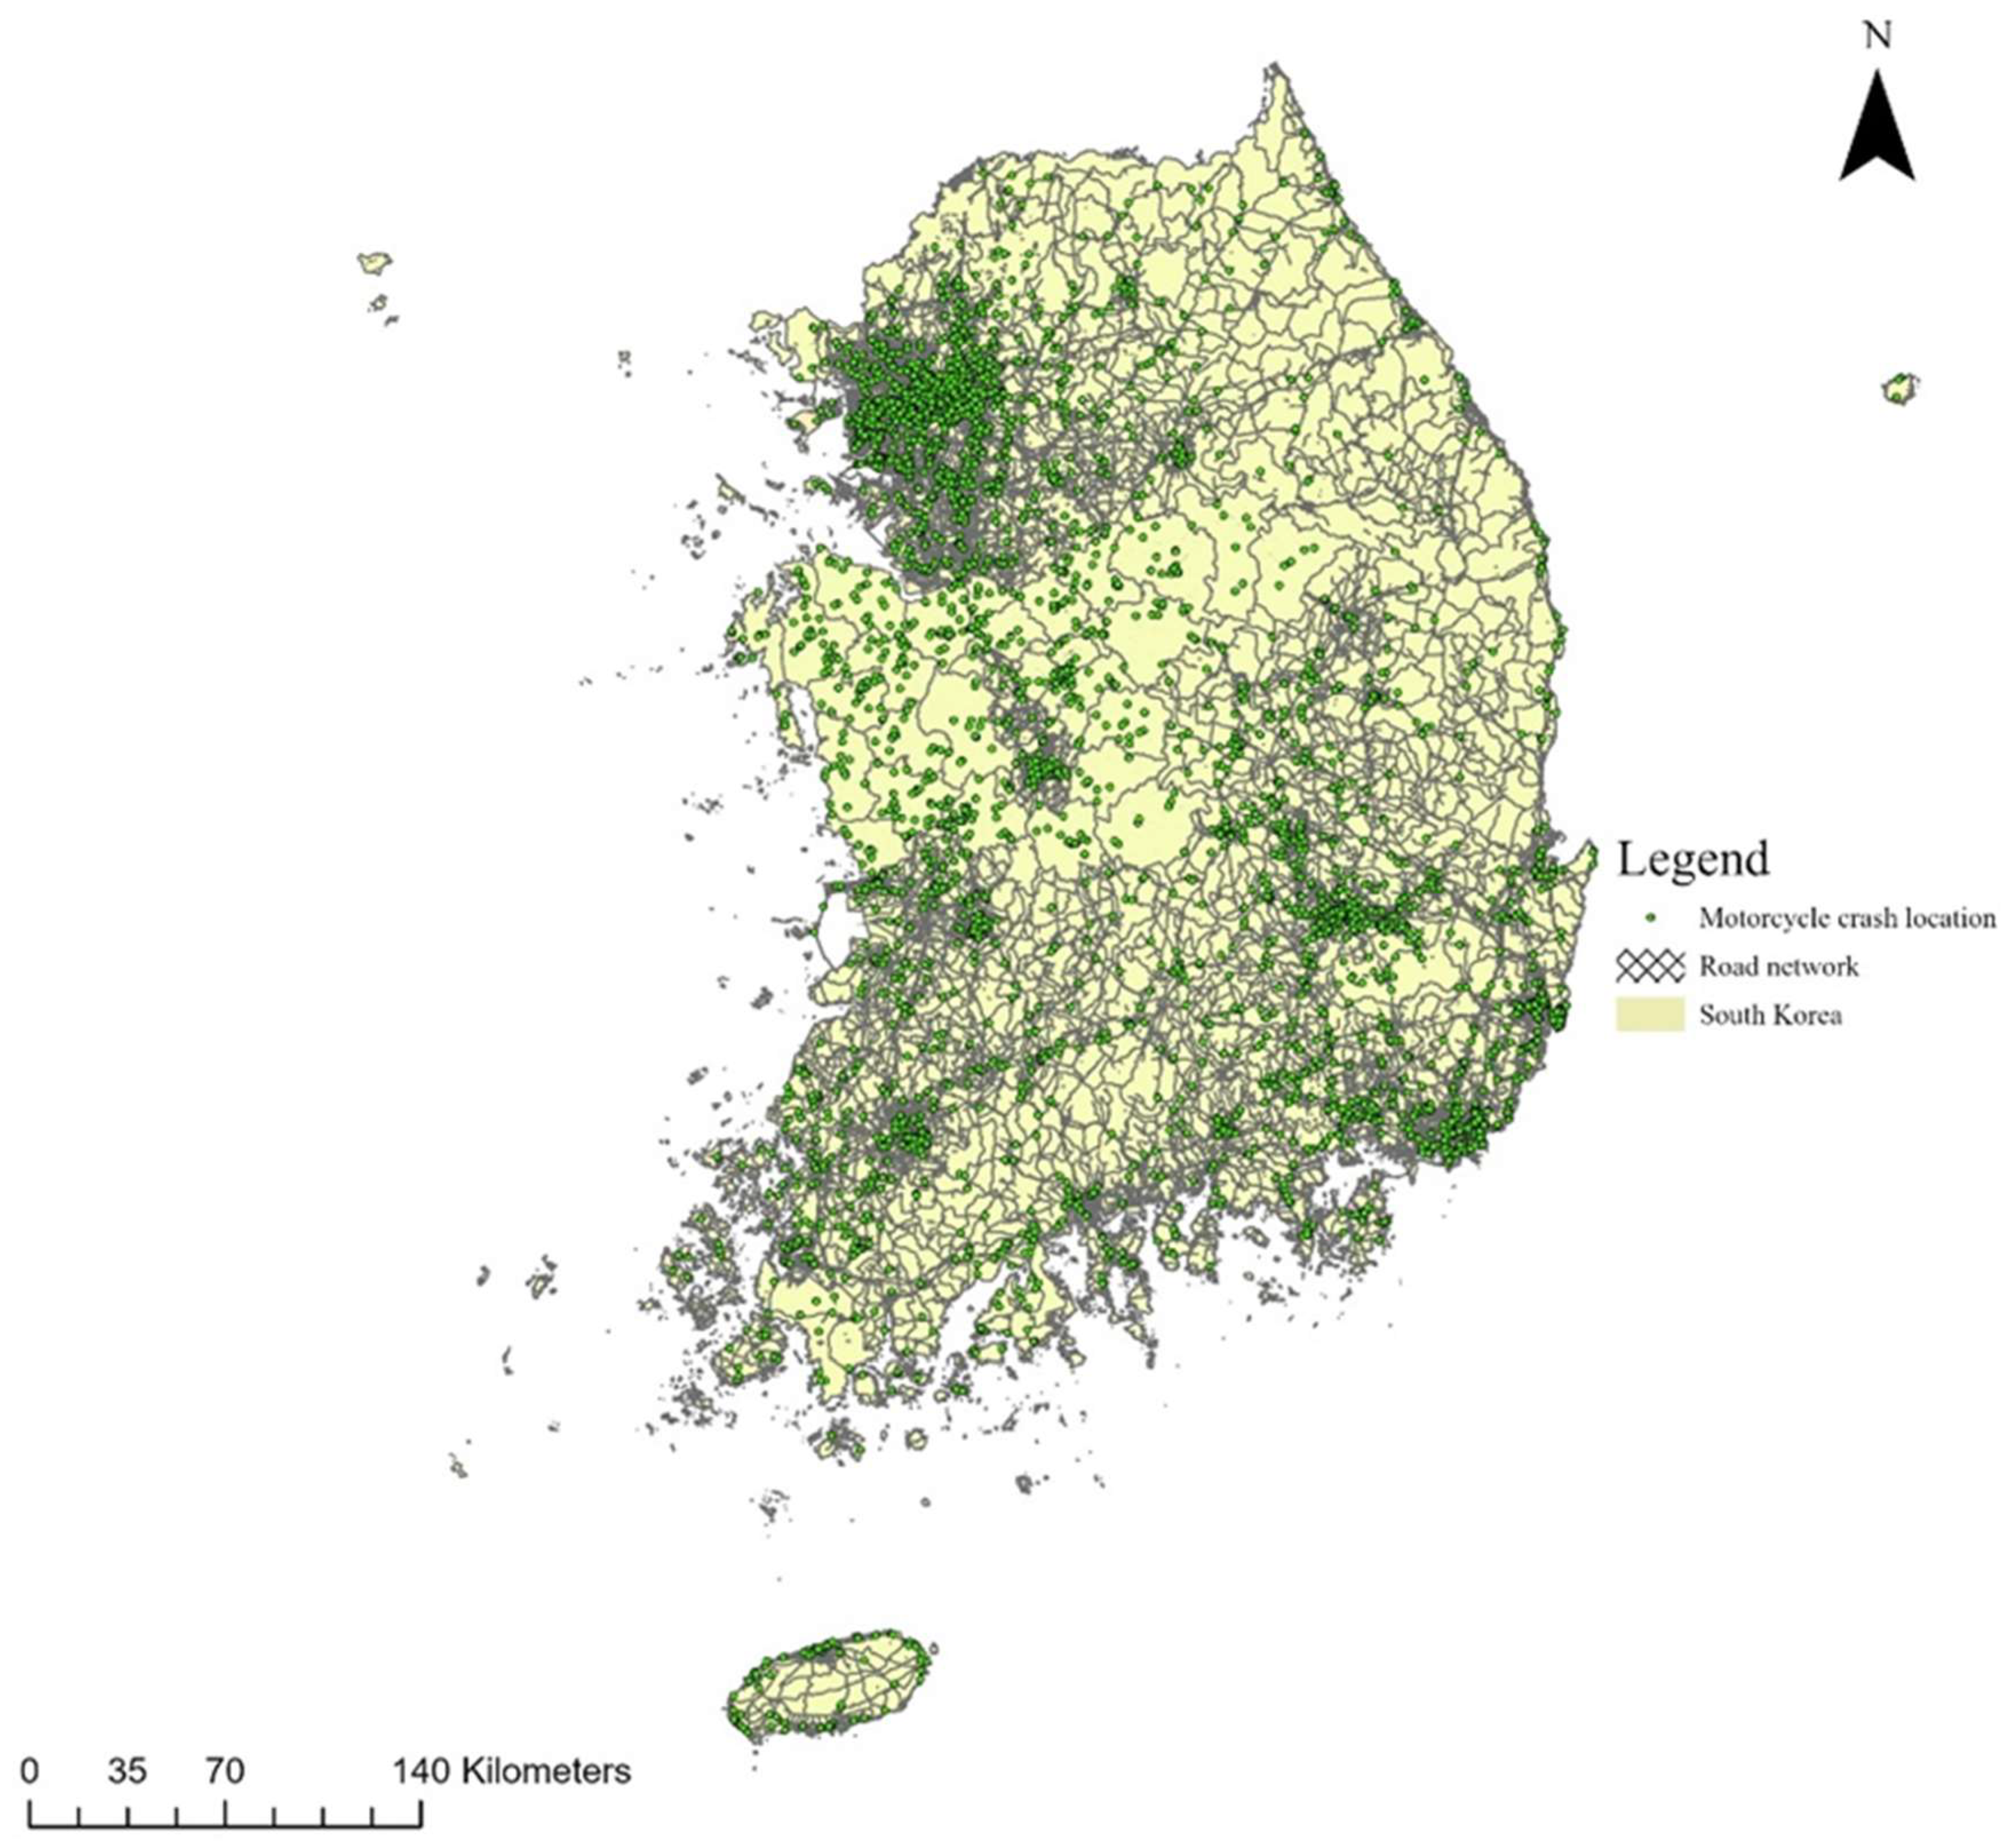
2.2. Case Study Area and Data Description
2.2.1. Magnitude of the PTW Safety Problem in South Korea
2.2.2. Descriptive Statistics
2.3. Methodology
2.3.1. Spatio-Temporal Pattern Mining
2.3.2. Association Rule Mining
3. Results and Discussions
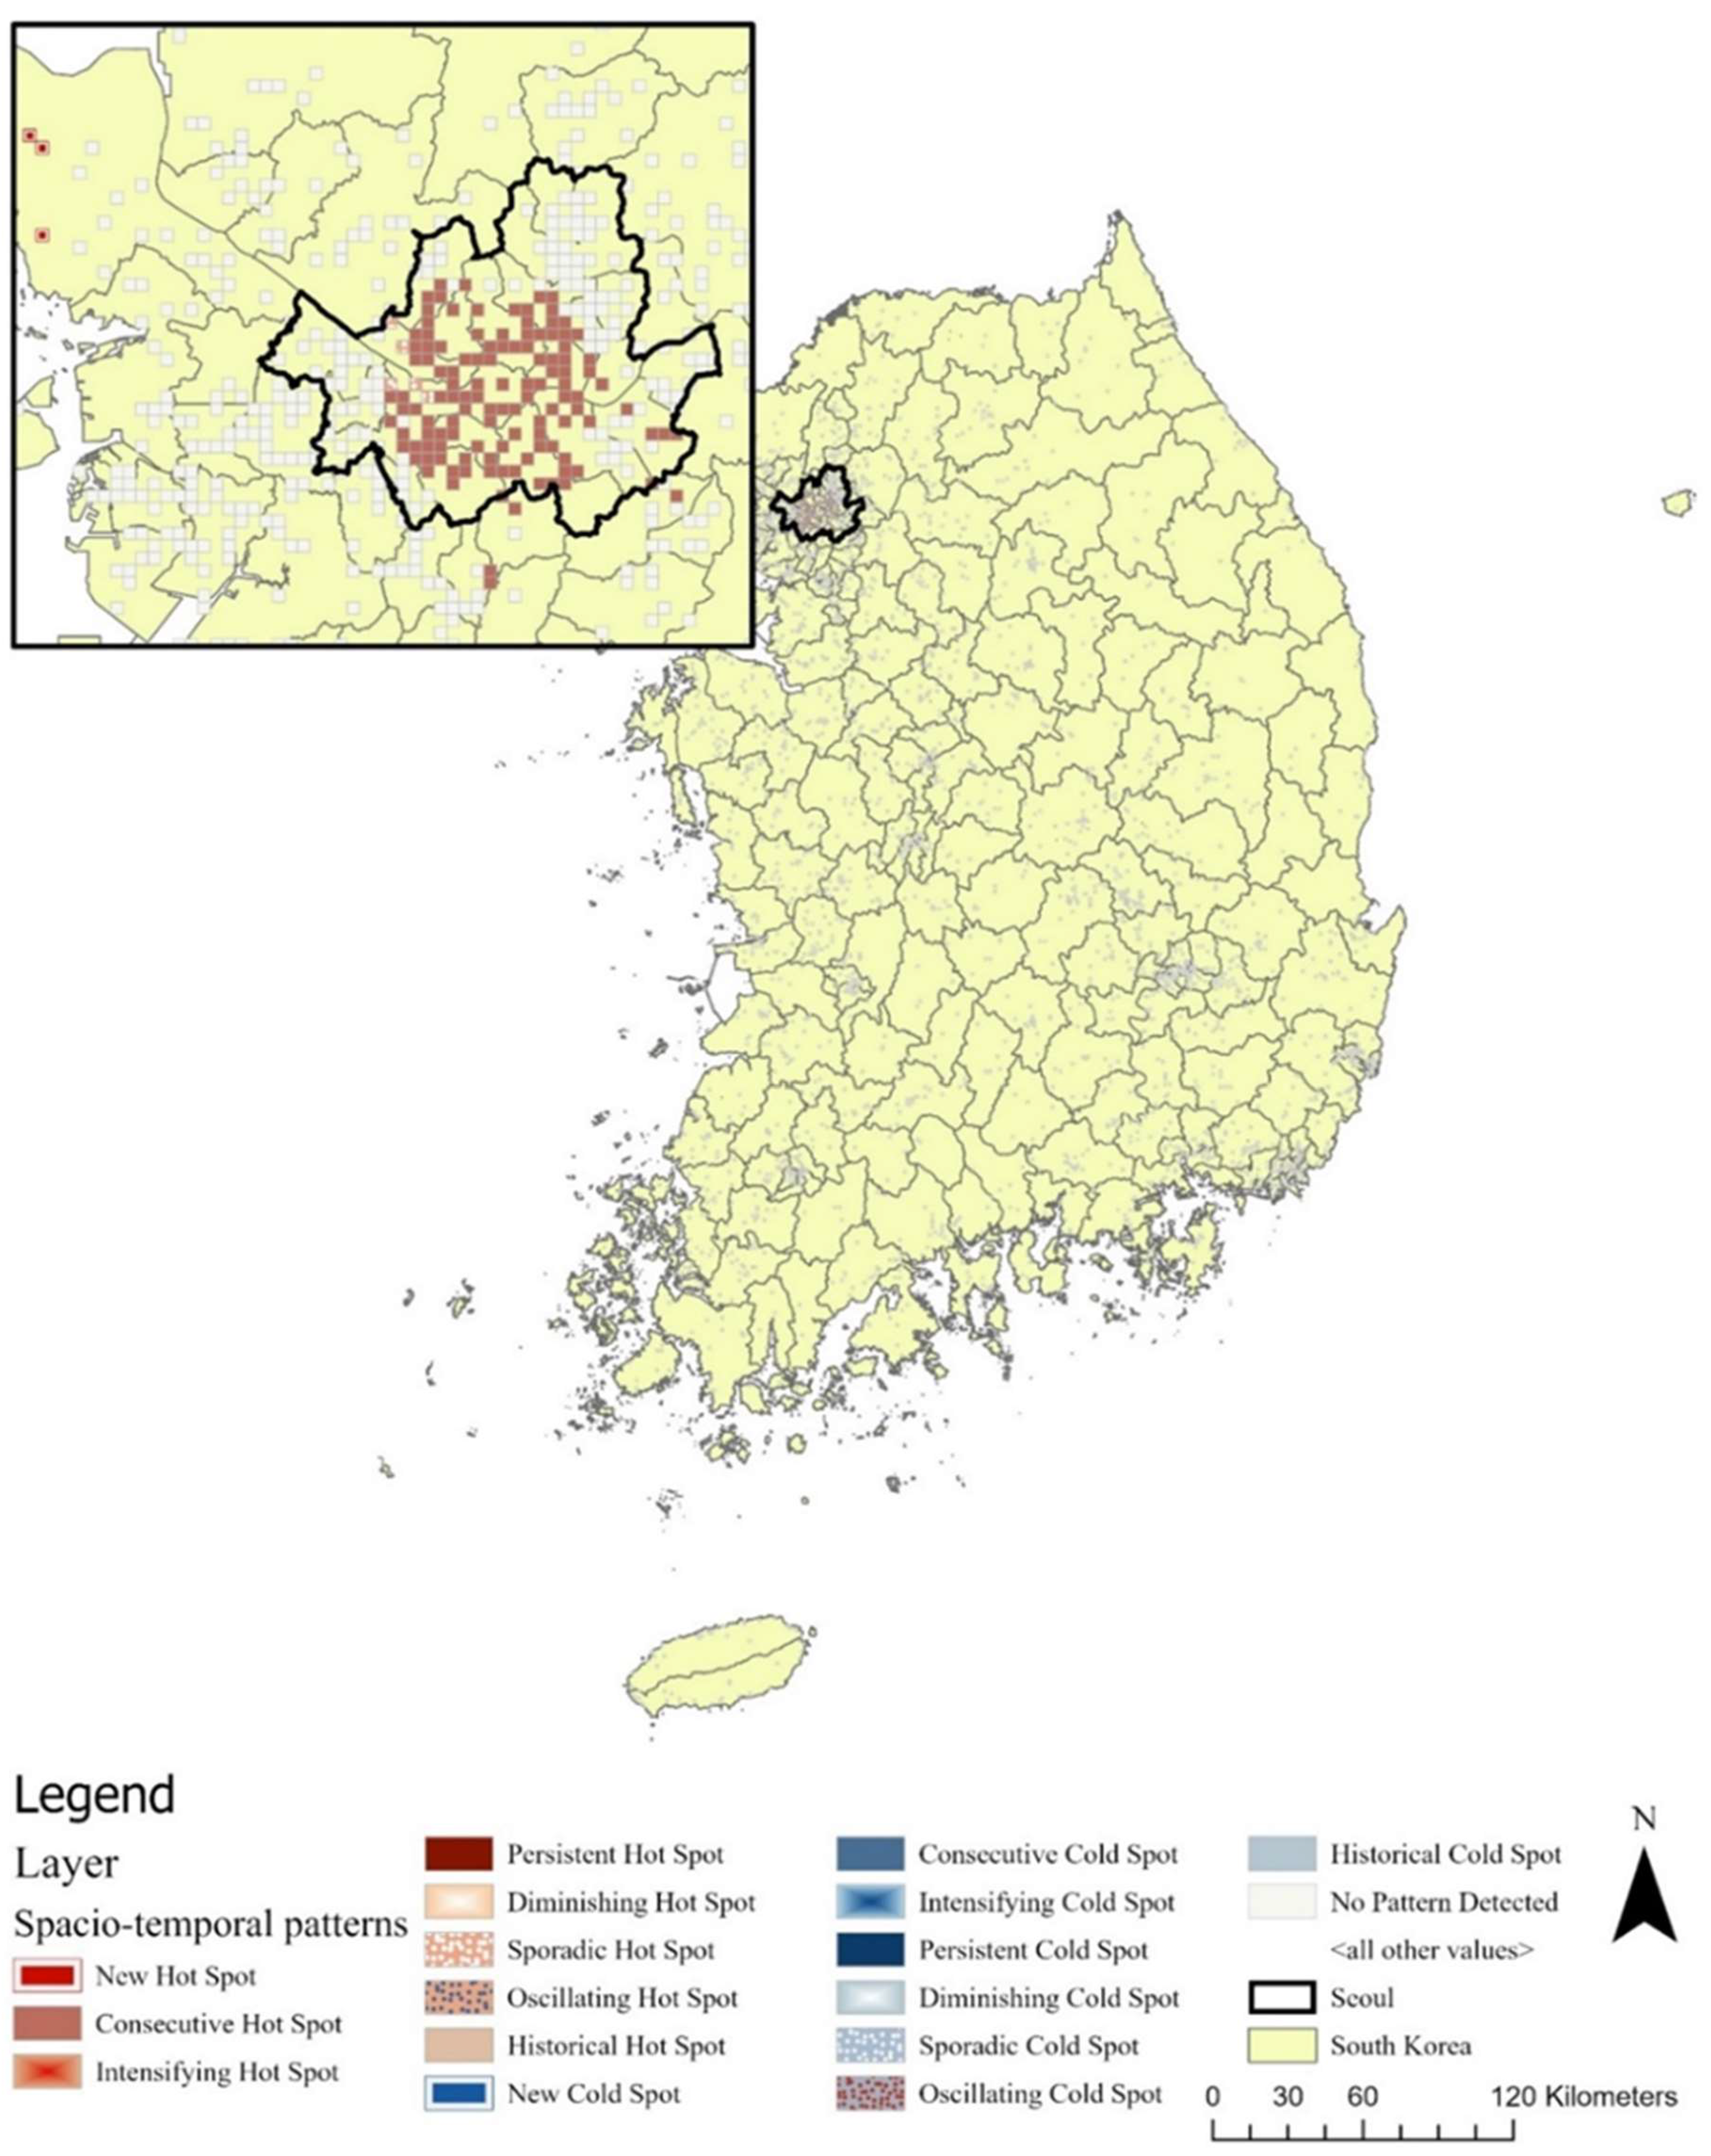
3.1. Spatio-Temporal Pattern Mining
3.1.1. Interesting Rules for All Fatal PTW Crashes at Critical Locations
3.1.2. Interesting Rules for Fatal PTW Crashes Based on PTW Rider’s Fault Status
4. Conclusions
4.1. Key Findings
- Identifying different types of fatal PTW crash hotspots in South Korea based on spatio-temporal information, together with their evolution patterns over time;
- Exploring the chains of contributory factors of fatal PTW crashes at the crash hotspots;
- Discovering and comparing the chains of contributory factors influencing fatal PTW crashes considering the fault status of the PTW rider.
4.2. Proposed Countermeasures
- The finding that most fatal PTW crash locations in Seoul have begun getting more popular in recent years and the significant positive trends identified highlight that the safety of PTW riders is gradually worsening. Therefore, there is a need to intensify rider/driver education and enforcement to help check traffic violations such as speeding, signal violations, and centerline violations to help reduce the fatality of these crashes. Education of road users could be undertaken through safety campaigns, and enforcement could be targeted at both the road users and the business owners who use PTWs for business;
- Excessive speeds by both riders and drivers could be managed by the application of traffic calming designs, such as introducing mini traffic circle configurations at intersections, speed humps, roadway diets, and speed limit reductions, where necessary, on rural and urban roads. In addition, other control measures which self-enforce speed reductions, such as horizontal and vertical deflections, could be explored to help reduce the approach speed of vehicles;
- While signal violations could be checked by deploying adequate red-light cameras and enforcement measures, it would be worthwhile to consider making traffic signals more visible for all road users. This can be achieved by carefully considering their design, placement, and luminance when choosing traffic signals. Clearly visible roadway signs should be placed at vantage points to remind riders of impending intersections and speed limits. In addition, adequately putting in measures to control the speeds of vehicles could reduce their chance of running red lights;
- Centerline violations at crash hotspots could be controlled by using countermeasures such as centerline rumble strips to alert drivers who may unintentionally drive across the centerlines. In addition, illuminated in-ground light-emitting diodes (LEDs) and retroreflective lane markings could be used in marking out the centerlines to help provide visual guidance and increase drivers’ awareness of road separations;
- The finding that fatal rider at-fault PTW crashes at hotspot locations is strongly associated with nighttime highlights that these riders may be fatigued, sleepy, or under the influence of drugs due to the need to overwork and achieve daily targets. Again, this problem could be tackled by educating riders on the need to rest when tired. While rumble strips and better lighting at night could be used to check crashes associated with drowsiness and low visibility, nighttime riding restrictions at hotspots could be meted out to PTW riders, particularly delivery company riders who are found culpable to ensure that riders obey traffic regulations even at night. In addition, there is a need to encourage the wearing of luminous vests to increase the conspicuity of riders. Similar interventions could be explored in checking PTW rider at-fault crashes during summer;
- Other vehicle drivers have been identified to have strong associations with traffic infringements such as reckless driving, signal violations, and safety distance violations, leading to PTW rider not-at-fault crashes. These violations are likely due to driver distraction and aggressive driving. To control rider not-at-fault crashes, vehicle drivers need to be trained on the need to stay focused and be on the lookout for PTW riders, especially when making lane changes. Additionally, there is a need to heighten enforcement such that repeat offenders of traffic infringements are subjected to harsher punishments to deter others;
- In the long term, interventions such as providing exclusive PTW lanes at crash hotspots and creating policies for anti-lock braking systems should be considered.
4.3. Study Limitations and Future Study Areas
Funding
Institutional Review Board Statement
Informed Consent Statement
Data Availability Statement
Conflicts of Interest
References
- WHO (World Health Organization). Death on the Roads. Available online: https://extranet.who.int/roadsafety/death-on-the-roads//#country_or_area/KOR (accessed on 26 February 2023).
- Al-Ahmadi, H.M.; Jamal, A.; Ahmed, T.; Rahman, M.T.; Reza, I.; Farooq, D. Calibrating the Highway Safety Manual Predictive Models for Multilane Rural Highway Segments in Saudi Arabia. Arab. J. Sci. Eng. 2021, 46, 11471–11485. [Google Scholar] [CrossRef]
- WHO. Powered Two- and Three-Wheeler Safety: A Road Safety Manual for Decision-Makers and Practitioners; WHO: Geneva, Switzerland, 2017. [Google Scholar]
- WHO. Global Status Report on Road Safety 2018; WHO: Geneva, Switzerland, 2018. [Google Scholar]
- NHTSA. Traffic Safety Facts 2005: Motorcycles; National Highway Traffic Safety Administration: Washington, DC, USA, 2007.
- Johnston, P.; Brooks, C.; Savage, H. Fatal and Serious Road Crashes Involving Motorcyclists; Department of Infrastructure, Transport, Regional Development and Local Government: Canberra, Austrilia, 2008.
- OECD/ITF. Improving Safety for Motorcycle, Scooter and Moped Riders; ITF Research Reports; OECD: Paris, France, 2015; ISBN 9789282107935. [Google Scholar]
- Tiwari, G. Safety challenges of powered two-wheelers. Int. J. Inj. Control Saf. Promot. 2015, 22, 281–283. [Google Scholar] [CrossRef] [PubMed]
- Aidoo, E.N.; Amoh-Gyimah, R. Modelling the risk factors for injury severity in motorcycle users in Ghana. J. Public Health 2020, 28, 199–209. [Google Scholar] [CrossRef]
- Murphy, P.; Morris, A. Quantifying accident risk and severity due to speed from the reaction point to the critical conflict in fatal motorcycle accidents. Accid. Anal. Prev. 2020, 141, 105548. [Google Scholar] [CrossRef]
- Talbot, R.; Brown, L.; Morris, A. Why are powered two wheeler riders still fatally injured in road junction crashes?—A causation analysis. J. Saf. Res. 2020, 75, 196–204. [Google Scholar] [CrossRef] [PubMed]
- Theofilatos, A.; Yannis, G.; Antoniou, C.; Chaziris, A.; Sermpis, D. Time series and support vector machines to predict powered-two-wheeler accident risk and accident type propensity: A combined approach. J. Transp. Saf. Secur. 2018, 10, 471–490. [Google Scholar] [CrossRef]
- De Rome, L.; Senserrick, T. Factors Associated with Motorcycle Crashes in New South Wales, Australia, 2004 to 2008. Transp. Res. Rec. J. Transp. Res. Board 2011, 2265, 54–61. [Google Scholar] [CrossRef]
- Abdul Manan, M.M.; Várhelyi, A.; Çelik, A.K.; Hashim, H.H. Road characteristics and environment factors associated with motorcycle fatal crashes in Malaysia. IATSS Res. 2018, 42, 207–220. [Google Scholar] [CrossRef]
- Montella, A.; de Oña, R.; Mauriello, F.; Rella Riccardi, M.; Silvestro, G. A data mining approach to investigate patterns of powered two-wheeler crashes in Spain. Accid. Anal. Prev. 2020, 134, 105251. [Google Scholar] [CrossRef]
- Al Hamami, M.; Matisziw, T.C. Measuring the spatiotemporal evolution of accident hot spots. Accid. Anal. Prev. 2021, 157, 106133. [Google Scholar] [CrossRef]
- Haque, M.M.; Chin, H.C.; Huang, H. Modeling fault among motorcyclists involved in crashes. Accid. Anal. Prev. 2009, 41, 327–335. [Google Scholar] [CrossRef] [PubMed]
- Bjørnskau, T.; Nævestad, T.-O.; Akhtar, J. Traffic safety among motorcyclists in Norway: A study of subgroups and risk factors. Accid. Anal. Prev. 2012, 49, 50–57. [Google Scholar] [CrossRef] [PubMed]
- Bjørnskau, T. Road Traffic Exposure and Risk among High-Risk Groups in Norway; Insitute of Transport Economics Norwegian Centre for Transport Reserch: Oslo, Norway, 2009. [Google Scholar]
- Elvik, R. Why some road safety problems are more difficult to solve than others. Accid. Anal. Prev. 2010, 42, 1089–1096. [Google Scholar] [CrossRef]
- Liu, C.C.; Hosking, S.G.; Lenné, M.G. Hazard perception abilities of experienced and novice motorcyclists: An interactive simulator experiment. Transp. Res. Part F Traffic Psychol. Behav. 2009, 12, 325–334. [Google Scholar] [CrossRef]
- Allen, T.; Newstead, S.; Lenné, M.G.; McClure, R.; Hillard, P.; Symmons, M.; Day, L. Contributing factors to motorcycle injury crashes in Victoria, Australia. Transp. Res. Part F Traffic Psychol. Behav. 2017, 45, 157–168. [Google Scholar] [CrossRef]
- Jimenez, A.; Bocarejo, J.P.; Zarama, R.; Yerpez, J. A case study analysis to examine motorcycle crashes in Bogota, Colombia. J. Saf. Res. 2015, 52, 29–38. [Google Scholar] [CrossRef] [PubMed]
- Simone, A.; Vignali, V.; Marinelli, M. Intersections design and powered two wheelers interaction: Experimental investigation of an accident prediction model. In Proceedings of the 4th International SIIV Congress, Palermo, Italy, 12–14 September 2007. [Google Scholar]
- Yasin, Y.J.; Grivna, M.; Abu-Zidan, F.M. Motorized 2–3 wheelers death rates over a decade: A global study. World J. Emerg. Surg. 2022, 17, 7. [Google Scholar] [CrossRef]
- Ijaz, M.; Liu, L.; Almarhabi, Y.; Jamal, A.; Usman, S.M.; Zahid, M. Temporal Instability of Factors Affecting Injury Severity in Helmet-Wearing and Non-Helmet-Wearing Motorcycle Crashes: A Random Parameter Approach with Heterogeneity in Means and Variances. Int. J. Environ. Res. Public Health 2022, 19, 10526. [Google Scholar] [CrossRef]
- Ijaz, M.; Lan, L.; Usman, S.M.; Zahid, M.; Jamal, A. Investigation of factors influencing motorcyclist injury severity using random parameters logit model with heterogeneity in means and variances. Int. J. Crashworthiness 2021, 27, 1412–1422. [Google Scholar] [CrossRef]
- Santos, K.; Dias, J.P.; Amado, C.; Sousa, J.; Francisco, P. Risk factors associated with the increase of injury severity of powered two wheelers road accidents victims in Portugal. Traffic Inj. Prev. 2021, 22, 646–650. [Google Scholar] [CrossRef]
- Ijaz, M.; Lan, L.; Zahid, M.; Jamal, A. A comparative study of machine learning classifiers for injury severity prediction of crashes involving three-wheeled motorized rickshaw. Accid. Anal. Prev. 2021, 154, 106094. [Google Scholar] [CrossRef] [PubMed]
- Abdelwahab, H.T.; Abdel-Aty, M.A. Development of Artificial Neural Network Models to Predict Driver Injury Severity in Traffic Accidents at Signalized Intersections. Transp. Res. Rec. J. Transp. Res. Board 2001, 1746, 6–13. [Google Scholar] [CrossRef]
- Penmetsa, P.; Pulugurtha, S.S. Risk drivers pose to themselves and other drivers by violating traffic rules. Traffic Inj. Prev. 2017, 18, 63–69. [Google Scholar] [CrossRef] [PubMed]
- Anvari, M.B.; Tavakoli Kashani, A.; Rabieyan, R. Identifying the Most Important Factors in the At-Fault Probability of Motorcyclists by Data Mining, Based on Classification Tree Models. Int. J. Civ. Eng. 2017, 15, 653–662. [Google Scholar] [CrossRef]
- Duddu, V.R.; Penmetsa, P.; Pulugurtha, S.S. Modeling and comparing injury severity of at-fault and not at-fault drivers in crashes. Accid. Anal. Prev. 2018, 120, 55–63. [Google Scholar] [CrossRef]
- Rezapour, M.; Mehrara Molan, A.; Ksaibati, K. Analyzing injury severity of motorcycle at-fault crashes using machine learning techniques, decision tree and logistic regression models. Int. J. Transp. Sci. Technol. 2020, 9, 89–99. [Google Scholar] [CrossRef]
- Lin, L.; Shi, F.; Li, W. Assessing inequality, irregularity, and severity regarding road traffic safety during COVID-19. Sci. Rep. 2021, 11, 13147. [Google Scholar] [CrossRef]
- Bao, J.; Yang, Z.; Zeng, W.; Shi, X. Exploring the spatial impacts of human activities on urban traffic crashes using multi-source big data. J. Transp. Geogr. 2021, 94, 103118. [Google Scholar] [CrossRef]
- Song, L.; Fan, W.; Li, Y. Time-of-day variations and the temporal instability of multi-vehicle crash injury severities under the influence of alcohol or drugs after the Great Recession. Anal. Methods Accid. Res. 2021, 32, 100183. [Google Scholar] [CrossRef]
- Jiang, F.; Yuen, K.K.R.; Lee, E.W.M. Analysis of motorcycle accidents using association rule mining-based framework with parameter optimization and GIS technology. J. Saf. Res. 2020, 75, 292–309. [Google Scholar] [CrossRef]
- Lee, Y.; Kim, D.-S. Internal Migration in South Korea. In Internal Migration in the Countries of Asia; Springer International Publishing: Cham, Switzerland, 2020; pp. 93–111. [Google Scholar]
- Lee, S.; Noland, R.B. Bikeshare trips in Seoul, South Korea. Case Stud. Transp. Policy 2021, 9, 743–755. [Google Scholar] [CrossRef]
- OECD. OECD Stat. Available online: https://stats.oecd.org/index.aspx?queryid=73639 (accessed on 21 June 2021).
- Chung, Y.; Song, T.-J.; Yoon, B.-J. Injury severity in delivery-motorcycle to vehicle crashes in the Seoul metropolitan area. Accid. Anal. Prev. 2014, 62, 79–86. [Google Scholar] [CrossRef] [PubMed]
- WHO (World Health Organization). Death on the Roads. Available online: https://extranet.who.int/roadsafety/death-on-the-roads/#country_or_area/GHA (accessed on 13 May 2022).
- Kim, S.; Chung, Y. Injury Severity Analysis of Cyclists in Two Wheeler to Taxi Crashes: An Application of Vehicle Black Box Data in Incheon, Korea. J. Korean Soc. Civ. Eng. 2018, 38, 917–923. [Google Scholar]
- Park, H.-C.; Joo, Y.-J.; Kho, S.-Y.; Kim, D.-K.; Park, B.-J. Injury Severity of Bus–Pedestrian Crashes in South Korea Considering the Effects of Regional and Company Factors. Sustainability 2019, 11, 3169. [Google Scholar] [CrossRef]
- Mann, H.B. Nonparametric tests against trend. Econometrica 1945, 13, 245–259. [Google Scholar] [CrossRef]
- Kendall, M.G.; Gibbons, J.D. Rank Correlation Methods, 5th ed.; Oxford University Press: London, UK, 1990. [Google Scholar]
- Pande, A.; Abdel-Aty, M. Market basket analysis of crash data from large jurisdictions and its potential as a decision support tool. Saf. Sci. 2009, 47, 145–154. [Google Scholar] [CrossRef]
- Hong, J.; Tamakloe, R.; Park, D. Application of association rules mining algorithm for hazardous materials transportation crashes on expressway. Accid. Anal. Prev. 2020, 142, 105497. [Google Scholar] [CrossRef]
- Samerei, S.A.; Aghabayk, K.; Mohammadi, A.; Shiwakoti, N. Data mining approach to model bus crash severity in Australia. J. Saf. Res. 2021, 76, 73–82. [Google Scholar] [CrossRef]
- Weng, J.; Zhu, J.-Z.; Yan, X.; Liu, Z. Investigation of work zone crash casualty patterns using association rules. Accid. Anal. Prev. 2016, 92, 43–52. [Google Scholar] [CrossRef]
- R Core Team. R: A Language and Environment for Statistical Computing; R Foundation for Statistical Computing: Vienna, Austria, 2019; Available online: https://www.R-project.org/ (accessed on 4 May 2020).
- Kwak, Y.-A.; Cho, Y.-S. Strategy of Food Retailer and Delivery Rider’s Accident in South Korea. J. Distrib. Sci. 2020, 18, 49–60. [Google Scholar]
- Tamakloe, R.; Park, D. Factors influencing fatal vehicle-involved crash consequence metrics at spatio-temporal hotspots in South Korea: Application of GIS and machine learning techniques. Int. J. Urban Sci. 2022, 1–35. [Google Scholar] [CrossRef]
- Hong, J.; Park, J.; Lee, G.; Park, D. Endogenous commercial driver’s traffic violations and freight truck-involved crashes on mainlines of expressway. Accid. Anal. Prev. 2019, 131, 327–335. [Google Scholar] [CrossRef] [PubMed]
- Kodaka, K.; Otabe, M.; Urai, Y.; Koike, H. Rear-End Collision Velocity Reduction System. Available online: http://www.jstor.org/stable/44745417 (accessed on 28 June 2021).
- Haque, M.M.; Chin, H.C. Right-Angle Crash Vulnerability of Motorcycles at Signalized Intersections. Transp. Res. Rec. J. Transp. Res. Board 2010, 2194, 82–90. [Google Scholar] [CrossRef]
- Byun, J.H.; Jeong, B.Y.; Park, M.H. Characteristics of Motorcycle Crashes of Food Delivery Workers. J. Ergon. Soc. Korea 2017, 36, 157–168. [Google Scholar]
- Perez-Fuster, P.; Rodrigo, M.F.; Ballestar, M.L.; Sanmartin, J. Modeling offenses among motorcyclists involved in crashes in Spain. Accid. Anal. Prev. 2013, 56, 95–102. [Google Scholar] [CrossRef]
- Park, J.S.; Jung, Y.I.; Kim, Y.H. Characteristics and Influencing Factors of Red Light Running (RLR) Crashes. J. Korean Soc. Transp. 2014, 32, 198–206. [Google Scholar] [CrossRef]
- Campbell, B.N.; Smith, J.D.; Najm, W. Analysis of Fatal Crashes Due to Signal and Stop Sign Violations; U.S. Department of Transportation: Washington, DC, USA, 2004.


| Study Objective | Location | Temporal Scope | Methods Adopted | Key Findings |
|---|---|---|---|---|
| Examining fatal and severe life-threatening accidents at intersections involving a powered two wheeler and another vehicle [11]. | Six countries (UK, The Netherlands, France, Poland, Italy, and Greece) | 2015 to 2016 (n = 92) | Causation analysis | Most vehicles do not yield to the PTW, and causal chains indicate that “looked but failed to see” is still a problem in this type of collision. |
| Recognizing segments of motorcycle riders at a notably elevated risk of accidents and pinpointing the contributing risk factors involved [18]. | Norway | 2005 to 2008 (n = 3356) | Survey-based research | The majority of deadly incidents involving sports motorcycles are due to speeding. In Norway, young age, limited experience, hazardous actions, and an “unsafe” mentality appear to be particularly powerful risk elements for motorcyclists. |
| Analyzing the factors contributing to motorcycle crashes using a safe systems approach by utilizing the case-series data collected from a recent study that employed a case–control methodology [22]. | Victoria, Australia | January 2012 and August 2014 (n = 235) | Survey-based research | Although PTW crashes, resulting in injury, involve a complex array of factors, several noteworthy connections exist between the primary contributing factor (rider or other road users) and secondary factors such as rider age, traffic density, speed, and road design issues. |
| To gain a more profound comprehension of how these incidents happen [23]. | Bogota, Colombia | 2009 (n = 400) | Case study analysis | Various factors, including the absence of clear road markings, a complex intersection, a wide road, and an inexperienced motorcyclist, combine to contribute to the incidence of accidents of this nature. |
| Validating a previous model to consider the geometric features of intersections when predicting the safety of motorcyclists [24]. | Italy | 2001 to 2006 | Experimental investigation | The speed at which vehicles approach an intersection and how the intersection is designed are important factors that can help explain why motorcycle accidents occur at junctions. |
| Identifying the main risk factors linked with the severity of injuries sustained by motorcyclists in Rawalpindi, Pakistan [27]. | Rawalpindi, Pakistan | 2017 to 2019 | Random parameters logit model with heterogeneity in means and variances | The likelihood of severe and deadly injuries is higher for crashes that happen on weekdays, involve riders over the age of 50, involve a collision between a motorcycle and a passenger car or a heavy vehicle, have a female passenger on the back of the motorcycle, and result from exceeding the speed limit. |
| Identifying the factors that increase the severity of injuries sustained by powered two-wheeler (PTW) riders in road accidents in Portugal [28]. | Portugal | 2010 to 2015 (n = 37,769) | Ordered logistic regression | Several factors can lead to more severe injuries, including riding a motorcycle in the PTW category, having rest days, driving on clean and dry roads between 20 h and 5 h and 59 min, traveling in rural areas with bent roads and national roads, being a male rider without a helmet, having a blood alcohol content between 0.5 g/L and 0.8 g/L, and being involved in an accident with a truck or other vehicles where the driver is injured. |
| To determine the primary elements responsible for the error of bikers engaged in accidents [32]. | Iran | 2009 to 2012 (n = 90,418) | Classification and regression tree algorithm (CART) | The type of collision is the primary factor determining the probability of motorcyclists being at fault. Based on this information, the chances of a rear-end collision are the highest, while the chances of a side collision are the lowest. |
| To analyze and contrast how certain factors impact the degree of harm suffered by drivers involved in accidents, regardless of whether they were responsible for the incident or not [33]. | North Carolina | 2009 to 2013 (n = 349,454) | Proportional odds model | The impact of road characteristics, weather conditions, and geometric characteristics on crash injury severity was similar for both at-fault and not-at-fault drivers. However, the age of the driver, physical condition, gender, vehicle type, and the number and type of traffic rule violations were identified as significant factors that affect the injury severity of not-at-fault drivers compared to at-fault drivers involved in the crash. |
| Forecasting the extent of injury in a motorcycle accident caused by the rider at fault [34]. | Wyoming | 2007 to 2016 (n = 1210) | Binary logistic regression and classification trees (CT) | A number of factors that were recognized as similar by both approaches include speed limit displayed on signs, age, functional class of the highway, and adherence to speed regulations. |
| To examine how factors contributing to the severity of injuries sustained in alcohol/drug-impaired car crashes vary throughout the day and over time, during three specific phases of crash cycles that occurred after the Great Recession [37]. | North Carolina | 2008 to 2017 | Random parameters logit models with heterogeneity in the means and variances | Significant temporal instability of risk factor impacts was identified. |
| To analyze how the COVID-19 pandemic and resulting mobility alterations have affected road traffic safety [35]. | Los Angeles and New York | March, 2020 | Change-point detection and difference-in-differences analysis | The areas where accidents occur have frequently changed in terms of both location and time. |
| To determine the crucial elements associated with the severity of motorcycle injuries [38]. | Victoria, Australia | 2006 to 2017 (n = 24,680) | Association rule mining and hotspot analysis | Collisions with trucks, overtaking, overspeeding, collisions late at night/early morning, and collisions with fixed objects are critical factors influencing motorcycle safety in hotspots. |
| Category | Frequency | Percentage | Category | Frequency | Percentage |
|---|---|---|---|---|---|
| Year | Road segment (location) | ||||
| 2012 | 606 | 17.05 | Bridge section | 44 | 1.24 |
| 2013 | 564 | 15.86 | At intersection | 1128 | 31.73 |
| 2014 | 578 | 16.26 | At pedestrian crossing | 43 | 1.21 |
| 2015 | 570 | 16.03 | Near pedestrian crossing | 12 | 0.34 |
| 2016 | 616 | 17.33 | Near intersection | 332 | 9.34 |
| 2017 | 621 | 17.47 | Main road | 1994 | 56.09 |
| Season | Other road segments (tunnel/underpass/overpass) | 2 | 0.06 | ||
| Fall (Sep.–Nov.) | 1028 | 28.92 | At-fault party | ||
| Spring (Mar.–May) | 930 | 26.16 | Agricultural machinery | 8 | 0.23 |
| Summer (Jun.–Aug.) | 1068 | 30.04 | Bicycle | 8 | 0.23 |
| Winter (Dec.–Feb.) | 529 | 14.88 | Passenger car | 651 | 18.31 |
| Time of day | Construction machinery | 39 | 1.10 | ||
| Daytime (6 a.m.–5:59 p.m.) | 2022 | 56.88 | Engine-propelled bicycle | 4 | 0.11 |
| Nighttime (6 p.m.–5:59 a.m.) | 1533 | 43.12 | Freight truck | 328 | 9.23 |
| Day of week | Minibus/van | 99 | 2.78 | ||
| Monday | 486 | 13.67 | Other vehicle type | 20 | 0.56 |
| Tuesday | 483 | 13.59 | Two wheeler | 2393 | 67.31 |
| Wednesday | 476 | 13.39 | Unknown | 5 | 0.14 |
| Thursday | 491 | 13.81 | Not-at-fault party | ||
| Friday | 522 | 14.68 | Agricultural machinery | 8 | 0.23 |
| Saturday | 572 | 16.09 | Bicycle | 13 | 0.37 |
| Sunday | 525 | 14.77 | Passenger car | 597 | 16.79 |
| Type of collision | Construction machinery | 43 | 1.21 | ||
| Angle | 923 | 25.96 | Engine-propelled bicycle | 6 | 0.17 |
| Crossing | 102 | 2.87 | Freight truck | 326 | 9.17 |
| Driving on edge of road | 5 | 0.14 | Minibus/van | 138 | 3.88 |
| Driving on road | 14 | 0.39 | No partner | 1020 | 28.69 |
| Head-on | 351 | 9.87 | Other vehicle type | 17 | 0.48 |
| Other crash types | 726 | 20.42 | Pedestrian | 163 | 4.59 |
| Rear-end | 386 | 10.86 | Two wheeler | 1221 | 34.35 |
| Rollover | 393 | 11.05 | Unknown | 3 | 0.08 |
| Run-off | 108 | 3.04 | Number of vehicles involved | ||
| Sideswipe | 233 | 6.55 | One | 1204 | 33.87 |
| Collision on sidewalk | 7 | 0.20 | Two or more | 2351 | 66.13 |
| Collision at work zone | 307 | 8.64 | Number of casualties | ||
| Violation | One | 2786 | 78.37 | ||
| Violation of intersection method | 192 | 5.40 | Two | 595 | 16.74 |
| Reckless driving/riding | 2040 | 57.38 | Three or more | 174 | 4.89 |
| Other violations | 206 | 5.79 | |||
| Pedestrian protection violation | 19 | 0.53 | |||
| Centerline crossing | 358 | 10.07 | |||
| Safety distance violation | 118 | 3.32 | |||
| Signal violation | 546 | 15.36 | |||
| Over-speeding | 76 | 2.14 | |||
| Emerging Hotspot Classification | Negative Trend | Positive Trend | Total (Significant Trends) | Total (Non-Significant Trends) | Grand Total | ||
|---|---|---|---|---|---|---|---|
| Significant Trends at 90% CL | Non-Significant Trends at 90% CL | Significant at 90% CL | Non-Significant at 90% CL | ||||
| Consecutive Hotspot | 0 | 0 | 181 | 13 | 181 | 13 | 194 |
| New Hotspot | 0 | 1 | 1 | 3 | 1 | 4 | 5 |
| No Pattern Detected | 589 | 1626 | 773 | 360 | 1362 | 1986 | 3348 |
| Sporadic Hotspot | 0 | 0 | 0 | 8 | 0 | 8 | 8 |
| Grand Total | 589 | 1627 | 955 | 384 | 1544 | 2011 | 3555 |
| No. | Rules | S% | C% | Lift | LIC |
|---|---|---|---|---|---|
| 1 | {At-fault party: freight truck} => {Day of week: Monday} | 1.64 | 60.00 | 3.92 | - |
| 2 | {At-fault party: freight truck, Violation: safety distance violation} => {Day of week: Monday} | 1.09 | 100.00 | 6.54 | 1.67 |
| 3 | {Road segment: near intersection} => {Violation: centerline crossing} | 3.83 | 41.18 | 3.01 | - |
| 4 | {Road segment: near intersection, Type of collision: head-on} => {Violation: centerline crossing} | 1.09 | 66.67 | 4.88 | 1.62 |
| 5 | {Road segment: near intersection, Year: 2012} => {Violation: centerline crossing} | 1.64 | 100.00 | 7.32 | 2.43 |
| 6 | {Road segment: near pedestrian crossing} => {Type of collision: angle} | 1.64 | 75.00 | 2.98 | - |
| 7 | {Road segment: near pedestrian crossing, Violation: centerline crossing} => {Type of collision: angle} | 1.09 | 100.00 | 3.98 | 1.33 |
| 8 | {Not-at-fault party: minibus/van} => {Type of collision: angle} | 3.28 | 66.67 | 2.65 | - |
| 9 | {Not-at-fault party: minibus/van, Violation: signal violation} => {Type of collision: angle} | 1.64 | 100.00 | 3.98 | 1.50 |
| 10 | {Road segment: at pedestrian crossing} => {Violation: signal violation} | 1.09 | 50.00 | 2.41 | - |
| 11 | {Road segment: at pedestrian crossing, Year: 2013} => {Violation: signal violation} | 1.09 | 100.00 | 4.82 | 2.00 |
| 12 | {Road segment: bridge section} => {Type of collision: other crash type} | 2.19 | 66.67 | 2.39 | - |
| 13 | {Road segment: bridge section, Year: 2017} => {Type of collision: other crash type} | 1.09 | 100.00 | 3.59 | 1.50 |
| 14 | {Violation: over-speeding} => {Season: summer} | 2.73 | 71.43 | 2.33 | - |
| 15 | {Violation: over-speeding, Year: 2013} => {Season: summer} | 1.09 | 100.00 | 3.27 | 1.40 |
| 16 | {At-fault party: freight truck} => {Not-at-fault party: PTW} | 2.19 | 80.00 | 2.32 | - |
| 17 | {At-fault party: freight truck, Violation: safety distance violation} => {Not-at-fault party: PTW} | 1.09 | 100.00 | 2.90 | 1.25 |
| 18 | {Violation: centerline crossing} => {Not-at-fault party: passenger car} | 5.46 | 40.00 | 2.15 | - |
| 19 | {Violation: centerline crossing, Year: 2012} => {Not-at-fault party: passenger car} | 2.73 | 83.33 | 4.49 | 2.08 |
| 20 | {Violation: centerline crossing, Year: 2014} => {Not-at-fault party: passenger car} | 1.09 | 50.00 | 2.69 | 1.25 |
| 21 | {Type of collision: rear-end} => {At-fault party: passenger car} | 3.83 | 46.67 | 2.14 | - |
| 22 | {Type of collision: rear-end, Violation: over-speeding} => {At-fault party: passenger car} | 1.09 | 100.00 | 4.58 | 2.14 |
| 23 | {Type of collision: rear-end, Year: 2013} => {At-fault party: passenger car} | 2.19 | 66.67 | 3.05 | 1.43 |
| 24 | {Violation: signal violation} => {Type of collision: angle} | 10.38 | 50.00 | 1.99 | - |
| 25 | {Violation: signal violation, Year: 2012} => {Type of collision: angle} | 2.19 | 100.00 | 3.98 | 2.00 |
| 26 | {Violation: signal violation, Year: 2015} => {Type of collision: angle} | 2.19 | 80.00 | 3.18 | 1.60 |
| 27 | {Type of collision: angle} => {Road segment: at intersection} | 13.66 | 54.35 | 1.95 | - |
| 28 | {Type of collision: angle, Violation: signal violation} => {Road segment: at intersection} | 9.84 | 94.74 | 3.40 | 1.74 |
| No. | Rules | S% | C% | Lift | LIC |
|---|---|---|---|---|---|
| 1 | {Day of week: Saturday} => {At-fault party: PTW} | 13.11 | 82.76 | 1.18 | - |
| 2 | {Day of week: Saturday, Road segment: other road segments} => {At-fault party: PTW} | 8.20 | 93.75 | 1.34 | 1.13 |
| 3 | {Day of week: Saturday, Violation: reckless driving/riding} => {At-fault party: PTW} | 9.29 | 94.44 | 1.35 | 1.14 |
| 4 | {Number of casualties: two} => {At-fault party: PTW} | 18.58 | 80.95 | 1.16 | - |
| 5 | {Number of casualties: two, Road segment: other road segments} => {At-fault party: PTW} | 10.93 | 86.96 | 1.24 | 1.07 |
| 6 | {Number of casualties: two, Time of day: nighttime} => {At-fault party: PTW} | 14.75 | 87.10 | 1.25 | 1.08 |
| 7 | {Number of casualties: two, Violation: reckless driving/riding} => {At-fault party: PTW} | 8.20 | 93.75 | 1.34 | 1.16 |
| 8 | {Road segment: other road segments} => {At-fault party: PTW} | 43.72 | 80.81 | 1.16 | - |
| 9 | {Road segment: other road segments, Violation: reckless driving/riding} => {At-fault party: PTW} | 31.69 | 89.23 | 1.28 | 1.10 |
| 10 | {Road segment: other road segments, Time of day: nighttime} => {At-fault party: PTW} | 33.88 | 87.32 | 1.25 | 1.08 |
| 11 | {Road segment: other road segments, Time of day: nighttime, Violation: reckless driving/riding} => {At-fault party: PTW} | 24.04 | 93.62 | 1.34 | 1.07 |
| 12 | {Road segment: other road segments, Season: summer} => {At-fault party: PTW} | 14.75 | 87.10 | 1.25 | 1.08 |
| 13 | {Time of day: nighttime} => {At-fault party: PTW} | 53.01 | 76.98 | 1.10 | - |
| 14 | {Time of day: nighttime, Violation: reckless driving/riding} => {At-fault party: PTW} | 31.69 | 89.23 | 1.28 | 1.16 |
| 15 | {Time of day: nighttime, Year: 2015} => {At-fault party: PTW} | 9.84 | 85.71 | 1.23 | 1.11 |
| 16 | {Time of day: nighttime, Type of collision: other crash type} => {At-fault party: PTW} | 16.94 | 81.58 | 1.17 | 1.06 |
| 17 | {Time of day: nighttime, Type of collision: other crash type, Violation: reckless driving/riding} => {At-fault party: PTW} | 12.57 | 88.46 | 1.26 | 1.08 |
| 18 | {Time of day: nighttime, Year: 2013} => {At-fault party: PTW} | 12.57 | 79.31 | 1.13 | 1.03 |
| No. | Rules | S% | C% | Lift | LIC |
|---|---|---|---|---|---|
| 1 | {Type of collision: rear-end} => {Not-at-fault party: PTW} | 4.92 | 60.00 | 1.74 | - |
| 2 | {Type of collision: rear-end, Year: 2013} => {Not-at-fault party: PTW} | 2.73 | 83.33 | 2.42 | 1.39 |
| 3 | {Type of collision: head-on} => {Not-at-fault party: PTW} | 5.46 | 55.56 | 1.61 | - |
| 4 | {Type of collision: head-on, Year: 2017} => {Not-at-fault party: PTW} | 1.64 | 75.00 | 2.18 | 1.35 |
| 5 | {Type of collision: head-on, Year: 2016} => {Not-at-fault party: PTW} | 2.19 | 66.67 | 1.94 | 1.20 |
| 6 | {Type of collision: head-on, Violation: signal violation} => {Not-at-fault party: PTW} | 2.19 | 66.67 | 1.94 | 1.20 |
| 7 | {Number of vehicles involved: two or more} => {Not-at-fault party: PTW} | 34.43 | 51.64 | 1.50 | - |
| 8 | {Number of vehicles involved: two or more, Violation: safety distance violation} => {Not-at-fault party: PTW} | 5.46 | 71.43 | 2.07 | 1.38 |
| 9 | {Number of vehicles involved: two or more, Road segment: near pedestrian crossing} => {Not-at-fault party: PTW} | 1.09 | 66.67 | 1.94 | 1.29 |
| 10 | {Number of vehicles involved: two or more, Road segment: bridge section} => {Not-at-fault party: PTW} | 2.19 | 66.67 | 1.94 | 1.29 |
| 11 | {Number of vehicles involved: two or more, Type of collision: sideswipe} => {Not-at-fault party: PTW} | 4.37 | 66.67 | 1.94 | 1.29 |
| 12 | {Number of vehicles involved: two or more, Time of day: daytime} => {Not-at-fault party: PTW} | 14.75 | 65.85 | 1.91 | 1.28 |
| 13 | {Number of vehicles involved: two or more, Time of day: daytime, Violation: safety distance violation} => {Not-at-fault party: PTW} | 3.28 | 85.71 | 2.49 | 1.30 |
| 14 | {Number of vehicles involved: two or more, Time of day: daytime, Violation: reckless driving/riding} => {Not-at-fault party: PTW} | 4.92 | 81.82 | 2.38 | 1.24 |
| 15 | {Number of vehicles involved: two or more, Time of day: daytime, Year: 2013} => {Not-at-fault party: PTW} | 2.19 | 80.00 | 2.32 | 1.21 |
| 16 | {Number of vehicles involved: two or more, Season: spring, Violation: safety distance violation} => {Not-at-fault party: PTW} | 1.64 | 75.00 | 2.18 | 1.24 |
| 17 | {Number of vehicles involved: two or more, Season: spring, Year: 2015} => {Not-at-fault party: PTW} | 1.64 | 75.00 | 2.18 | 1.24 |
| 18 | {Number of vehicles involved: two or more, Season: spring, Time of day: daytime} => {Not-at-fault party: PTW} | 4.37 | 72.73 | 2.11 | 1.20 |
Disclaimer/Publisher’s Note: The statements, opinions and data contained in all publications are solely those of the individual author(s) and contributor(s) and not of MDPI and/or the editor(s). MDPI and/or the editor(s) disclaim responsibility for any injury to people or property resulting from any ideas, methods, instructions or products referred to in the content. |
© 2023 by the author. Licensee MDPI, Basel, Switzerland. This article is an open access article distributed under the terms and conditions of the Creative Commons Attribution (CC BY) license (https://creativecommons.org/licenses/by/4.0/).
Share and Cite
Tamakloe, R. Risk Factors Influencing Fatal Powered Two-Wheeler At-Fault and Not-at-Fault Crashes: An Application of Spatio-Temporal Hotspot and Association Rule Mining Techniques. Informatics 2023, 10, 43. https://doi.org/10.3390/informatics10020043
Tamakloe R. Risk Factors Influencing Fatal Powered Two-Wheeler At-Fault and Not-at-Fault Crashes: An Application of Spatio-Temporal Hotspot and Association Rule Mining Techniques. Informatics. 2023; 10(2):43. https://doi.org/10.3390/informatics10020043
Chicago/Turabian StyleTamakloe, Reuben. 2023. "Risk Factors Influencing Fatal Powered Two-Wheeler At-Fault and Not-at-Fault Crashes: An Application of Spatio-Temporal Hotspot and Association Rule Mining Techniques" Informatics 10, no. 2: 43. https://doi.org/10.3390/informatics10020043