Article

Shareholders in the Driver’s Seat: Unraveling the Impact on Financial Performance in Latvian Fintech Companies

by
Ramona Rupeika-Apoga
1,2,*,
Stefan Wendt
3 and
Victoria Geyfman
4
1
Faculty of Business, Management and Economics, University of Latvia, LV-1586 Riga, Latvia
2
Women Researchers Council (WRC), Azerbaijan State University of Economics (UNEC), Baku AZ1001, Azerbaijan
3
Department of Business, Bifröst University, 311 Borgarnes, Iceland
4
Department of Finance, Zeigler College of Business, Bloomsburg University of Pennsylvania, 400 East Second Street, Bloomsburg, PA 17815-1301, USA
*
Author to whom correspondence should be addressed.
Risks 2024, 12(3), 54; https://doi.org/10.3390/risks12030054
Submission received: 9 February 2024 / Revised: 11 March 2024 / Accepted: 14 March 2024 / Published: 18 March 2024
(This article belongs to the Special Issue Financial Analysis, Corporate Finance and Risk Management)

Abstract

:
Fintech companies are relatively young and operate in a rapidly evolving and ever-changing industry, which makes it important to understand how different factors, including shareholder presence in management roles, affect their performance. This study investigates the impact of shareholder presence in director and manager positions on the financial performance of Latvian fintechs. Our investigation centers on essential financial ratios, including Return on Assets, Return on Equity, Profit Margin, Liquidity Ratio, Current Ratio, and Solvency Ratio. Our findings suggest that the presence of shareholders in director and manager roles does not significantly affect the financial performance of fintech companies. Although the statistical analysis did not yield significant results, it is important to consider additional insights garnered from Cliff’s Delta effect sizes. Specifically, despite the lack of statistical significance, practical significance indicates that fintech companies in which directors and managers are shareholders show slightly better performance than other fintech companies. Beyond shedding light on the intricacies of corporate governance in the fintech sector, this research serves as a valuable resource for investors, stakeholders, and fellow researchers seeking to understand the impact of shareholder presence in director and manager roles on the financial performance of fintechs.

1. Introduction

The evolution of the fintech industry has captured widespread attention, driven by its unique characteristics and transformative impact on traditional financial services. Fintech companies operate at the nexus of finance and technology, leveraging innovation to revolutionize how individuals and businesses access and manage financial services. Their dynamic nature, fueled by technological advancements and entrepreneurial spirit, presents both challenges and opportunities that demand specialized examination. At the heart of fintech’s allure lies its entrepreneurial finance dynamics, which encompass intricate investment structures, risk profiles, and performance metrics distinct from those of conventional firms. Unlike traditional companies, fintechs often navigate complex ecosystems of venture capital, angel investors, and strategic partnerships, shaping their growth trajectories and risk appetites in unique ways (Sahid et al. 2023). The growth and the ever-changing landscape of fintech companies have ignited significant interest in understanding the factors that impact their financial performance. Among these factors, the presence of shareholders as directors and managers has emerged as a critical aspect influencing decision making and resource allocation (Al-Matari et al. 2022). Investigating the relationship between shareholders as directors and managers on the one hand and financial performance on the other can yield valuable insights into the dynamics of corporate governance in the fintech sector.
To the best of the authors’ knowledge, the academic literature has not yet answered the question of the impact of shareholders as directors and managers on the financial performance of fintech companies (Najaf et al. 2022). Exploring the role of shareholders in governance has profound implications for corporate governance, a cornerstone of organizational effectiveness. Corporate governance structures determine decision-making processes, risk management strategies, and overall organizational performance. By examining how shareholder involvement in leadership roles shapes financial outcomes in fintech firms, we gain insights into governance practices in this dynamic sector. This knowledge is essential for enhancing investor confidence, ensuring regulatory compliance, and maintaining market stability. Furthermore, from the perspective of the economic literature, this research question addresses a significant gap in current research. Despite the rapid development and transformative influence of fintech firms on traditional financial services, empirical studies examining the specific impact of shareholder-directors and managers on financial performance in this sector are scarce. Our research fills this gap and advances the academic understanding of corporate dynamics within fintech firms. In addition to contributing to the academic discourse, this research provides practical insights for practitioners, policymakers, and stakeholders navigating the intricacies of the fintech landscape.
We address this research gap by examining the financial performance differences between three distinct fintech groups. The first group consists of companies where all directors and managers are shareholders1 (DM1). The second group comprises companies where neither directors nor managers are shareholders (DM2). The third group has a mixed composition, where some directors and managers are shareholders while others are not (DM3). This study also addresses the potential conflict of interest that may arise when shareholders and management roles are separated, further enhancing our understanding of the governance landscape in the fintech industry.
Our analysis is grounded in two primary theoretical frameworks concerning corporate governance: agency theory (proposed by Jensen and Meckling (1976), further developed by Fama (1980)), and stewardship theory (introduced by Donaldson and Davis (1991)). These two theories provide contrasting views on the relationships between shareholders, directors, and managers, encompassing aspects of potential conflict of interest (CoI) (Hoi and Robin 2010). By applying these theories to the context of fintech companies, we aim to deepen our understanding of the governance challenges and opportunities inherent in this rapidly evolving industry
The study uses a sample of 96 Latvian fintech companies that were in operation during the year 2022. Our investigation centers on several vital financial ratios, including Return on Assets (ROA), Return on Equity (ROE), Profit Margin (PM), Liquidity Ratio (LR), Current Ratio (CR), and Solvency Ratio (SR). Our research design employs non-parametric tests, specifically Kruskal–Wallis tests, to assess potential statistical differences among the three groups DM1, DM2, and DM3. Furthermore, we utilize various graphical methods and visualizations, such as median heatmaps, bootstrap medians, and confidence intervals to gain further insights into the potential effect of shareholder presence on financial performance.
The Latvian fintech sector is of particular interest because Latvia-based fintech companies are not limited geographically; they have established a global presence, including in Switzerland, Africa, the UK, and Asia. These companies operate in various areas such as lending and payment services, showcasing the extensive global reach and potential impact of the Latvian fintech sector. Moreover, the fact that Latvia is a small country with a relatively modest economy allows for a comprehensive analysis of nearly all market participants. These factors collectively position the Latvian fintech sector as a compelling case study for other countries seeking to comprehend the influence of shareholder presence in director and manager roles on the financial performance of fintech companies.
Our study reveals that the presence of shareholders as directors and managers does not have a statistically significant impact on essential financial ratios of fintech companies compared to those fintech companies where ownership and management are separated. This result indirectly suggests that the potential conflicts of interest associated with shareholders being separated from directors and managers do not significantly impact the financial performance of fintech companies.
The research makes several contributions to the field of fintech and corporate governance. First, the study offers a comprehensive analysis of the relationship between shareholders as directors and managers and financial performance in fintech companies. By examining multiple financial ratios, the authors provide a holistic perspective on the impact of shareholders on various aspects of a company’s financial performance. Second, the findings hold practical implications for decision makers, investors, and stakeholders in the fintech sector by focusing on aspects of corporate governance that are typically expected to have a significant impact on financial performance. Third, the study adds to the growing body of research on fintech companies’ performance and governance dynamics, enriching the understanding of the factors influencing financial outcomes in this rapidly evolving industry. The inclusion of conflicts of interest as an aspect of investigation further advances the scholarly discourse on the complexities and challenges faced by fintech companies in their pursuit of optimal governance and sustained financial success.
This paper is structured as follows. In Section 2, we review the related literature and develop the hypotheses for the empirical analysis. Section 3 describes the dataset and methodology, followed by the presentation of the empirical findings in Section 4. The main findings are discussed in Section 5, with concluding remarks provided in Section 6.

2. Literature Review and Hypothesis Development

Conflicts of interest are a crucial factor that can undermine the objectives of both agency theory and stewardship theory. Jensen and Meckling’s (1976) seminal work emphasizes the significance of board ownership as a mechanism for reducing agency costs that result from the potential conflicts of interest between shareholders and managers. Their findings indicate that when directors hold ownership stakes, there is a natural alignment of interests that encourages a more vigilant approach to decision making. This alignment leads to a reduction in the misuse of company resources for private benefits, a phenomenon known as “private perquisite consumptions.” Consequently, board ownership is a proactive strategy for curbing agency costs and enhancing financial outcomes. Moreover, the link between board ownership and enhanced corporate performance finds support in the insights presented by Berle and Means (1991). Their research underscores the significance of shared incentives between directors and managers, and shareholders. According to this approach, with higher ownership stakes held by directors, there is a heightened commitment to the company’s financial well-being and value creation. This alignment cultivates an environment in which directors and managers are more attuned to shareholders’ concerns, motivating them to work diligently towards achieving improved performance. In the context of Stano’s (1975) study, the data indicate that firms where CEOs are also owners (executive ownership) exhibit better financial performance compared to firms where CEOs are not significant owners.
Building on these concepts, Brickley et al. (1997) highlight how board ownership acts as a catalyst for efficient company operations and effective managerial oversight. The ownership interest provides directors and managers with a vested personal interest in the company’s prosperity. This interest becomes a motivating factor for them to ensure careful oversight of managerial choices. This motivation aligns with the tenets of both the agency theory and the stewardship theory, where directors are incentivized to act in ways that promote the best interests of shareholders.
It is worth noting that many fintech companies share characteristics with startups and dynamic IT firms, often operating with a relatively smaller number of employees compared to traditional financial services providers (Jain et al. 2023; Dospinescu et al. 2021; Grima et al. 2021). Within the context of fintech companies usually privately held and start-ups (Tzanaki et al. 2023; Sharma et al. 2023), the stewardship theory is of particular importance. The theory suggests that managers perceive themselves as custodians of the company’s resources and are intrinsically motivated to act in the best interests of all stakeholders (Chrisman 2019). The close relationship between shareholders and managers in these small firms fosters a culture of stewardship, enabling managers to align their goals with the long-term success of the company (Davis et al. 1997), unlike in large public companies where the separation of ownership and control is more pronounced (Bonazzi and Islam 2007). The presence of shareholders as directors and managers may not have a significant impact on financial performance because both groups of managers (with and without shareholder presence) are intrinsically motivated to act responsibly and in the best interest of the company (Affes and Jarboui 2023; Caselli et al. 2023). They prioritize the long-term success of the company over personal gains, leading to similar financial performance outcomes regardless of whether shareholders are directly involved in the management roles.
Conversely, agency theory centers on potential conflicts of interest between managers and shareholders, stemming from the separation of ownership and control (Fama and Jensen 1983). This theory examines how agency costs may arise when managers prioritize their own interests over acting solely in the best interest of shareholders, potentially leading to reduced firm performance (Donaldson and Davis 1991).
When considering the influence of shareholders as directors and managers on financial performance in the Latvian fintech sector, the interplay between stewardship theory and agency theory adds complexity. Stewardship theory suggests that intrinsic motivations and shared interests may mitigate conflicts of interest, while agency theory underscores the potential for conflicts that can hinder decision-making alignment. Thus, an assessment of the interplay between these theories and conflicts of interest is essential in understanding the impact of shareholder involvement as directors and managers on financial performance. With this in mind, we hypothesize the following:
H1. 
There are significant differences in financial performance of Latvian fintech companies based on shareholder involvement as directors and managers.
We further subdivide this hypothesis by separating the roles of DM1, DM2, and DM3. Thus,
H1.1. 
The financial performance of fintech companies with all directors and managers being shareholders (group DM1) differs from that of fintech companies where neither directors nor managers are shareholders (DM2).
The first sub-hypothesis posits that fintech firms in which all directors and managers are shareholders (group DM1) will exhibit different financial performance than those in which neither directors nor managers are shareholders (DM2). This proposition is based on the principles outlined by Jensen and Meckling (1976), who emphasize the importance of board ownership in mitigating conflicts of interest between shareholders and managers. Their research suggests that when directors hold ownership stakes, there is a natural alignment of interests that promotes vigilant decision making and reduces the misuse of corporate resources for personal gain. In addition, Berle and Means (1991) support the idea that higher levels of director ownership correlate with increased commitment to the financial well-being and value creation of the firm. Consequently, we expect that fintech firms with all directors and managers as shareholders (group DM1) will exhibit superior financial performance compared to those without such shareholder involvement (group DM2).
H1.2. 
The financial performance of fintech companies with all directors and managers being shareholders (group DM1) differs from that of fintech companies where some directors and managers are shareholders while others are not (DM3).
The second sub-hypothesis suggests that fintech firms in group DM1 will exhibit different financial performance than those in which only some directors and managers are shareholders while others are not (DM3). This hypothesis is supported by the notion that differences in shareholder–manager alignment may contribute to differences in financial outcomes. Building on the insights of Brickley et al. (1997), who highlight the motivational effect of board ownership on managerial monitoring, we find that the presence of shareholder-directors and managers in group DM1 fosters a culture of stewardship and aligns incentives with the best interests of shareholders. Conversely, in group DM3, where shareholder–manager alignment is partial, the potential for conflicts of interest may persist, potentially affecting financial performance.
H1.3. 
The financial performance of fintech companies where neither directors nor managers are shareholders (DM2) differs from that of fintech companies where some directors and managers are shareholders while others are not (DM3).
The third sub-hypothesis focuses on comparing the financial performance of fintech firms where neither directors nor managers are shareholders (DM2) with those where some directors and managers are shareholders while others are not (DM3). This hypothesis is based on the assumption that partial shareholder–manager alignment in the DM3 group may lead to similar financial performance outcomes as in the DM2 group. Affes and Jarboui (2023) suggest that both groups of managers, regardless of the presence of shareholders, may be intrinsically motivated to act responsibly and in the best interest of the firm, thus minimizing the potential impact of conflicts of interest on financial performance. Consequently, we expect the financial performance of firms in the DM2 group to be comparable to that of firms in the DM3 group.

3. Methodology

3.1. Study Design

This study employed a three-stage approach to investigate the impact of the presence of shareholders as directors and managers on financial performance. In the first stage, we conducted a comprehensive examination of the data. This involved carefully reviewing and validating the dataset to ensure its accuracy, completeness, and suitability for analysis. We assessed the data for any inconsistencies, missing values, or potential errors that could impact the reliability of our findings. Specifically, we verified that the dependent variables are continuous in nature, allowing for meaningful interval/ratio measurements. Additionally, we confirmed that the observations are independent, ensuring that each data point is distinct and unrelated to others. However, it is worth noting that the assumption of normality and the absence of outliers were not met in our dataset, which is not uncommon in the context of innovative technology companies (Barnes 1982; So 2006). To identify this, we employed statistical tests, such as the Shapiro–Wilk test and visual methods, including histograms and scatter plots, to assess the data’s distribution and identify any potential outliers. Due to the deviations from normality and the presence of outliers, we proceeded with non-parametric methods to perform robust and valid statistical analyses, considering the unique characteristics of our data.
In the second stage, a comparative analysis was conducted to identify potential differences between different groups of fintech companies based on their involvement of shareholders as directors and managers. Fintech companies were classified into three distinct groups: DM1, DM2, and DM3. To assess potential differences between these groups, the Kruskal–Wallis H test (Marx 2016), a non-parametric statistical test, was employed. Additionally, in order to quantify the practical significance of any observed differences, Cliff’s Delta effect sizes were calculated (Hollander et al. 2014).
In the third stage, graphical methods and visualizations were utilized to gain further insights into the potential effect of shareholder presence on financial performance. Median and correlation heatmaps were constructed to visually represent the relationships between various financial ratios (Raschka 2013). Bootstrap confidence intervals were used to provide a measure of uncertainty for key financial performance metrics, while boxplots facilitated the comparison of distributions between the different groups (Ramachandran and Tsokos 2021).
By combining non-parametric tests and graphical methods, this research design allows for a comprehensive and robust analysis of how the presence of shareholders as directors and managers may influence the financial performance of Latvian fintech companies.

3.2. Sample Selection and Data Collection

Understanding the characteristics of the fintech industry and selecting our sample presents a significant challenge due to the lack of an official list of fintech firms in Latvia. To address this, we adopted the definition of fintech provided by the Bank of Latvia, which includes companies that leverage new and innovative technologies in the financial services domain (Bank of Latvia 2020). These companies drive the development of novel financial products and services or significantly enhance existing ones. To identify such firms, we initially considered companies listed in the Rupeika-Apoga and Wendt (2022) study. Subsequently, we expanded our search to include fintech companies listed in Dealroom (Chiavarini et al. 2023) and the Startin database (Startin 2023) to include companies that started during 2022. We diligently verified whether these companies conformed to our defined criteria. Furthermore, we cross-checked the list of fintech companies with the Register of Enterprises of the Republic of Latvia to verify that only those entities registered in Latvia were taken into account for our study. This meticulous process of selection and verification enabled us to create a comprehensive and reliable list of Latvian fintech companies for our research.
In 2022, a remarkable surge in the fintech sector was observed in Latvia, with 106 active fintech companies officially listed in the Register of Enterprises of the Republic of Latvia. This notable increase reflects a substantial expansion compared to previous years, with 93 fintech companies identified in 2021, and 56 in 2019 (Rupeika-Apoga and Wendt 2022). Fintech companies inherently possess the flexibility to offer their services online, making it feasible for them to operate internationally. Nevertheless, despite the global nature of their services, these enterprises have actively chosen Latvia as their base of operations. The analysis of the names of the fintech owners reveals a strong connection to Latvian heritage. This trend signals a noteworthy presence of local entrepreneurs and businesses actively contributing to the industry’s growth. However, as certain fintech companies mature and attain higher levels of development and success, they may embark on new ventures and explore opportunities in more prominent financial hubs and international arenas (for example, Bitfury).
Out of the initially identified 106 fintech companies, our analysis was conducted on 96 companies due to data availability limitations. However, the data collected on these companies provide valuable insight into the relationship between the presence of shareholders as directors and managers and financial performance among Latvian fintech companies.
The primary source of information for this research is derived from Bureau van Dijk’s Orbis database, a subsidiary of Moody’s Analytics. This database offers an extensive collection of financial and operational performance metrics as well as corporate governance characteristics of fintech companies in Latvia.
The following financial ratios were obtained from Bureau van Dijk’s Orbis database for Latvian fintech firms for 2022. These indicators were selected because they cover essential aspects of financial performance, providing a comprehensive view of a company’s financial health. They encompass liquidity ratios (such as the Current Ratio and Liquidity Ratio), efficiency ratios (including Return on Assets and Return on Equity), profitability ratios (such as Profit Margin), and leverage ratios (such as Solvency Ratio).
Liquidity Ratio (LR) = (Current Assets − Inventory)/Current Liabilities
Current Ratio (CR) = Current Assets/Current Liabilities
LR and CR assess a company’s liquidity position, with lower values of these ratios generally reflecting worse financial performance.2 Low levels of liquidity might also result from managers diverting funds for their private benefits as manifestation of conflicts of interest between managers and shareholders (Zaidi and Rupeika-Apoga 2021). For Latvian fintech companies, we observed that LR and CR were frequently equal or very close to each other. This is attributed to the absence or minimal presence of inventory.
Return on Total Assets (ROA) = Profit or Loss before Tax and Extraordinary Items/Total Assets
ROA is an essential metric for investors, creditors, and management, as it provides insights into how efficiently a company generates profits relative to the size of its asset base. Comparing ROA across fintech companies can help investors identify which companies are more effective at generating profits from their asset investments.
Return on Equity (ROE) = Profit or Loss before Tax and Extraordinary Items/Total Shareholder Funds & Liabilities
Return on Equity (ROE) is a critical financial ratio that measures the return generated on the shareholders’ equity invested in the company. It is an essential indicator of how efficiently a company is using the equity capital provided by shareholders to generate profits.
Profit Margin (PM) = Profit or Loss before Tax and Extraordinary Items/Operating Revenue (Turnover)
Profit Margin (PM) is a financial ratio that measures the company’s ability to generate profit from its operating activities in relation to its total revenue. A higher profit margin indicates that the company is effective at controlling costs and managing its operating expenses relative to its revenue.
Solvency Ratio (SR) = Total Shareholders’ Equity/Total Assets
The Solvency Ratio is a financial metric that evaluates a company’s ability to meet its long-term obligations and debt. It measures the extent to which the company’s assets are funded by the owners (shareholders) rather than external debt.

4. Results

4.1. Sample Characteristics and Descriptive Statistics

In 2022, the 96 Latvian fintech companies employed 2202 employees, reflecting the vibrant workforce within this dynamic industry. On average, each company maintained a team of approximately 23 employees. Notably, a significant number of these companies opted for a lean workforce, with a considerable portion comprising single-employee firms. For instance, 18 companies operated with just one employee, 16 fintech companies managed with a team size of two employees, while six fintech firms employed a slightly larger team of three employees each. This trend points to the possibility that entrepreneurs take on multiple roles or possess highly specialized skills to start and propel their fintech ventures forward. Consequently, it is evident that the majority of fintech companies in Latvia are relatively small-scale operations with a limited number of employees.
As we delve further into the management structure, the average Management-to-Employee ratio (ME ratio) for Latvian fintech companies in 2022 was observed to be 1:10, i.e., for every one manager, there were ten employees within these fintech firms. Given the relatively small average company size and the ME ratio, it is likely that some directors and managers in these fintech companies took on multiple roles and responsibilities in managing various functional areas.
In 2022, there were 215 directors and managers within Latvian fintech companies. The distribution of sample by gender revealed that there was a significantly higher number of male directors and managers (188) than female directors and managers (27) within the Latvian fintech sector. The underrepresentation of women in such roles highlights a critical area of concern in fostering gender diversity and inclusivity in the industry.
Among the fintech companies analyzed, a notable pattern emerges in the relationship between directors and managers, and shareholders. Specifically, 76 individuals hold dual roles, serving as both directors/managers and shareholders. On the other hand, 139 individuals hold positions solely as directors or managers without direct ownership interests. Within the group of 76 individuals with dual roles, the majority of the group (69 individuals) are male, highlighting a significant underrepresentation of women in this group.
In addition to this ownership disparity, another aspect of gender imbalance is evident in the role of President/Chairman of the board within the analyzed Latvian fintech companies. Among the leadership positions, only one woman serves as President/Chairman, while an overwhelming majority of this group (46) are men. This striking contrast further emphasizes the lack of female representation in top leadership roles within the Latvian fintech industry.
We categorized the 96 companies into three distinct groups based on the relationships between directors and managers, and shareholders. The first group, DM1, consisted of 46 fintech companies where all director and manager positions were held by shareholders, indicating a direct financial stake in the companies they manage. The second group, DM2, comprised 40 fintech companies where none of the director and manager positions were held by shareholders, suggesting a clear separation between management and ownership roles. Finally, the third group, DM3, included 10 fintech companies where both shareholders and non-shareholders occupied director and management positions, suggesting a mix of ownership structures within these companies.
We used the key financial performance measures of ROA, ROE, PM, LR, and CR as metrics of the financial health of fintech companies. Table 1 reports the descriptive statistics of the variables of interest.
The median ROA of 0.02 signifies that, on average, the companies generate a return of 2% on each unit of assets they utilize. Similarly, the median ROE of 0.19 indicates that, on average, the companies generate a return of 19% on the shareholders’ equity invested in the business. Furthermore, the median profitability margin (PM) of 0.068 reveals that, on average, the companies translate 6.8% of their revenue into profit after accounting for all costs and expenses. In terms of Current Ratio (CR), the median value of 1.38 reflects stability in fulfilling short-term financial commitments. The Liquidity Ratio (LR) of 1.33 also indicates a reasonably good overall liquidity position. With a median value of 0.3, the solvency ratio (SR) signifies that, on average, 29.5% of the assets are financed by equity, while the remaining 70.5% are financed by debt.
In our study, we observe that the levels of financial ratios in the Latvian fintech industry are consistent with previous findings (Rupeika-Apoga et al. 2023). We use both the Shapiro–Wilk tests and graphical methods, such as histograms, to check for normality of the data. The results show that the data did not follow a normal distribution (see Table A1). By adopting the winsorizing technique, we aimed to mitigate the impact of outliers on our analyses while maintaining the integrity of the original data distribution. This approach was especially relevant given the relatively small size of the fintech market and the potential for extreme observations to disproportionately influence results (Adams et al. 2018). Still, however, it is important to note that the data for financial ratios in the industry are not normally distributed. Given the dynamic nature of the fintech industry and the unique characteristics of companies within it, it is common to encounter significant variations in financial ratios. These discrepancies can be attributed to varying levels of performance and the continually changing economic and market conditions that influence fintech operations (Rupeika-Apoga and Solovjova 2016).
To address the non-normal distribution of data and the presence of extreme values or outliers, we have chosen to use medians as a more appropriate measure of central tendency. Medians provide a robust representation of the average value for each financial ratio, allowing us to gain a better understanding of the industry’s performance while minimizing the impact of outlier data (So 2006).

4.2. Comparative Analysis

As our data did not follow a normal distribution, we employed the Kruskal–Wallis test to assess potential differences in financial performance between the groups. The test results revealed that there were no statistically significant differences between the groups (Table 2).
To evaluate the reliability of the findings obtained from the Kruskal–Wallis test, we conducted a Robust Analysis of Covariance (Robust ANCOVA) while controlling for the number of employees. Fintech companies tend to be relatively small in scale, and a considerable proportion of them are characterized by having only a single employee. This control variable was introduced to account for potential variations in the results that could arise from differences in the size of the companies under investigation. The results revealed that, with the exception of the variable ROA, there were no statistically significant differences observed among the DM groups. However, DM1 exhibits a higher ROA compared to DM2.

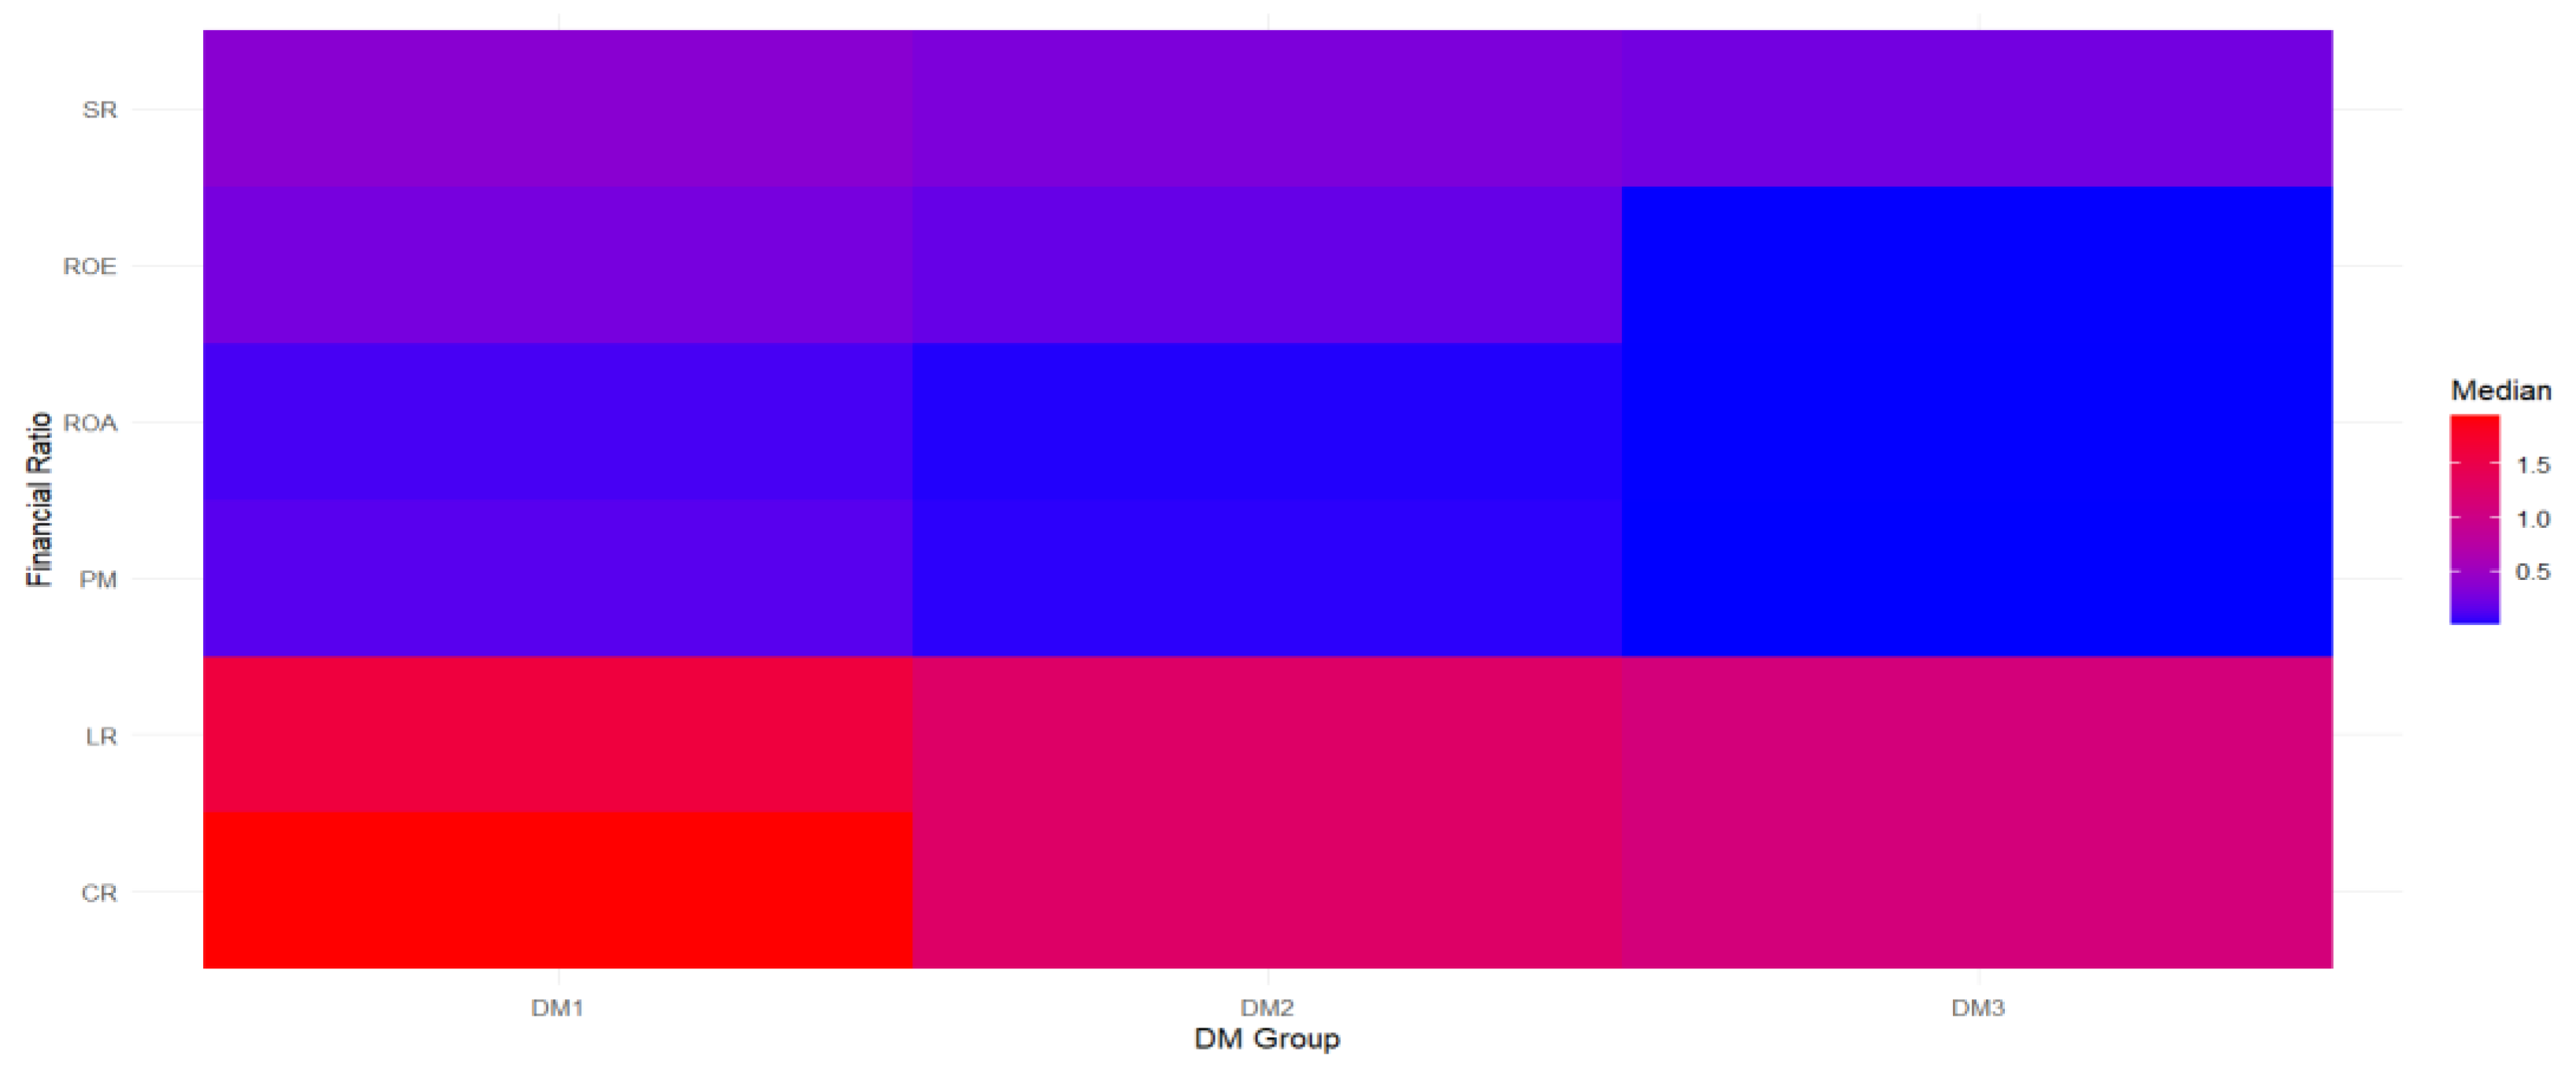
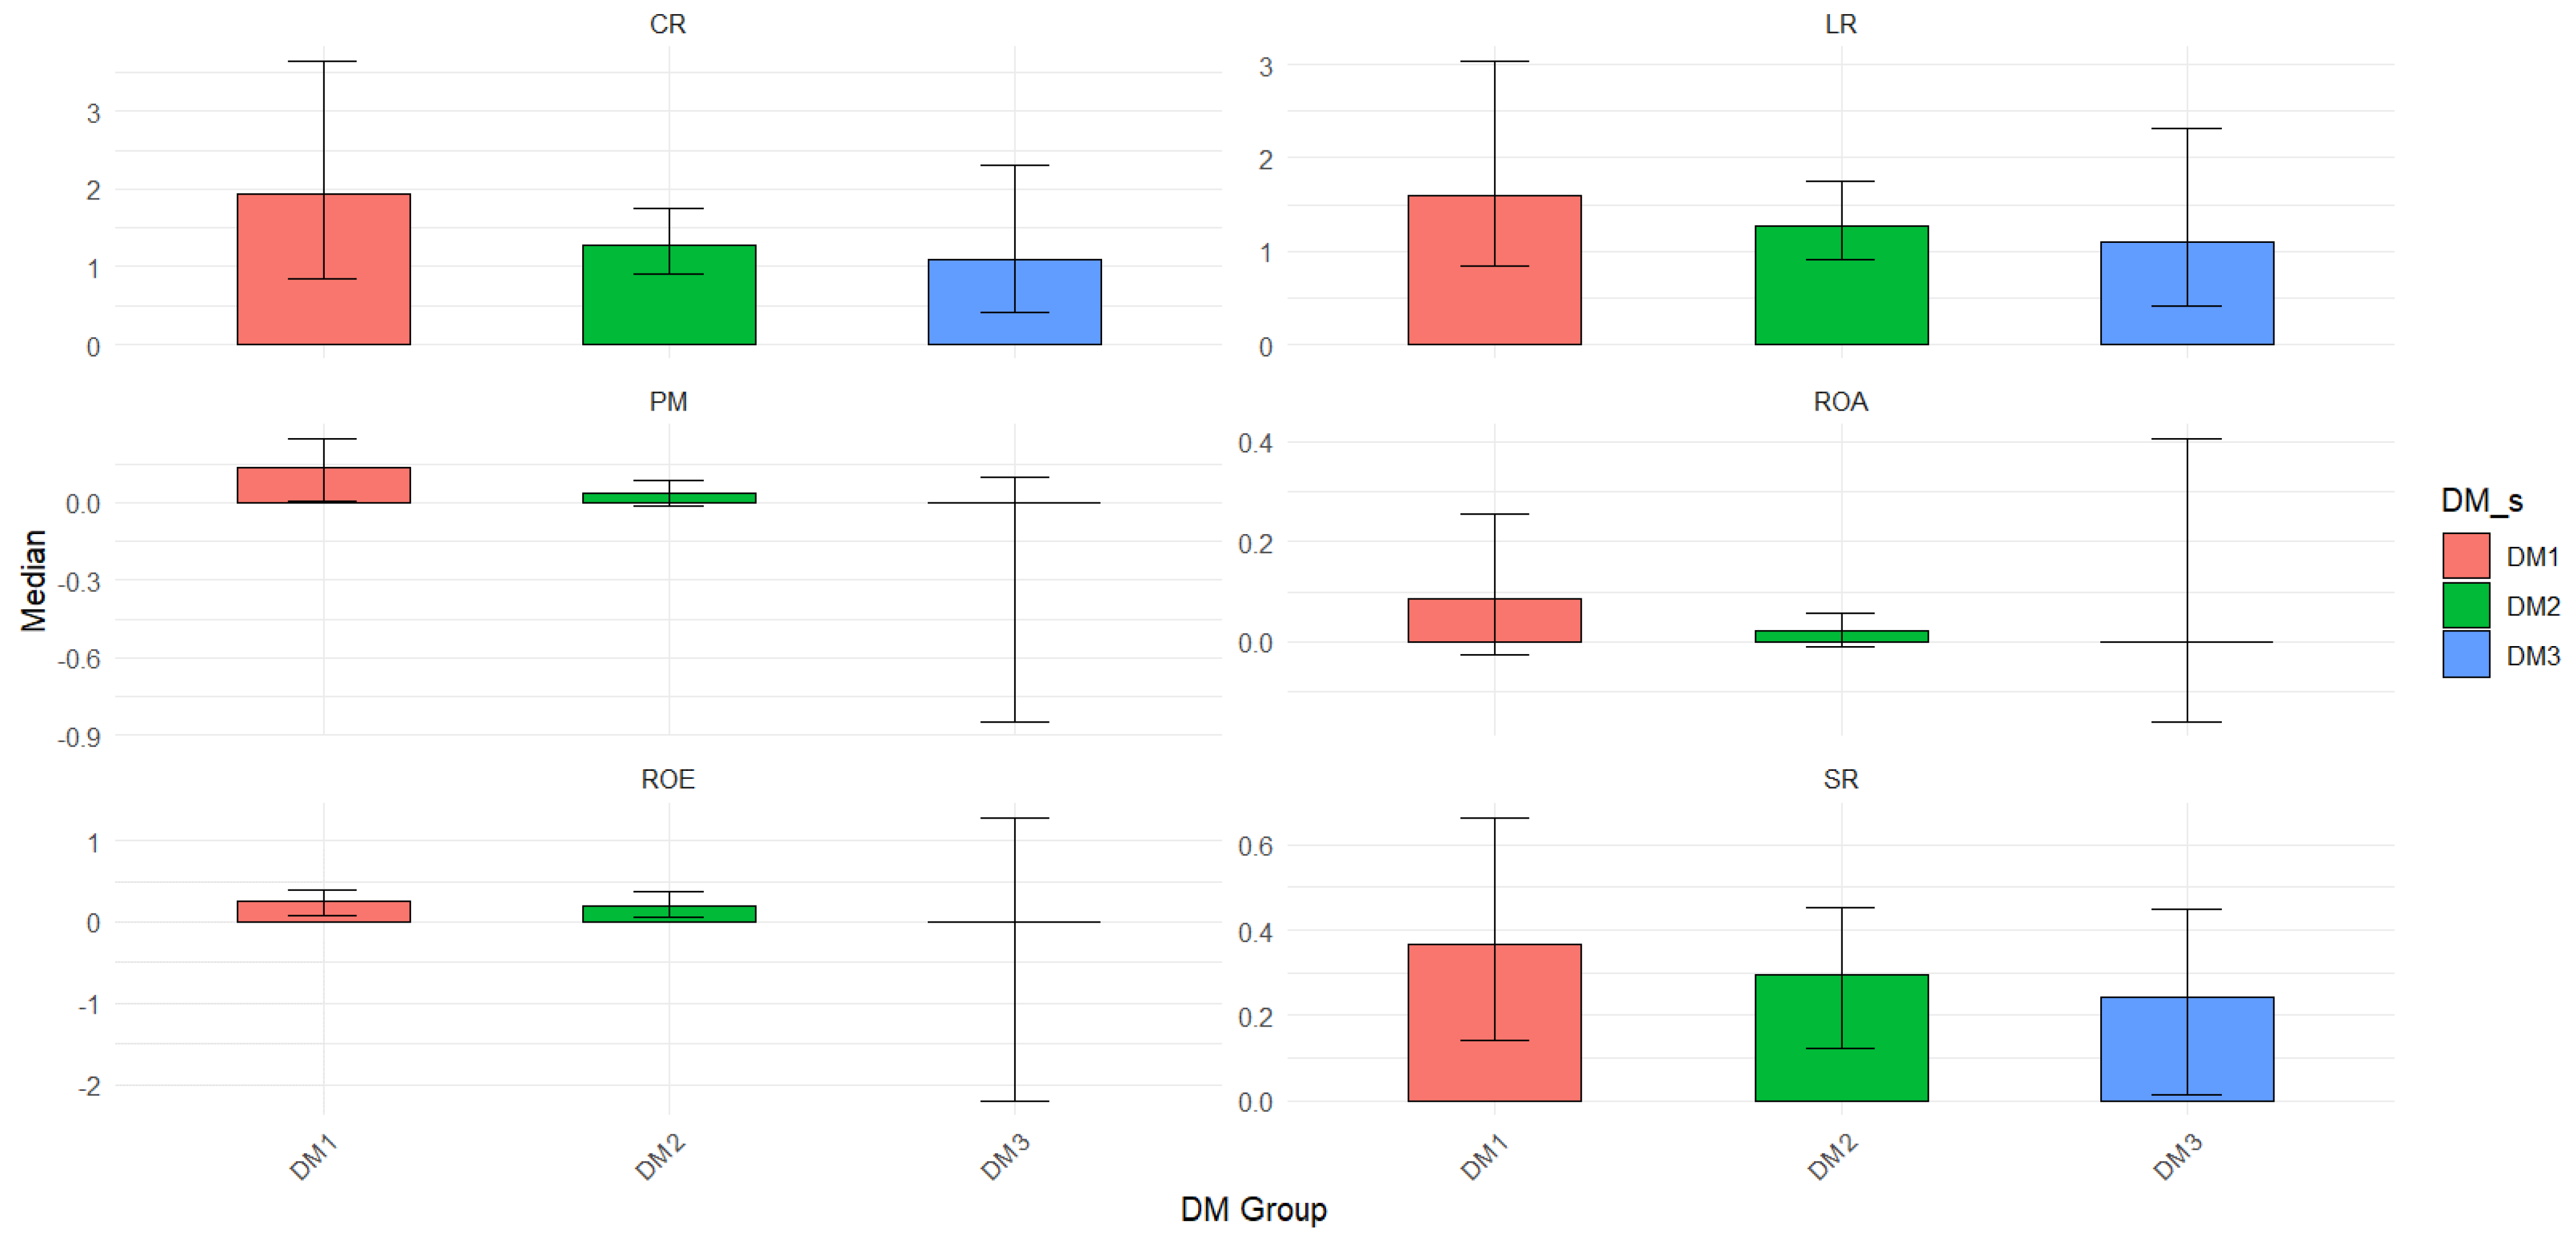
4.3. Visualizing Shareholder Presence and Financial Performance: Exploring Correlations, Metrics, and Distributions

While no statistically significant differences emerged among financial ratios in various DM groups, we wanted to delve deeper and employ visual methods to examine the impact of shareholder presence on the financial performance of fintech firms. Recognizing the limitations of traditional statistical tests in our analysis of financial ratios among the three groups DM1, DM2, and DM3, we turned to median heatmaps as a powerful visual tool to uncover any potential trends or discrepancies in the data. Notably, DM1 consistently displays slightly higher medians across all financial ratios, suggesting a greater proportion of revenue translating into profit, a stronger overall liquidity position, and a relatively higher ratio of assets funded by equity instead of debt. DM3, in contrast, tends to have lower medians across most financial ratios, suggesting weaker financial performance compared to the other two groups. However, the median heatmaps revealed no significant differences in financial ratios between the three DM groups (see Figure 1).
Despite observing these patterns, it is essential to assess the magnitude of these differences to understand their practical significance. The Cliff’s Delta effect sizes were computed to quantify the differences in medians between the groups (see Table 3). The results show that for DM1 versus DM2, most financial ratios have effect sizes close to zero, indicating negligible differences. This suggests that the variations in medians between DM1 and DM2 may not have a meaningful impact in the real world, and such differences could merely be attributed to random fluctuations. Moreover, the small Cliff’s Delta effect size for the PM financial ratio implies that, although there is a statistical difference between DM1 and DM2, its economic impact may be limited.
On the other hand, when analyzing group DM3, the results paint a different picture. Group DM3 exhibited worse performance compared to both DM1 and DM2 in terms of ROE, PM, LR, and CR. Although the effect sizes for these differences ranged from 0.195 to 0.245 (which is considered small according to conventional effect size guidelines), these values may have meaningful and practical implications when making financial assessments and investment decisions. Interestingly, an exception arises in the DM1–DM3 comparison, where the effect size is deemed medium, signaling that PM for the DM1 group surpasses that of the DM3 group. This finding may have interesting implications for the corporate governance debate.
In the next step of our analysis, we utilized a robust statistical approach called bootstrapped medians alongside confidence intervals (CIs) to delve further into our research findings. This method allowed us to address key challenges associated with uncertainty and variability in the data, making our conclusions more robust and reliable. In Figure 2, we use bars to represent the bootstrapped medians and error bars to show the confidence intervals for each group (DM1, DM2, and DM3) and financial ratio. Each bar represents the median value of the bootstrapped samples for a particular group and financial ratio, and the error bars indicate the range within which we are 95% confident the true median lies.
Based on the bootstrapped medians and their corresponding confidence intervals, we can make insightful comparisons among the DM groups with respect to their financial ratios:
  • Profitability: Among the three financial ratios, DM1 consistently outperforms DM2 and DM3 in terms of median values. However, it is essential to consider the precision of these estimates. The confidence intervals for DM1 are relatively wider compared to those for DM2, indicating that there is less certainty in estimating the true population values for DM1. In contrast, the narrower confidence intervals for DM2 imply a more precise estimation of its true population values. Furthermore, the confidence intervals for DM3 overlap with both DM1 and DM2. This suggests that, statistically, there may not be significant differences between DM3 and the other two groups in terms of ROA, ROE, and PM.
  • Liquidity: The analysis of liquidity measures presents a similar situation as observed for profitability ratios. DM1 exhibits larger median values for both LR and CR, indicating higher levels of liquidity compared to DM2 and DM3. However, similar to previous findings, the confidence intervals for DM1 are relatively wider, implying less precision in estimating the true population values for LR and CR. It is noteworthy that the confidence intervals for DM1 fully overlap with those of DM2 and partly with DM3 for both LR and CR. This statistical overlap indicates that there might not be significant differences in liquidity levels between DM1 and DM2, and there could be some overlap in liquidity with DM3 as well. While DM1 generally shows higher median values, the overlapping confidence intervals suggest that the differences between the groups may not be substantial.
  • The analysis of the solvency ratio reiterates the pattern observed in liquidity ratios, where DM1 tends to have higher median values, indicating stronger solvency compared to DM2 and DM3. However, the wider confidence intervals for DM1 suggest caution in interpreting the results, as there is less precision in estimating its true population values.
In summary, DM1 stands out as having better performance in terms of median values across various financial ratios. However, the wider confidence intervals observed for some ratios (CR, LR, and SR) emphasize the need for caution in interpreting the results, as they indicate less precision in estimating the true population values. Moreover, the presence of overlapping intervals suggests that the differences between DM1 and the other groups (DM2 and DM3) in certain financial ratios may not be substantial.
It is important to acknowledge that our sample size is relatively small, and individual outliers within one group may have influenced some of the results. Nonetheless, these findings offer valuable insights into the interplay between different financial ratios within and between DM groups, shedding light on potential areas of focus for further analysis and decision making.

5. Discussion

Latvian fintech companies, much like their counterparts in other countries, predominantly comprise small businesses, and this often results in a scenario where a shareholder assumes the role of a director (Katalkina and Saksonova 2022). This scenario is particularly common in start-up companies. When founders establish a new company, they typically take on three essential corporate roles: they become the company’s owners (as they hold shares), controllers (as they usually appoint themselves as directors), and active executives (as they often assume the position of CEO or a similar executive title) (Zhang et al. 2021). This combination of roles, especially when founders are major shareholders and directors, can be a potent force (Bachiller et al. 2015). In such cases, founders have the ability to control the company’s strategic direction as directors, and they can safeguard their position by leveraging their rights as majority shareholders (Saksonova and Papiashvili 2021; Neralla 2022). In our sample of 96 Latvian fintech companies, 46 companies belonged to the DM1 category, which means that all directors and managers are shareholders. Among the DM1 companies, there were 36 that had one director and manager, eight companies with two directors and managers, and two fintech firms with three directors or managers.
As businesses grow and seek external financing, it is customary to appoint independent directors who have no or minimal ownership stakes in the business (Smith et al. 2010). The rationale behind this practice is to ensure good governance by holding directors accountable to shareholders for their decision making within the company. In the DM2 group (40 companies), there were no shareholders present as directors or managers. Among the companies in this category, it was observed that a significant number of fintech firms were led by a single individual, with 12 companies having a solo director and manager arrangement. Additionally, there were nine fintech companies with two individuals comprising the director and manager roles, and seven fintech companies with three individuals actively participating in director and management functions, while one company in the DM2 group had a maximum of 13 individuals involved in these roles.
The outcomes of the Kruskal–Wallis test suggested that there were no statistically significant differences observed between the DM groups concerning the financial ratios. This means that the presence of shareholders as directors and managers does not have a significant statistical impact on the financial ratios of the companies. These findings align with studies devoted to stewardship theory, which suggest that, in small companies, both owners and managers are incentivized to strive for optimal company performance, irrespective of their individual roles (Davis et al. 1997; Menyah 2013; Chrisman 2019). The stewardship theory suggests that managers who are also shareholders are motivated to act as stewards, working in the best interest of shareholders and stakeholders (Menyah 2013). In this context, their intrinsic motivation to protect and grow the company’s resources should lead to similar efforts to enhance financial performance, regardless of their formal role as directors (Davis et al. 1997). These findings fail to support our initial hypothesis, which proposed that there are significant differences in the financial performance of Latvian fintech companies based on the presence of shareholders as directors and managers. Therefore, according to the stewardship theory, directors and managers who are shareholders (DM1 category) may demonstrate comparable levels of commitment to improving financial performance compared to directors and managers who are not shareholders (DM2 category). The shared ownership and involvement in management roles align their interests with those of shareholders, promoting a sense of stewardship and diminishing potential conflicts of interest. In the authors’ opinion, it is important to note that the majority of Latvian fintech companies in the DM2 group are still relatively small. As a result, the limited scale and size of these companies may contribute to the absence of statistically significant differences in financial ratio performance.
Although we did not find statistically significant differences between the groups for financial ratios, we used graphical methods to uncover notable patterns. For example, the DM1 group consistently had slightly higher medians for all financial ratios, indicating better overall financial health. These findings suggest that active shareholder involvement in management may contribute to higher Return on Assets (ROA), better liquidity, and a greater proportion of assets financed by equity rather than debt. The practical significance of these findings lies in their potential real-world impact, highlighting the importance of shareholder involvement in management positions in improving a company’s financial performance and sustainability. In addition, the calculation of Cliff’s Delta effect sizes further supports the practical significance of our findings. Despite the lack of statistical significance, the small to medium effect sizes suggest meaningful differences in financial performance between the groups. Conversely, the DM3 group exhibited weaker financial performance than both DM1 and the majority of DM2 on most financial measures. These findings highlight the importance of considering the broader context and implications of our findings for decision making in the fintech industry.

6. Conclusions

This study has highlighted the intricate relationship between the presence of shareholders as directors and managers and the financial performance of Latvian fintech companies. While our analysis did not yield statistically significant differences in financial ratios across the DM groups, DM1 consistently demonstrated superior financial performance in terms of median values. The practical implications of our findings are noteworthy. For fintech firms, shareholder involvement in governance could serve as a strategic advantage, potentially leading to improved profitability, liquidity, and overall financial health. As shareholders themselves, managers and directors are likely to have a vested interest in maximizing shareholder value, which could translate into more prudent decision making and resource allocation. In addition, the alignment of interests between shareholders and management can mitigate agency conflicts and improve corporate governance practices, thereby promoting investor confidence and market stability. Moreover, the alignment of interests between shareholders and management may mitigate agency conflicts and enhance corporate governance practices, thereby fostering investor confidence and market stability.
However, it is imperative to approach these findings judiciously, given the existence of overlapping confidence intervals and the observed variability within DM2 and DM3. The lack of statistical significance can be attributed to a variety of factors, including the relatively small sample size and unobserved variables that could potentially impact financial performance results. The differences observed in DM2 and DM3 suggest that the impact of shareholder involvement in management roles may not be uniform across all fintech companies. Instead, it may depend on various factors, such as the company’s size, business model, management practices, and external market conditions.
Our investigation contributes to the ongoing discourse surrounding potential conflicts of interest, thereby highlighting nuanced dynamics that warrant careful consideration. The complex interplay among corporate governance structures, shareholder participation, and financial outcomes suggests that the manifestation of conflicts of interest defies simplistic linear relationships.
The study has some limitations. First, the financial performance of Latvian fintech companies is based only on data from the year 2022. The use of single-year data may not fully capture the long-term trends and variations in financial performance, and it may be influenced by specific economic conditions or industry dynamics present in that particular year. Second, there are a lack of quality data for fintech companies. While some companies may submit their balance sheets and profit/loss statements, the information provided can be limited, especially for micro-companies. This constraint might have influenced the precision and comprehensiveness of our analysis. Third, we used non-parametric tests, such as the Kruskal–Wallis test, due to the non-normal distribution of the financial data. While these tests are suitable for our data, they may have limitations compared to parametric tests, which could be employed with a larger and normally distributed dataset.
Although our study has inherent limitations, we believe that it provides valuable insights into the relationship between shareholder presence as directors and managers and the financial performance of the fintech industry. We aim to encourage further research efforts that build upon our findings and address the identified shortcomings. Future research could explore longitudinal studies that track the financial performance of Latvian fintech companies over multiple years. This approach would provide a more comprehensive understanding of long-term trends and variations in financial performance, enabling researchers to discern patterns and identify factors that influence financial outcomes over time. Furthermore, conducting cross-country comparative studies between different countries or regions is a promising direction for future research. By examining the financial performance of fintech companies across diverse regulatory environments, economic conditions, and market landscapes, researchers can gain insights into the factors driving variations in financial performance.

Author Contributions

Conceptualization, R.R.-A., V.G. and S.W.; methodology, R.R.-A. and S.W.; formal analysis, R.R.-A. and S.W.; investigation, R.R.-A. and S.W.; data curation, R.R.-A.; writing—original draft preparation, R.R.-A., S.W. and V.G.; writing—review and editing, R.R.-A., V.G. and S.W.; visualization, R.R.-A. and S.W. All authors have read and agreed to the published version of the manuscript.

Funding

This research received no external funding.

Data Availability Statement

Data are available from authors upon reasonable request.

Conflicts of Interest

The authors declare no conflicts of interest.

Appendix A

Table A1. Shapiro–Wilk test results.
Variable Name/
Statistics
ROAROEPMCRLRSR
Group DM1
Statistics0.4310.4860.4330.4280.4040.402
p value<0.001<0.001<0.001<0.001<0.001<0.001
Group DM2
Statistics0.2000.1480.2830.3550.3550.241
p value<0.001<0.001<0.001<0.001<0.001<0.001
Group DM3
Statistics0.5220.4560.5390.5850.5850.418
p value<0.001<0.001<0.001<0.001<0.001<0.001

Notes

1
In this study, we adopt the Orbis classification of directors and managers, encompassing board members, committee participants, and executives.
2
Even though very high levels of liquidity can be interpreted as inefficient use of financial resources, we do not consider the liquidity in any of the companies in the dataset as being excessive.

References

  1. Adams, John C., Darren K. Hayunga, Sattar Mansi, David M. Reeb, and Vincenzo Verardi. 2018. Identifying and Treating Outliers in Finance. Financial Management 48: 345–84. [Google Scholar] [CrossRef]
  2. Affes, Wajdi, and Anis Jarboui. 2023. The Impact of Corporate Governance on Financial Performance: A Cross-Sector Study. International Journal of Disclosure and Governance 20: 374–94. [Google Scholar] [CrossRef]
  3. Al-Matari, Ebrahim Mohammed, Mahfoudh Hussein Mgammal, Mushari Hamdan Alosaimi, Talal Fawzi Alruwaili, and Sultan Al-Bogami. 2022. Fintech, Board of Directors and Corporate Performance in Saudi Arabia Financial Sector: Empirical Study. Sustainability 14: 10750. [Google Scholar] [CrossRef]
  4. Bachiller, Patricia, Maria Cleofe Giorgino, and Sergio Paternostro. 2015. Influence of Board of Directors on Firm Performance: Analysis of Family and Non-Family Firms. International Journal of Disclosure and Governance 12: 230–53. [Google Scholar] [CrossRef]
  5. Bank of Latvia. 2020. FINTECH Glossary. Available online: https://www.bank.lv/en/publications-r/other-publications/fintech-glossary (accessed on 7 November 2023).
  6. Barnes, Paul. 1982. Methodological implications of non-normally distributed financial ratios. Journal of Business Finance and Accounting 9: 51–62. Available online: https://www.academia.edu/10486283/METHODOLOGICAL_IMPLICATIONS_OF_NON_NORMALLY_DISTRIBUTED_FINANCIAL_RATIOS (accessed on 14 August 2023). [CrossRef]
  7. Berle, Adolf Augustus, and Gardiner C. Means. 1991. The Modern Corporation and Private Property. New Brunswick: Transaction Publishers. [Google Scholar]
  8. Bonazzi, Livia, and Sardar M. N. Islam. 2007. Agency Theory and Corporate Governance: A Study of the Effectiveness of Board in Their Monitoring of the CEO. Journal of Modelling in Management 2: 7–23. [Google Scholar] [CrossRef]
  9. Brickley, James A., Jeffrey L. Coles, and Gregg Jarrell. 1997. Leadership Structure: Separating the CEO and Chairman of the Board. Journal of Corporate Finance 3: 189–220. [Google Scholar] [CrossRef]
  10. Caselli, Stefano, Stefano Gatti, Carlo Chiarella, Gimede Gigante, and Giulia Negri. 2023. Do Shareholders Really Matter for Firm Performance? Evidence from the Ownership Characteristics of Italian Listed Companies. International Review of Financial Analysis 86: 102544. [Google Scholar] [CrossRef]
  11. Chiavarini, Lorenzo, Renat Lokomet, Pierre Bonvalot, and Gayane Chagharyan. 2023. Latvian Fintech Landscape List|Dealroom. Co. Available online: https://app.dealroom.co/lists/19839 (accessed on 22 July 2023).
  12. Chrisman, James J. 2019. Stewardship Theory: Realism, Relevance, and Family Firm Governance. Entrepreneurship Theory and Practice 43: 1051–66. [Google Scholar] [CrossRef]
  13. Davis, James H., F. David Schoorman, and Lex Donaldson. 1997. Toward a Stewardship Theory of Management. The Academy of Management Review 22: 20–47. [Google Scholar] [CrossRef]
  14. Donaldson, Lex, and James H. Davis. 1991. Stewardship Theory or Agency Theory: CEO Governance and Shareholder Returns. Australian Journal of Management 16: 49–64. [Google Scholar] [CrossRef]
  15. Dospinescu, Octavian, Nicoleta Dospinescu, and Daniela-Tatiana Agheorghiesei. 2021. FinTech Services and Factors Determining the Expected Benefits of Users: Evidence in Romania for Millennials and Generation Z. E&M Economics and Management 24: 101–18. [Google Scholar] [CrossRef]
  16. Fama, Eugene F. 1980. Agency Problems and the Theory of the Firm. Journal of Political Economy 88: 288–307. [Google Scholar] [CrossRef]
  17. Fama, Eugene F., and Michael C. Jensen. 1983. Separation of Ownership and Control. The Journal of Law and Economics 26: 301–25. [Google Scholar] [CrossRef]
  18. Grima, Simon, Ramona Rupeika-Apoga, Murat Kizilkaya, Inna Romānova, Rebecca Dalli Gonzi, and Mihajlo Jakovljevic. 2021. A Proactive Approach to Identify the Exposure Risk to COVID-19: Validation of the Pandemic Risk Exposure Measurement (PREM) Model Using Real-World Data. Risk Management and Healthcare Policy 14: 4775–87. [Google Scholar] [CrossRef]
  19. Hoi, Chun-Keung, and Ashok Robin. 2010. Agency Conflicts, Controlling Owner Proximity, and Firm Value: An Analysis of Dual-Class Firms in the United States. Corporate Governance: An International Review 18: 124–35. [Google Scholar] [CrossRef]
  20. Hollander, Myles, Douglas A. Wolfe, and Eric Chicken. 2014. Nonparametric Statistical Methods, 3rd ed. Hoboken: John Wiley & Sons, Inc. [Google Scholar]
  21. Jain, Ruchika, Satinder Kumar, Kiran Sood, Simon Grima, and Ramona Rupeika-Apoga. 2023. A Systematic Literature Review of the Risk Landscape in Fintech. Risks 11: 36. [Google Scholar] [CrossRef]
  22. Jensen, Michael C., and William H. Meckling. 1976. Theory of the Firm: Managerial Behavior, Agency Costs and Ownership Structure. Journal of Financial Economics 3: 305–60. [Google Scholar] [CrossRef]
  23. Katalkina, Oksana, and Svetlana Saksonova. 2022. Crowdfunding Cross-Border Business Financing Practice: The Evidence from the Baltic States. Lecture Notes in Networks and Systems 410 LNNS. Cham: Springer, pp. 472–81. [Google Scholar] [CrossRef]
  24. Marx, Axel. 2016. Qualitative Comparative Analysis (QCA). Oxford: Oxford University Press. [Google Scholar] [CrossRef]
  25. Menyah, Kojo. 2013. Stewardship Theory. In Encyclopedia of Corporate Social Responsibility. Edited by Samuel O. Idowu, Nicholas Capaldi, Liangrong Zu and Ananda Das Gupta. Berlin/Heidelberg: Springer, pp. 2322–29. [Google Scholar] [CrossRef]
  26. Najaf, Khakan, Philip Sinnadurai, K. S. Devi, and Mohamed M. Dhiaf. 2022. Does Electronic Economics Matter to Financial Technology Firms? Electronic Commerce Research, 1–34. [Google Scholar] [CrossRef]
  27. Neralla, Narsa Goud. 2022. Can Corporate Governance Structure Effect on Corporate Performance: An Empirical Investigation from Indian Companies. International Journal of Disclosure and Governance 19: 282–300. [Google Scholar] [CrossRef]
  28. Ramachandran, Kandethody M., and Chris P. Tsokos. 2021. Chapter 13—Empirical Methods. In Mathematical Statistics with Applications in R, 3rd ed. Edited by Kandethody M. Ramachandran and Chris P. Tsokos. New York: Academic Press, pp. 531–68. [Google Scholar] [CrossRef]
  29. Raschka, Sebastian. 2013. Instant Heat Maps in R How-To. Birmingham: Packt Publishing. [Google Scholar]
  30. Rupeika-Apoga, Ramona, and Irina Solovjova. 2016. Profiles of SMEs as Borrowers: Case of Latvia. Contemporary Studies in Economic and Financial Analysis 98: 63–76. [Google Scholar] [CrossRef]
  31. Rupeika-Apoga, Ramona, and Stefan Wendt. 2022. FinTech Development and Regulatory Scrutiny: A Contradiction? The Case of Latvia. Risks 10: 167. [Google Scholar] [CrossRef]
  32. Rupeika-Apoga, Ramona, Emīls Dārziņš, Deniss Filipovs, and Stefan Wendt. 2023. Competitors and Partners at the Same Time: On the Role of Fintech Companies in the Latvian Financial Market. In The Fintech Disruption. Edited by Thomas Walker, Elaheh Nikbakht and Maher Kooli. Palgrave Studies Financial Services Technology. Cham: Springer International Publishing, pp. 115–38. [Google Scholar] [CrossRef]
  33. Sahid, Abdelkebir, Yassine Maleh, Shahram Atashi Asemanjerdi, and Pedro Antonio Martín-Cervantes. 2023. A Bibliometric Analysis of the FinTech Agility Literature: Evolution and Review. International Journal of Financial Studies 11: 123. [Google Scholar] [CrossRef]
  34. Saksonova, Svetlana, and Tatiana Papiashvili. 2021. Micro and Small Businesses Access to Finance and Financial Literacy of Their Owners: Evidence from Latvia, Estonia and Georgia. Lecture Notes in Networks and Systems 195: 667–77. [Google Scholar] [CrossRef]
  35. Sharma, Sachin Kumar, P. Vigneswara Ilavarasan, and Stan Karanasios. 2023. Small Businesses and FinTech: A Systematic Review and Future Directions. Electronic Commerce Research, 1–41. [Google Scholar] [CrossRef]
  36. Smith, Wendy K., Andy Binns, and Michael L. Tushman. 2010. Complex Business Models: Managing Strategic Paradoxes Simultaneously. Long Range Planning, Business Models 43: 448–61. [Google Scholar] [CrossRef]
  37. So, Jacky. 2006. Some Empirical Evidence On the Outliers and the Non-Normal Distribution of Financial Ratios. Journal of Business Finance & Accounting 14: 483–96. [Google Scholar] [CrossRef]
  38. Stano, Miron. 1975. Executive Ownership Interests and Corporate Performance. Southern Economic Journal 42: 272–78. [Google Scholar] [CrossRef]
  39. Startin. 2023. Latvian Startup Database. Latvian Startup Association Startin. LV. Available online: https://startin.lv/startup-database/ (accessed on 27 July 2023).
  40. Tzanaki, Anna, Liudmila Alekseeva, and José Azar. 2023. Common Ownership in Fintech Markets. New Working Paper Series, No. 329; Chicago, IL: University of Chicago Booth School of Business, Stigler Center for the Study of the Economy and the State. [Google Scholar]
  41. Zaidi, Syeda Hina, and Ramona Rupeika-Apoga. 2021. Liquidity Synchronization, Its Determinants and Outcomes under Economic Growth Volatility: Evidence from Emerging Asian Economies. Risks 9: 43. [Google Scholar] [CrossRef]
  42. Zhang, Jichang, Jing Long, and Alexandra Martina Eugenie von Schaewen. 2021. How Does Digital Transformation Improve Organizational Resilience?—Findings from PLS-SEM and fsQCA. Sustainability 13: 11487. [Google Scholar] [CrossRef]
Figure 1. Median heatmaps for financial ratios for DM1, DM2, and DM3.
Risks 12 00054 g001
Figure 2. Bootstrapped median distribution with confidence intervals.
Risks 12 00054 g002
Table 1. Descriptive statistics.
Variable Name/
Statistics
ROAROEPMCRLRSR
Min.−5.442−3.502−20.7650.0430.043−10.626
1st−0.145−0.027−0.2400.6350.6350.005
Median0.0210.1930.0681.3751.3270.295
3rd0.2470.6210.2574.2234.0350.686
Max.1.2943.1160.67323.88820.1620.960
not available--6222
Table 2. Kruskal–Wallis Test for financial ratios among the three groups DM1, DM2, and DM3.
Variable Name/
Statistics
ROAROEPMCRLRSR
Chi-Square1.17851.58663.91951.29241.00980.41495
Df222222
Asymp. Sig.0.55470.45240.14090.5240.60360.8126
Table 3. Cliff’s Delta effect sizes for financial ratios among the three groups DM1, DM2, and DM3.
Variable Name/
Statistics
ROAROEPMCRLRSR
DM1–DM2negligiblenegligible0.194 (small)negligiblenegligiblenegligible
DM1–DM3negligible0.222 (small)0.333 (medium)0.186 (small)0.214 (small)negligible
DM2–DM3negligible0.245 (small)0.214 (small)0.195 (small)0.195 (small)negligible
Disclaimer/Publisher’s Note: The statements, opinions and data contained in all publications are solely those of the individual author(s) and contributor(s) and not of MDPI and/or the editor(s). MDPI and/or the editor(s) disclaim responsibility for any injury to people or property resulting from any ideas, methods, instructions or products referred to in the content.

