Article

Unveiling Outperformance: A Portfolio Analysis of Top AI-Related Stocks against IT Indices and Robotics ETFs

1
Laboratory BESTMOD, University of Sfax, Sfax 3029, Tunisia
2
College of Business Admiration and Finance, Saudi Electronic University, Riyadh 11673, Saudi Arabia
3
Institute of Financial and Insurance Sciences, University of Lyon, University Claude Bernard Lyon 1, LSAF-EA2429, F-69007 Lyon, France
4
Faculty of Economics and Management of Mahdia, University of Monastir, Monastir 5000, Tunisia
*
Author to whom correspondence should be addressed.
Risks 2024, 12(3), 52; https://doi.org/10.3390/risks12030052
Submission received: 4 February 2024 / Revised: 28 February 2024 / Accepted: 8 March 2024 / Published: 13 March 2024

Abstract

:
In this study, we delve into the financial market to compare the performance of prominent AI and robotics-related stocks against traditional IT indices, such as the Nasdaq, and specialized AI and robotics ETFs. We evaluate the role of these stocks in diversifying portfolios, analyzing their return potential and risk profiles. Our analysis includes various investment scenarios, focusing on common AI-related stocks in the United States. We explore the influence of risk management strategies, ranging from “buy and hold” to daily rebalancing, on AI stock portfolios. This involves investigating long-term strategies like buy and hold, as well as short-term approaches, such as daily rebalancing. Our findings, covering the period from 30 April 2021, to 15 September 2023, show that AI-related stocks have not only outperformed in recent years but also highlight the growing “AI bubble” and the increasing significance of AI in investment decisions. The study reveals that these stocks have delivered superior performance, as indicated by metrics like Sharpe and Treynor ratios, providing insights into market trends and financial returns in the technology and robotics sectors. The results are particularly relevant for investors and traders in the AI sector, offering a balanced view of potential returns against the risks in this rapidly evolving market. This paper adds to the financial market literature by demonstrating that investing in emerging trends, such as AI, can be more advantageous in the short term compared to traditional markets like the Nasdaq.
JEL Classification:
G1; L25; P45

1. Introduction

In his groundbreaking paper titled “Computing Machinery and Intelligence”, published in 1950, Alan Turing introduced the concept of the “imitation game”. This idea was pivotal in exploring the capability of machines to emulate human thought processes. Turing’s approach marked a significant shift in the discourse on machine intelligence, moving the question from “Can machines think?” to “Can machines imitate thinking beings?” This philosophical change was crucial in establishing AI as a formal field of study in 1956. Since its inception, the primary goal of AI has been to create algorithms that replicate various human behaviors, including problem-solving and making inferences, as discussed by Chrisley and Begeer (2000) and McCarthy in 2007.1
Over the past ten years, AI systems have seen remarkable advancements, often exceeding human performance in complex tasks. This rapid progression is attributed to several factors: the availability of more data, enhancements in hardware, refinements in algorithms, and the proliferation of open-source libraries. These developments have significantly empowered developers and researchers in establishing new models, as noted by Došilović et al. (2018). The impact of these advancements is widespread, touching various fields such as medicine, finance, agriculture, autonomous vehicles, robotics, and social media. This influence is documented in studies by Holzinger et al. (2019), Bahrammirzaee (2010), Königstorfer and Thalmann (2020), Bannerjee et al. (2018), Tong et al. (2019), Vrontis et al. (2022), and Ozbay and Alatas (2020), highlighting the diverse applications and profound effects of AI across these sectors.
Both GPT-3.5 and GPT-4, large language models (LLMs), have shown remarkable abilities when compared to other similar models. In coding tasks, they have demonstrated exceptional skill, as noted by Destefanis et al. (2023). These models also performed impressively on demanding tests such as the US Bar Exam, as highlighted by Katz et al. (2023). Furthermore, they have shown proficiency in predicting stock prices, as discussed by Lopez-Lira and Tang (2023). ChatGPT in particular has attracted over 100 million users, significantly increasing OpenAI’s valuation to an estimated 29 billion USD, according to Hu (2023). This surge in popularity has not only introduced AI to a broader audience but also captured the interest of the scientific and industrial communities, as indicated by research from Dwivedi et al. (2023) and Dowling and Lucey (2023).
The current business landscape shows a significant shift towards AI projects, a trend that is evident in the increasing mentions of AI in corporate earnings reports. This focus on AI often overshadows other considerations, such as environmental, social, and governance (ESG) factors, as pointed out by Vidal-Tomás and Bartolucci (2023)2. Leading tech companies like Google, Microsoft, and Meta are rapidly developing AI products through platforms like Bard, Bing, and LLaMA, according to Shakir in 2023.3 This heightened interest in AI is not limited to software; it also encompasses hardware, with companies like Nvidia leading the charge. Nvidia has responded to the growing demand for AI chips and has notably reached a 1 trillion USD market capitalization on Wall Street, as reported by Goodkind in 2023.4 Nvidia’s financial success is further highlighted by a 26% increase in profits to $2 billion and a 19% increase in sales to $7.2 billion in the latest quarter, exceeding analysts’ predictions. This enthusiasm for AI development aligns with a broader trend that began in 2016. During this period, established companies heavily invested in internal AI projects and AI-related mergers and acquisitions. There was also a 40% increase in venture capital funding for innovative AI startups, as observed by Huynh et al. (2020).
The adoption of AI technologies by leading chipmakers and development companies has significantly boosted the stock market values of numerous tech firms. While OpenAI remains privately held, over a dozen AI-involved companies are now part of the S&P 500 index. A notable example is Nvidia, which saw its stock price jump by 23% after announcing strong financial results on 24 May. Since the start of the year, Nvidia’s stock value has doubled, ranking it as the fifth-most valuable publicly traded company in the US, according to a 7 July report by The Economist.
The impact of AI technologies, including innovations like ChatGPT, is widespread in the technology sector. This influence is visible in the rising prices of computer hardware, with companies like Super Micro Computer demonstrating significant growth. In the software infrastructure realm, firms such as CrowdStrike Holdings have also seen their values increase. Similarly, in the fields of software applications and semiconductors, companies like Salesforce and Arista Networks have experienced notable price surges. This overarching trend underscores AI’s profound and extensive influence in the global financial market. In our study, we aim to analyze the performance of these AI-integrated firms over the past year, comparing them as a portfolio to traditional IT stocks represented by the Nasdaq, as well as to global companies engaged in AI and chip production, represented by AI and robotics ETFs. This comparison will provide insights into the impact of AI on stock performance in the current financial landscape.
In their study, Abakah et al. (2023a, 2023b) focus on the increasing concerns among investors regarding the risks posed by climate change, especially as they relate to technology-driven financial assets in the fintech sector. The research highlights the effectiveness of S&P Treasuries and S&P Green Bonds in reducing investment risks within the fintech industry. Additionally, the study identifies S&P Global Clean Energy as a significant hedge, particularly when considering long-term momentum. This research, along with works by Li et al. (2017), David et al. (2022), Feyen et al. (2021), Dranev et al. (2019), Bhatnagar et al. (2022), Rupeika-Apoga and Wendt (2022), and Horn et al. (2020), as well as Wu et al. (2020), collectively emphasizes the rising global importance of the fintech industry. They note its rapid development and increasingly significant role in the broader technology sector.
The influence of AI is particularly evident in technology-focused businesses, especially in the field of robotics. This trend is in line with the broader patterns of the fourth industrial revolution, where AI and robotics are identified as critical technologies. As explained by Huynh et al. (2020), the transformative power of these advancements is altering the industrial landscape, blurring the lines between the physical, digital, and biological spheres. The past decade has witnessed remarkable advancements in AI and robotics, as detailed by Felten et al. (2018) and Furman and Seamans (2019). A striking example of this growth is the 150% increase in global robot shipments from 2010 to 2016. Additionally, the demand for jobs requiring AI skills soared nearly fivefold from 2013 to 2016, indicating a significant shift in workforce dynamics, as reported by Furman and Seamans (2019). Bughin et al. (2017) also highlight the rapid increase in investments in AI, reflecting the growing importance of this technology in business.
The impact of AI and robotics on employment presents a multifaceted and complex issue, especially in the short term. Extensive research has delved into this topic, revealing a range of effects on job markets. Key studies by Acemoglu and Restrepo (2018, 2020), Brynjolfsson et al. (2018), Furman and Seamans (2019), and Graetz and Michaels (2018) have shed light on the varied implications of AI and robotics across different sectors. Additionally, in the context of financial markets and investment strategies, researchers like Dirican (2015) and Furman and Seamans (2019) have examined how AI and robotics influence business models and the broader economy, with a particular focus on portfolio diversification. Despite this extensive research, there remains a notable gap in studies specifically examining the role of stocks from AI and robotics companies in diversifying investment portfolios. Existing literature primarily focuses on technology-intensive companies (Chen and Lin 2014; Smales 2019), IT firms (Kamssu et al. 2003; Jawadi et al. 2013), and cleantech companies (Ortas and Moneva 2013). This lack of specific focus on AI and robotics sector stocks highlights an untapped area of inquiry. Our study aims to fill this gap by specifically analyzing the performance of AI and robotics company stocks in investment portfolios, thus contributing to a more nuanced understanding of their role in the contemporary financial landscape.
Baur and Glover (2012) suggested that the increased interest in speculative and hedging investments has potentially altered the role of gold, traditionally seen as a safe haven. This shift reflects a broader trend in the financial markets, where investors are continuously seeking new avenues for risk management. Hedging as a strategy has evolved beyond conventional assets like gold or government bonds. The modern financial landscape now offers a variety of instruments and markets for hedging, including derivatives, real estate, and even niche sectors (Dammak et al. 2023). These developments represent a more sophisticated approach to risk mitigation, catering to diverse investor profiles and objectives. This expansion in hedging strategies is indicative of an adaptive and dynamic financial ecosystem, responding to global economic changes and investor needs. These include alternative avenues for diversifying portfolios and hedging risk, similar to the roles traditionally played by safe investments like Nasdaq and ETFs. Recent data from Mind the Bridge (first half of 2023) reveal significant growth in the AI sector in Silicon Valley. A total of 2101 AI scaleups have been identified, accounting for 22% of the total, with over 350 (17%) specializing in generative AI. The cumulative capital raised by these AI scaleups is an impressive $143.7 billion, indicating a vibrant and innovative AI startup ecosystem. Therefore, it represents a real opportunity of investment for speculators and a new field of diversification for investors. Our study will stress these points by testing the performance of the most common stocks related to AI, individually and within a portfolio.
Jiang et al. (2011) observed that the volatility and performance of these technology stocks tend to surpass that of the overall equity market, a trend that is also common in conventional stocks. In contrast, Huynh et al. (2020) delved into the specific role of AI, robotics stocks, and green bonds in diversifying investment portfolios. Their study highlights two pivotal findings. Firstly, portfolios that include these assets often exhibit heavy-tail dependence, indicating a high probability of significant joint losses during periods of economic instability. Secondly, they observed that volatility transmission among these assets is more pronounced in the short term. This suggests that short-term market disturbances can amplify volatility in these specific assets. However, this volatility transmission appears to taper off over the long term. Our study builds on this foundation, aiming to offer a more nuanced understanding of the unique characteristics and investment potential of AI and robotics company stocks within diversified portfolios.
Furthermore, recent advancements in financial technology, or fintech, have revolutionized the landscape of investment and portfolio management. The integration of AI and robotics within fintech solutions has not only streamlined financial operations but also opened up new avenues for investors. Fintech applications range from algorithm-driven trading to personalized financial planning, demonstrating how technology is reshaping the financial sector. This sector has seen accelerated growth following the global economic crisis of 2008. Fintech has been instrumental in meeting the evolving financial needs of people living in modern smart cities, as noted by Popova (2021). Moreover, this growth has been further propelled by worldwide health emergencies, such as the COVID-19 pandemic, which have had a significant effect on the global economy, as discussed by Vasenska et al. (2021). In another study, Bhatnagar et al. (2022) explored the risk–return relationship within the Indian fintech sector. They emphasized the need to consider the risks associated with investments in this area.
Dranev et al. (2019) observed that while fintech companies initially experience positive returns following mergers and acquisitions, there tends to be a significant long-term negative return. This pattern reflects broader concerns in the rapidly expanding fintech market. Despite attracting considerable investor interest, the market contends with challenges such as risk factors and regulatory uncertainties. In advanced economies, the fintech sector, being relatively new, faces ongoing issues with regulatory frameworks, as Rupeika-Apoga and Wendt (2022) have pointed out. This burgeoning industry also poses challenges for authorities in developing countries, who may lack the resources to effectively manage and adapt to technological advancements, as discussed by Wu et al. (2020). Additionally, evaluating the impact of fintech on financial stability is complicated due to the scarcity of data, a point highlighted by Xu and Zou (2022). In this context, our study examines the burgeoning influence of AI and robotics, not just as technological innovations but also as pivotal elements in modern investment strategies. The rapid growth and integration of AI and robotics in various sectors, including fintech, highlight the need to understand their impact on the financial market. Specifically, we focus on the role of AI and robotics company stocks in diversifying investment portfolios. This exploration is particularly relevant in the fintech era, where technology-driven financial solutions are becoming increasingly prominent. By analyzing the performance of these stocks against traditional investment benchmarks, we aim to uncover insights into their viability and potential as part of a modern, technology-aware investment portfolio.
In our research, we focus on evaluating the stock performance of seven prominent technology and robotics companies over the past three years. The companies selected for this analysis are Nvidia Corporation, Symbotic Inc. (Wilmington, MA, USA), Helix Energy Solutions Group, Inc. (Houston, TX, USA), C3.ai, Inc. (Redwood City, CA, USA), ATS Corporation, Intuitive Surgical, Inc. (Sunnyvale, CA, USA), and PROS Holdings, Inc. (Houston, TX, USA).5 The study encompasses the period from 30 April 2021 to 15 September 2023, providing insights into the market trends and financial returns of these leading firms in the technology and robotics sector. Specifically, we assess their performance in comparison to well-known US IT indices such as Nasdaq and a notable AI and robotics ETF. Additionally, we incorporate US bonds, considered safe assets, to evaluate the excess returns and examine the performance of these stocks relative to safer investments.
Our methodology involves evaluating various investment strategies, focusing particularly on the most effective AI-related stock portfolios. A key objective is to determine whether the global expansion of AI investments is justified, considering both return and risk metrics. A central question addressed in Huynh et al. (2020) is the connection between AI and robotics stocks and other asset classes, such as green and crypto assets, and their potential as diversification tools. Then, we focus on constructing different portfolios based on variance and return over time to assess their performance in comparison to both indices and to the separate investment strategies. Our approach is tied to the idea of giving insights for investors on the best strategy for investing in top AI stocks and if it could outperform investment in IT stocks or the Global AI Index.
This paper offers a crucial analysis of the increasing value of AI in the investment world, highlighting a recent surge in interest towards AI stocks, driven by their potential for higher profitability. It underscores the strategic importance of AI in business, marked by a spike in investments following the advent of breakthrough technologies such as ChatGPT. The paper delves into the market effects of incorporating AI, particularly by leading companies like Nvidia, indicating that certain AI-focused firms may outperform general IT indices. Additionally, it stresses the importance of careful portfolio construction and analysis for evaluating risk and return, providing vital insights for investors considering the inclusion of AI stocks in their investment strategies.
Our research offers key insights for both professional traders focusing on AI stocks and for the academic community studying the performance of IT-related stocks in diversified portfolios. Our findings indicate that in recent years, top AI-related stocks have generally outperformed both the AI and robotics ETF indices and the Nasdaq index. However, performance among these stocks has been varied, particularly in the short term. Across different market conditions, portfolios composed primarily of AI stocks have consistently outshone market benchmarks, yielding a desirable active premium for investors. Specifically, stocks such as NVDA, HLX, ATS, and SYM have demonstrated high returns and strong investor demand. In contrast, some stocks have underperformed, showing lesser gains than even US bonds, which typically have a minimal daily performance of just 0.01%. Our analysis also reveals a trend towards higher cumulative returns in various portfolio configurations, with some potentially reaching as high as 2.831.
Moreover, strategies that involve regular rebalancing of portfolios have consistently delivered better outcomes. This highlights the significance of effective risk management in AI stock investments during the studied period. In terms of risk analysis, our study corroborates Huynh et al. (2020), confirming a significant correlation between the risk profiles of AI stocks and the Nasdaq IT index. This relationship is particularly evident through high beta-coskewness and beta-cokurtosis values, suggesting notable tail risk in AI stock investments compared to the broader IT index.
The structure of this paper is as follows. In Section 2, we delve into the methodology employed for this study. Section 3 provides an overview of the data sources and descriptions. Section 4 is dedicated to presenting the results and engaging in a discussion of these findings. Finally, Section 5 concludes the paper, not only summarizing our key findings but also opening avenues for future research.

2. Methodological Issues

2.1. Return, Risk Premium, and Cumulative Return: Investment and Reinvestment

The rate of return of an equity j from the AI stocks at time t has been computed as:
r j , t = p j , t p j , t 1 p j , t 1
where p j , t is the closing price of asset j in period t , and p j , t 1 at time t 1 . For the calculation of the stock return, we do not include the dividend distribution. However, for the calculation of the time-series risk premium, we use the return to implement the CAPM risk premium formula. Then, the premia are calculated using the classical formula as follows:
r p j , t = r j , t r f t
The risk premia are represented by r p , while the risk-free rate is represented by rf in our case by US bonds. The premium for investing is required for comparing portfolio performance to investment in the safest asset. This comparison is included in our study even when considering market indices as alternative safe assets.
We focus on the differential between investing in AI stocks and the risk-free rate, as represented by US bonds, to gauge investor demand for higher compensation. This approach stems from the anticipation of a higher risk premium associated with AI stocks, a consequence of their pronounced speculation and volatility in recent years. Additionally, there is significant market uncertainty concerning these stocks, partly due to concerns that they may represent a speculative bubble. This uncertainty is heightened by the unpredictable nature of AI technology’s rapid evolution and its impact on market dynamics. As such, investors in AI stocks are potentially exposed to greater risks, warranting a higher risk premium as compensation.
The arithmetic formula represents the sum of returns for each penny invested separately in each stock, whereas a geometric formula coins the reinvestment of money generated at each time t 1 in time t . Booth and Fama (1992) studied the arithmetic and geometric returns, and they highlighted their importance for the determination portfolio performance. In their study, they find a relation between both metrics according to the following formula:
g r ¯ 1 2 σ 2
where g is the geometric return and r the arithmetic return, with σ 2 the variance of the returns. In line with Willenbrock (2011), who assumed that arithmetic mean return is misleading, we use both arithmetic and geometric to determine the stock’s performance. Arithmetic cumulative return indicates that investors can generate return by only keeping investment separate at each time t. However, investors try to keep reinvesting the money in profitable markets, so they could generate the highest possible return. To measure the cumulative arithmetic return, we use the following formula:
ι j , t = r j , t ι j , t 1
where ι j , t stands for the arithmetic cumulative sum of the stock return j at time t. For the calculation of the geometric sum at each time t, we use the following formula:
ι j , t = ι j , t 1 1 + r j , t
where ι j , 0 equals 1 + r j , 0 at time 0. Our estimation of geometric cumulative return can give us a better understanding of the return evolution from one penny reinvested till the end of the period. To comprehend the incoming return for AI stocks, we use risk–return metrics like the Sharpe ratio.
We employ both arithmetic and geometric measures to compare different investment approaches over time. The geometric return, akin to a rebalancing portfolio strategy, mirrors the process of reinvesting earnings from one time period ( t ) to the next ( t + 1 ). This approach is reflective of a continuous reinvestment strategy, where returns are compounded over time. In contrast, the arithmetic return is more representative of a strategy where rebalancing occurs at each time period ( t ), with an equal amount of money being invested in every stock. This method calculates the average return per period without considering the compounding effect.
We calculate the cumulative return and risk premium to evaluate the remuneration received by investors under different scenarios. We operate under the assumption that companies heavily investing in AI technology are likely to offer better returns than the broader IT market and the risk-free rate, typically represented by US Treasury bonds. However, this potential for higher returns is not without its risks. The nascent nature of AI technology and its unpredictable future, coupled with a still-developing regulatory landscape, introduces a significant risk of underperformance. To account for these risks and provide a comprehensive assessment of performance, we incorporate several key metrics in our analysis. These include the Sharpe ratio, which measures the excess return per unit of risk; the maximum drawdown, indicating the largest single drop from peak to trough in the value of the portfolio; and the downside risk ratio, which focuses specifically on returns that fall below a minimum threshold.

2.2. The Construction of Portfolios

In this section, we delve into the construction of investment portfolios, focusing on AI stocks. The calculation of risk premium varies across markets and depends on the specific hypotheses being tested. Our primary objective is to determine whether AI stocks offer superior performance compared to the global IT benchmark and the risk-free rate, represented here by American bond yields. To calculate the returns for a portfolio of top AI stocks, we adopt three distinct approaches, aligning with the rebalancing strategy suggested by Hanicova and Vojtko (2021). Employing these varied frameworks is crucial for simulating real-world investor strategies and providing insights into the performance of portfolios at different scales. We aim to identify which approach demands higher remuneration or premium from investors and to pinpoint the most profitable strategy using popular AI stocks.
In our analysis, we compare different portfolio setups against benchmarks such as the Nasdaq market index, safe assets like US bonds, and AI-related ETFs (AI_index). To assess portfolio performance, we use various indicators related to risk, dispersion, and co-movement. One key metric is the value at risk (VaR), which estimates potential losses under adverse market conditions. The VaR assessment is particularly insightful for understanding the risk premium required during times of significant market risk. Moreover, we recognize that measuring returns alone does not fully capture portfolio performance. Therefore, we utilize an adjusted anticipated return method, modifying the return by incorporating the VaR value. This approach offers a more accurate representation of the expected return on a stock relative to its potential risk.
It is important to note that AI stocks are largely part of both the Nasdaq index and the ETF used as an AI index. Consequently, the risks associated with these portfolios and indices are closely related, especially during significant market shocks. In recent years, periods of high risk and crisis have become more frequent. To further validate the robustness of our findings on portfolio performance, we examine the tail relationships over time using metrics like coskewness and cokurtosis.
We further delve into the considerations of transaction costs, taxation, and resilience to market volatilities, specifically in the context of equally weighted and buy-and-hold portfolio strategies. For equally weighted portfolios, which require regular rebalancing to maintain equal asset weightings, we observe an inclination towards higher transaction costs. This is attributable to the frequent trading necessary for rebalancing, which can erode the net profitability of these investments, particularly in the short term. Additionally, the regular realization of gains in such portfolios may lead to increased capital gains taxes, affecting the overall investment returns. Conversely, buy-and-hold strategies are characterized by lower transaction costs due to their less frequent trading nature. Investors typically incur costs mainly at the start and end of the investment period. The extended holding period associated with buy-and-hold strategies also often qualifies for lower long-term capital gains taxes, which can significantly enhance their net profitability.
Regarding market volatilities, equally weighted portfolios offer inherent diversification, providing a degree of protection against market fluctuations. The equal distribution across assets mitigates the impact of a decline in any single investment. However, this approach may prevent the portfolio from fully benefiting from the high performance of individual assets. In contrast, buy-and-hold portfolios, depending on their composition, tend to show substantial resilience to market shocks. While they may be affected by short-term market downturns, they generally recover over time, in line with the market’s long-term growth trajectory. Compared to active trading strategies, both equally weighted and buy-and-hold portfolios are typically more adept at withstanding and recovering from market volatilities, owing to their diversified nature and diminished sensitivity to short-term market movements. It is crucial to note, however, that the success of these strategies in countering market shocks is also contingent upon the selection of specific assets and the overall market conditions.
In summary, equally weighted portfolios provide diversification benefits and potential resilience to market fluctuations, but may be more prone to higher transaction costs and taxation. Buy-and-hold strategies, while benefiting from lower transaction costs and favorable tax treatments, may not offer the same level of diversification as equally weighted portfolios. Investors should consider these factors alongside their risk tolerance and investment horizon when choosing between these strategies.

Equally Weighted Portfolios and Buy-and-Hold Portfolios

The most common strategy on the market is to use an equally weighted portfolio, where investors try to distribute their wealth equally across all the available assets. In our setup, we have only seven assets composed of AI stocks. The calculation of the equally weighted portfolio is based on the most common setting, which is the minimum-variance portfolio. To determine the minimum variance, weights must be determined by optimizing the following constraint:
m i n w T V w s . t . w T I = 1
where w is the vector of N weights w = ( w 1 , w 2 , w 3 , w 4 w N ) and V is the covariance matrix of the seven assets used. In our case, N = 7, so we have only seven risky assets to determine their weights. I stands for the unit vector for only ones, and T represents the transposition of the vector. The return of the portfolio is calculated using the formula r p = w T r , where r represents the vector of returns for the selected equities. In our case, we do not allow for short selling by imposing a constraint over the weights not to be allowed under 0 ( w 0 ). To determine the weights, the following solution for the constraint is used:
w = V 1 I I T V 1 I
The estimated optimal weights are the best for holding assets over all the studied periods. For the equally weighted portfolios, the weights do not need to be solved using the constraint. We only change the weights vector with each w to 1 / N .
We use the rebalancing portfolio to adjust the portfolio on a daily basis to obtain optimal weights at each time t. We adjust w = ( w 1 , w 2 , w 3 , w 4 w N ), with seven assets. The strategy is to keep track of the portfolio and minimize the risk at each time t to obtain higher return. The algorithmic model allows to build an optimal portfolio at each time t, considering the current and previous weights. We add a control variable to assess the target of optimization of the portfolio. The rebalancing depends on different constraints like the budget cost, optimizing the quadratic utility, and minimizing the future costs. The quadratic utility function can be represented by the following formula:
U . F : f x = r α 2 r r 0 2
E . U : U μ , σ = μ α 2 σ 2
where α stands for risk aversion. We use the quadratic utility function to rebalance the portfolio and get the optimized weights for higher expected utility. We use the same models utilized by Yu and Lee (2011) and Yu et al. (2017) to build our rebalanced portfolio with three objectives. The first is the maximization of the portfolio return at each time t. Moreover, we minimize the risk of portfolios’ risks based on the variance. The third metric is the minimum and maximum costs invested to set the budget limits. The fourth is the minimization of the short selling and limiting the investment weights to 1. The formula for optimization of the rebalancing portfolio is as follows:
Max i = 1 n r i w i + w i
Min i = 1 n ( w i + w i ) 2 σ i 2 + i = 1 n j = 1 ( j i ) n σ i j ( w i + w i ) ( w j + w j ) ,
Min i = 1 n w i ,
Min i = 1 n ( p 1 l i + + p 2 l i + p 3 s i + + p 4 s i ) ,
s . t . i = 1 n ( w i + + k w i + p 1 l i + + p 2 l i + p 3 s i + + p 4 s i ) = 1 , w i + = w i , 0 + + l i + l i , w i = w i , 0 + s i + s i , 0.05 u i w i + 0.1 u i , 0.05 v i w i 0.1 v i , u i + v i = y i ,
for   i = 1 , , n ,
where w i , 0 + stands for the proportion of AI stock at time t bought by investors prior to portfolio rebalancing and w i , 0 is the proportion of AI stock I bought to buy the new AI stock. Therefore, w i + is the total proportion bought at each time t before rebalancing, and w i sums the proportion bought before the new composition of the portfolio. With each rebalancing, l i + is the proportion of stocks sold, on the other hand, l i is the proportion sold, and s i + and s i are the proportion of the bought-short and sold-short assets, respectively, over time. However, in our model, we eliminate short selling, for u i and v i are the buying or selling situation for each asset. In our model, we eliminate the initial short selling k and add a budget constraint using the following formula:
0 w i + w i 1
0.05 σ i 2 0.1
We add the above constraints to the risk budget portfolio, while for the robust portfolio, we optimize the weight based on all the metrics in the preceding period with risk and return. Instead for the first rebalanced portfolio on a monthly basis, we use a starting point with an equally weighted portfolio, then we keep rebalancing every month to obtain a higher return. Therefore, our portfolio settings for rebalancing consist of four types. The first is a buy and hold used for optimizing the quadratic utility function. The second is a daily rebalancing according to the previous performance. Then, the third is a risk budget, where we limit the variance to an interval of 5%. The fourth is a robust portfolio using all moments, which consist of adjusting the portfolio consistently to every shift for risk or return. For the classical portfolios, we use a long-term buy and hold using the optimal composition over time. Finally, we use a monthly rebalancing starting from an equally weighted point.

3. Data Source and Description

3.1. Data Collection

This research, spanning from 30 April 2021, to 15 September 2023, investigates the performance of seven leading AI companies with the highest market values, as well as specific indices. These companies, identified through top analytical websites, include Nvidia (NVDA), Symbotic (SYM), Helix (HLX), C3.ai (AI), ATS, Intuitive Surgical (ISRG), and PROS (PRO). Alongside these companies, we analyze the AI_index, represented by the GLB.X ROBOTICS & ARTL. INTGE.THEMATIC ETF from DataStream Refinitiv, the Nasdaq as the IT index, and US bond prices. The selection of these companies and indices was based on criteria such as market value, technological impact in the AI sector, and inclusion in the AI_index. This approach ensures a representative analysis of AI investments. The AI_index was chosen for its broad spectrum of AI and robotics firms, while the Nasdaq index serves as a traditional IT sector benchmark, facilitating a comparative analysis. The inclusion of US bond prices provides a baseline for risk-free rate assessment.
Our study conducts a dual analysis: firstly, examining the individual growth of these AI companies over the last three years, and secondly, exploring various portfolio configurations using these stocks. This methodology enables a comparison of direct investment in leading AI companies against broader AI and traditional IT indices. The rationale behind this selection is to capture a comprehensive view of AI’s current market status and its investment potential, thus offering valuable insights into the AI sector’s performance and prospects in the financial landscape.

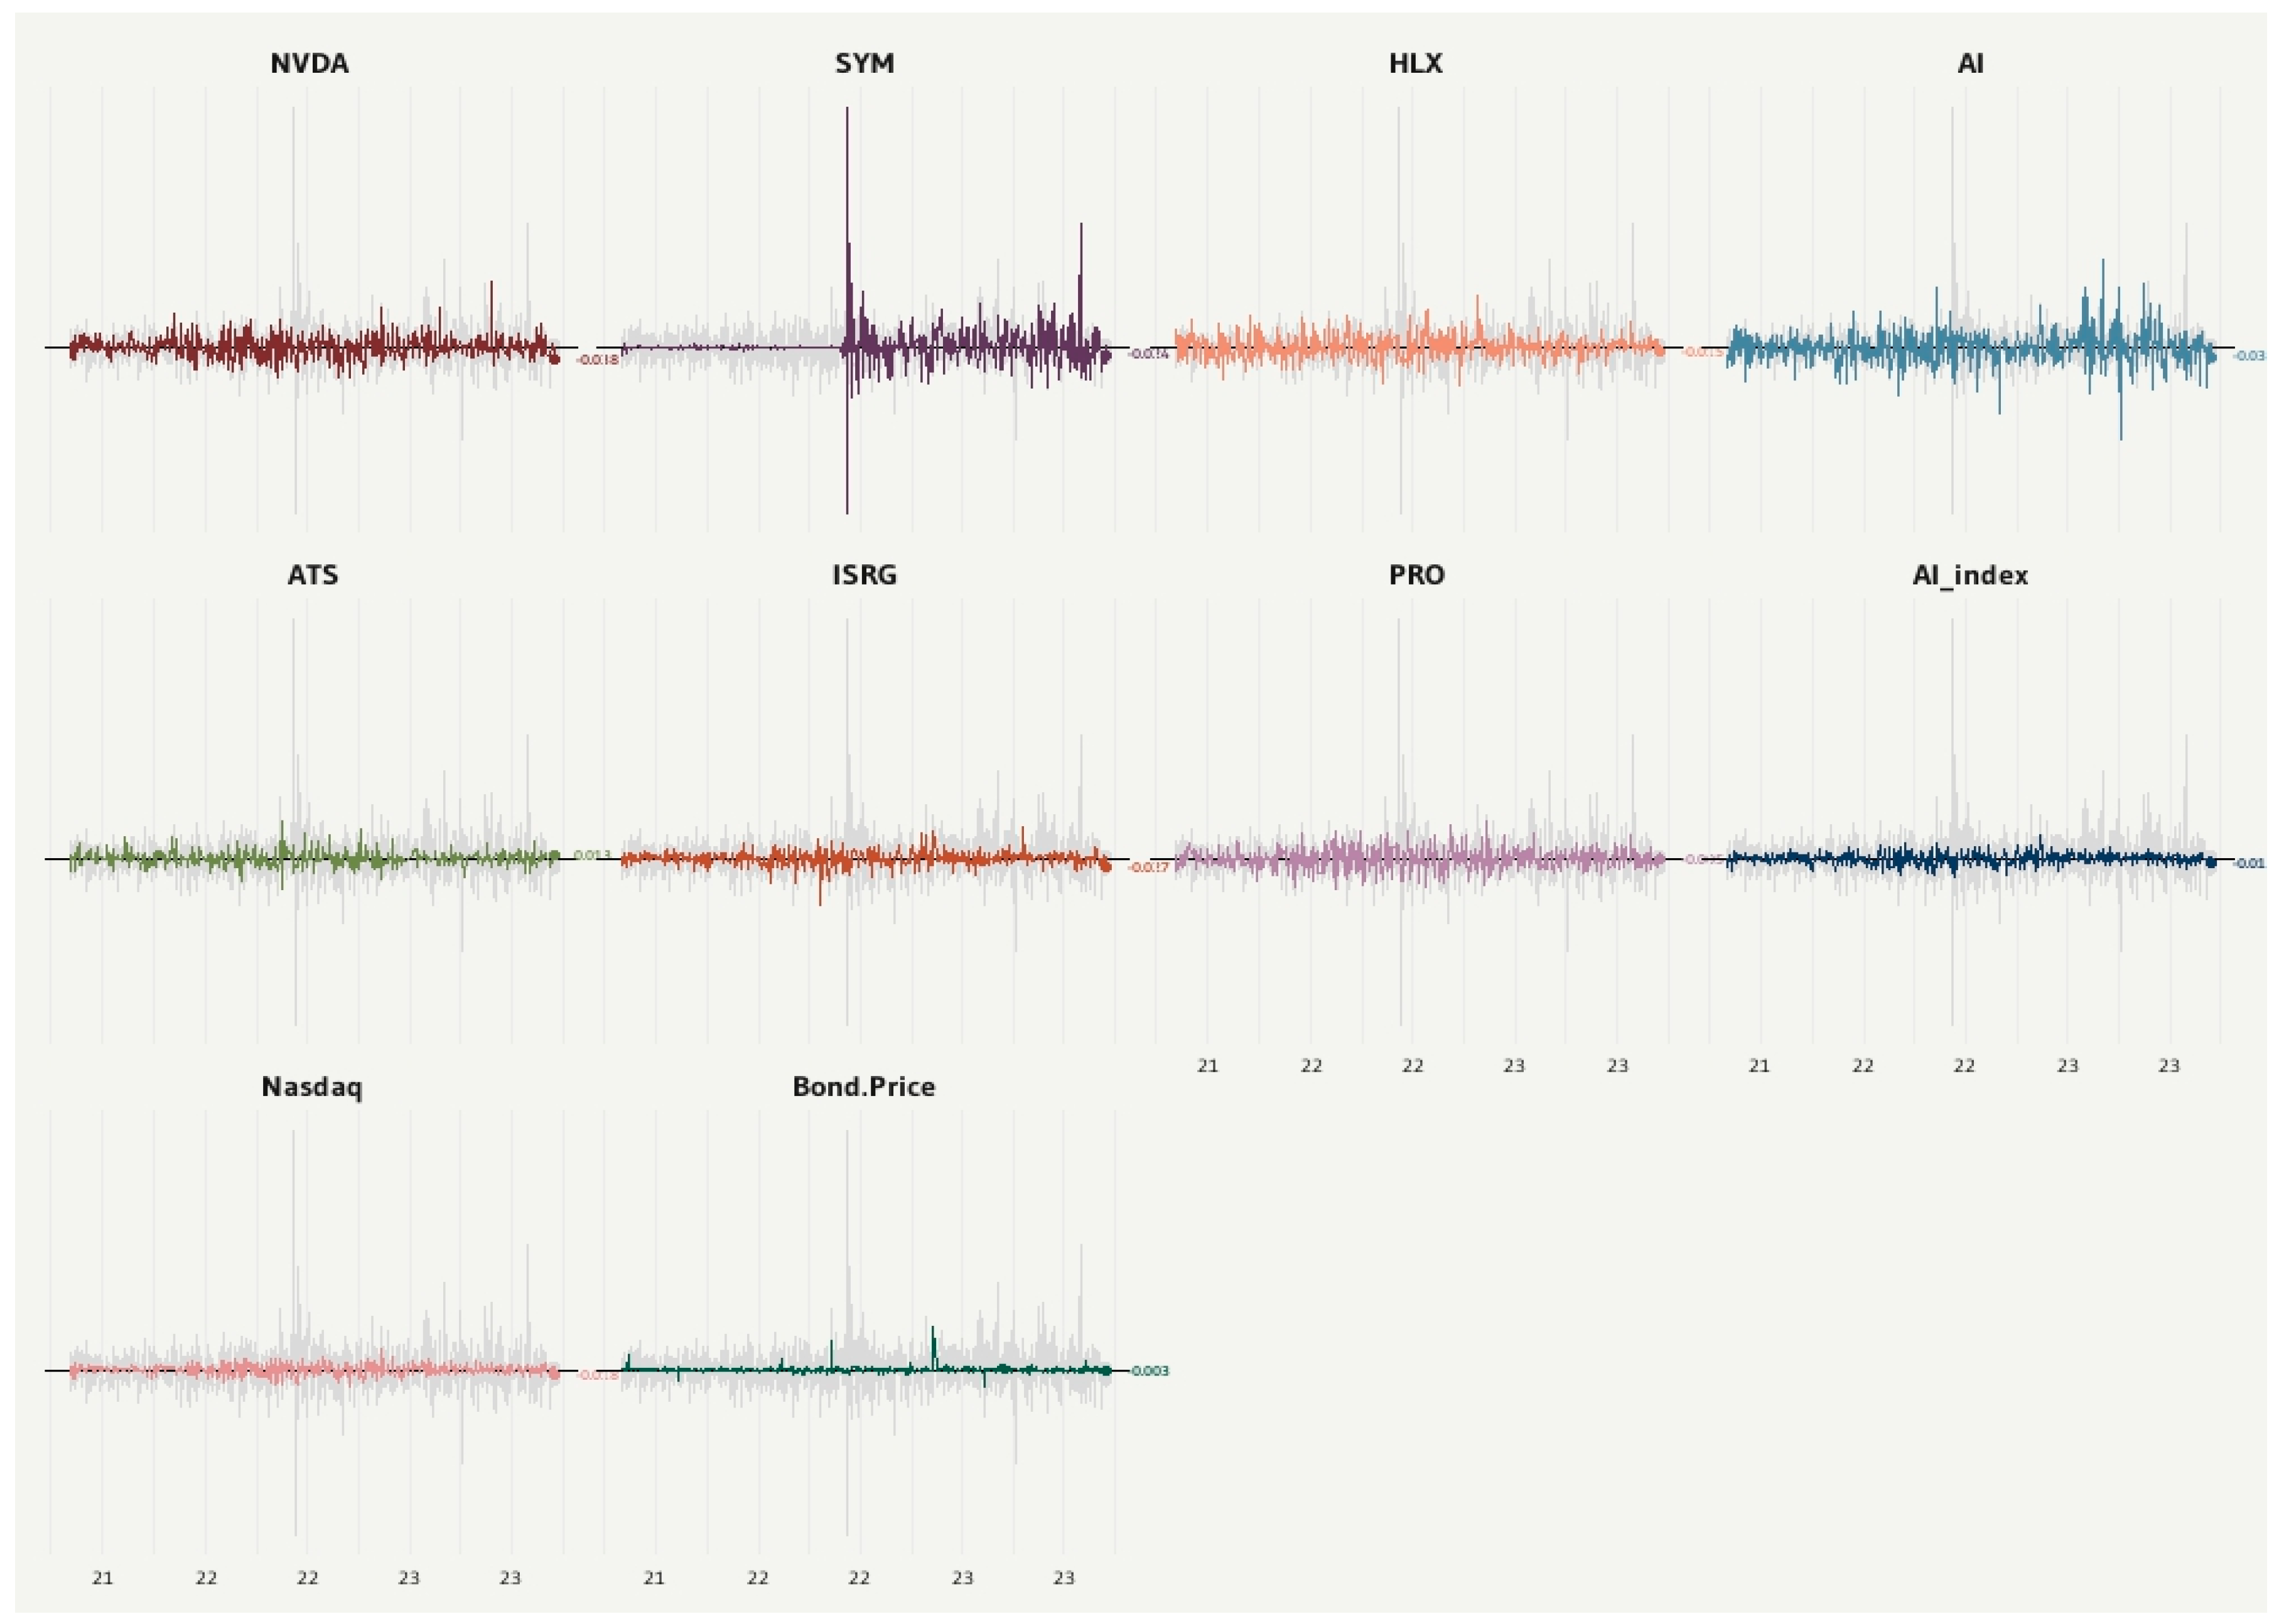
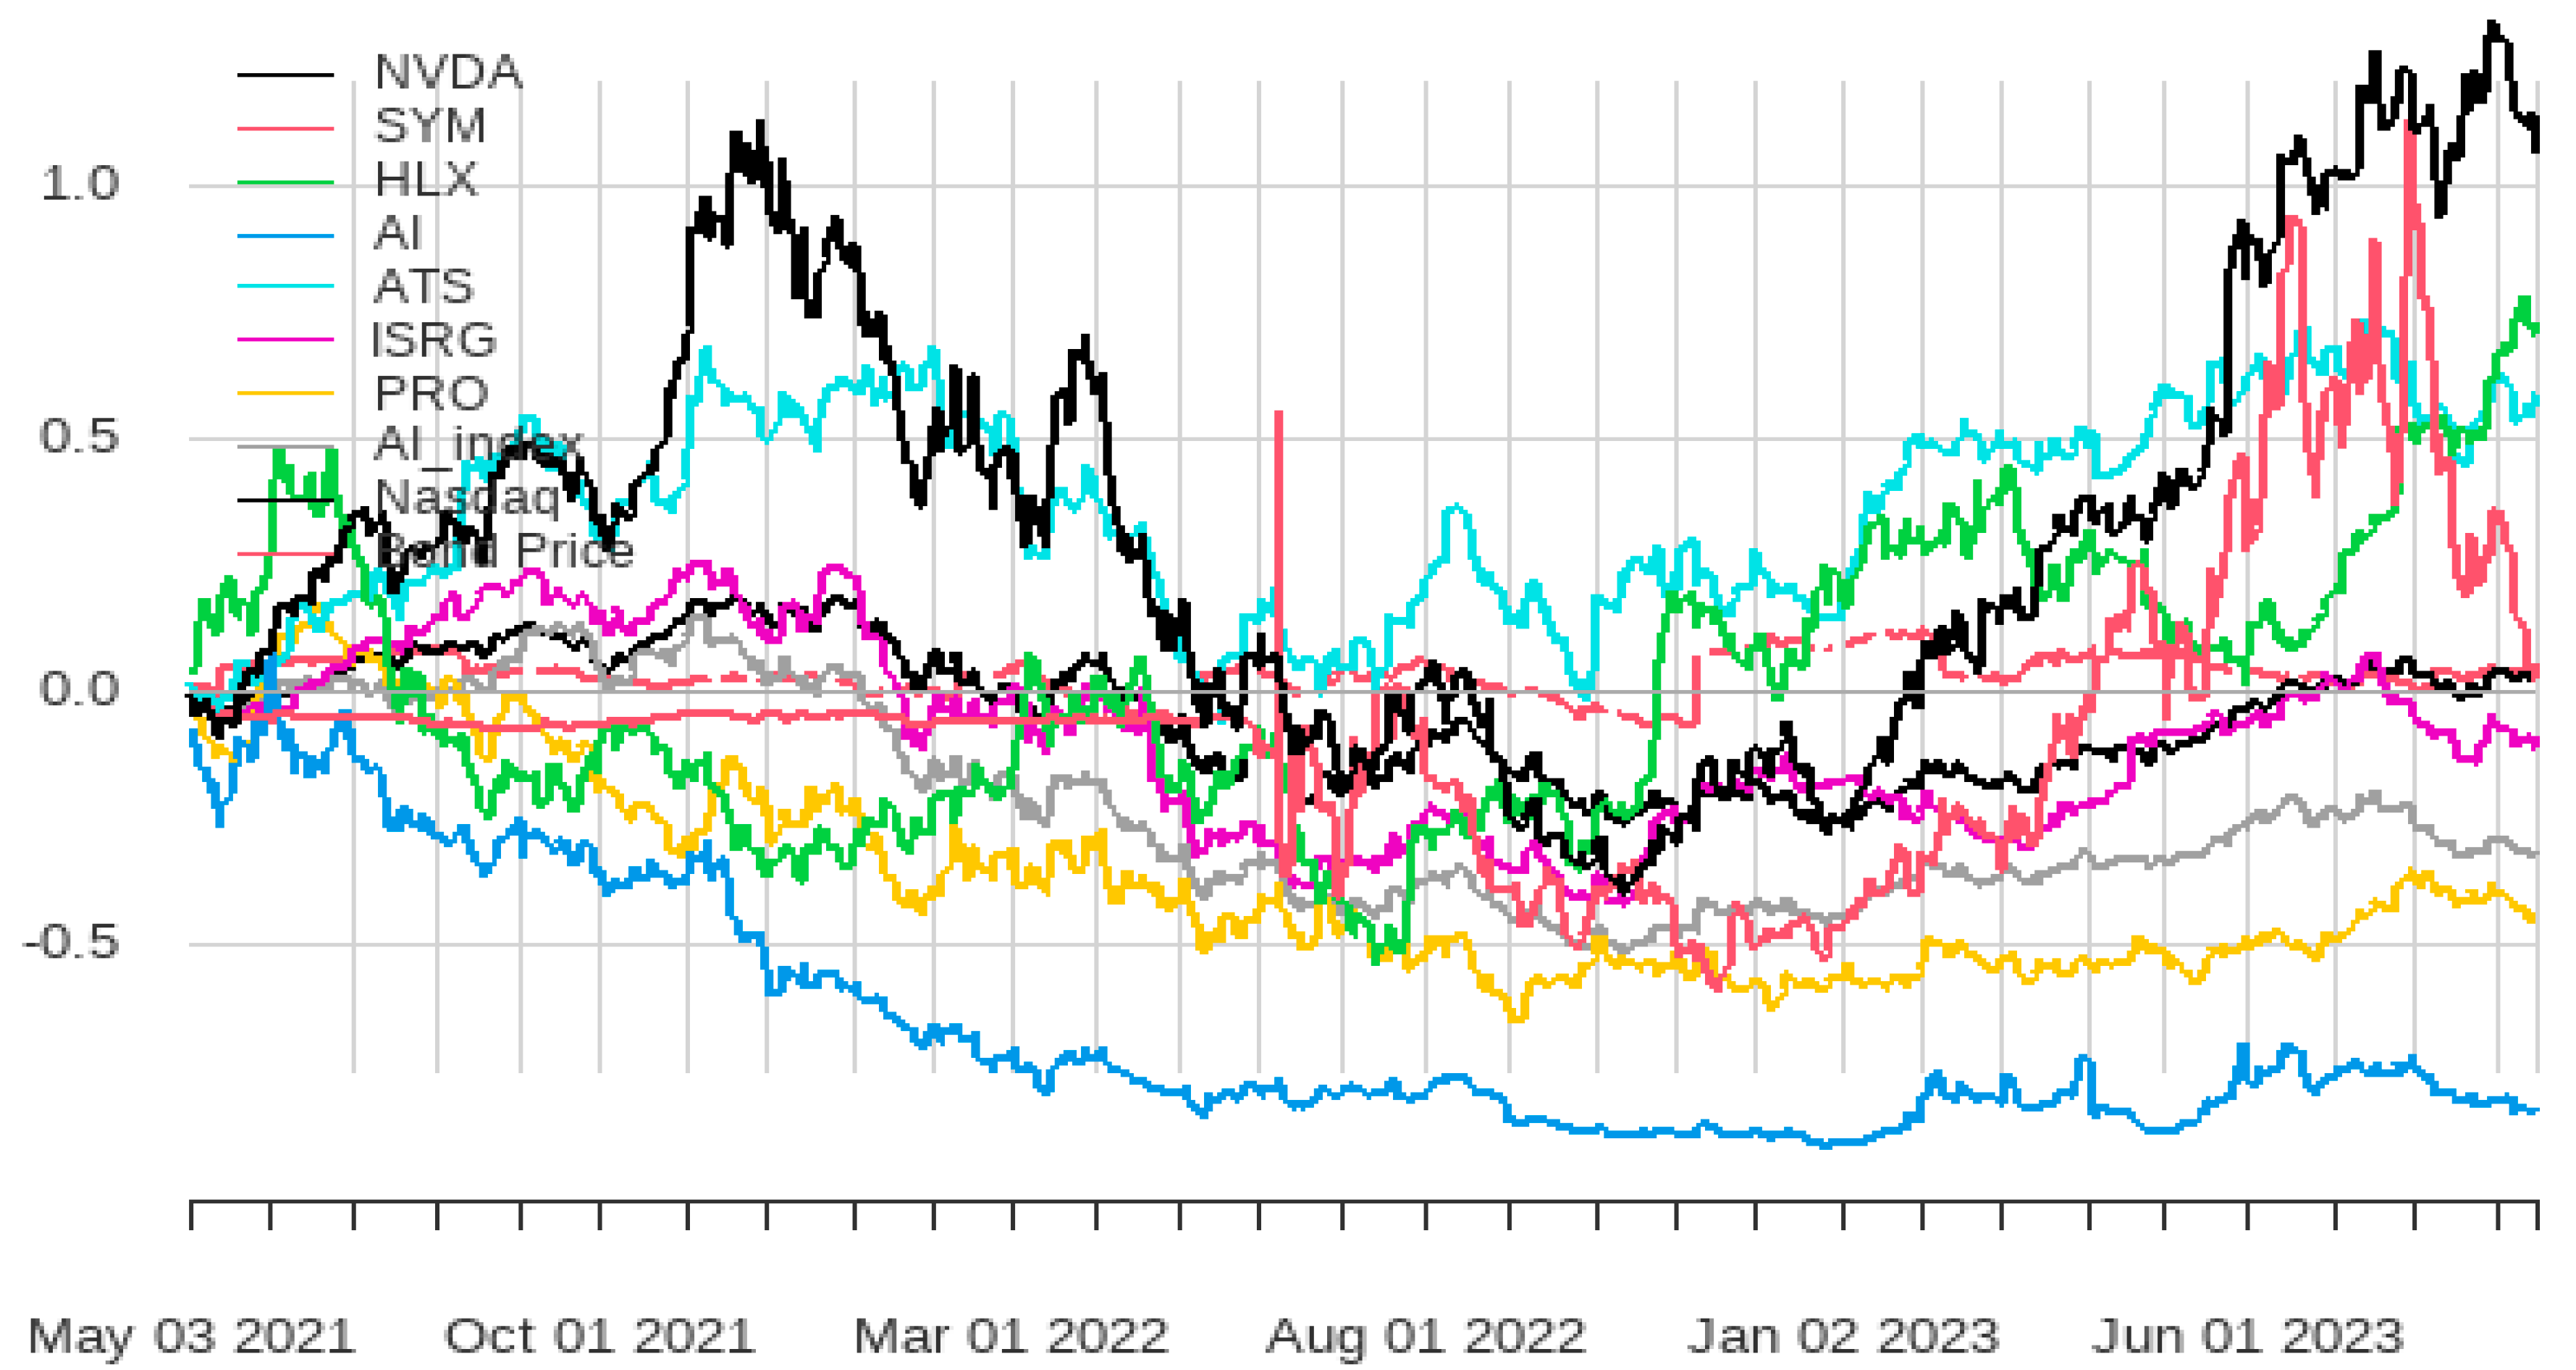
3.2. Descriptive Statistics

Returns for various stock prices tied to AI show greater volatility beginning in 2022. Figure 1 depicts the range in returns for the whole sample, which includes seven AI equities, an ETF for AI and robotics (AI_index), the Nasdaq (IT market benchmark), and US bonds. Following the development of Chatgpt and the incorporation of transformer technology, we can see that the variety of return in the top-seven AI-related enterprises is bigger. The difference is significantly more extreme for the ETF tied to robotics and AI development. Returns for the selected stock markets can even exceed 20%. From the start of speculation over transformer and LLM technology in the summer of 2022, as well as their integration into embedded systems, it shows a massive boost for the return of firms such as Symbotic Inc., which even reaches a return of 70% in the mid-2022. To find the best portfolio, we employ the traditional buy-and-hold approach with a monthly adjustment model and another model with buy and hold over the full period. Our results in Figure 1 show low variation of return over time with US bonds, which confirm it as a tool for safe assets with approximately no risk. Moreover, the benchmarks that we will use ultimately to evaluate the performance of the portfolio using the top-seven AI index display lower variation. Therefore, they represent a safer way of investment with low volatility risk.
Table 1 displays the descriptive statistics for the daily return and risk premium generated using the US bond return. When descriptive statistics for certain stocks are examined, noticeable patterns emerge. As expected, AI and PRO have negative returns, while all other assets have positive returns. The difference in return and risk premium calculated by comparing asset return to the safest asset (US bonds) is modest. NVDA and SYM have the greatest daily returns of approximately 0.2% on a continuous basis. ISRG and ATS have the lowest risk standard deviations, making them important components of a buy-and-hold portfolio. PRO has the smallest skewness and kurtosis for both return and excess return, suggesting that it is the safest stock. Furthermore, PRO, along with ATS and ISRG, has the most consistent fluctuation across time. As a result, stocks with the lowest risk relative to return, such as PRO, will form a significant component of a typical component to a purchase-and-hold approach. The risk and return for various stock markets are low, signaling a good chance to research the equities in a portfolio and compare them to global markets and the AI ETF index. The range of the return indicates the high variability over time, which is accountable for building an optimal strategy for the buy-and-hold portfolio over all the periods. ATS, PRO and ISRG hold the lowest values for the range of valuation, with values of 0.22, 0.22, and 0.26, respectively.
For the cumulative sum return, Figure 2 points to the progression in accumulated return for holding a stock portfolio for the period mid-2021 to the first half of 2023. Return in the second half of 2021 and the first half of 2022 is approximately normal, with a tendency toward decreasing. For numerous stocks, they start climbing after the booming of AI in the second half of 2022, which indicates that they could represent a good opportunity for investment and an adjustment for portfolios. In the wake of the transformer models, the construction of portfolios has changed dramatically in the recent years to include the most common companies investing in AI. After comparing the returns and risk of each stock market company individually, in the second part we build portfolios based on the top companies in stock market related to AI. Individually, AI stock included in the NYSE shows the lowest return over the past three years, along with the PRO and ISRG. Moreover, the AI index for the ETF related to robotics and AI varies across time, with low return in mid-2022. Therefore, the variation over time along with the instability are indicators that the AI companies could generate higher return in the short term, but they could also bring more risk because of the high variability.

3.3. Descriptive Statistics: Portfolios of AI Stocks

Table 2 shows that the average return of the portfolios is larger than that of individual equities, reaching 0.2% for the daily rebalanced portfolio while having the highest risk of 3.35%. The portfolio outcomes are more significant even in terms of the maximum and minimum generated over 71% for rebalanced portfolios. Based on the descriptive statistics, we conclude that the rebalanced portfolio has the maximum return and risk. However, the portfolio shows high tails and symmetry for the distribution according to the high values of skewness and kurtosis. Therefore, the rebalancing portfolios could generate high returns, but this could be due to high demand on the AI stocks as a speculative bubble.

4. Empirical Findings and Discussion

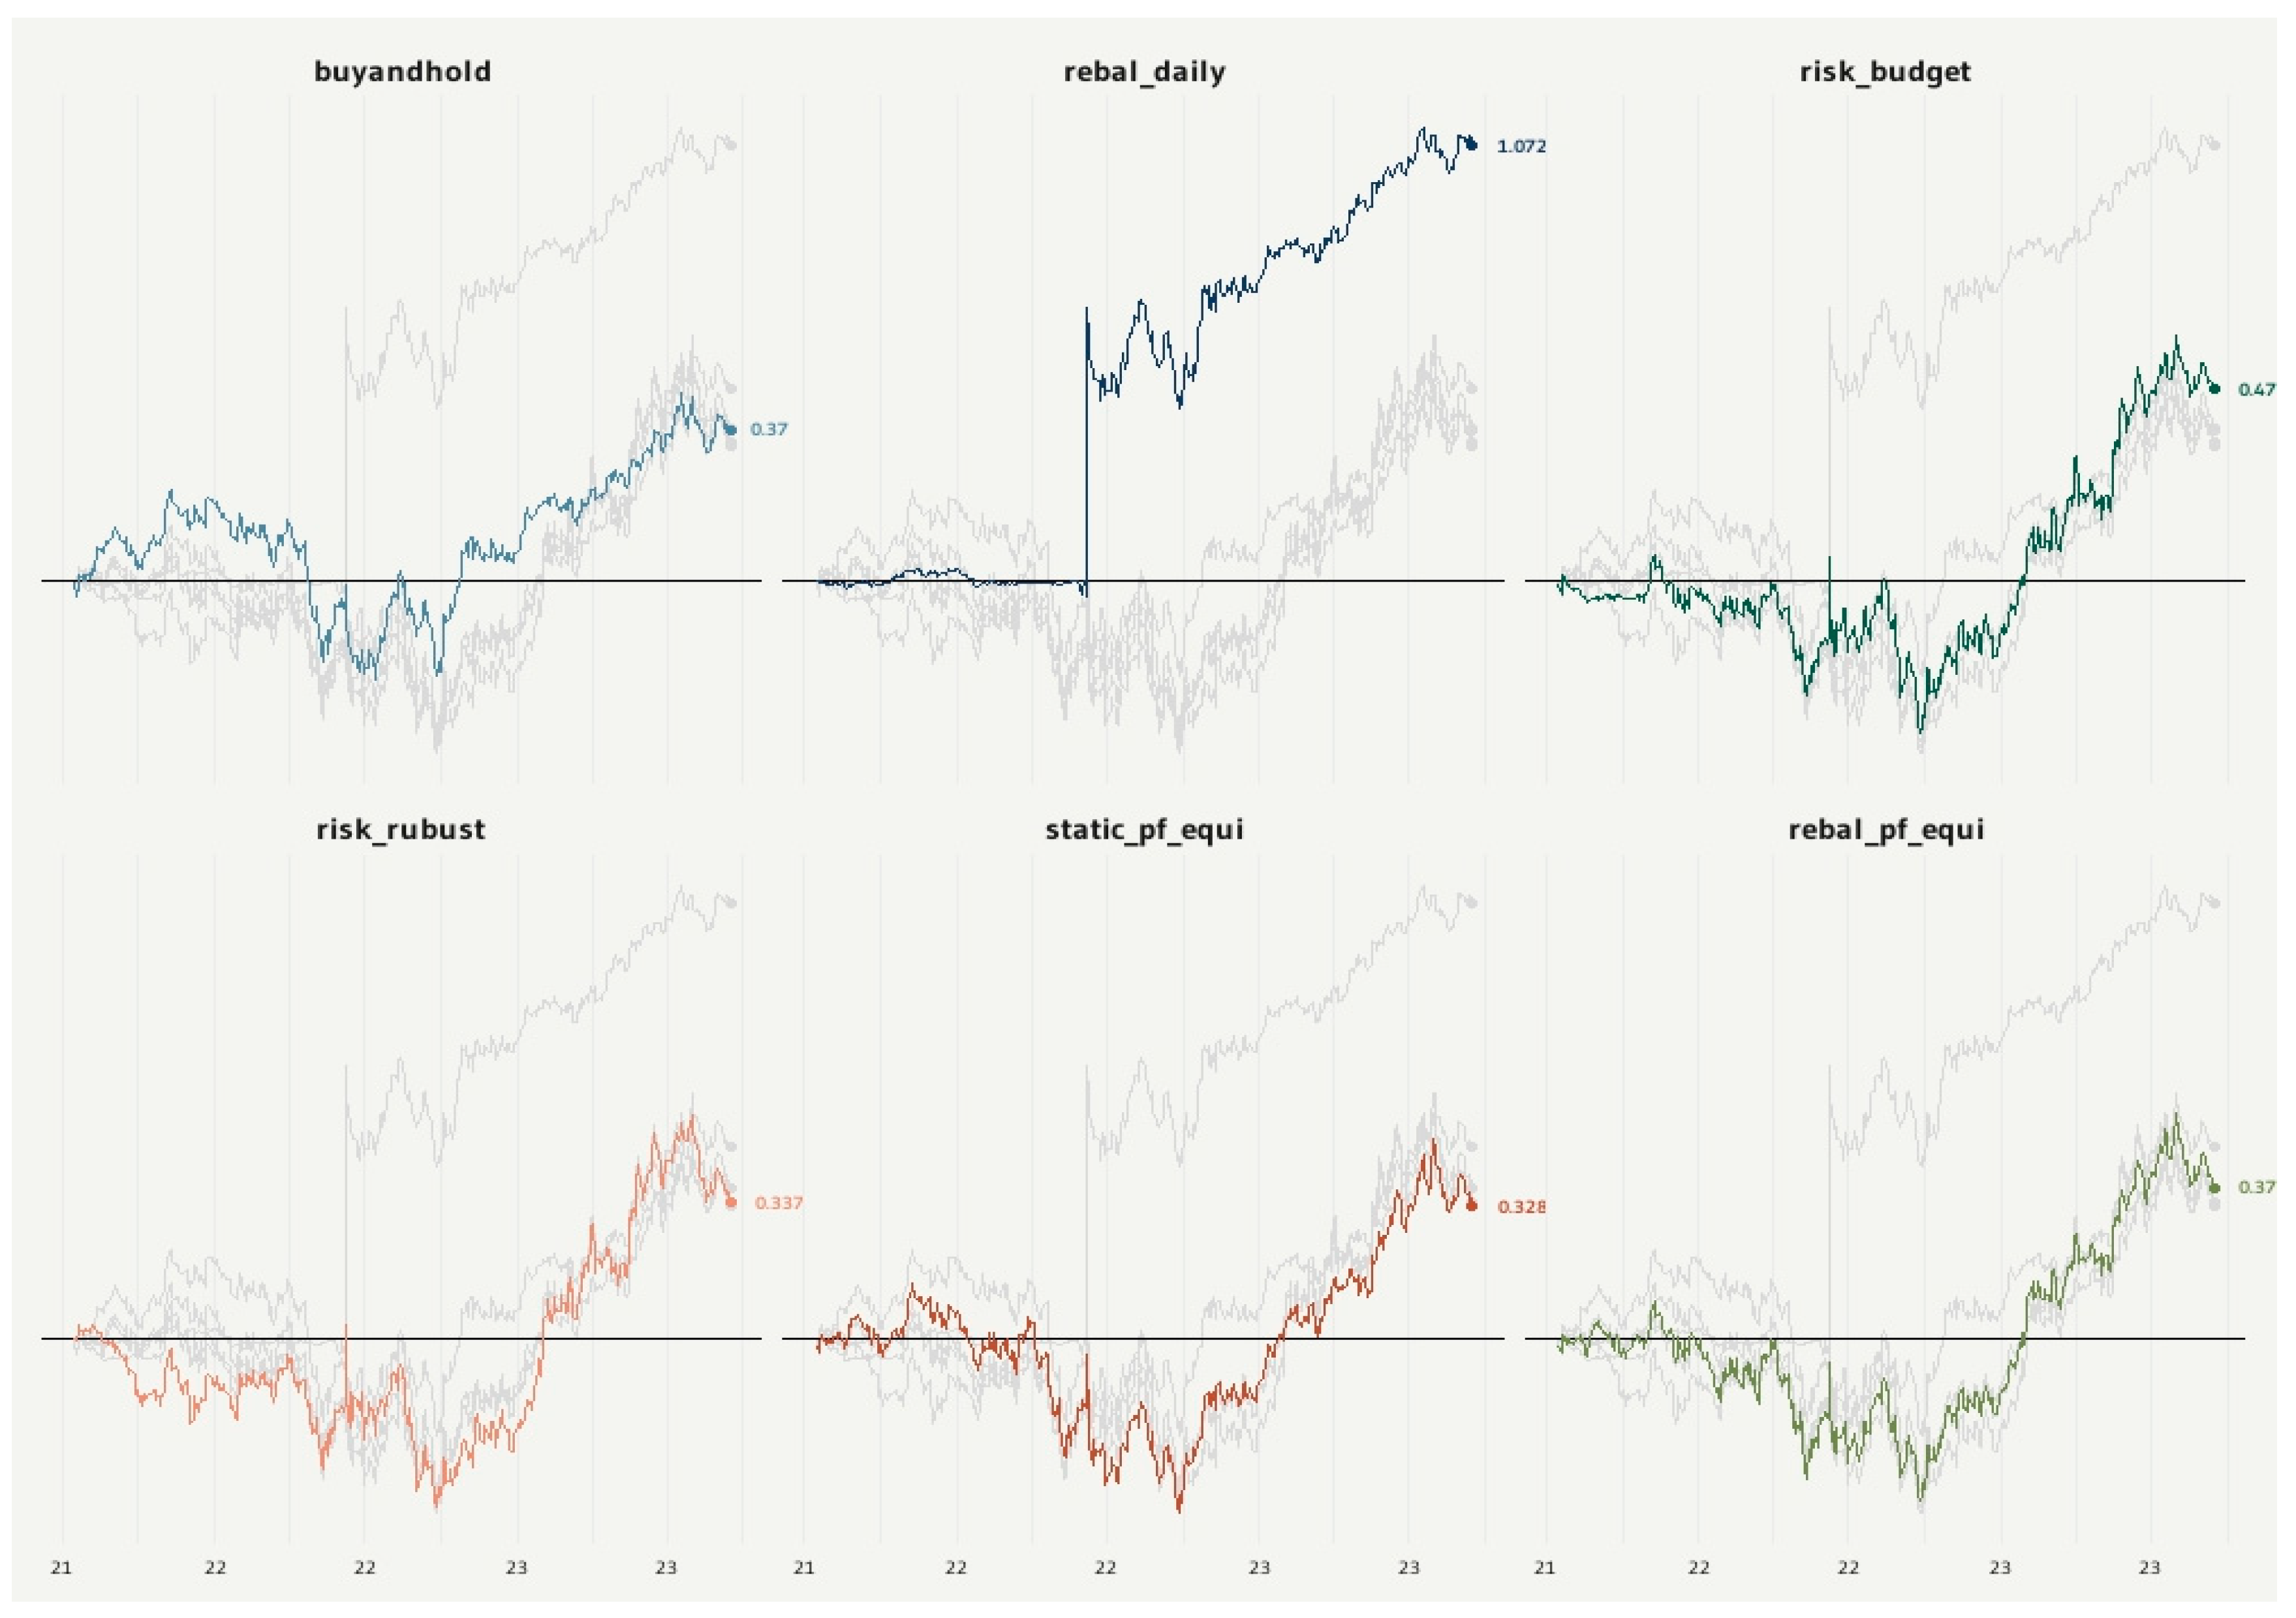
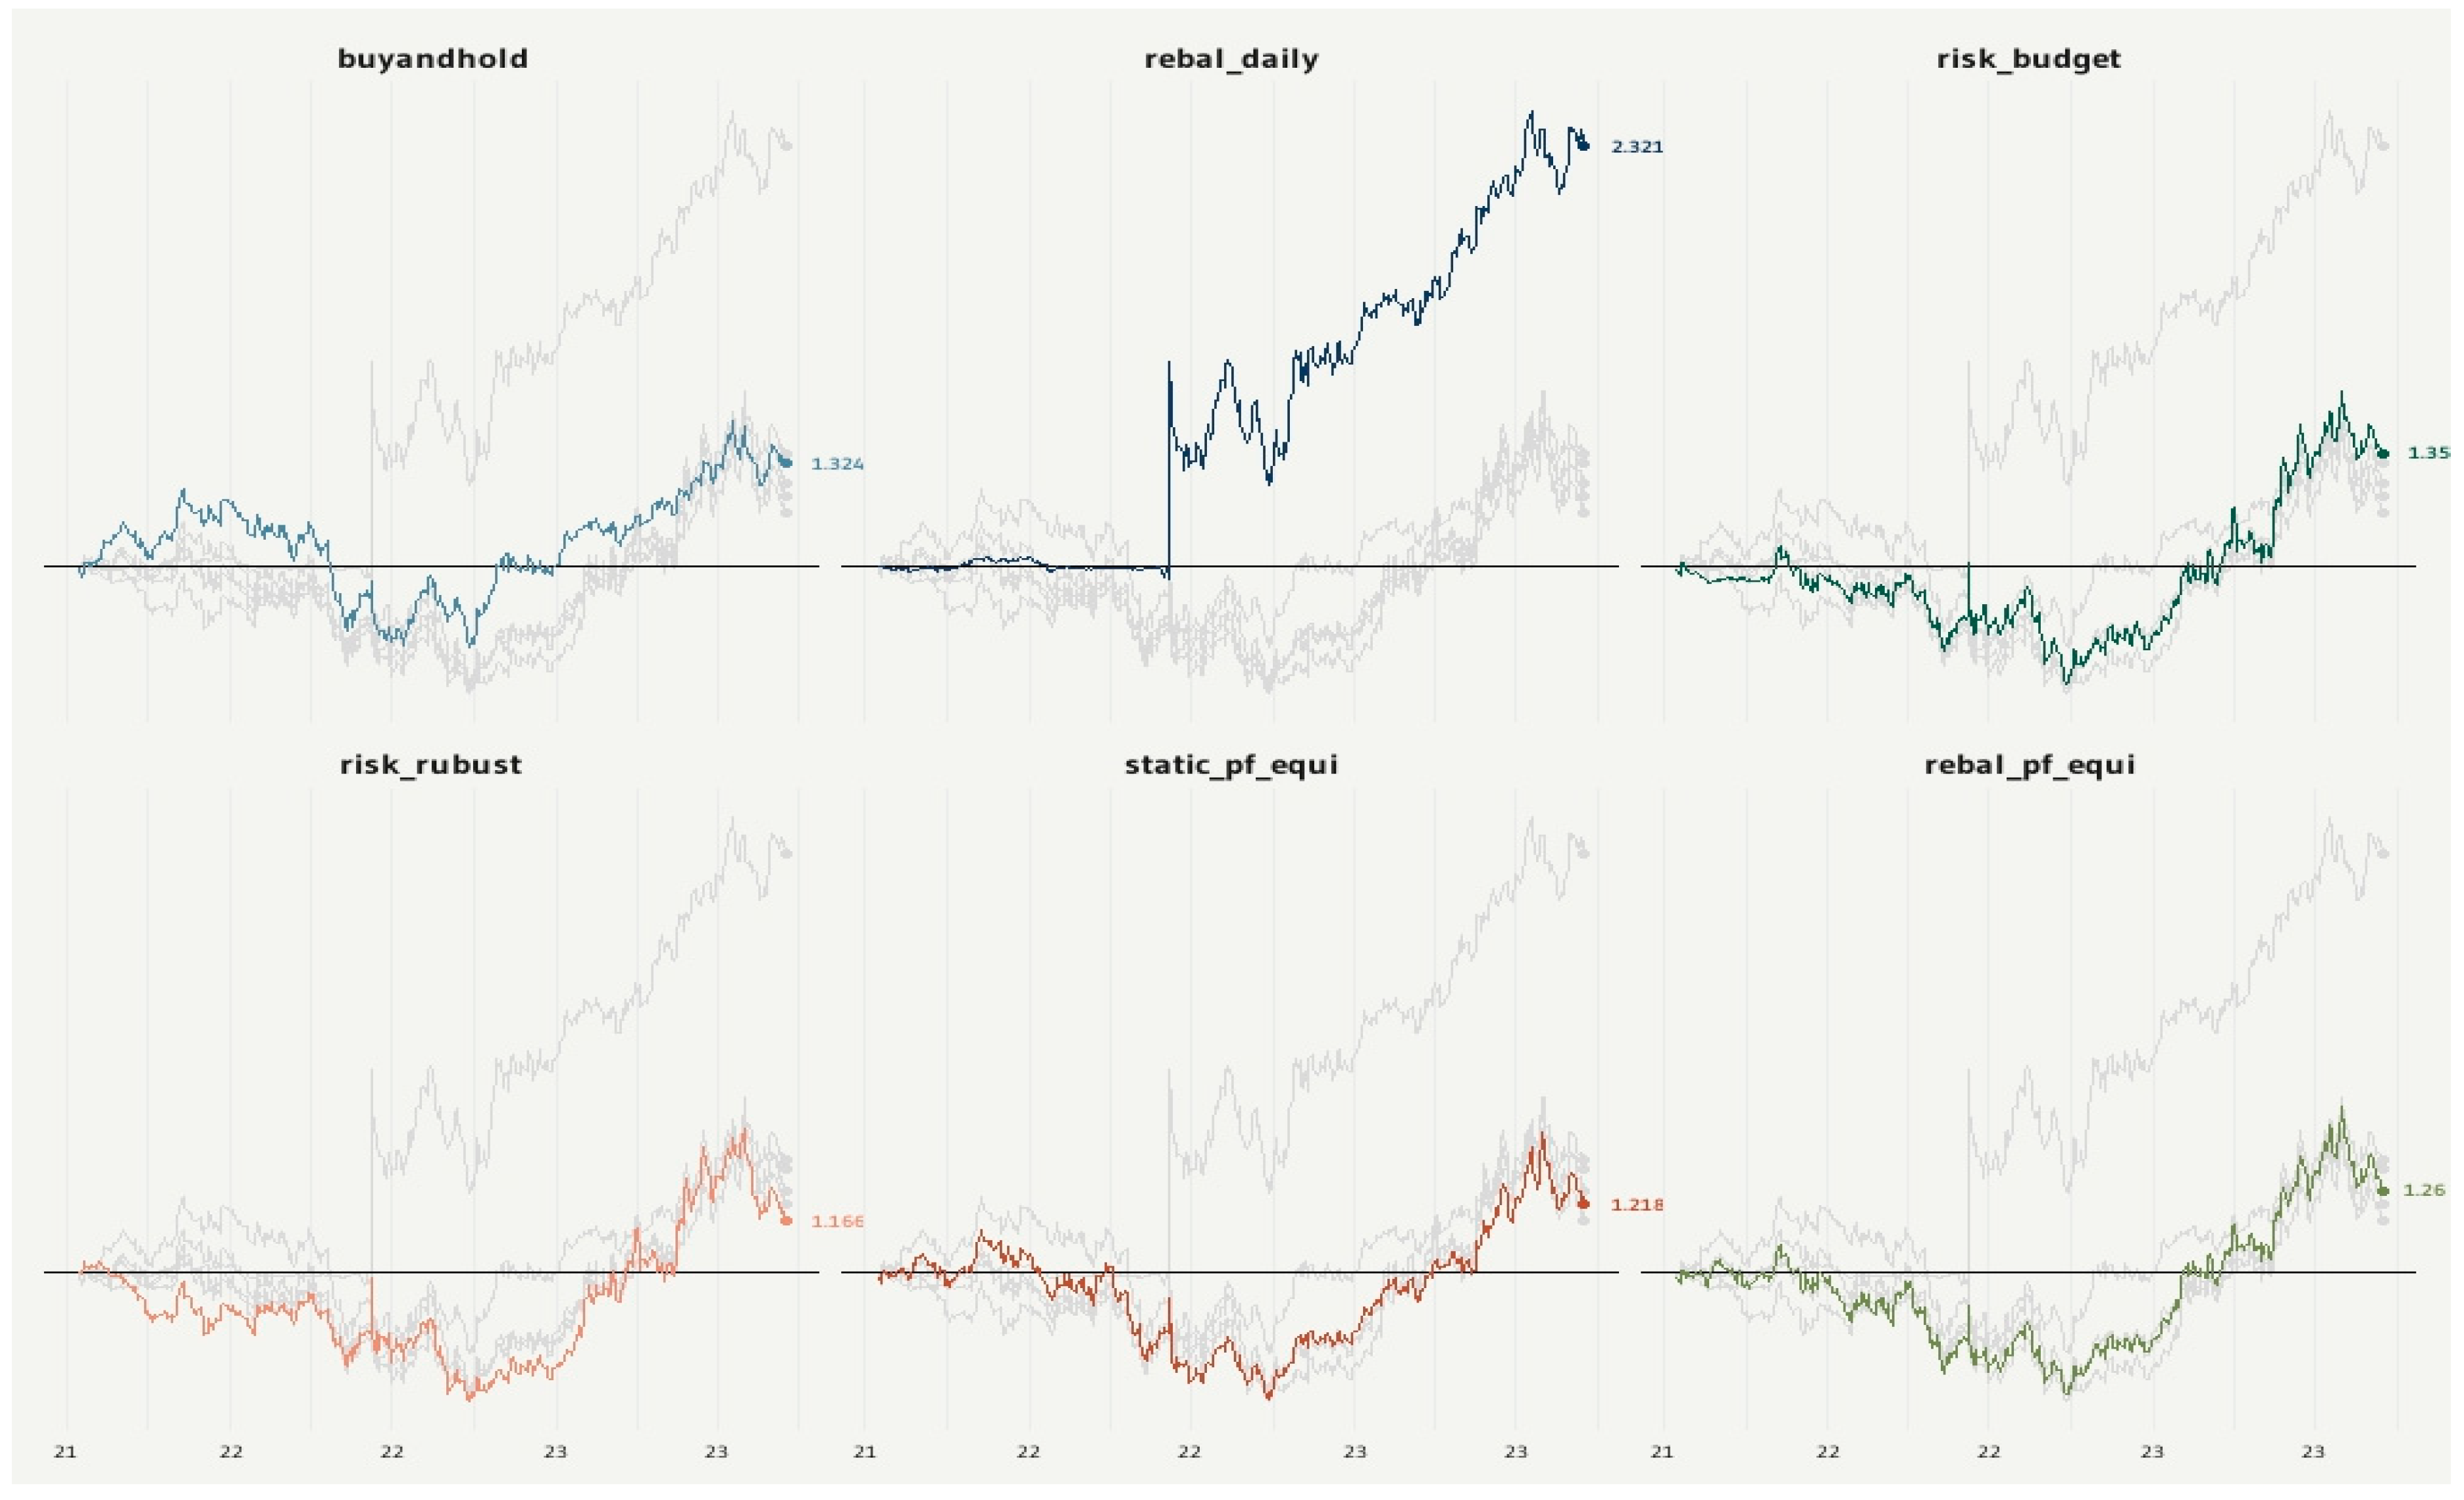
4.1. Cumulative Return: AI Portfolios

Figure 3 and Figure 4 exhibit the arithmetic and geometric cumulative returns for the portfolios under consideration. In Figure 3, the daily rebalanced portfolio earns the highest cumulative return by investing individually throughout time, with a value of 1.072 at the end of the term. The average final cumulative return of the other five portfolios is around 0.3. The largest growth for all portfolios comes in the second half of 2022, when there is a lot of speculation and knowledge on IA. However, in the last era of 2023, we detect a fall in performance, which is denominated by critics of AI progress. For the geometric formula to calculate cumulative return, the highest return is assigned to the daily rebalanced portfolio, with 2.321 in Figure 4. The accumulated return keeps climbing severely after mid-2022, with a high upward trend. Moreover, the rest of the portfolios stand at approximately the same level, which is 1.2. The strategy of daily rebalancing is the most significant in generating return, which gives a sign that AI is more likely to lead to a speculative strategy, where investors take more risk.

4.2. Portfolios Performance

4.2.1. The Downside Risk and Upside Potential

We use risk to classify performance under potential risk through a suite of risk and return metrics, including annualized downside risk, daily downside risk, downside potential, Omega, Omega–Sharpe ratio, Sortino ratio, upside potential, and upside potential ratio. Table 3 displays the results. The portfolios under examination encompass a wide spectrum of investment strategies, from conservative to flexible and daily changeable, despite the fact that they all comprise the same bench of AI-related equities. Our findings shed light on the risk–return characteristics of these portfolios.
Notably, the daily rebalanced portfolio has the lowest annualized downside risk and the greatest Sortino ratio, which is consistent with its characteristics in terms of money management according to past performance. However, the robust portfolio stands for the highest downside risk and the lowest Sortino ratio, which confirms its only relation only to the second moment and ignoring the first moment, even though it is adjusted to the variance–covariance matrix. The risk budget along with robust portfolios, on the other hand, has greater upside potential, but a lower upside potential ratio, highlighting the inevitable trade-off between risk and return for building a profitable strategy on the market. Moreover, the daily adjusted portfolios stand for the best-diversified portfolio in terms of risk return by holding the highest Omega and Omega–Sharpe ratio values.

4.2.2. Portfolio Performance Regarding Market Risk- and Risk-Free Rate

The US bond market serves as the benchmark for the safest asset, characterized by zero risk, in our research of the risk and return dynamics across the different built portfolios. We assess essential risk measures along with return. In Table 4, the standard deviation (StdDev) in conjunction with the Sharpe ratio provides a multifaceted evaluation of each portfolio’s performance over time in comparison with the safest asset. It gives an insight into the volatility-adjusted returns. The robust portfolio shows the lowest value of StdDev Sharpe, which indicates its stability and closeness to the risk-free rate asset in term of risk–return. We now turn to VaR Sharpe and ES Sharpe, which analyze portfolio stability over time by including value at risk and expected shortfall, respectively.
These indicators show how the portfolios handle downside risk. Even if daily rebalanced portfolios exceed the AI index and the Nasdaq IT market index in terms of independent evaluation, they have a higher VaR and ES Sharpe, implying larger losses than the free-risk rate asset. The robust and optimized portfolio, on the other hand, has a lower VaR Sharpe and ES Sharpe, indicating a greater ability to limit potential losses in adverse market conditions. This aligns with the conservative strategy’s emphasis on enhanced stability in the face of global market risk. To dig more into the performance of AI companies, we use the ETF index for AI as another threshold to compare it with US bonds. Results indicate lower values for the three Sharpe-related metrics. Portfolios in comparison with the global index are proportionately similar, indicating more closeness and stability with the AI index as base measurement. For the Treynor ratio in Table 5, we indicate the values using both scenarios—ETF index for AI and Nasdaq—in brackets. In contrast to the individual stock results, all of the stocks show higher performance, with the rebalanced portfolio attaining a value of 1.023. However, the AI index keeps showing lower performance compared to the Nasdaq using risk-adjusted measurements.

4.3. Discussion: Relation of Most Related Chips Stocks to Global Performance

4.3.1. Portfolios Relation to Other Market Benchmarks: Systemic Risk

We examined six different investment portfolios, ranging from a cautious buy-and-hold approach to a dynamic daily rebalancing method, to understand more about the performance in Table 6. Based on knowledge and market asymmetries, we use both market benchmarks to assess risk dynamics. We discover high beta-cokurtosis values greater than 1 for the risk budget, monthly rebalanced, static, and robust portfolios in comparison to the Nasdaq index. As a result, people are more likely to react strongly to market extremes. Based on the ETF AI index, we identify a moderate movement toward severe occurrences. In this section of the research, we examine if the AI portfolio’s success is attributable to recent strong demand in the IT market and whether the demand for AI stocks is connected to worldwide demand for technology-related companies. Portfolios provide high values of performance across the risk–return assessment; nevertheless, beta coskewness is negative for the buy-and-hold portfolio as well as the static portfolio, showing fewer positive returns in contrast to the ETF AI market. According to the positive values of beta covariance, the portfolios move in the same direction as the systemic risk for both indices. For global variability, there is no difference between portfolios and benchmarks for the symmetry of returns. Moreover, the findings lead to no extreme tails or outliers for the movement of portfolios toward the benchmarks. Our results confirm that the portfolios can generate higher returns, but they remain related to global risk on the market. They are related to global risk in the IT sector, and specifically to the AI-related companies included in the ETF index.
Our study’s findings indicate that for AI stock portfolios, the beta-cokurtosis values are lower for daily rebalancing strategies than buy-and-hold strategies. This suggests that AI stocks, while generating higher returns, also present more volatility and long-term risk than market benchmarks. However, implementing more robust strategies, such as adding budget constraints, results in a greater deviation in returns from these benchmarks, signifying a move towards higher-risk strategies. Interestingly, despite the expectation that a cautious buy-and-hold approach would lead to moderate risk, our results show it actually results in higher-risk deviations from global market indices.
Table 6 highlights a strong correlation between the AI index and the portfolios, evidenced by high and positive beta-coskewness values. In contrast, long-term static and buy-and-hold portfolios show a more risk-averse stance towards the Nasdaq market benchmark, as indicated by their lower and negative values. This finding underscores a consistent correlation between risk and volatility in both short- and long-term investments, with high beta-covariance values observed in both rebalancing-based and static portfolios. Moreover, the buy-and-hold strategy maintains a stronger correlation with benchmarks, suggesting that holding a portfolio of AI stocks mirrors the market risks. Thus, while AI portfolios are influenced by global tech market trends and demands, they offer a viable route for diversification. This is particularly true when they are adjusted in accordance with market risk and volatility.

4.3.2. Performance in Terms of Market Benchmarks

The active premium for the portfolios in Table 7 is positive on both benchmarks, showing outperformance against the Nasdaq and AI ETF indices. Based on the AI index, the rebalanced portfolio has the highest value of 0.66, confirming further outperformance. When tested against the AI ETF benchmark, alpha is always positive as a metric for return adjusted to risk, which is consistent with the results of other measures for AI portfolio performance during the last three years. Even annualized alpha shows this trend, with portfolios rebalanced based on previous performance and risk standing as the better-performing risk-adjusted statistic.
Following our examination of the various portfolios individually, we now shift our attention to the risk–return performance indicators of the portfolios in Table 7. The active premium for the portfolios is positive on both benchmarks, showing outperformance against the Nasdaq and AI ETF indices. Based on the AI index, the rebalanced portfolio has the highest value of 0.66, confirming further outperformance. When tested against the AI ETF benchmark, alpha is always positive as a metric for return adjusted to risk, which is consistent with the results of other measures for AI portfolio performance during the last three years. Even annualized alpha shows this trend, with portfolios rebalanced based on previous performance and risk standing as the better-performing risk-adjusted statistic.
The information ratio, which reflects risk-adjusted returns, shows positive and high values for the ETF AI index, while those values are smaller for the Nasdaq index, except for the rebalanced and buy-and-hold portfolios. Therefore, management of investing in AI in comparison to both indices could generate more value based on a return–risk-adjusted metric. The tracking error displays positive and smaller values, representing insignificant active risk or deviation from the global benchmarks. Finally, the Treynor ratio exhibits strong excess returns on the AI ETF and Nasdaq, indicating high sensitivity to the volatility of the markets.
Implementing either a buy-and-hold or a rebalancing strategy can lead to higher excess returns, particularly in light of the high market risk. Despite the close correlation between AI portfolios and benchmark risks, these portfolios tend to yield higher returns over time. This trend reinforces the growing appeal and profitability of AI-related stocks. The relationship between AI stocks and market benchmarks is further underscored by their small tracking-error values against both the Nasdaq and AI indices. This indicates that AI stocks are highly exposed to global market dynamics, making them sensitive to volatility and shocks within the tech market.
Both the information ratio and tracking error confirm the robust performance of AI stocks, showing a low risk of underperformance even during periods of high market risk and speculative bubbles. Consequently, AI-related stocks emerge as a viable option for investors seeking to diversify their portfolios without straying too far from the overall tech market risk. Additionally, when examining the sensitivity of these portfolios, it is evident that they continue to generate higher returns compared to the volatilities of the Nasdaq and AI ETF indices. While strategies like robust, budget, static, and simple rebalancing demonstrate lower returns relative to the global market risk, the buy-and-hold strategy shows slightly better performance. However, it is the daily rebalancing approach that stands out, consistently outperforming all other strategies in comparison to both benchmarks.
As a result, the rebalanced portfolios are the best performers along with buy and hold, indicating that AI stocks are a better alternative for generating return and the possibility of a growing speculative bubble during the last period. The spread of the OpenAI technologies, along with the increase in discussions on AI, exert great pressure on investors to buy AI stocks according to our buy-and-hold strategy. However, the risk remains high, and the market is not totally stable. Therefore, a dynamic strategy relying on adjustable portfolios keeps generating higher returns, especially in terms of their relationship with global market indicators with regard to risk. Our results support the hypothesis that companies investing heavily in AI technologies have performed better in the last three years in comparison to the Nasdaq index and AI-related ETFs. Moreover, a portfolio of those stocks stands as the better option, with both options of rebalancing depending on previous performance or by buying and holding for longer periods. Importantly, these performances are limited to the strong dependence of those stocks on the global performance of the markets, and they could be affected by the global risk.

5. Conclusions and Perspectives

In conclusion, our study makes a significant contribution to understanding global investments in the stock market, with a focus on AI stocks and multiple investment strategies. We analyzed the performance of stocks from seven prominent technology and robotics companies over a period from 30 April 2021 to 15 September 2023. Our findings indicate that investing in AI stocks, particularly within a daily rebalancing portfolio, can yield higher returns compared to traditional IT indices like the Nasdaq and a global AI and robotics index. This is especially true in the context of the recent surge in speculation regarding AI integration across various industrial and IT sectors, where AI stocks have shown high returns even when compared to traditionally safe assets like US bonds.
Our research reveals that AI-related stocks, specifically in the chips and robotics sectors, have not only outperformed in recent years but also have a strong correlation with the overall performance of the IT market. For investors and traders, navigating the AI sector requires a strategic balance between potential returns and the inherent risks of this dynamic market. This study stands as a pioneer in tracing the profitability of investment strategies focused on AI-related stocks, highlighting their robust performance over the past three years amid high speculative investments and growing venture capital interest in AI technologies.
However, our study has limitations, including the rapidly evolving nature of AI technology, which may necessitate updates to our findings as new developments arise. The focus on specific markets and companies might not fully capture the global AI investment landscape. Future research should broaden this scope to include a comparative analysis with additional IT indices and a wider range of ETFs. This expanded evaluation should not only assess financial performance but also consider factors like volatility, sector concentration, and the correlation of returns between AI stocks and other assets. Incorporating statistical measures like Sharpe ratios and beta coefficients would offer a more refined perspective on the risk-adjusted returns of AI investments relative to broader market indices and specialized investment vehicles. Further exploration of AI’s long-term performance, sustainability, ethical implications, and regulatory challenges will be vital as AI technologies continue to progress. By addressing these areas, subsequent research can build upon our work, enhancing the understanding of AI’s role in the investment sector.

Author Contributions

Conceptualization, W.D. and A.T.K.; methodology, A.T.K.; software, A.T.K.; validation, W.D., A.T.K., A.J. and S.S.; formal analysis, W.D. and A.T.K.; investigation, W.D., A.J. and A.T.K.; resources, S.S.; data curation, A.J.; writing—original draft preparation, W.D. and A.T.K.; writing—review and editing, W.D. and A.T.K.; visualization, W.D. and A.T.K.; supervision, W.D. and A.T.K.; project administration, S.S.; funding acquisition, S.S. All authors have read and agreed to the published version of the manuscript.

Funding

This research was funded by the College of Business Administration and Finance, Saudi Electronic University, Saudi Arabia.

Data Availability Statement

The data that support the results and analysis of this study are available from author W.D. upon reasonable request.

Acknowledgments

We want to thank the College of Business Administration and Finance, Saudi Electronic University, Saudi Arabia.

Conflicts of Interest

On behalf of all authors, the corresponding author states that there are no conflicts of interest. The authors declare that they have no known competing financial interests or personal relationships that could appear to influence the work reported in this paper.

Notes

1
https://www-formal.stanford.edu/jmc/whatisai.pdf (accessed on 12 December 2023).
2
3
4
5

References

  1. Abakah, Emmanuel Joel Aikins, Aviral Kumar Tiwari, Chi-Chuan Lee, and Matthew Ntow-Gyamfi. 2023a. Quantile price convergence and spillover effects among Bitcoin, Fintech, and artificial intelligence stocks. International Review of Finance 23: 187–205. [Google Scholar] [CrossRef]
  2. Abakah, Emmanuel Joel Aikins, Aviral Kumar Tiwari, Sudeshna Ghosh, and Buhari Doğan. 2023b. Dynamic effect of Bitcoin, fintech and artificial intelligence stocks on eco-friendly assets, Islamic stocks and conventional financial markets: Another look using quantile-based approaches. Technological Forecasting and Social Change 192: 122566. [Google Scholar] [CrossRef]
  3. Acemoglu, Daron, and Pascual Restrepo. 2018. The race between man and machine: Implications of technology for growth, factor shares, and employment. American Economic Review 108: 1488–542. [Google Scholar] [CrossRef]
  4. Acemoglu, Daron, and Pascual Restrepo. 2020. The wrong kind of AI? Artificial intelligence and the future of labour demand. Cambridge Journal of Regions, Economy and Society 13: 25–35. [Google Scholar] [CrossRef]
  5. Bahrammirzaee, Arash. 2010. A comparative survey of artificial intelligence applications in finance: Artificial neural networks, expert system and hybrid intelligent systems. Neural Computing and Applications 19: 1165–95. [Google Scholar] [CrossRef]
  6. Bannerjee, Gouravmoy, Uditendu Sarkar, Swarup Das, and Indrajit Ghosh. 2018. Artificial intelligence in agriculture: A literature survey. International Journal of Scientific Research in Computer Science Applications and Management Studies 7: 1–6. [Google Scholar]
  7. Baur, Dirk G., and Kristoffer J. Glover. 2012. The Destruction of a Safe Haven Asset? Available online: https://ssrn.com/abstract=2142283 (accessed on 31 August 2012).
  8. Bhatnagar, Mukul, Ercan Özen, Sanjay Taneja, Simon Grima, and Ramona Rupeika-Apoga. 2022. The Dynamic Connectedness between Risk and Return in the Fintech Market of India: Evidence Using the GARCH-M Approach. Risks 10: 209. [Google Scholar] [CrossRef]
  9. Booth, David G., and Eugene F. Fama. 1992. Diversification returns and asset contributions. Financial Analysts Journal 48: 26–32. [Google Scholar] [CrossRef]
  10. Brynjolfsson, Erik, Daniel Rock, and Chad Syverson. 2018. Artificial intelligence and the modern productivity paradox: A clash of expectations and statistics. In The economics of Artificial Intelligence: An Agenda. Chicago: University of Chicago Press, pp. 23–57. [Google Scholar]
  11. Bughin, Jacques, Eric Hazan, Sree Ramaswamy, Michael Chui, Tera Allas, Peter Dahlström, Nicolaus Henke, and Monica Trench. 2017. Artificial Intelligence the Next Digital Frontier. Chicago: McKinsey & Company. [Google Scholar]
  12. Chen, An-Sing, and James Wuh Lin. 2014. The relation between gold and stocks: An analysis of severe bear markets. Applied Economics Letters 21: 158–70. [Google Scholar] [CrossRef]
  13. Chrisley, Ronald, and Sander Begeer, eds. 2000. Artificial Intelligence: Critical Concepts. Abingdon-on-Thames: Taylor & Francis, vol. 1. [Google Scholar]
  14. Dammak, Wael, Salah Ben Hamad, Christian de Peretti, and Hichem Eleuch. 2023. Pricing of European currency options considering the dynamic information costs. Global Finance Journal 58: 100897. [Google Scholar] [CrossRef]
  15. David, Dharish, Miyana Yoshino, and Joseph Pablo Varun. 2022. Developing FinTech Ecosystems for Voluntary Carbon Markets Through Nature-Based Solutions: Opportunities and Barriers in ASEAN. In Green Digital Finance and Sustainable Development Goals. Singapore: Springer Nature Singapore, pp. 111–42. [Google Scholar] [CrossRef]
  16. Destefanis, Giuseppe, Silvia Bartolucci, and Marco Ortu. 2023. A Preliminary Analysis on the Code Generation Capabilities of GPT-3.5 and Bard AI Models for Java Functions. arXiv arXiv:2305.09402. [Google Scholar]
  17. Dirican, Cüneyt. 2015. The impacts of robotics, artificial intelligence on business and economics. Procedia-Social and Behavioral Sciences 195: 564–73. [Google Scholar] [CrossRef]
  18. Došilović, Filip Karlo, Mario Brčić, and Nikica Hlupić. 2018. Explainable artificial intelligence: A survey. Paper presented at 2018 41st International Convention on Information and Communication Technology, Electronics and Microelectronics (MIPRO), Opatija, Croatia, May 21–25; Piscataway: IEEE, pp. 0210–0215. [Google Scholar] [CrossRef]
  19. Dowling, Michael, and Brian Lucey. 2023. ChatGPT for (finance) research: The Bananarama conjecture. Finance Research Letters 53: 103662. [Google Scholar] [CrossRef]
  20. Dranev, Yury, Ksenia Frolova, and Elena Ochirova. 2019. The impact of fintech M&A on stock returns. Research in International Business and Finance 48: 353–64. [Google Scholar] [CrossRef]
  21. Dwivedi, Yogesh K., Nir Kshetri, Laurie Hughes, Emma Louise Slade, Anand Jeyaraj, Arpan Kumar Kar, Abdullah M. Baabdullah, Alex Koohang, Vishnupriya Raghavan, Manju Ahuja, and et al. 2023. “So what if ChatGPT wrote it?” Multidisciplinary perspectives on opportunities, challenges and implications of generative conversational AI for research, practice and policy. International Journal of Information Management 71: 102642. [Google Scholar] [CrossRef]
  22. Felten, Edward W., Manav Raj, and Robert Seamans. 2018. A method to link advances in artificial intelligence to occupational abilities. In AEA Papers and Proceedings. Nashville: American Economic Association, vol. 108, pp. 54–57. [Google Scholar] [CrossRef]
  23. Feyen, Erik, Jon Frost, Leonardo Gambacorta, Harish Natarajan, and Matthew Saal. 2021. Fintech and the Digital Transformation of Financial Services: Implications for Market Structure and Public Policy. BIS Papers, Bank for International Settlements, Number 117. Available online: https://www.bis.org/publ/bppdf/bispap117.pdf (accessed on 12 December 2023).
  24. Furman, Jason, and Robert Seamans. 2019. AI and the Economy. Innovation Policy and the Economy 19: 161–91. [Google Scholar] [CrossRef]
  25. Graetz, Georg, and Guy Michaels. 2018. Robots at work. Review of Economics and Statistics 100: 753–68. [Google Scholar] [CrossRef]
  26. Hanicova, D., and R. Vojtko. 2021. Rebalancing Premium in Cryptocurrencies. Available online: https://ssrn.com/abstract=3982120 (accessed on 12 December 2023).
  27. Holzinger, Andreas, Georg Langs, Helmut Denk, Kurt Zatloukal, and Heimo Müller. 2019. Causability and explainability of artificial intelligence in medicine. Wiley Interdisciplinary Reviews: Data Mining and Knowledge Discovery 9: e1312. [Google Scholar] [CrossRef] [PubMed]
  28. Horn, Matthias, Andreas Oehler, and Stefan Wendt. 2020. FinTech for consumers and retail investors: Opportunities and risks of digital payment and investment services. In Ecological, Societal, and Technological Risks and the Financial Sector. Berlin/Heidelberg: Springer, pp. 309–27. [Google Scholar] [CrossRef]
  29. Hu, Krystal. 2023. ChatGPT Sets Record for Fastest-Growing User Base. London: Reuters, vol. 12. [Google Scholar]
  30. Huynh, Toan Luu Duc, Erik Hille, and Muhammad Ali Nasir. 2020. Diversification in the age of the 4th industrial revolution: The role of artificial intelligence, green bonds and cryptocurrencies. Technological Forecasting and Social Change 159: 120188. [Google Scholar] [CrossRef]
  31. Jawadi, Fredj, Nabila Jawadi, Duc Khuong Nguyen, and Hassan Obeid. 2013. Information technology sector and equity markets: An empirical investigation. Applied Financial Economics 23: 729–37. [Google Scholar] [CrossRef]
  32. Jiang, Christine X., Jang-Chul Kim, and Robert A. Wood. 2011. A comparison of volatility and bid–ask spread for NASDAQ and NYSE after decimalization. Applied Economics 43: 1227–39. [Google Scholar] [CrossRef]
  33. Kamssu, Aurore J., Brian J. Reithel, and Jennifer L. Ziegelmayer. 2003. Information technology and financial performance: The impact of being an Internet-dependent firm on stock returns. Information Systems Frontiers 5: 279–88. [Google Scholar] [CrossRef]
  34. Katz, Daniel Martin, Michael James Bommarito, Shang Gao, and Pablo Arredondo. 2023. Gpt-4 Passes the Bar Exam. Available online: https://ssrn.com/abstract=4389233 (accessed on 12 December 2023).
  35. Königstorfer, Florian, and Stefan Thalmann. 2020. Applications of Artificial Intelligence in commercial banks—A research agenda for behavioral finance. Journal of Behavioral and Experimental Finance 27: 100352. [Google Scholar] [CrossRef]
  36. Li, Guozhong, Jian Sheng Dai, Eun-Mi Park, and Seong-Taek Park. 2017. A study on the service and trend of Fintech security based on text-mining: Focused on the data of Korean online news. Journal of Computer Virology and Hacking Techniques 13: 249–55. [Google Scholar] [CrossRef]
  37. Lopez-Lira, Alejandro, and Yuehua Tang. 2023. Can chatgpt forecast stock price movements? return predictability and large language models. arXiv arXiv:2304.07619. [Google Scholar]
  38. Ortas, Eduardo, and José M. Moneva. 2013. The Clean Techs equity indexes at stake: Risk and return dynamics analysis. Energy 57: 259–69. [Google Scholar] [CrossRef]
  39. Ozbay, Feyza Altunbey, and Bilal Alatas. 2020. Fake news detection within online social media using supervised artificial intelligence algorithms. Physica A: Statistical Mechanics and Its Applications 540: 123174. [Google Scholar] [CrossRef]
  40. Popova, Yelena. 2021. Economic basis of digital banking services produced by FinTech Company in Smart City. Journal of Tourism and Services 12: 86–104. [Google Scholar] [CrossRef]
  41. Rupeika-Apoga, Ramona, and Stefan Wendt. 2022. FinTech Development and Regulatory Scrutiny: A Contradiction? The Case of Latvia. Risks 10: 167. [Google Scholar] [CrossRef]
  42. Smales, Lee A. 2019. Bitcoin as a safe haven: Is it even worth considering? Finance Research Letters 30: 385–93. [Google Scholar] [CrossRef]
  43. Tong, Wang, Azhar Hussain, Wang Xi Bo, and Sabita Maharjan. 2019. Artificial intelligence for vehicle-to-everything: A survey. IEEE Access 7: 10823–43. [Google Scholar] [CrossRef]
  44. Vasenska, Ivanka, Preslav Dimitrov, Blagovesta Koyundzhiyska-Davidkova, Vladislav Krastev, Pavol Durana, and Ioulia Poulaki. 2021. Financial transactions using fintech during the COVID-19 crisis in Bulgaria. Risks 9: 48. [Google Scholar] [CrossRef]
  45. Vidal-Tomás, David, and Silvia Bartolucci. 2023. Artificial Intelligence and Digital Economy: Divergent Realities. Available online: https://ssrn.com/abstract=4589333 (accessed on 12 December 2023).
  46. Vrontis, Demetris, Michael Christofi, Vijay Pereira, Shlomo Tarba, Anna Makrides, and Eleni Trichina. 2022. Artificial intelligence, robotics, advanced technologies and human resource management: A systematic review. The International Journal of Human Resource Management 33: 1237–66. [Google Scholar] [CrossRef]
  47. Willenbrock, Scott. 2011. Diversification return, portfolio rebalancing, and the commodity return puzzle. Financial Analysts Journal 67: 42–49. [Google Scholar] [CrossRef]
  48. Wu, Philip Fei, Jessica Vitak, and Michael T. Zimmer. 2020. A contextual approach to information privacy research. Journal of the Association for Information Science and Technology 71: 485–90. [Google Scholar] [CrossRef]
  49. Xu, Zhong, and Chuanwei Zou. 2022. Fintech: Frontier and Beyond. London: Routledge. [Google Scholar] [CrossRef]
  50. Yu, Jing-Rung, and Wen-Yi Lee. 2011. Portfolio rebalancing model using multiple criteria. European Journal of Operational Research 209: 166–75. [Google Scholar] [CrossRef]
  51. Yu, Jing-Rung, Wan-Jiun Paul Chiou, Wen-Yi Lee, and Kai-Cheng Yu. 2017. Does entropy model with return forecasting enhance portfolio performance? Computers & Industrial Engineering 114: 175–82. [Google Scholar] [CrossRef]
Figure 1. Return variation in AI stocks, Nasdaq, ETF for AI and robotics, and US bonds over time.
Risks 12 00052 g001
Figure 2. Arithmetic cumulative return for AI stocks, Nasdaq, US bonds, and AI_index.
Risks 12 00052 g002
Figure 3. Arithmetic cumulative return for AI portfolios with line on zero.
Risks 12 00052 g003
Figure 4. Geometric cumulative return for AI portfolios with line on one.
Risks 12 00052 g004
Table 1. Descriptive statistics of the AI stocks, market benchmarks, and US bond daily returns.
NamesnMeanSdMedianTrimmedMadMinMaxRangeSkewKurtosisSe
NVDA5690.0019
[0.002]
0.0349
[0.036]
0.0023
[0.002]
0.0012
[0.001]
0.0290
[0.030]
−0.099
[−0.12]
0.2180
[0.225]
0.3176
[0.350]
0.5431
[0.418]
2.8945
[2.882]
0.0014
[0.001]
SYM5690.0024
[0.002]
0.0621
[0.062]
0
[0.0003]
0.0008
[0.001]
0.0116
[0.015]
−0.546
[−0.54]
0.7909
[0.796]
1.3374
[1.341]
3.1823
[3.220]
59.369
[59.386]
0.0026
[0.003]
HLX5690.0019
[0.002]
0.0363
[0.038]
0
[0.001]
0.0010
[0.001]
0.0302
[0.032]
−0.123
[−0.12]
0.1732
[0.165]
0.2966
[0.290]
0.3318
[0.162]
1.3405
[1.145]
0.0015
[0.002]
AI569−0.0021
[−0.002]
0.0546
[0.055]
−0.0008
[0.0008]
−0.0021
[−0.002]
0.0423
[0.043]
−0.305
[−0.31]
0.2900
[0.281]
0.5956
[0.593]
0.1144
[0.099]
4.2432
[4.205]
0.0022
[0.002]
ATS5690.0009
[0.001]
0.0230
[0.025]
0.0009
[0.001]
0.0002
[0.0005]
0.0175
[0.018]
−0.098
[−0.13]
0.1248
[0.122]
0.2229
[0.258]
0.5435
[0.003]
3.2946
[4.143]
0.0009
[0.001]
ISRG5690.0002
[0.0001]
0.0223
[0.023]
0.0016
[0.001]
0.0007
[0.001]
0.0174
[0.017]
−0.154
[−0.15]
0.1032
[0.105]
0.2579
[0.261]
−0.4988
[−0.616]
5.694
[5.554]
0.0009
[0.001]
PRO569−0.0004
[−0.001]
0.0338
[0.034]
−0.0008
[0.001]
−0.0005
[−0.0002]
0.0298
[0.032]
−0.103
[−0.10]
0.1204
[0.101]
0.2237
[0.208]
0.0708
[−0.068]
0.5373
[0.259]
0.0014
[0.001]
AI_index569−0.0004
[−0.001]
0.0182
[0.019]
−0.0008
[0.0003]
−0.0004
[−0.0001]
0.0175
[0.017]
−0.059
[−0.09]
0.0767
[0.063]
0.1358
[0.157]
−0.0022
[−0.333]
0.6785
[1.022]
0.0008
[0.001]
Nasdaq5690.0003
[0.0002]
0.0159
[0.018]
0.0007
[0.002]
0.0005
[0.001]
0.0139
[0.014]
−0.057
[−0.09]
0.0722
[0.046]
0.1292
[0.145]
−0.1538
[−0.624]
1.1400
[2.209]
0.0007
[0.001]
Bond.Price5690.00010.0100−0.0003−0.00030.0055−0.0530.14230.19536.538386.44190.0004
Notes: The daily return is represented without brackets, and brackets represent the values for the daily premium using the CAPM. The reported metrics comport the risks (standard deviation, range), returns (mean, trimmed, min, max) and distribution (kurtosis, skewness).
Table 2. Descriptive statistics of portfolios of AI stocks.
NamesNMeanSdMedianTrimmedMadMinMaxRangeSkewKurtosisSe
Buyandhold5190.00070.01850.00010.00060.0164−0.0930.07220.1657−0.1042.09460.0008
rebal_daily5190.00200.03450.00010.00040.0067−0.0730.71160.785216.772341.90.0015
risk_budget5190.00090.02570.00010.00050.0188−0.1190.19260.31200.73327.46360.0011
risk_rubust5190.00060.0267−3.8 × 10−50.00040.0197−0.1680.19260.36080.30448.32030.001
static_pf_equi5190.00060.02230.00090.00060.0194−0.1650.11140.2769−0.5026.5990.0009
rebal_pf_equi5190.00070.02340.00040.00070.0209−0.1160.11250.22890.02232.10300.0010
Table 3. Portfolios’ downside risk, upside potential, and Sortino ratio.
PortfolioAnnualized
Downside Risk
Daily
Downside Risk
Downside
Potential
OmegaOmega–Sharpe RatioSortino
Ratio
Upside
Potential
Upside
Potential Ratio
Buyandhold0.20270.01280.00661.10810.10810.05590.00730.7847
rebal_daily0.15250.00960.00421.49020.49020.2150.00630.8852
risk_budget0.26720.01680.00851.10760.10760.05410.00940.7626
risk_rubust0.28770.01810.00891.07260.07260.03580.00960.7509
static_pf_equi0.2520.01590.0081.07930.07930.03990.00860.7141
rebal_pf_equi0.25660.01620.00851.08440.08440.04460.00930.7898
Table 4. Sharpe metrics using US bonds.
Buy and HoldRebal_DailyRisk_BudgetRisk_RubustStatic_pf_EquiRebal_pf_EquiMetric
0.0399360.0606660.0364930.0253880.0294830.031865StdDev Sharpe
0.025090.0236690.0294870.0186420.0182030.020382VaR Sharpe
0.0169040.0485320.0294870.0185430.0092290.0142ES Sharpe
Note: The strategy consists in investing 95% in the risky asset and 5% in the free risk rate asset, then it changes accordingly.
Table 5. Sharpe metrics using market rate and Treynor ratio.
PortfolioESSharpeStdDevSharpeVaRSharpeTreynor Ratio
Buy and hold0.0162740.0384480.0241550.002
[0.002]
rebal_daily 0.059866 1.023
[0.956]
risk_budget0.0286190.0354180.0286190.170
[0.163]
risk_rubust0.0177870.0243520.0178820.082
[0.079]
static_pf_equi0.0088430.028250.0174420.102
[0.099]
rebal_pf_equi0.0136760.030690.019630.118
[0.114]
Note: The strategy consists in investing 95% in the risky asset and 5% in the market return (Nasdaq), then it changes accordingly. The Treynor ratio is calculated using the excess return based on the US bonds return.
Table 6. Relationship between portfolios’ and market benchmarks’ systemic risk.
PortfolioBeta CokurtosisBeta CoskewnessBeta CovarianceCokurtosisCoskewness
Buy and hold0.7042
[0.685]
−0.3429
[1.569]
0.725
[0.711]
0
[0]
0
[0]
rebal_daily0.4769
[0.495]
1.4967
[0.440]
0.3878
[0.400]
0
[0]
0
[0]
risk_budget0.9677
[1.061]
2.5442
[0.525]
0.9619
[1.038]
0
[0]
0
[0]
risk_rubust0.9633
[1.050]
2.1116
[0.558]
0.9794
[1.050]
0
[0]
0
[0]
static_pf_equi0.8568
[0.890]
−0.7655
[1.574]
0.9137
[0.954]
0
[0]
0
[0]
rebal_pf_equi0.9651
[1.011]
1.4038
[0.945]
1.0024
[1.059]
0
[0]
0
[0]
Note: Results in brackets are for the portfolios compared to Nasdaq, and those without brackets stand for the AI_index. The reported metrics are systemic risk relation with beta covariance, beta cokurtosis, and beta coskewness, and for distribution cokurtosis and coskewness.
Table 7. Performance of portfolios on AI_index and Nasdaq.
PortfolioActive
Premium
AlphaAnnualized
Alpha
BetaBeta−Beta+CorrelationCorr
p-Value
Information
Ratio
R-SquaredTracking
Error
Treynor
Ratio
Buy and
hold
0.298
[0.133]
0.001
[0.001]
0.305
[0.157]
0.725
[0.711]
0.738
[0.839]
0.721
[0.695]
0.729
[0.628]
0
[0]
1.364
[0.550]
0.531
[0.395]
0.217
[0.241]
0.202
[0.206]
Rebal
daily
0.656
[0.492]
0.002
[0.001]
0.762
[0.651]
0.388
[0.400]
0.446
[0.586]
0.501
[0.527]
0.210
[0.190]
0
[0]
1.159
[0.878]
0.044
[0.036]
0.565
[0.560]
1.302
[1.264]
Risk
budget
0.309
[0.145]
0.001
[0.001]
0.410
[0.198]
0.962
[1.038]
0.962
[1.002]
0.924
[1.053]
0.698
[0.663]
0
[0]
1.058
[0.475]
0.488
[0.440]
0.292
[0.305]
0.165
[0.153]
Risk
rubust
0.228
[0.064]
0.001
[0.001]
0.323
[0.121]
0.979
[1.050]
0.983
[0.984]
0.888
[1.010]
0.685
[0.646]
0
[0]
0.739
[0.198]
0.469
[0.417]
0.308
[0.323]
0.079
[0.074]
static_pf
equi
0.251
[0.087]
0.001
[0.001]
0.308
[0.121]
0.914
[0.954]
0.927
[1.008]
0.811
[0.863]
0.761
[0.699]
0
[0]
1.083
[0.342]
0.579
[0.489]
0.232
[0.255]
0.11
[0.105]
rebal_pf
equi
0.269
[0.105]
0.001
[0.001]
0.351
[0.141]
1.002
[1.059]
0.984
[1.032]
0.921
[1.021]
0.796
[0.740]
0
[0]
1.194
[0.420]
0.634
[0.548]
0.225
[0.251]
0.118
[0.112]
Note: Performance on the AI_index presented as values without brackets, and brackets represent the performance against Nasdaq. Metrics compare the active premium to the Treynor ratio. The Treynor ratio use both benchmarks to calculate the excess return instead of the risk-free rate.
Disclaimer/Publisher’s Note: The statements, opinions and data contained in all publications are solely those of the individual author(s) and contributor(s) and not of MDPI and/or the editor(s). MDPI and/or the editor(s) disclaim responsibility for any injury to people or property resulting from any ideas, methods, instructions or products referred to in the content.

