
Assessing Financial Stability in Turbulent Times: A Study of Generalized Autoregressive Conditional Heteroskedasticity-Type Value-at-Risk Model Performance in Thailand’s Transportation Sector during COVID-19

Abstract
:1. Introduction
2. Literature Review
2.1. Value-at-Risk Concepts and Limitations
2.2. COVID-19 Pandemic and the Transportation Sector
3. Data Acquisition and Methodological Framework
3.1. Value-at-Risk Models: GARCH-VaR Methodologies
3.2. GARCH (1,1) VaR Model
3.3. ARMA (1,1)—GARCH (1,1) VaR: An Integrated Approach for Forecasting Returns and Volatility
3.4. GARCH (1,1)—M: Integrating Volatility in Mean Equations
3.5. IGARCH (1,1) VaR: Refinement of Standard GARCH through the Unit-Root Constraint
3.6. EWMA VaR: Assigning Differential Weights to Historical Observations
3.7. csGARCH (1,1) VaR: Unveiling Long-Term and Short-Term Volatility Impacts
3.8. HS VaR: A Non-Parametric Approach to Quantile Estimation
3.9. DN VaR: A Parametric Model Based on Normal Distribution Assumptions
3.10. Backtesting Methodologies
3.11. Kupiec’s POF Test: Evaluating VaR Model Accuracy
3.12. Independence Test: Assessing Violation Dependencies
3.13. Christoffersen’s Interval Forecast Test: A Combined Approach
4. Results
5. Discussion
- Practical Usefulness of Models: While our study primarily utilized statistical tests to assess the effectiveness of various models, their real-world practical utility is of paramount importance. The theoretical robustness of GARCH-type VaR models, as demonstrated in our research, suggests potential effectiveness in actual risk management practices. However, the application of these models in real financial settings might reveal additional insights. Therefore, we propose further research to apply these models in practical scenarios, which will enhance our understanding of their practicality and effectiveness in real-world financial risk management.
- Use by Investors: The question of whether investors employ GARCH-type VaR models in managing their stock portfolios is significant. While our study demonstrates their theoretical soundness, their actual adoption by investors may vary due to diverse factors such as market conditions, investor risk appetite, and regulatory environments. To better understand the real-world applicability of these models, we recommend conducting empirical research that explores their usage in practical investment scenarios.
- Impact on Investment Returns: Understanding the correlation between specific risk management models and actual investment returns is essential yet complex. Our future research aims to investigate how different risk management strategies, including the use of GARCH-type VaR models, affect real investment outcomes. This investigation will help elucidate the tangible impact these models have on investment performance.
- Research Scope and Generalization: Our current research focuses on Thailand’s transportation sector during the COVID-19 pandemic. This specific context provides valuable insights but also limits the generalizability of our findings. We acknowledge the necessity of conducting further studies in different sectors or under varying economic conditions. Such broader analyses will enable us to generalize our findings more effectively and understand the versatility of these models across diverse economic landscapes.
- Model Application Beyond COVID-19: The scope of our study is confined to the market conditions prevalent during the COVID-19 pandemic, which were characterized by high volatility and uncertainty. It is crucial to evaluate the performance of GARCH-type VaR models under more stable or ‘normal’ financial conditions. Future research should focus on assessing these models’ effectiveness in various market environments, thereby providing a comprehensive view of their applicability and robustness across different economic cycles.
6. Conclusions
Author Contributions
Funding
Data Availability Statement
Acknowledgments
Conflicts of Interest
References
- Abad, Pilar, Sonia Benito, Carmen López Martín, and Miguel Ángel Sánchez-Granero. 2016. Evaluating the performance of the skewed distributions to forecast value-at-risk in the global financial crisis. Journal of Risk 18: 1–28. [Google Scholar] [CrossRef]
- Abdullah, Asaduddin, Noer Azam Achsani, and Suhendi. 2020. Bankruptcy analysis of national airlines companies in Regional asia after COVID-19 pandemic. Jurnal Aplikasi Bisnis dan Manajemen 6: 691. [Google Scholar] [CrossRef]
- Açikgöz, Ömer, and Asli Günay. 2020. The early impact of the COVID-19 pandemic on the global and Turkish economy. Turkish Journal of Medical Sciences 50: 520–26. Available online: https://www.ncbi.nlm.nih.gov/pmc/articles/PMC7195973/pdf/turkjmedsci-50-520.pdf (accessed on 30 December 2023).
- Angelidis, Timotheos, Alexandros Benos, and Stavros Degiannakis. 2004. The use of GARCH models in VaR estimation. Statistical Methodology 1: 105–28. [Google Scholar] [CrossRef]
- Ardia, David, and Lennart F. Hoogerheide. 2014. GARCH models for daily stock returns: Impact of estimation frequency on Value-at-Risk and Expected Shortfall forecasts. Economics Letters 123: 187–90. [Google Scholar] [CrossRef]
- Armanda, Firly, Fatwa Aulia, Jodi Surya Gustanto, Jalil Mujib Tan Ismail, Jonatan Halomoan, Dianita Fitriani Pogram, Girindra Chandra Alam, and Dewi Hanggraeni. 2022. Value at Risk (VaR) and Expected Shortfall (ES) Measurements for Foreign Currency Portfolio Using EWMA and GARCH (1, 1). Syntax Literate; Jurnal Ilmiah Indonesia 7: 17462–75. [Google Scholar]
- Aunyawong, Wissawa, Preecha Wararatchai, Mohd R. Shaharudin, Anchalee Hirunpat, and Sittiporn Rodpangwan. 2021. The mediating role of transportation practices during the COVID-19 crisis in Thailand. The Open Transportation Journal 15: 170–81. [Google Scholar] [CrossRef]
- Baker, Scott R., Nicholas Bloom, Steven J. Davis, Kyle Kost, Marco Sammon, and Tasaneeya Viratyosin. 2020. The Unprecedented Stock Market Reaction to COVID-19. The Review of Asset Pricing Studies 10: 742–58. [Google Scholar] [CrossRef]
- Bao, Yong, Tae-Hwy Lee, and Burak Saltoglu. 2006. Evaluating predictive performance of value-at-risk models in emerging markets: A reality check. Journal of Forecasting 25: 101–28. [Google Scholar] [CrossRef]
- Bekaert, Geert, and Campbell R. Harvey. 2003. Emerging markets finance. Journal of Empirical Finance 10: 3–55. [Google Scholar] [CrossRef]
- Bekaert, Geert, Claude B. Erb, Campbell R. Harvey, and Tadas E. Viskanta. 1998. Distributional characteristics of emerging market returns and asset allocation. Journal of Portfolio Management 24: 102. [Google Scholar] [CrossRef]
- Campbell, Sean D. 2005. A Review of Backtesting and Backtesting Procedures. Finance and Economics Discussion Series 2005: 1–23. [Google Scholar] [CrossRef]
- Chancharat, Surachai, and Supawat Meeprom. 2022. The effect of the COVID-19 outbreak on hospitality and tourism stock returns in Thailand. Anatolia 33: 564–75. [Google Scholar] [CrossRef]
- Charoennapharat, Teerasak, and Poti Chaopaisarn. 2022. Factors affecting multimodal transport during COVID-19: A Thai service provider perspective. Sustainability 14: 4838. [Google Scholar] [CrossRef]
- Christoffersen, Peter F. 1998. Evaluating interval forecasts. International Economic Review 39: 841–62. [Google Scholar] [CrossRef]
- Chu, Jeffrey, Stephen Chan, Saralees Nadarajah, and Joerg Osterrieder. 2017. GARCH modelling of cryptocurrencies. Journal of Risk and Financial Management 10: 17. [Google Scholar] [CrossRef]
- Cifter, Atilla. 2011. Value-at-risk estimation with wavelet-based extreme value theory: Evidence from emerging markets. Physica A Statistical Mechanics and Its Applications 390: 2356–67. [Google Scholar] [CrossRef]
- Degiannakis, Stavros, Christos Floros, and Alexandra Livada. 2012. Evaluating value-at-risk models before and after the financial crisis of 2008. Managerial Finance 38: 436–52. [Google Scholar] [CrossRef]
- De Jesús, Raúl, and Edgar Ortiz. 2011. Risk in emerging stock markets from Brazil and Mexico: Extreme value theory and alternative value at risk models. Frontiers in Finance and Economics 8: 49–88. [Google Scholar]
- Dimitrakopoulos, Dimitris N., Manolis G. Kavussanos, and Spyros I. Spyrou. 2010. Value at risk models for volatile emerging markets equity portfolios. The Quarterly Review of Economics and Finance 50: 515–26. [Google Scholar] [CrossRef]
- Dimopoulou, Davidoula. 2017. Backtesting Different Models of Value-at-Risk. Master’s dissertation, Athens University of Economics and Business, Athens, Greece. [Google Scholar]
- Engle, Robert F., and Gary g. J. Lee. 1999. A long-run and short-run component model of stock return volatility. In Cointegration, Causality, and Forecasting: A Festschrift in Honour of Clive WJ Granger. Oxford: Oxford Academic, pp. 475–97. [Google Scholar]
- Gabriel, Anton Sorin. 2012. Evaluating the Forecasting Performance of GARCH Models. Evidence from Romania. Procedia Social and Behavioral Sciences 62: 1006–10. [Google Scholar] [CrossRef]
- Gençay, Ramazan, and Faruk Selçuk. 2004. Extreme value theory and Value-at-Risk: Relative performance in emerging markets. International Journal of Forecasting 20: 287–303. [Google Scholar] [CrossRef]
- Ghani, I. M. Md, and H. A. Rahim. 2019. Modeling and forecasting of volatility using ARMA-GARCH: Case study on Malaysia natural rubber prices. IOP Conference Series: Materials Science and Engineering 548: 012023. [Google Scholar] [CrossRef]
- Haas, Marcus. 2001. New Methods in Backtesting. Bonn: Research Center Caesar. [Google Scholar]
- Hajihasani, Ahmad, Ali Namaki, Nazanin Asadi, and Reza Tehrani. 2021. Non-extensive value-at-risk estimation during times of crisis. International Journal of Modern Physics C 32: 2150099. [Google Scholar] [CrossRef]
- Halilbegovic, Sanel, Nedim Celebic, Adisa Arapovic, and Mia Vehabovic. 2019. BACK-TESTING THE EFFECTIVENESS OF VALUE AT RISK MODEL. Revista Romana de Economie 48: 5–33. [Google Scholar]
- Holton, Glyn A. 2002. History of Value-at-Risk: 1922–1998. Available online: https://EconPapers.repec.org/RePEc:wpa:wuwpmh:0207001 (accessed on 30 December 2023).
- Jiménez-Martín, Juan-Ángel, Michael McAleer, and Teodosio Pérez-Amaral. 2009. The ten commandments for managing value at risk under the basel ii accord. Journal of Economic Surveys 23: 850–55. [Google Scholar] [CrossRef]
- Jongadsayakul, Woradee. 2021. Value at risk estimation of the SET50 index: Comparison between stock exchange of Thailand and Thailand futures exchange. Journal of International Studies 14: 227–40. [Google Scholar] [CrossRef]
- Jorion, Philippe. 2011. Financial Risk Manager Handbook plus Test Bank: FRM Part I/Part II, 6th ed. Hoboken: John Wiley & Sons, Inc. [Google Scholar]
- Kaszyński, Daniel, Bogumil Kamiński, and Bartosz Pankratz. 2020. Assessment of the size of VaR backtests for small samples. Statistical Review 67: 114–51. [Google Scholar] [CrossRef]
- Ketudat, Sun, and Chawalit Jeenanunta. 2021. Impact of the COVID-19 pandemic on logistics firms and their resilience: Case studies in Thailand. Engineering Management in Production and Services 13: 86–98. [Google Scholar] [CrossRef]
- Korkmaz, Turhan, and Kazim Aydın. 2002. Using EWMA and GARCH Methods in VaR calculations: Application on ISE-30 Index. Available online: https://citeseerx.ist.psu.edu/document?repid=rep1&type=pdf&doi=2e4beb07d9c5331e252e5886453c0b7124bbb1eb (accessed on 30 December 2023).
- Kourouma, Lancine, Denis Dupre, Gilles Sanfilippo, and Ollivier Taramasco. 2010. Extreme Value at Risk and Expected Shortfall during Financial Crisis. Available at SSRN 1744091. Available online: https://ssrn.com/abstract=1744091 (accessed on 30 December 2023).
- Likitratcharoen, Danai, Nopadon Kronprasert, Karawan Wiwattanalamphong, and Chakrin Pinmanee. 2021. The Accuracy of Risk Measurement Models on Bitcoin Market during COVID-19 Pandemic. Risks 9: 222. [Google Scholar] [CrossRef]
- Likitratcharoen, Danai, Pan Chudasring, Chakrin Pinmanee, and Karawan Wiwattanalamphong. 2023. The Efficiency of Value-at-Risk Models during Extreme Market Stress in Cryptocurrencies. Sustainability 15: 4395. [Google Scholar] [CrossRef]
- Likitratcharoen, Danai, Teerasak Na Ranong, Ratikorn Chuensuksomboon, Norrasate Sritanee, and Ariyapong Pansriwong. 2018. Value at Risk Performance In Cryptocurrencies. The Journal of Risk Management and Insurance 22: 11–28. [Google Scholar]
- Linsmeier, Thomas J., and Neil D. Pearson. 2000. Value at Risk. Financial Analysts Journal 56: 47–67. [Google Scholar] [CrossRef]
- Maneenop, Sakkakom, and Suntichai Kotcharin. 2020. The impacts of COVID-19 on the global airline industry: An event study approach. Journal of air Transport Management 89: 101920. [Google Scholar]
- Manganelli, Simone, and Robert F. Engle. 2001. Value at Risk Models in Finance. Available online: https://www.ecb.europa.eu/pub/pdf/scpwps/ecbwp075.pdf (accessed on 30 December 2023).
- Marobhe, Mutaju Isaack. 2022. Investors’ reactions to COVID-19 related announcements: Evidence from the cargo shipping industry. Review of Behavioral Finance 14: 833–53. [Google Scholar] [CrossRef]
- Mavani, Mohini Purshottam. 2020. The Value at Risk Models in Times of Financial Crisis: Case Study of an Irish Equity Portfolio. Master’s dissertation, National College of Ireland, Dublin, Ireland. [Google Scholar]
- Mazur, Mieszko, Man Dang, and Miguel Vega. 2021. COVID-19 and the march 2020 stock market crash. Evidence from S&P1500. Finance Research Letters 38: 101690. [Google Scholar]
- Meeampol, Sasivimol, Polwat Lerskullawat, Ausa Wongsorntham, Phanthipa Srinammuang, Vimol Rodpetch, and Rungsimaporn Noonoi. 2014. Applying Emerging Market Z-Score Model to Predict Bankruptcy: A Case Study of Listed Companies in the Stock Exchange of Thailand (Set). Available online: https://ideas.repec.org/h/tkp/mklp14/1227-1237.html (accessed on 30 December 2023).
- Miletic, Mirjana, and Sinisa Miletic. 2015. Performance of Value at Risk models in the midst of the global financial crisis in selected CEE emerging capital markets. Economic Research-Ekonomska Istraživanja 28: 132–66. [Google Scholar] [CrossRef]
- Mody, Ashoka. 2003. What is an emerging market. Georgetown Journal of International Law 35: 641. [Google Scholar] [CrossRef]
- Ozili, Peterson K., and Thankom Arun. 2020. Spillover of COVID-19: Impact on the Global Economy. Available at SSRN 3562570. Available online: https://ssrn.com/abstract=3562570 (accessed on 30 December 2023).
- Pritsker, Matthew. 2006. The hidden dangers of historical simulation. Journal of Banking and Finance 30: 561–82. [Google Scholar] [CrossRef]
- Ramelli, Stefano, and Alexander F Wagner. 2020. Feverish stock price reactions to COVID-19. The Review of Corporate Finance Studies 9: 622–55. [Google Scholar] [CrossRef]
- Sethapramote, Yuthana, Suthawan Prukumpai, and Tiwa Kanyamee. 2014. Evaluation of Value-at-Risk Estimation Using Long Memory Volatility Models: Evidence from Stock Exchange of Thailand. Available at SSRN 2396531. Available online: https://ssrn.com/abstract=2396531 (accessed on 30 December 2023).
- Seymour, Anthony, and Daniel A. Polakow. 2003. A coupling of extreme-value theory and volatility updating with value-at-risk estimation in emerging markets: A South African test. Multinational Finance Journal 7: 3–23. [Google Scholar] [CrossRef]
- Sheedy, Elizabeth A. 2008. Why VaR Models Fail and What Can be Done. Available at SSRN 1260655. Available online: https://ssrn.com/abstract=1260655 (accessed on 30 December 2023).
- Skoglund, Jimmy, Donald Erdman, and Wei Chen. 2010. The performance of value-at-risk models during the crisis. The Journal of Risk Model Validation 4: 3. [Google Scholar] [CrossRef]
- Sohrabi, Catrin, Zaid Alsafi, Niamh O’Neill, Mehdi Khan, Ahmed Kerwan, Ahmed Al-Jabir, Christos Iosifidis, and Riaz Agha. 2020. World Health Organization declares global emergency: A review of the 2019 novel coronavirus (COVID-19). International Journal of Surgery 76: 71–76. [Google Scholar] [CrossRef]
- Su, Jung-Bin. 2015. Value-at-risk estimates of the stock indices in developed and emerging markets including the spillover effects of currency market. Economic Modelling 46: 204–24. [Google Scholar] [CrossRef]
- Sutheebanjard, Phaisarn, and Wichian Premchaiswadi. 2010. Stock exchange of Thailand index prediction using back propagation neural networks. In Proceedings of the 2010 Second International Conference on Computer and Network Technology, Bangkok, Thailand, April 23–25. [Google Scholar]
- Suwannapak, Suthasinee, and Surachai Chancharat. 2022. Stock Market Volatility Response to COVID-19: Evidence from Thailand. Journal of Risk and Financial Management 15: 592. [Google Scholar] [CrossRef]
- Taskinsoy, John. 2022. Stress Testing Financial Systems: Macro and Micro Stress Tests, Basel Standards and Value-at-Risk as Financial Stability Measures. Basel Standards and Value-at-Risk as Financial Stability Measures (11 February 2022). Available online: https://ssrn.com/abstract=4032869 (accessed on 30 December 2023).
- Trakarnsirinont, Worraphan, Wisuttorn Jitaree, and Wonlop Writthym Buachoom. 2023. Political Uncertainty and Financial Firm Performance: Evidence from the Thai Economy as an Emerging Market in Asia. Economies 11: 18. [Google Scholar] [CrossRef]
- Tsay, Ruey S. 2005. Analysis of Financial Time Series. Hoboken: John Wiley & Sons, vol. 543. [Google Scholar]
- Wang, Yuling, Yunshuang Xiang, Xinyu Lei, and Yucheng Zhou. 2022. Volatility analysis based on GARCH-type models: Evidence from the Chinese stock market. Economic Research-Ekonomska Istraživanja 35: 2530–54. [Google Scholar] [CrossRef]
- Xi, Yi. 2018. Comparison of Option Pricing between ARMA-GARCH and GARCH-M Models. Master’s dissertation, The University of Western Ontario, London, ON, Canada. [Google Scholar]
- Yalmaz, Medjit, and Hans Byström. 2014. Evaluation of Value-at-Risk Models During Volatility Clustering. Master’s dissertation, Lund University, Lund, Sweden. [Google Scholar]
- Zhang, Yuanyuan, and Saralees Nadarajah. 2018. A review of backtesting for value at risk. Communications in Statistics-Theory and Methods 47: 3616–39. [Google Scholar] [CrossRef]


| Model Name | Description | Features |
|---|---|---|
| GARCH (1,1) VaR | A model that captures volatility clustering and mean reversion common in financial time series. | Adjusts to rapid changes in market conditions and provides dynamic risk estimates. |
| ARMA (1,1)—GARCH (1,1) VaR | Combines the ARMA model for capturing autocorrelations in time series data with the GARCH model for volatility modeling. | Useful for series with both autocorrelation and volatility clustering. |
| GARCH (1,1)—M VaR | Incorporates a risk premium that is proportional to the conditional variance in the asset returns. | Accounts for the time-varying risk premium in financial markets. |
| IGARCH (1,1) VaR | A variant of the GARCH model where the sum of the alpha and beta coefficients is set to one, implying a persistent shock to volatility. | Useful for modeling long-term impacts of shocks on volatility. |
| EWMA VaR | Exponentially Weighted Moving Average model giving more weight to recent observations for volatility calculation. | Emphasizes recent market conditions and reacts quickly to market changes. |
| csGARCH (1,1) VaR | Conditional Skewness GARCH model capturing both volatility and skewness in data. | Addresses asymmetry in data, which is often observed in financial returns. |
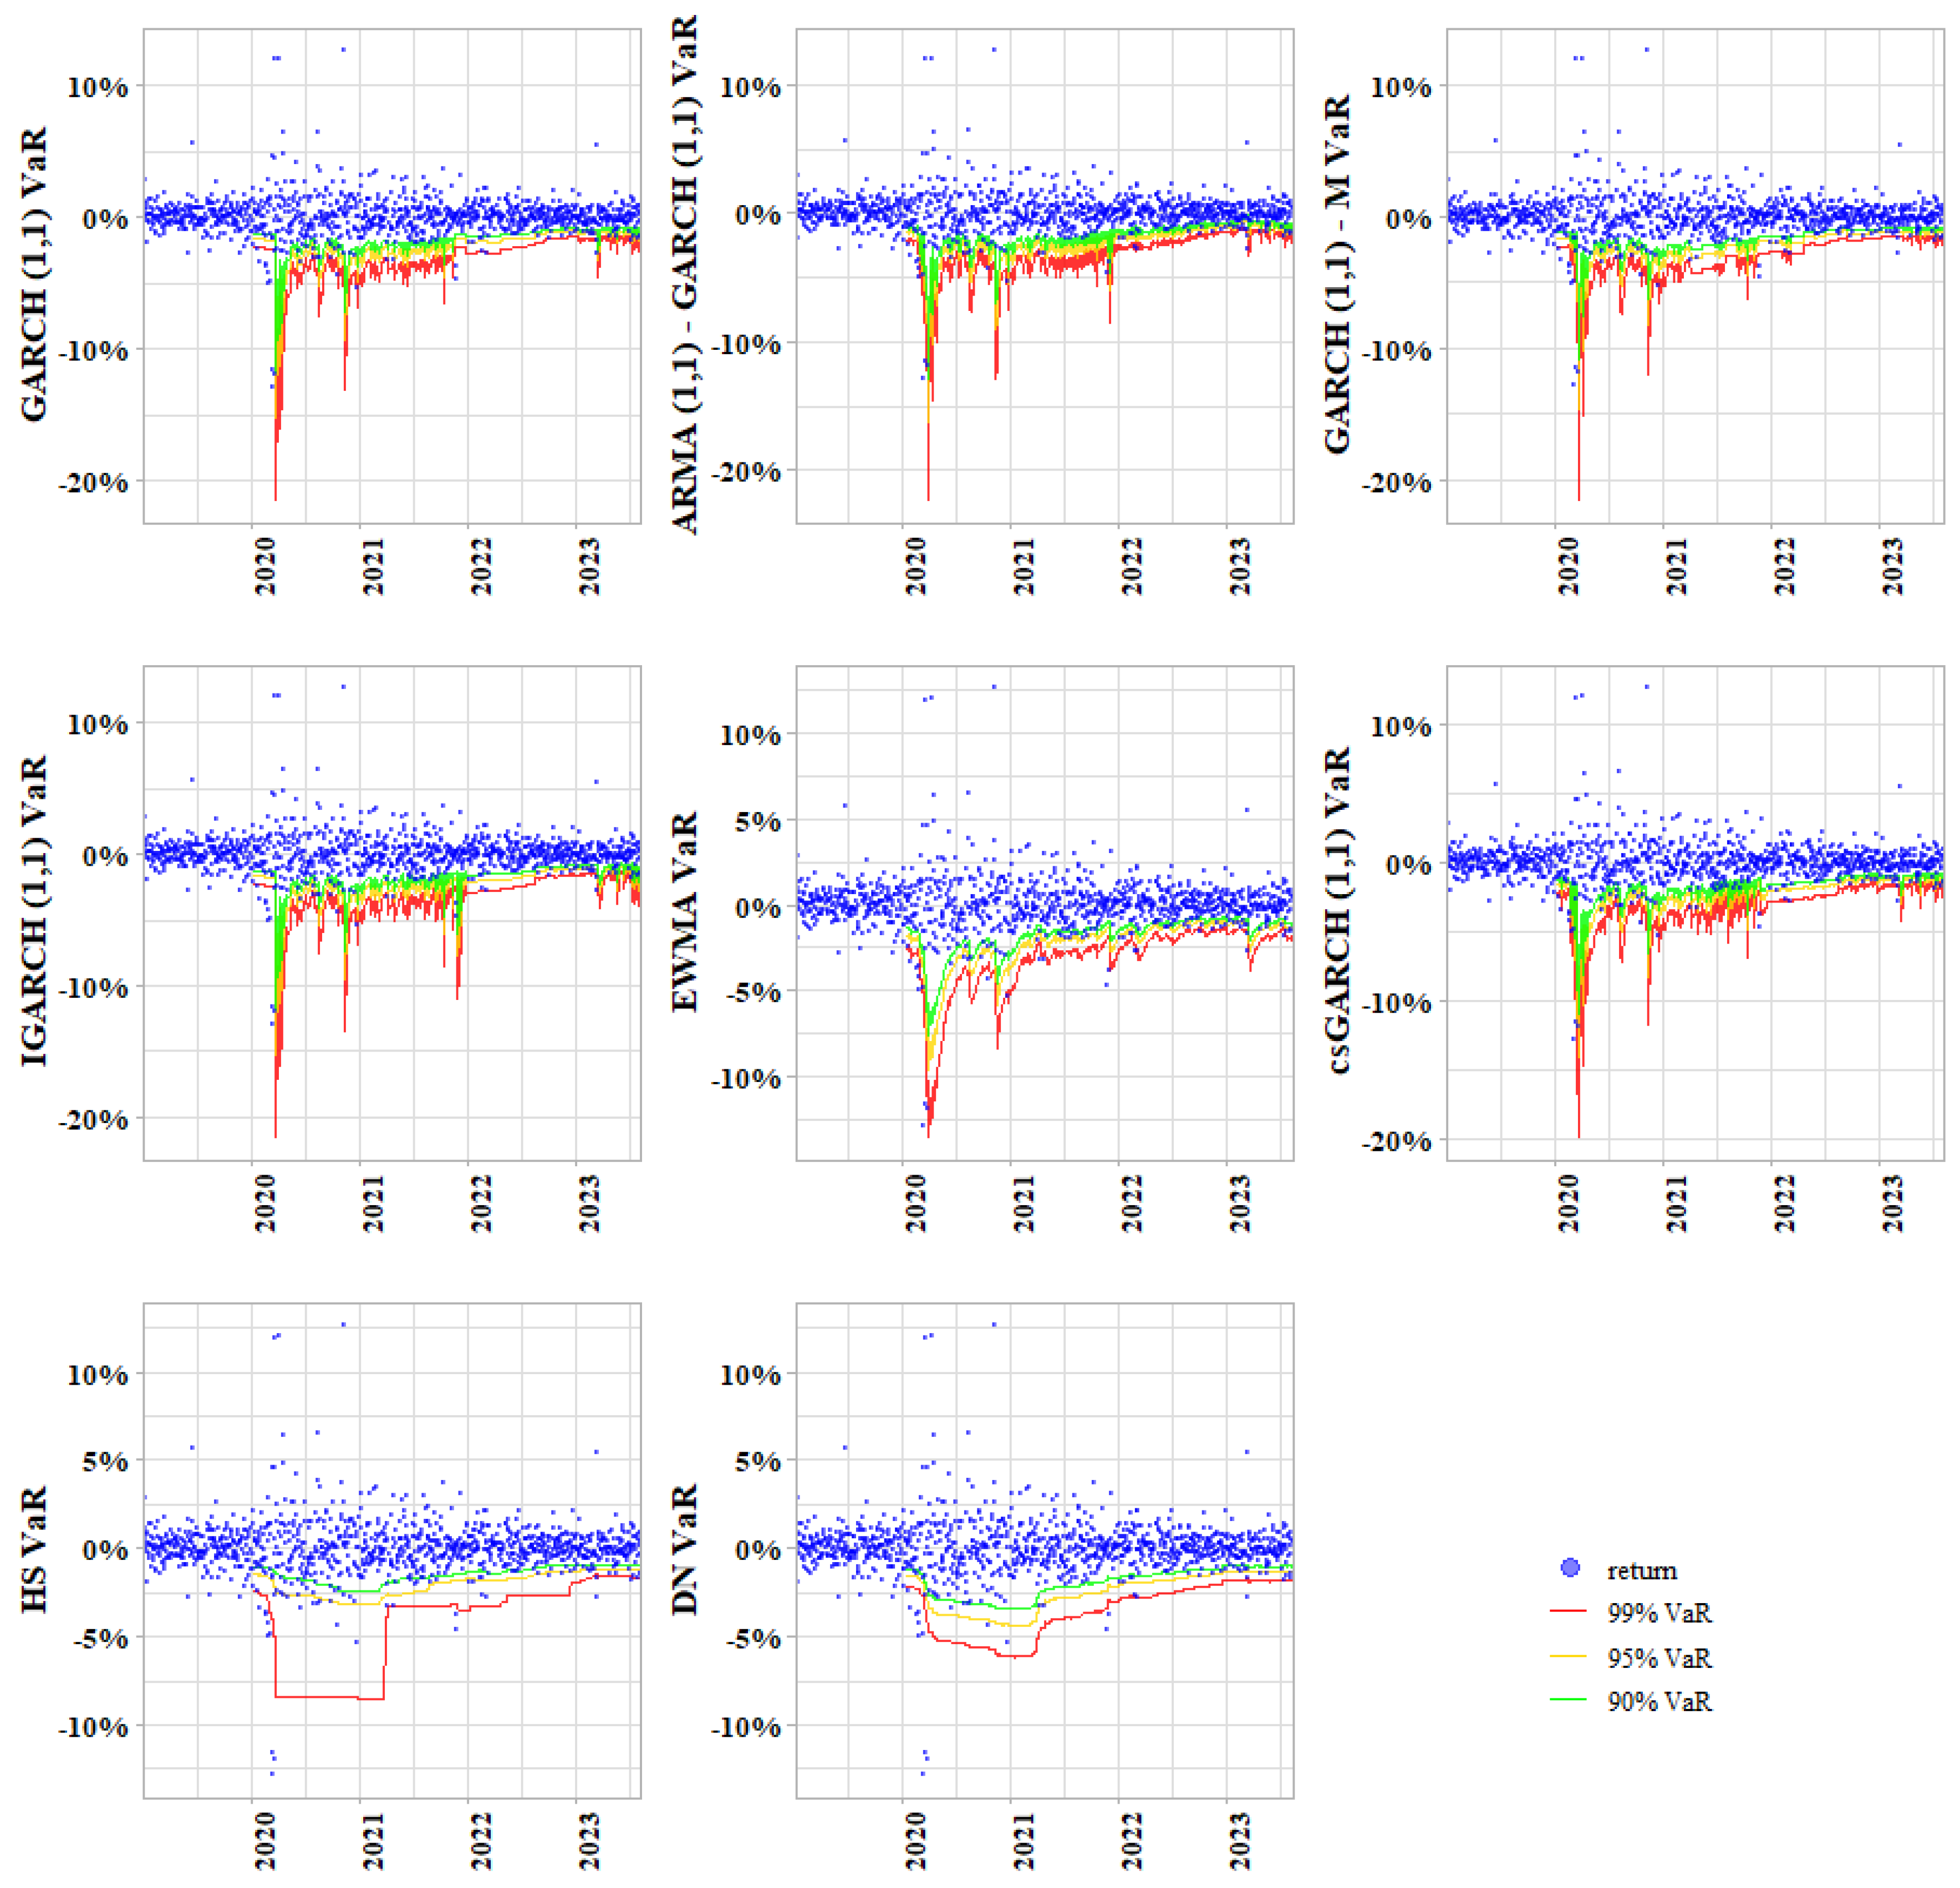
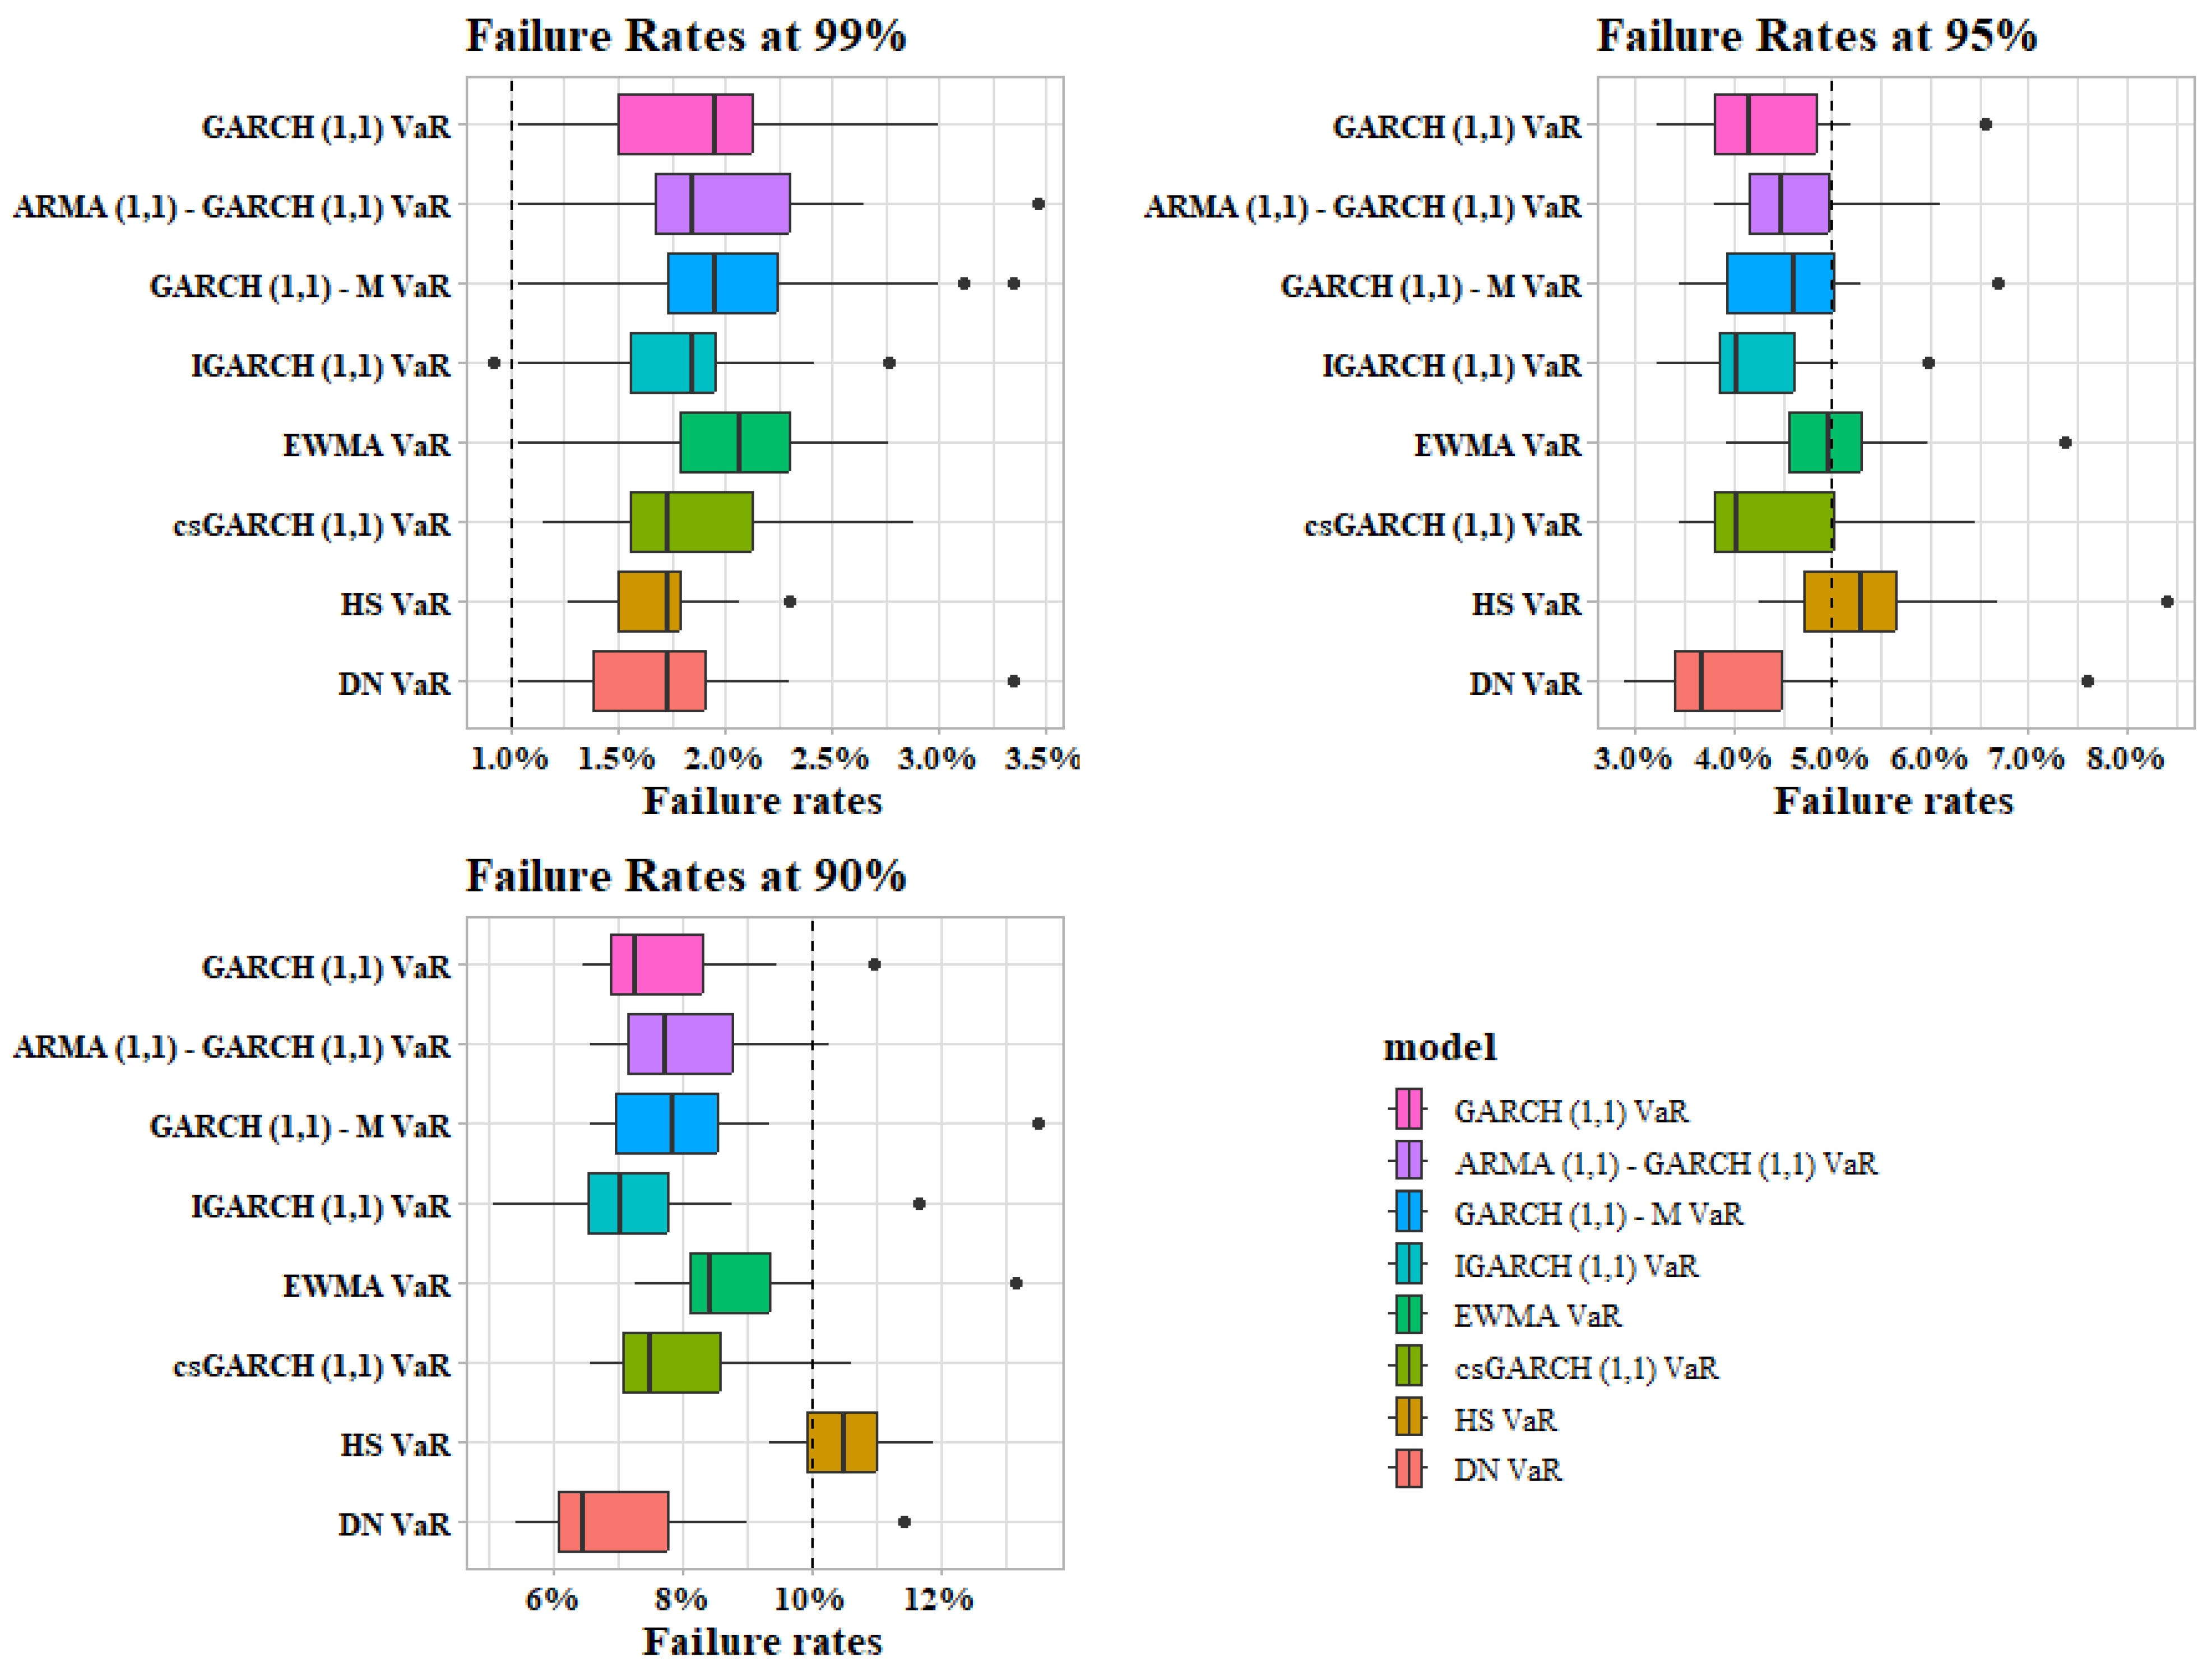
| VaR BackTesting Model | Confidence Level | VaR Model | Figure Reference |
|---|---|---|---|
| Realized Failure Rates | 90, 95, 99 | GARCH(1,1) ARMA(1,1) IGARCH(1,1) EWMA csGARCH(1,1), HS, DN | Figure 2 |
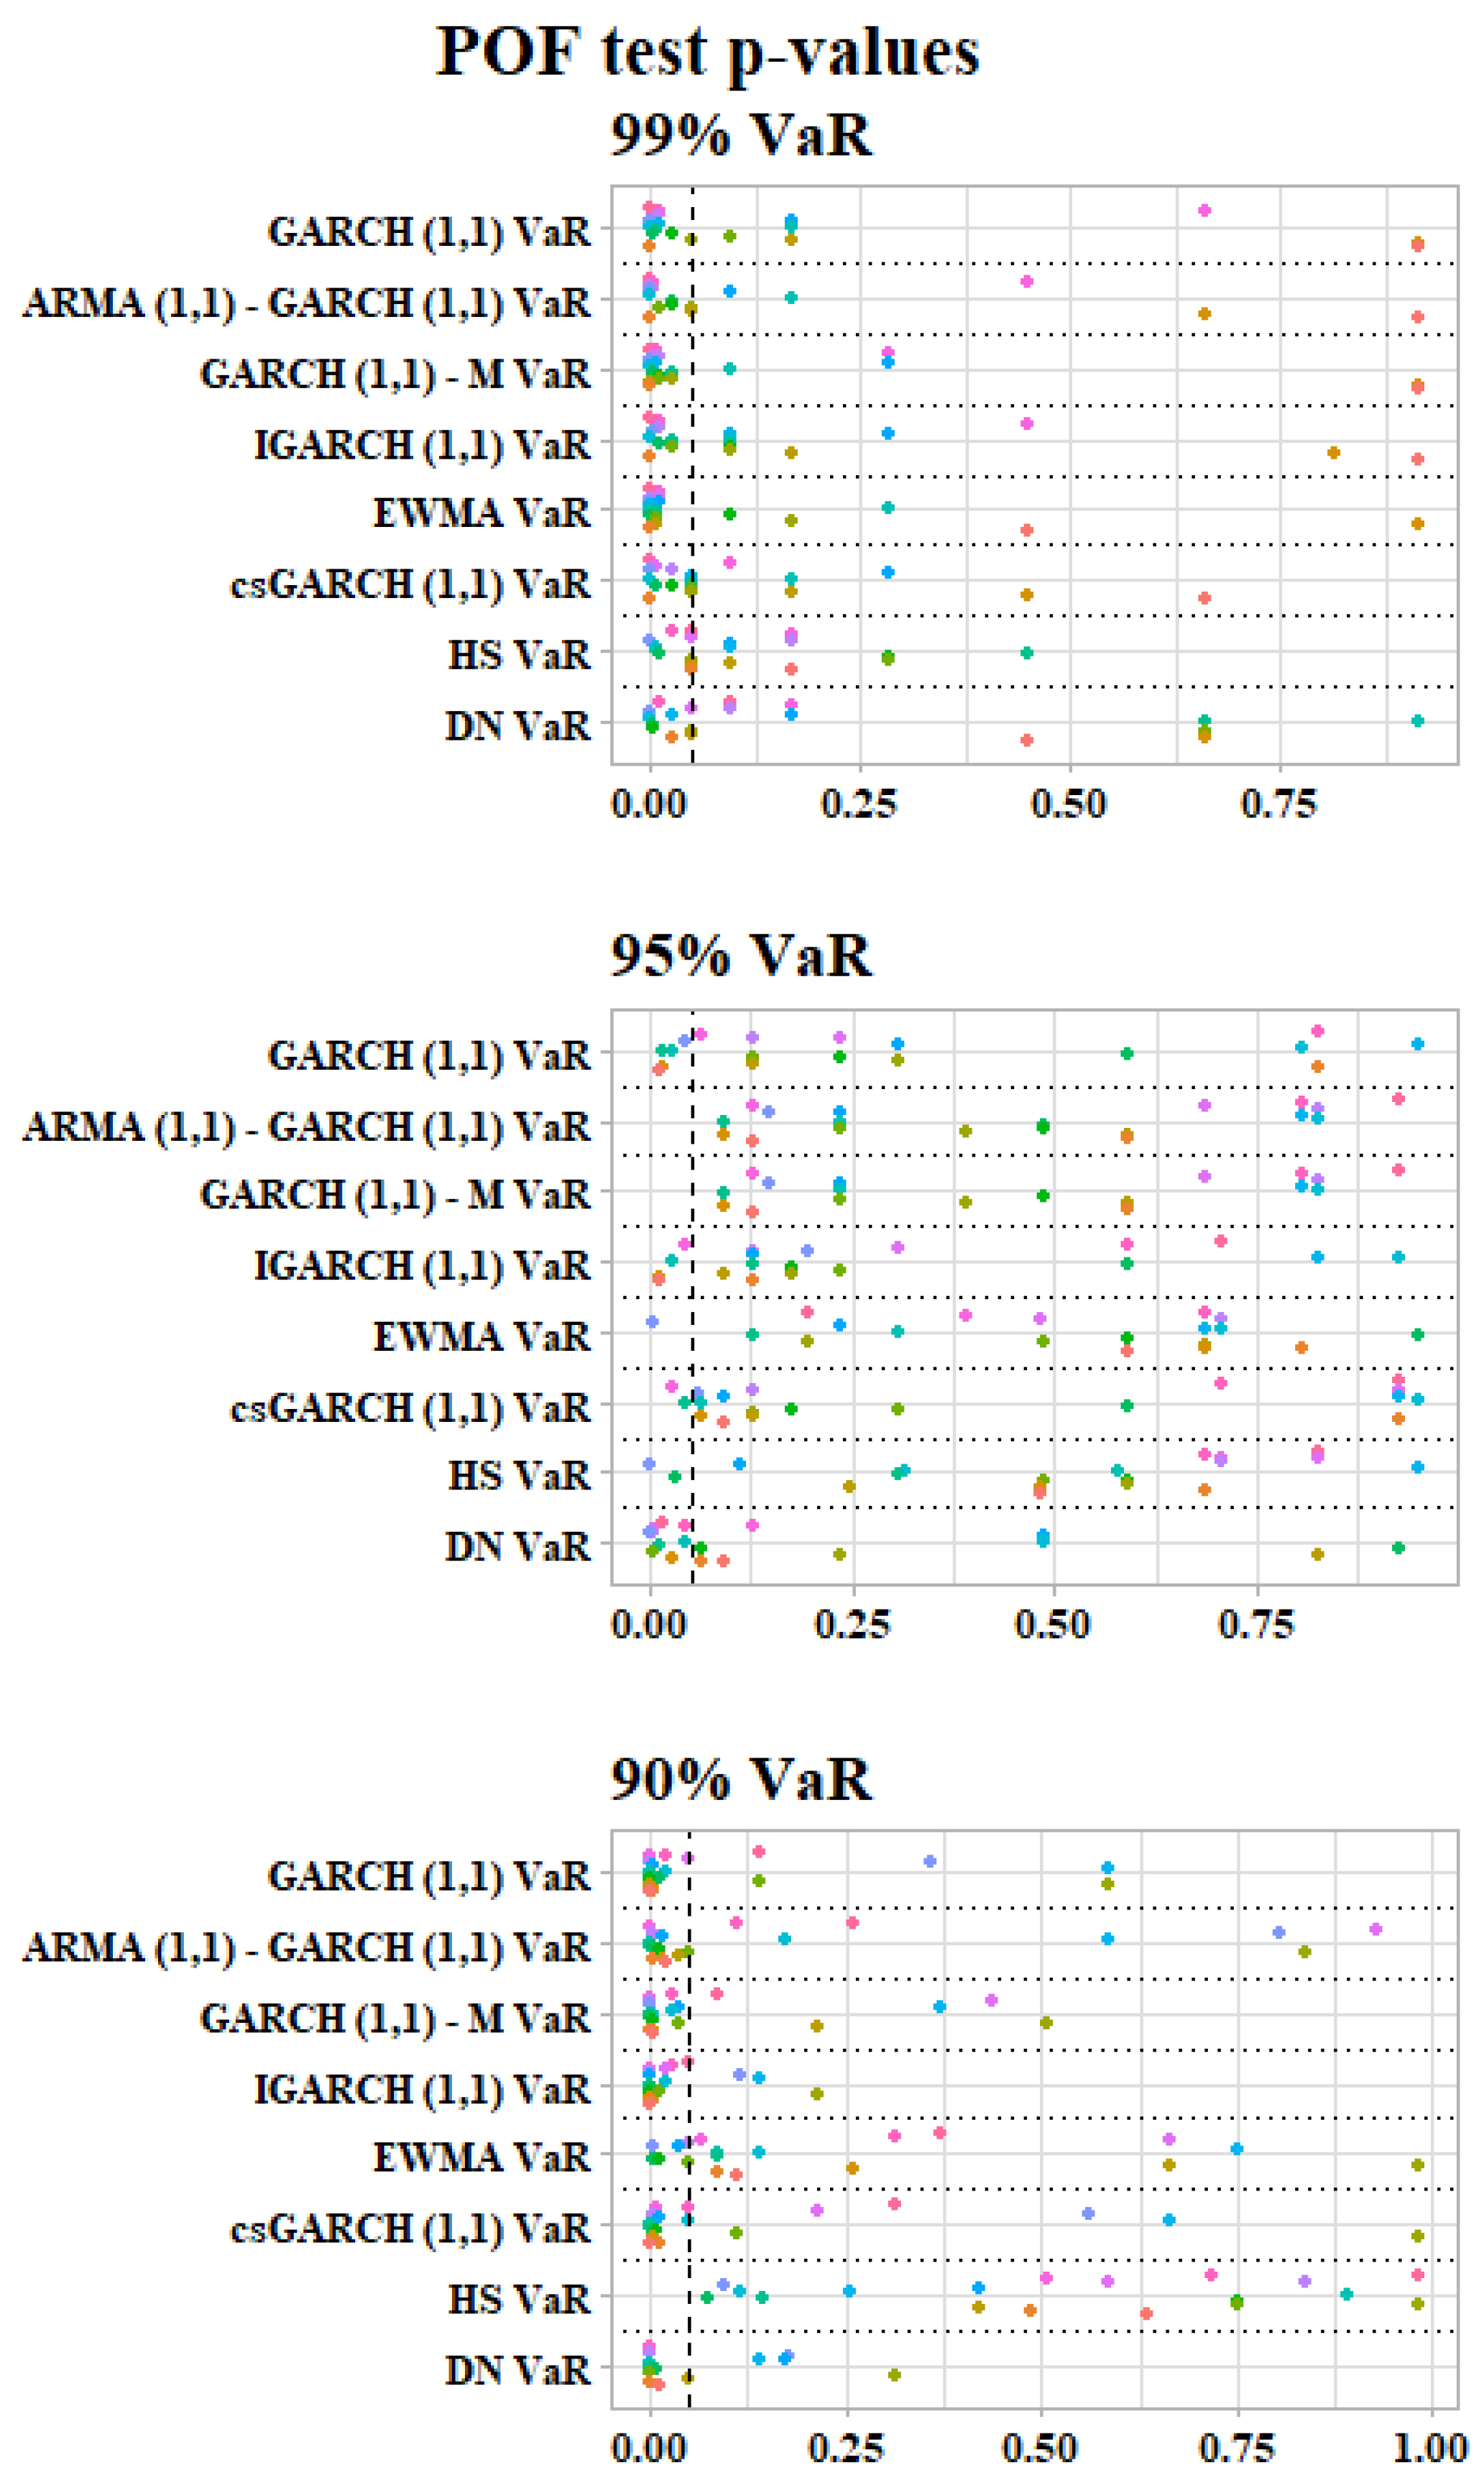
| Kupiec’s POF test p-values | 90, 95, 99 | Figure 3 | |
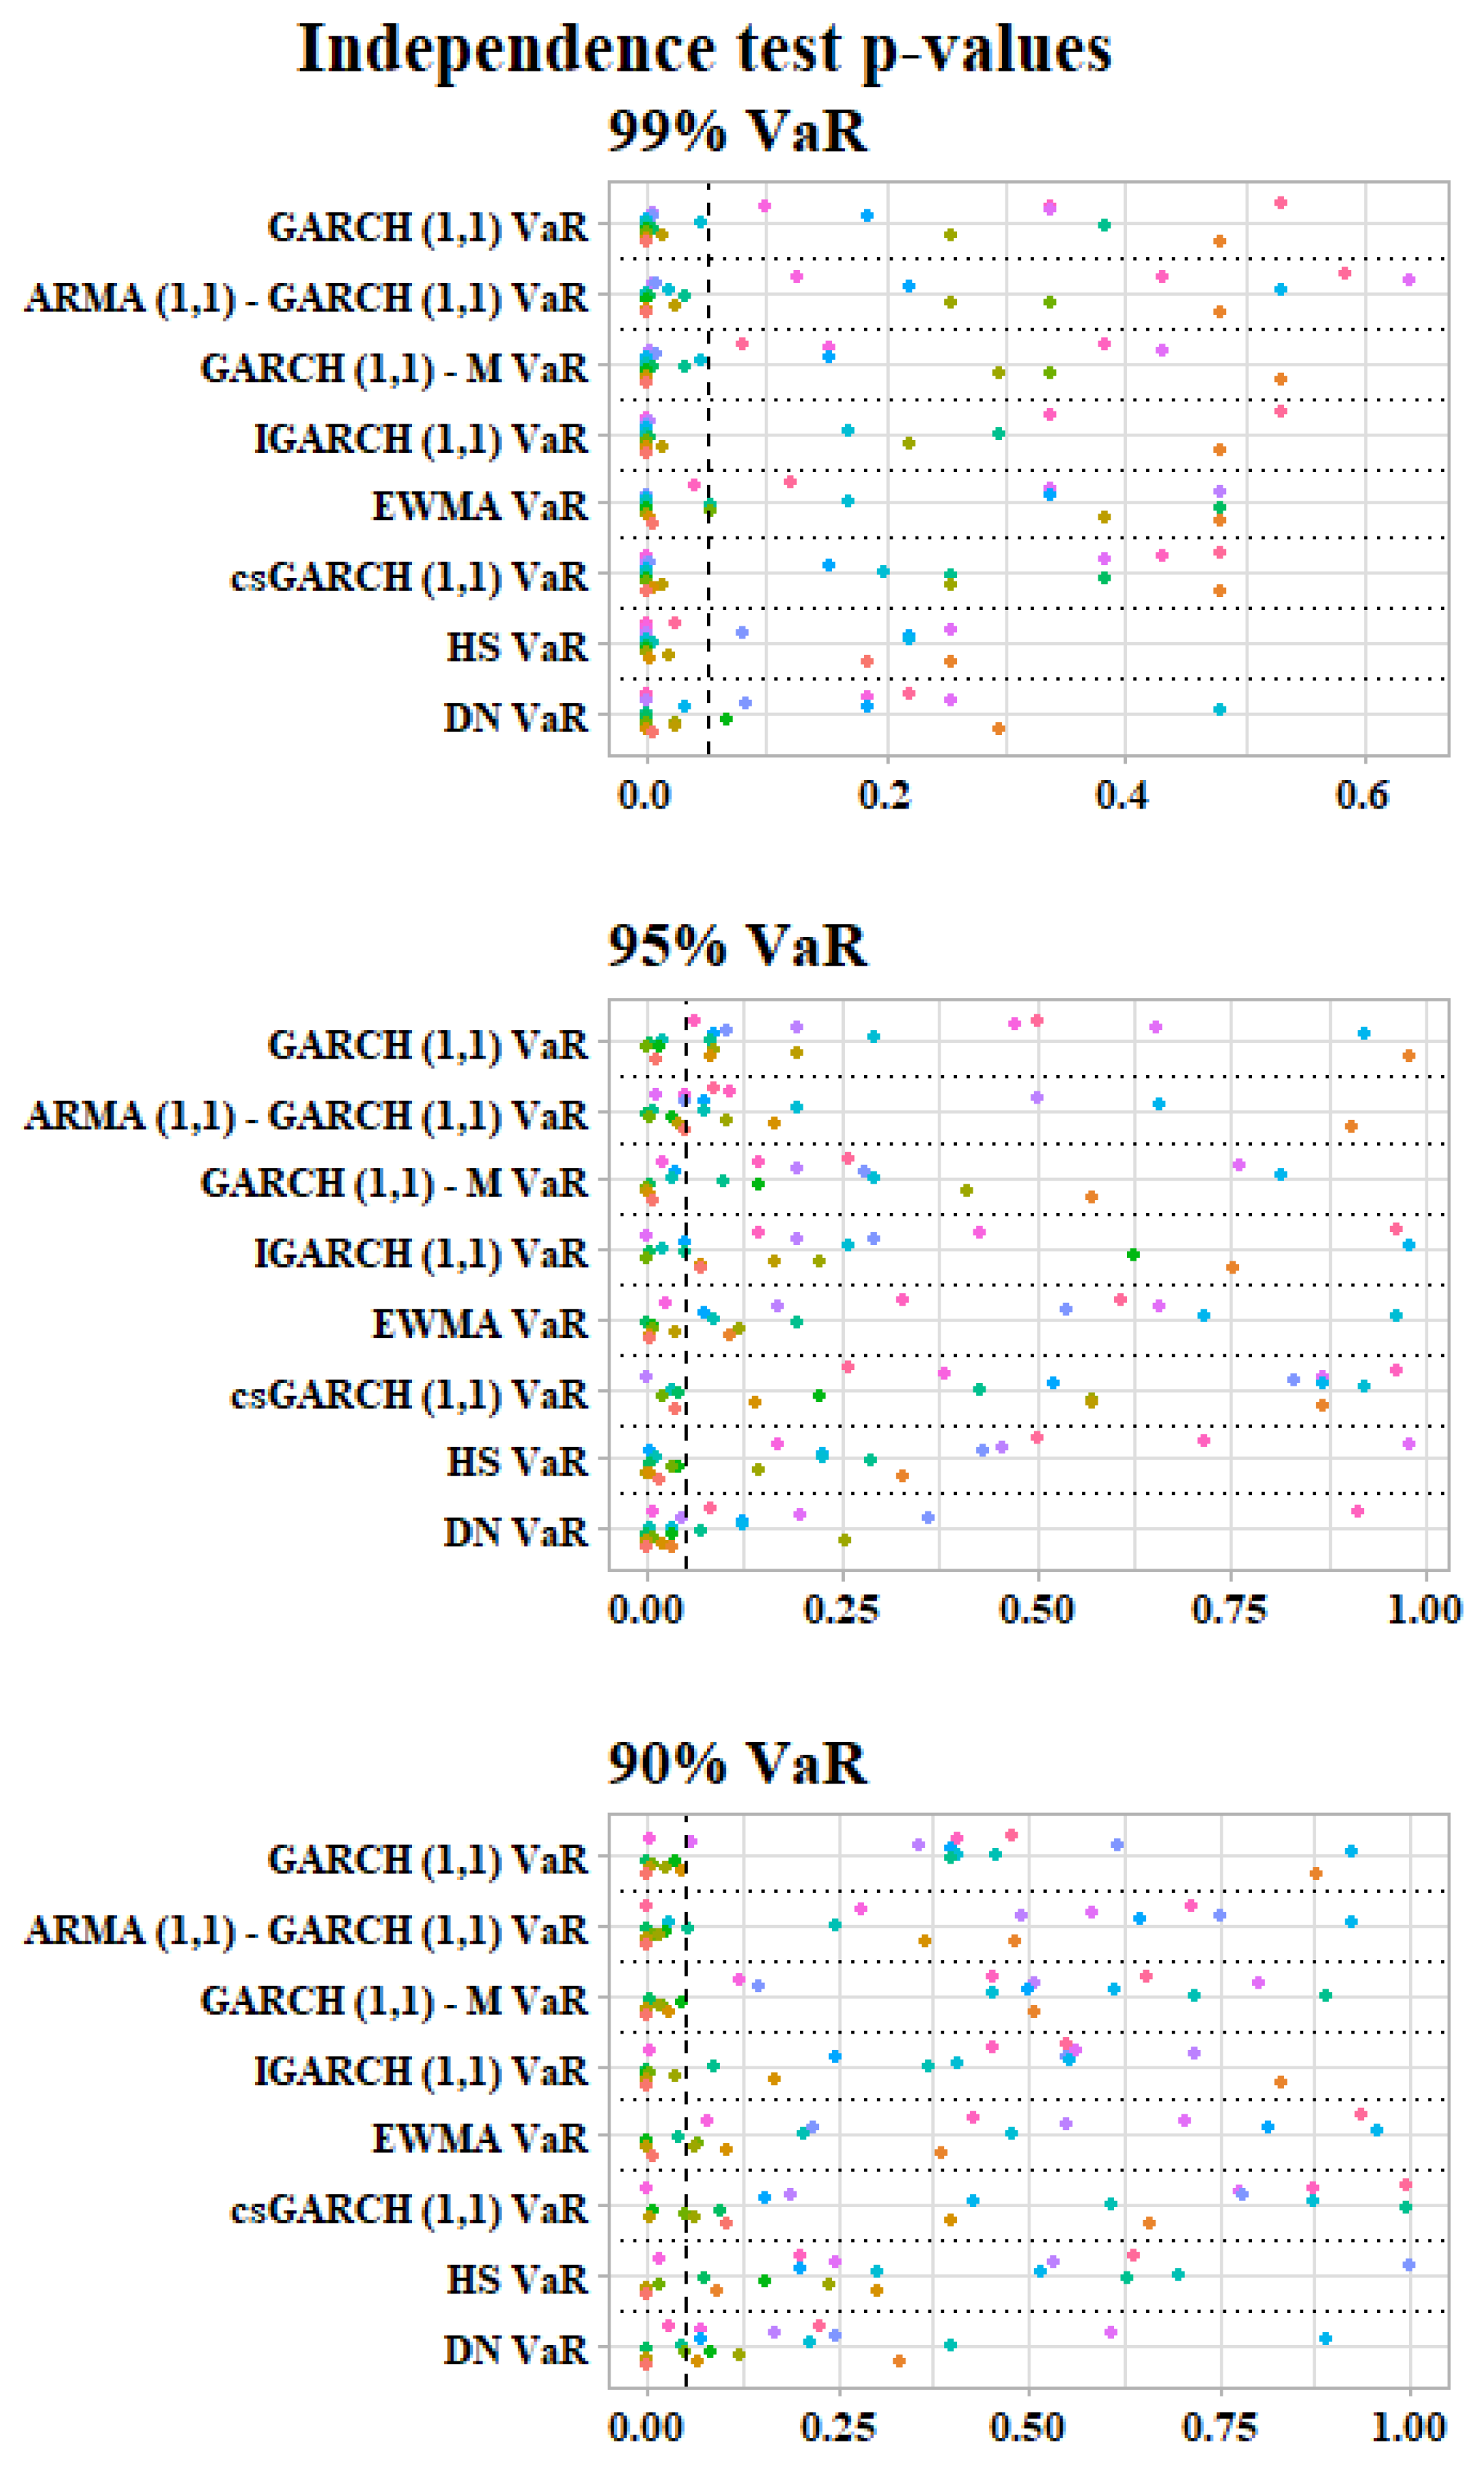
| Independence Test p-values | 90, 95, 99 | Figure 4 | |
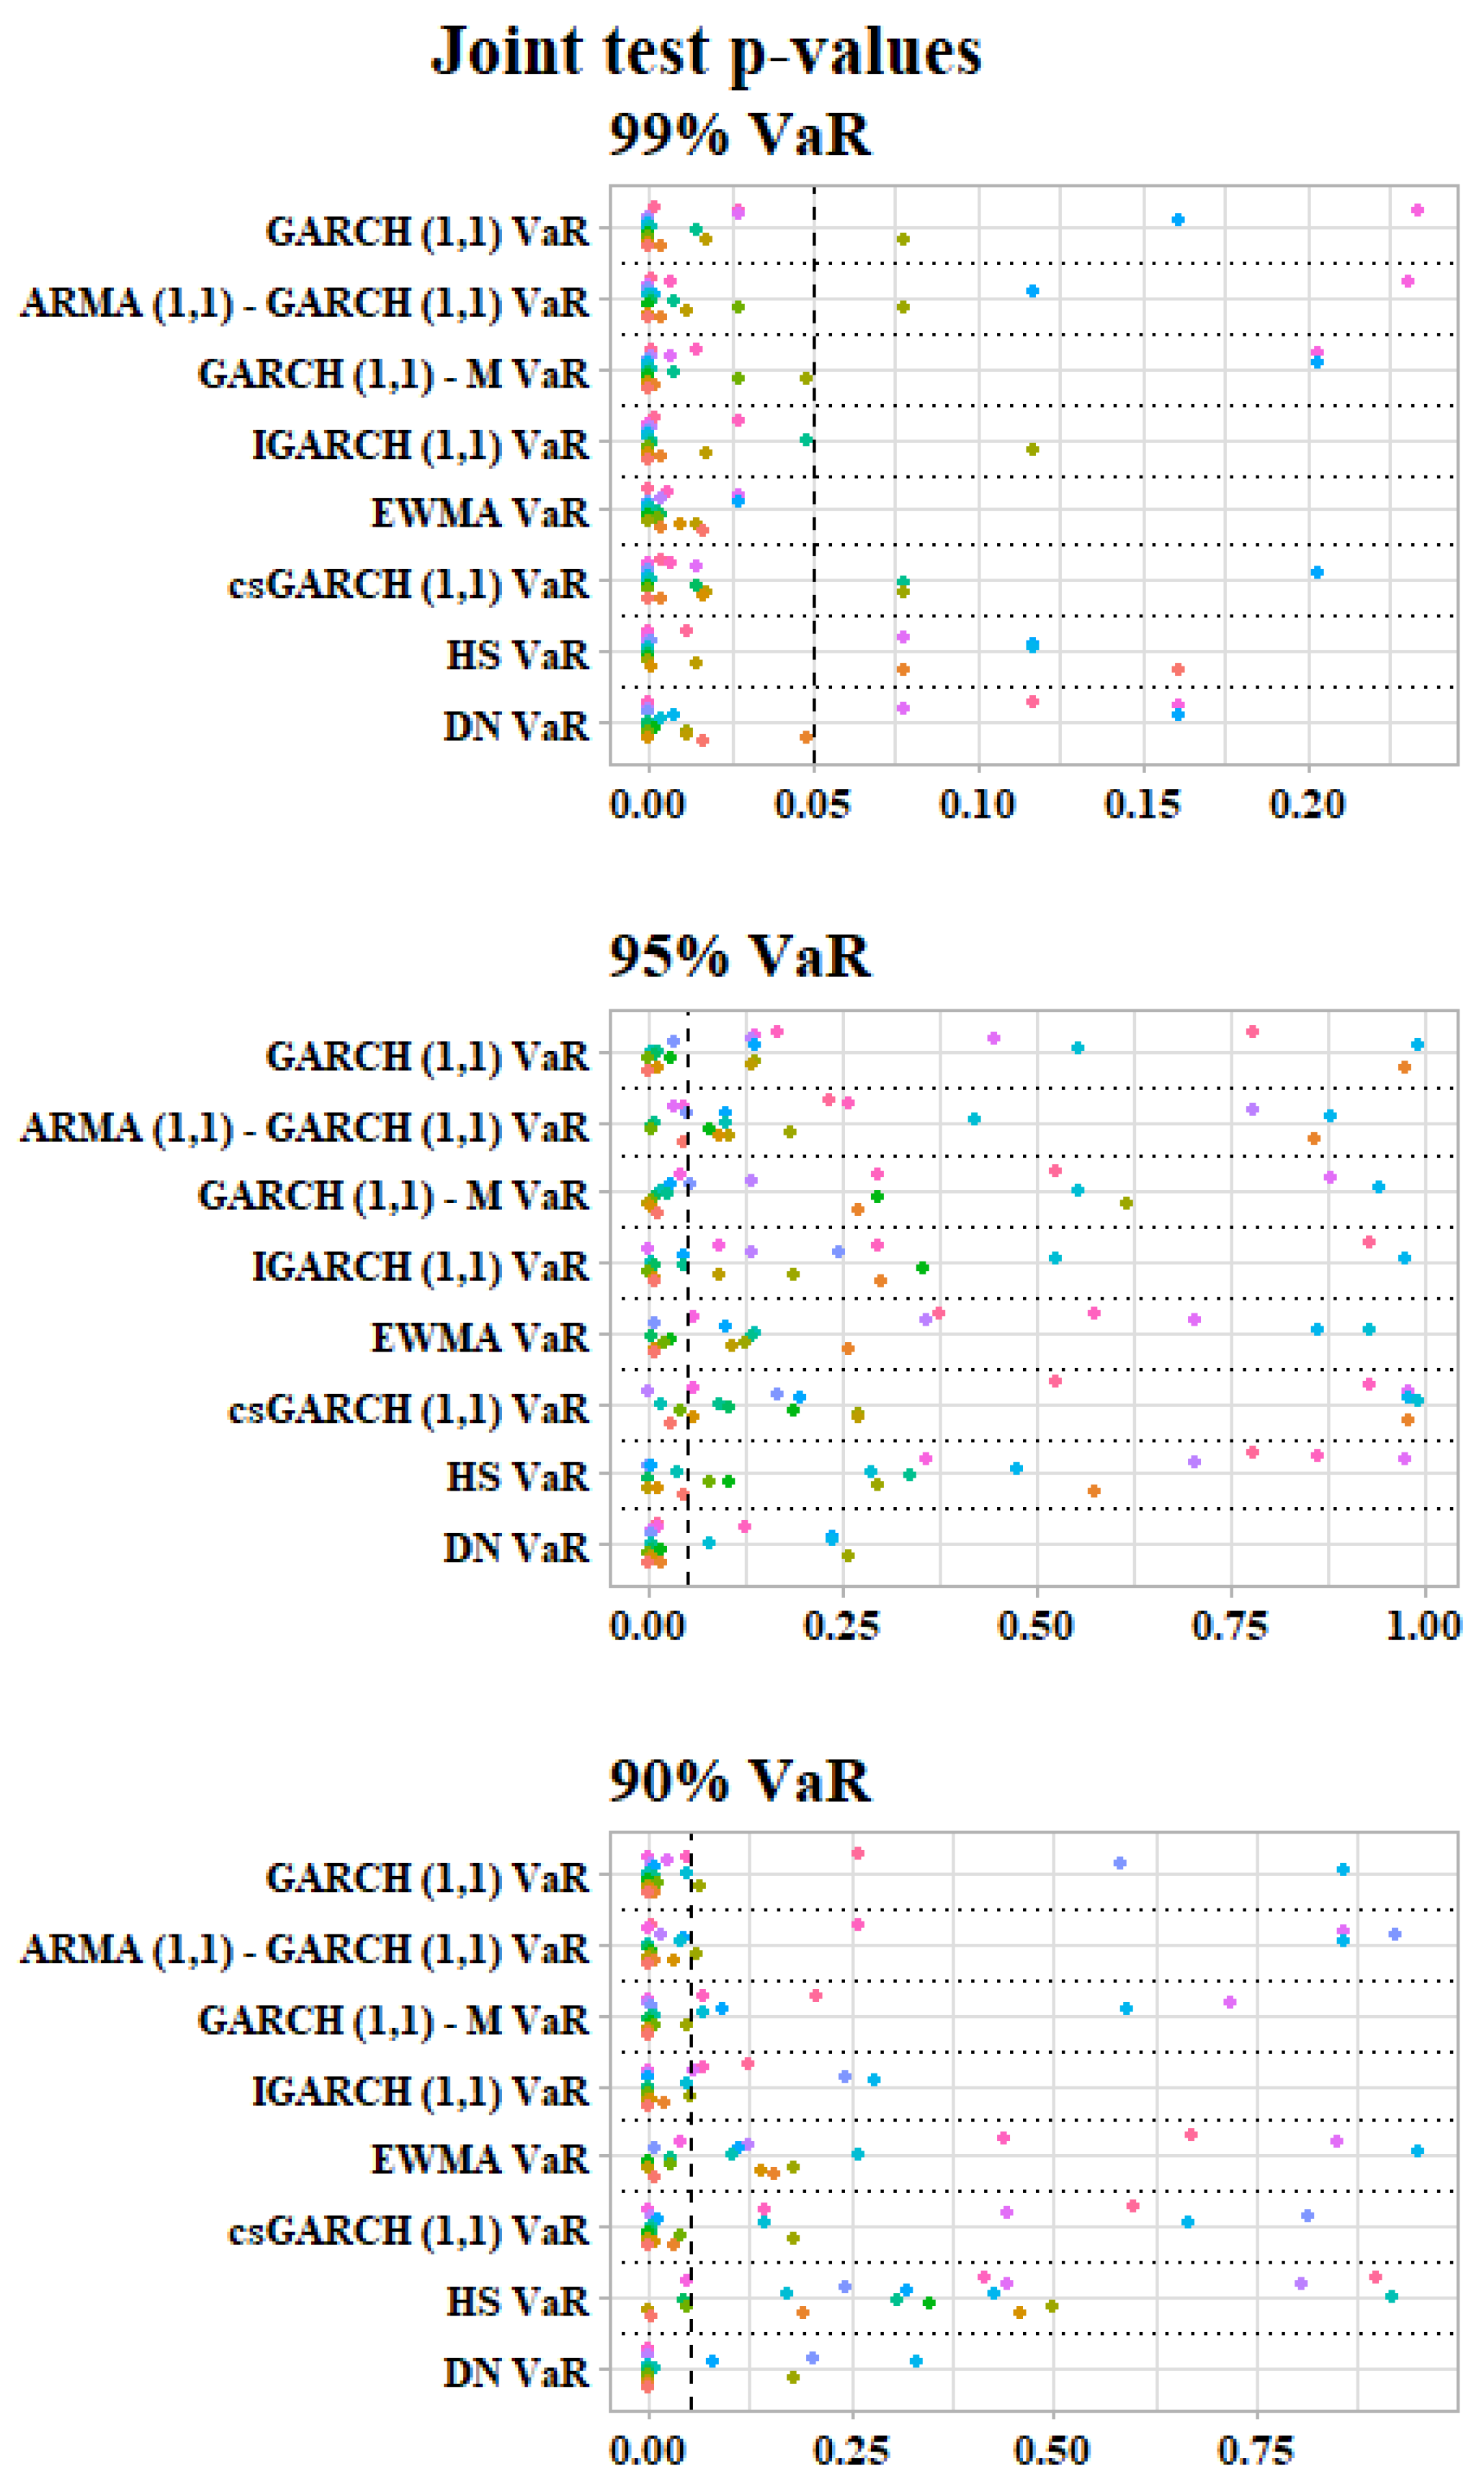
| Christoffersen’s Interval Forecast test p-values | 90, 95, 99 | Figure 5 |
Disclaimer/Publisher’s Note: The statements, opinions and data contained in all publications are solely those of the individual author(s) and contributor(s) and not of MDPI and/or the editor(s). MDPI and/or the editor(s) disclaim responsibility for any injury to people or property resulting from any ideas, methods, instructions or products referred to in the content. |
© 2024 by the authors. Licensee MDPI, Basel, Switzerland. This article is an open access article distributed under the terms and conditions of the Creative Commons Attribution (CC BY) license (https://creativecommons.org/licenses/by/4.0/).
Share and Cite
Likitratcharoen, D.; Suwannamalik, L. Assessing Financial Stability in Turbulent Times: A Study of Generalized Autoregressive Conditional Heteroskedasticity-Type Value-at-Risk Model Performance in Thailand’s Transportation Sector during COVID-19. Risks 2024, 12, 51. https://doi.org/10.3390/risks12030051
Likitratcharoen D, Suwannamalik L. Assessing Financial Stability in Turbulent Times: A Study of Generalized Autoregressive Conditional Heteroskedasticity-Type Value-at-Risk Model Performance in Thailand’s Transportation Sector during COVID-19. Risks. 2024; 12(3):51. https://doi.org/10.3390/risks12030051
Chicago/Turabian StyleLikitratcharoen, Danai, and Lucksuda Suwannamalik. 2024. "Assessing Financial Stability in Turbulent Times: A Study of Generalized Autoregressive Conditional Heteroskedasticity-Type Value-at-Risk Model Performance in Thailand’s Transportation Sector during COVID-19" Risks 12, no. 3: 51. https://doi.org/10.3390/risks12030051