Article

What Matters for Comovements among Gold, Bitcoin, CO2, Commodities, VIX and International Stock Markets during the Health, Political and Bank Crises?

1
Faculty of Economics and Management of Sfax, University of Sfax, Sfax 3018, Tunisia
2
Higher School of Commerce, University of La Manouba, Tunis 2010, Tunisia
3
Department of Business, ECO-SOS, Universitat Rovira i Virgili, Av. Universitat 1, 43204 Reus, Spain
4
Faculty of Economics and Management of Mahdia, University of Monastir, Mahdia 5100, Tunisia
*
Author to whom correspondence should be addressed.
Risks 2024, 12(3), 47; https://doi.org/10.3390/risks12030047
Submission received: 18 January 2024 / Revised: 21 February 2024 / Accepted: 23 February 2024 / Published: 4 March 2024

Abstract

:
This paper analyzes the connectedness between gold, wheat, and crude oil futures, Bitcoin, carbon emission futures, and international stock markets in the G7, BRICS, and Gulf regions with the outbreak of exogenous and unexpected shocks related to health, banking, and political crises. To this end, we use a wavelet-based method on the returns of different assets during the period 2 January 2019, to 21 April 2023. The empirical findings show that the existence of time-varying linkages between markets is well documented and appears stronger during the COVID-19 pandemic. However, it seems to diminish for some associations with the advent of the Russia-Ukraine War. The empirical results also show that investor risk perceptions measured by the VIX are negatively and substantially linked to stock markets in different regions. Other interesting findings emerge from the connectedness analysis with the outbreak of Silicon Valley bankruptcy. In particular, Bitcoin tends to regain its role as a safe-haven asset against some G7 stock markets during the bank crisis. Such findings can provide valuable insights for investors and policymakers concerning the relationship between different markets during different crises.
JEL Classification:
C5; C22; G1

1. Introduction

The growing interest in portfolio diversification from an international perspective has prompted investors and portfolio managers to seek markets and assets that can provide a buffer against losses caused by unexpected shocks. Analyzing cross-asset linkages remains a highly relevant topic for both theoretical and practical reasons, particularly given the increased correlations between stock and commodity markets observed during the post-financial crisis period. Indeed, studies by Junttila et al. (2018) and Creti et al. (2013) indicate that commodity-equity linkages have significantly strengthened since the onset of the 2008–2009 financial crisis. Consequently, commodities have emerged as an integral component of investment portfolios for many investors and portfolio managers (Jain and Biswal 2016).
From an academic standpoint, achieving meaningful portfolio diversification benefits necessitates a deeper understanding of interdependence, contagion, comovements, return and volatility spillovers across different asset classes. While several researchers have focused extensively on gold and crude oil (Kang and Lee 2019; Mensi et al. 2018; Yoon et al. 2019), the diversification benefits of other commodities such as metals and wheat have been largely overlooked. Additionally, studies examining the interdependence between emerging stock and global commodities indices remain relatively scarce (Singh et al. 2018). However, some studies have highlighted gold’s role as an undisputed safe haven and hedge for several stock indices, including those of the G7 (Fakhfekh et al. 2021; Ghorbel and Jeribi 2021; Shahzad et al. 2020), BRICS (Jeribi and Ghorbel 2022), and GCC (Loukil et al. 2021; Maghyereh et al. 2019).
Furthermore, a recent stream of literature has explored the linkages between the carbon emission trading market and financial markets (Cong and Lo 2017; Jiménez-Rodríguez 2019; Krueger et al. 2020; Lin and Wu 2022; Wen et al. 2020; Zhu et al. 2020). These studies have shed light on the potential impact of carbon emissions regulations on asset prices and financial stability. For instance, Jiménez-Rodríguez (2019) reveals that the stock market and the carbon emission trading market are related. Wen et al. (2020) indicate the existence of positive relation between stock returns and the carbon emission trading market. However, Chang et al. (2020) suggest a negative correlation between CO2 emissions and stock returns. On the other hand, the outbreak of the unexpected events such as the COVID-19 pandemic, the Russia-Ukraine War and the 2023 bank crisis have revived interest in exploring the interdependence structure given that market participants are increasingly worried about the direction and magnitude of net return spillover contribution(s) by various asset classe(s) in their portfolios. As a matter of fact, the COVID-19 crisis has adversely affected the stability of financial markets (Baker et al. 2020) and might be employed to anticipate the unpredictability of crude oil and gold (Baker et al. 2020). As far as the Russia-Ukraine War is concerned, such geopolitical conflict has strongly affected the worldwide economy (Liadze et al. 2023) through food shortages, global supply Chain disturbances and energy supply contraction (Astrov et al. 2022). As well, it amplified the volatility risk of commodity markets, tightened in international financial markets, soared risk aversion and uncertainty (Fang and Shao 2022) and led to currency depreciation in many emerging economies (Umar et al. 2022). From behavioral standpoint, Szczygielski et al. (2021) indicate that the VIX is considered as a proxy for stock market uncertainty which is related to economic, financial, and geopolitical events. Adekoya and Oliyide (2022) reveal that stock market fear due the intensity of the COVID-19 pandemic and global market uncertainty (VIX) are responsible for the fear in all other markets during the health crisis.
In this context, Deng et al. (2022) report that the outbreak of the COVID-19 pandemic influences the interconnectedness of different markets (e.g., energy market and green stock market) and gold can be considered as the most advantageous portfolio asset. Fang and Shao (2022) show that the deepening of the Russia-Ukraine War substantially heightens the volatility of metal, agricultural and energy markets. They also reveal that the volatility of commodity markets becomes more pronounced during periods when Russia’s foreign exchange reserves are high. Lo et al. (2022) display that financial market react significantly to the Russia-Ukraine War-induced shock. They suggest that markets perceive the dependence on Russian commodities as a crucial risk factor, sinking stock and amplifying the market instability. Adekoya and Oliyide (2022) reveal that financial and commodity markets attract investors, but are very sensitive to external crises (e.g., health crisis). Yadav et al. (2023) investigate the effect of Silicon Valley Bank bankruptcy on stock markets over the period 6 September 2022–22 March 2023. They report that such event significantly affects the global equity markets.
In light of the preceding discussion, it is of keen interest to delve into the dynamic linkages between stock prices and other commodities, particularly in the context of the COVID-19 pandemic and the Russia-Ukraine War, while simultaneously acknowledging the pervasive market uncertainties. Our study aims to fill this knowledge gap by examining the dynamic interconnectedness among various commodities (crude oil, gold, wheat, and natural gas), CO2 emissions, Bitcoin, the VIX volatility index, and stock prices across three distinct regions (G7, Gulf, and BRICS). This comprehensive analysis will provide valuable insights for investors and policymakers as they navigate the complex dynamics of these interconnected markets.
We also investigate the effect of the COVID-19 pandemic and the Russia-Ukraine War on such dependence structure. That is why the whole daily dataset spans from 2 January 2019 to 6 June 2022. From a methodological standpoint, the Wavelet-based time-frequency analysis is used given that it is a potent and robust tool for modeling time series (Bodart and Candelon 2009; Ciner et al. 2018). It can offer a frequency-time representation and highlights the frequency contributions of any time series at any point in time (Kang and Lee 2019). It can help to figure out if the rise in cross-asset linkages can be attributed to short-term (high frequency) or long-term (short frequency) components.
Surpassing econometric methods such as DCC models, the wavelet method stands out as a powerful tool for empirical analysis. Its key feature lies in the simultaneous time-frequency decomposition (Rua and Nunes 2009). It offers the flexibility to rethink investment horizons and provide valuable insights for portfolio management and investor behavior. By using this specific method, one can detect lead/lag relationships and phase differences/causality between time series (Cai et al. 2021).
The wavelet method finds application in diverse fields such as economics, finance, and physics (Ramsey and Zhang 1997). In finance, the localization characteristic of the wavelet transformation allows for understanding the frequency contributions of any time series at any point in time, providing insightful information about frequencies associated with specific market shocks (Bredin et al. 2015). This method increasingly aids in analyzing and comprehending various phenomena like volatility spillover, interdependence, and contagion.
Many researchers have leveraged the wavelet method to study diverse phenomena. For instance, Huang and Huang (2020) studied the co-movement between distinct assets using wavelet coherence and phase methods. Their findings indicate that the linkages among different assets vary significantly across different time scales. Nguyen et al. (2021) employed the wavelet method to analyze connections between green bonds and other asset markets, demonstrating that most correlations are well-documented and peak after the GFC (2007–2009). Bejaoui et al. (2023) used the wavelet technique to analyze dynamic connectedness among BRICS, Gulf stock markets, gold, NFTs, and DeFi during the Russia-Ukraine war and health crisis. They report non-trivial dynamic connectedness among various assets and the stock markets. Bossman et al. (2023), applying the bi-wavelet-based time-frequency econometric framework, revealed dynamic levels of coherence among ICEA and Islamic sectoral stocks. This implies that pricing and return-generating dynamics through different economic sectors in Islamic markets are influenced by media coverage on environmental attention compared to the trade and mining of digital assets. Magazzino and Giolli (2024) investigated the evolution of renewable energy production and oil prices in Italy during the first wave of the health crisis using wavelet analysis. They showed that renewable energy sources and oil prices were highly correlated during the health crisis.
Our selection of assets (equity markets, commodities, and VIX indices) aligns with relevant literature that under-explores the significance of these assets for investment and portfolio diversification benefits. In this regard, existing literature suggests that commodities are relevant to investors and financial researchers due to their market size, their role in asset allocation decisions, and their potential for portfolio diversification (Batten and Vo 2015; Khalfaoui et al. 2015). Additionally, the recent financialization of commodity markets (Sadorsky 2014) offers risk reduction in portfolios alongside stocks and bonds (Batten and Vo 2015). We include stocks from three distinct regions: G7, BRICS, and Gulf. On the other hand, several studies in the literature have extensively explored the linkages between Bitcoin and various financial assets (Corbet et al. 2020). Past studies have incorporated stock prices and Bitcoin (Shahzad et al. 2020), Bitcoin and exchange rate (Dwyer 2015; Li and Wang 2017; Urquhart and Zhang 2019), and other commodity prices and Bitcoin (Bouri et al. 2018; Rehman and Apergis 2019). Nevertheless, our future study will explore the relationship between commodities and gold-backed cryptocurrencies.
Our paper makes significant contributions to the existing literature in several key areas. First, we broaden the scope beyond traditional studies of gold, crude oil, and stock markets by analyzing the interconnectedness of a wider range of commodities and stock markets. This comprehensive approach reveals new dynamics and insights into the complex relationships between these asset classes. Second, we investigate the previously unexplored connection between carbon emissions and stock markets. This novel analysis offers valuable insights that can inform stock valuation models, derivative pricing strategies (Dutta et al. 2018), and portfolio design (El Hedi Arouri et al. 2015), thereby contributing to the field of environmental finance. Third, we conduct a regional analysis examining commodity-equity linkages across the G7, Gulf, and BRICS regions. This allows us to understand the similarities and differences in information transmission within and between these regions, providing valuable insights for investors and researchers. Finally, we explore how market connectedness reacts to major events like the COVID-19 pandemic and the Russia-Ukraine War. This analysis helps us understand the resilience and adaptability of financial markets in the face of external shocks.
The remainder of the paper is given as follows. In Section 2 and Section 3, we present the methodology to be used and data. Empirical results are reported in Section 4. Section 5 presents the lessons learned from our model and Section 6 gives some concluding remarks.

2. Methods

Inspired by Crowley (2007), we employ a suite of flexible and robust tools, originally developed for geophysical signal analysis, to investigate the dynamic connectedness between stock markets and other asset classes. These tools, namely the Continuous Wavelet Transform (CWT), Cross Wavelet Transform (XWT), and Wavelet Coherence (WTC), provide a powerful means of analyzing the interplay of asset prices across both frequency and time domains. XWT and WTC graphs delineate regions in the time-frequency plane where asset prices exhibit (a)synchronous fluctuations and different phase relationships. Consequently, this analysis effectively identifies the linkages between time series and sheds light on the dynamic transmission of information across financial markets.
More precisely, the functions related to the wavelet methods are given as follows. The W x ( μ , s ) for CWT is expressed as follows:
W x ( μ , s ) + x ( t ) ψ ( t μ s ) s
where, ψ ( · ) is a complex conjugate of ψ ( · ) . The XWT is generalized by CWT to analyze the linkage between two time series. The XWT can be expressed as follows:
W x y ( μ , s ) = W x ( μ , s ) · W y ( μ , s )
with:
  • W x y ( μ , s ) computes the relationship between two time series;
  • W is the wavelet transform;
  • μ and s correspond to time and scale, respectively;
  • ∗ refers to a complex conjugate.
The XWT could be roughly assimilated to covariance. Such method interestingly identifies areas at each scale and time when a time series comovement is well-documented. Similar to the covariance measure, the cross-wavelet transform cannot show the relative strength of the association. The empirical results of XWT appear to be limited because they do not have any bound. Based on this crux, the wavelet coherence method is preferred given that it takes into consideration a smoothing operator S (Rua and Nunes 2009). More formally, it can be computed as follows:
R x y 2 ( μ , s ) = | S ( 1 s W x y ( μ , s ) ) | 2 S ( 1 s | W x ( μ , s ) | 2 ) S ( 1 s | W y ( μ , s ) | 2 )
where R x y 2 ( μ , s ) corresponds to the squared correlation between time series across frequency and time. It ranges from 0 (no correlation) to 1 (high correlation). For additional insight on the application of XWT and WTC to signal analysis, we refer to Grinsted et al. (2004).

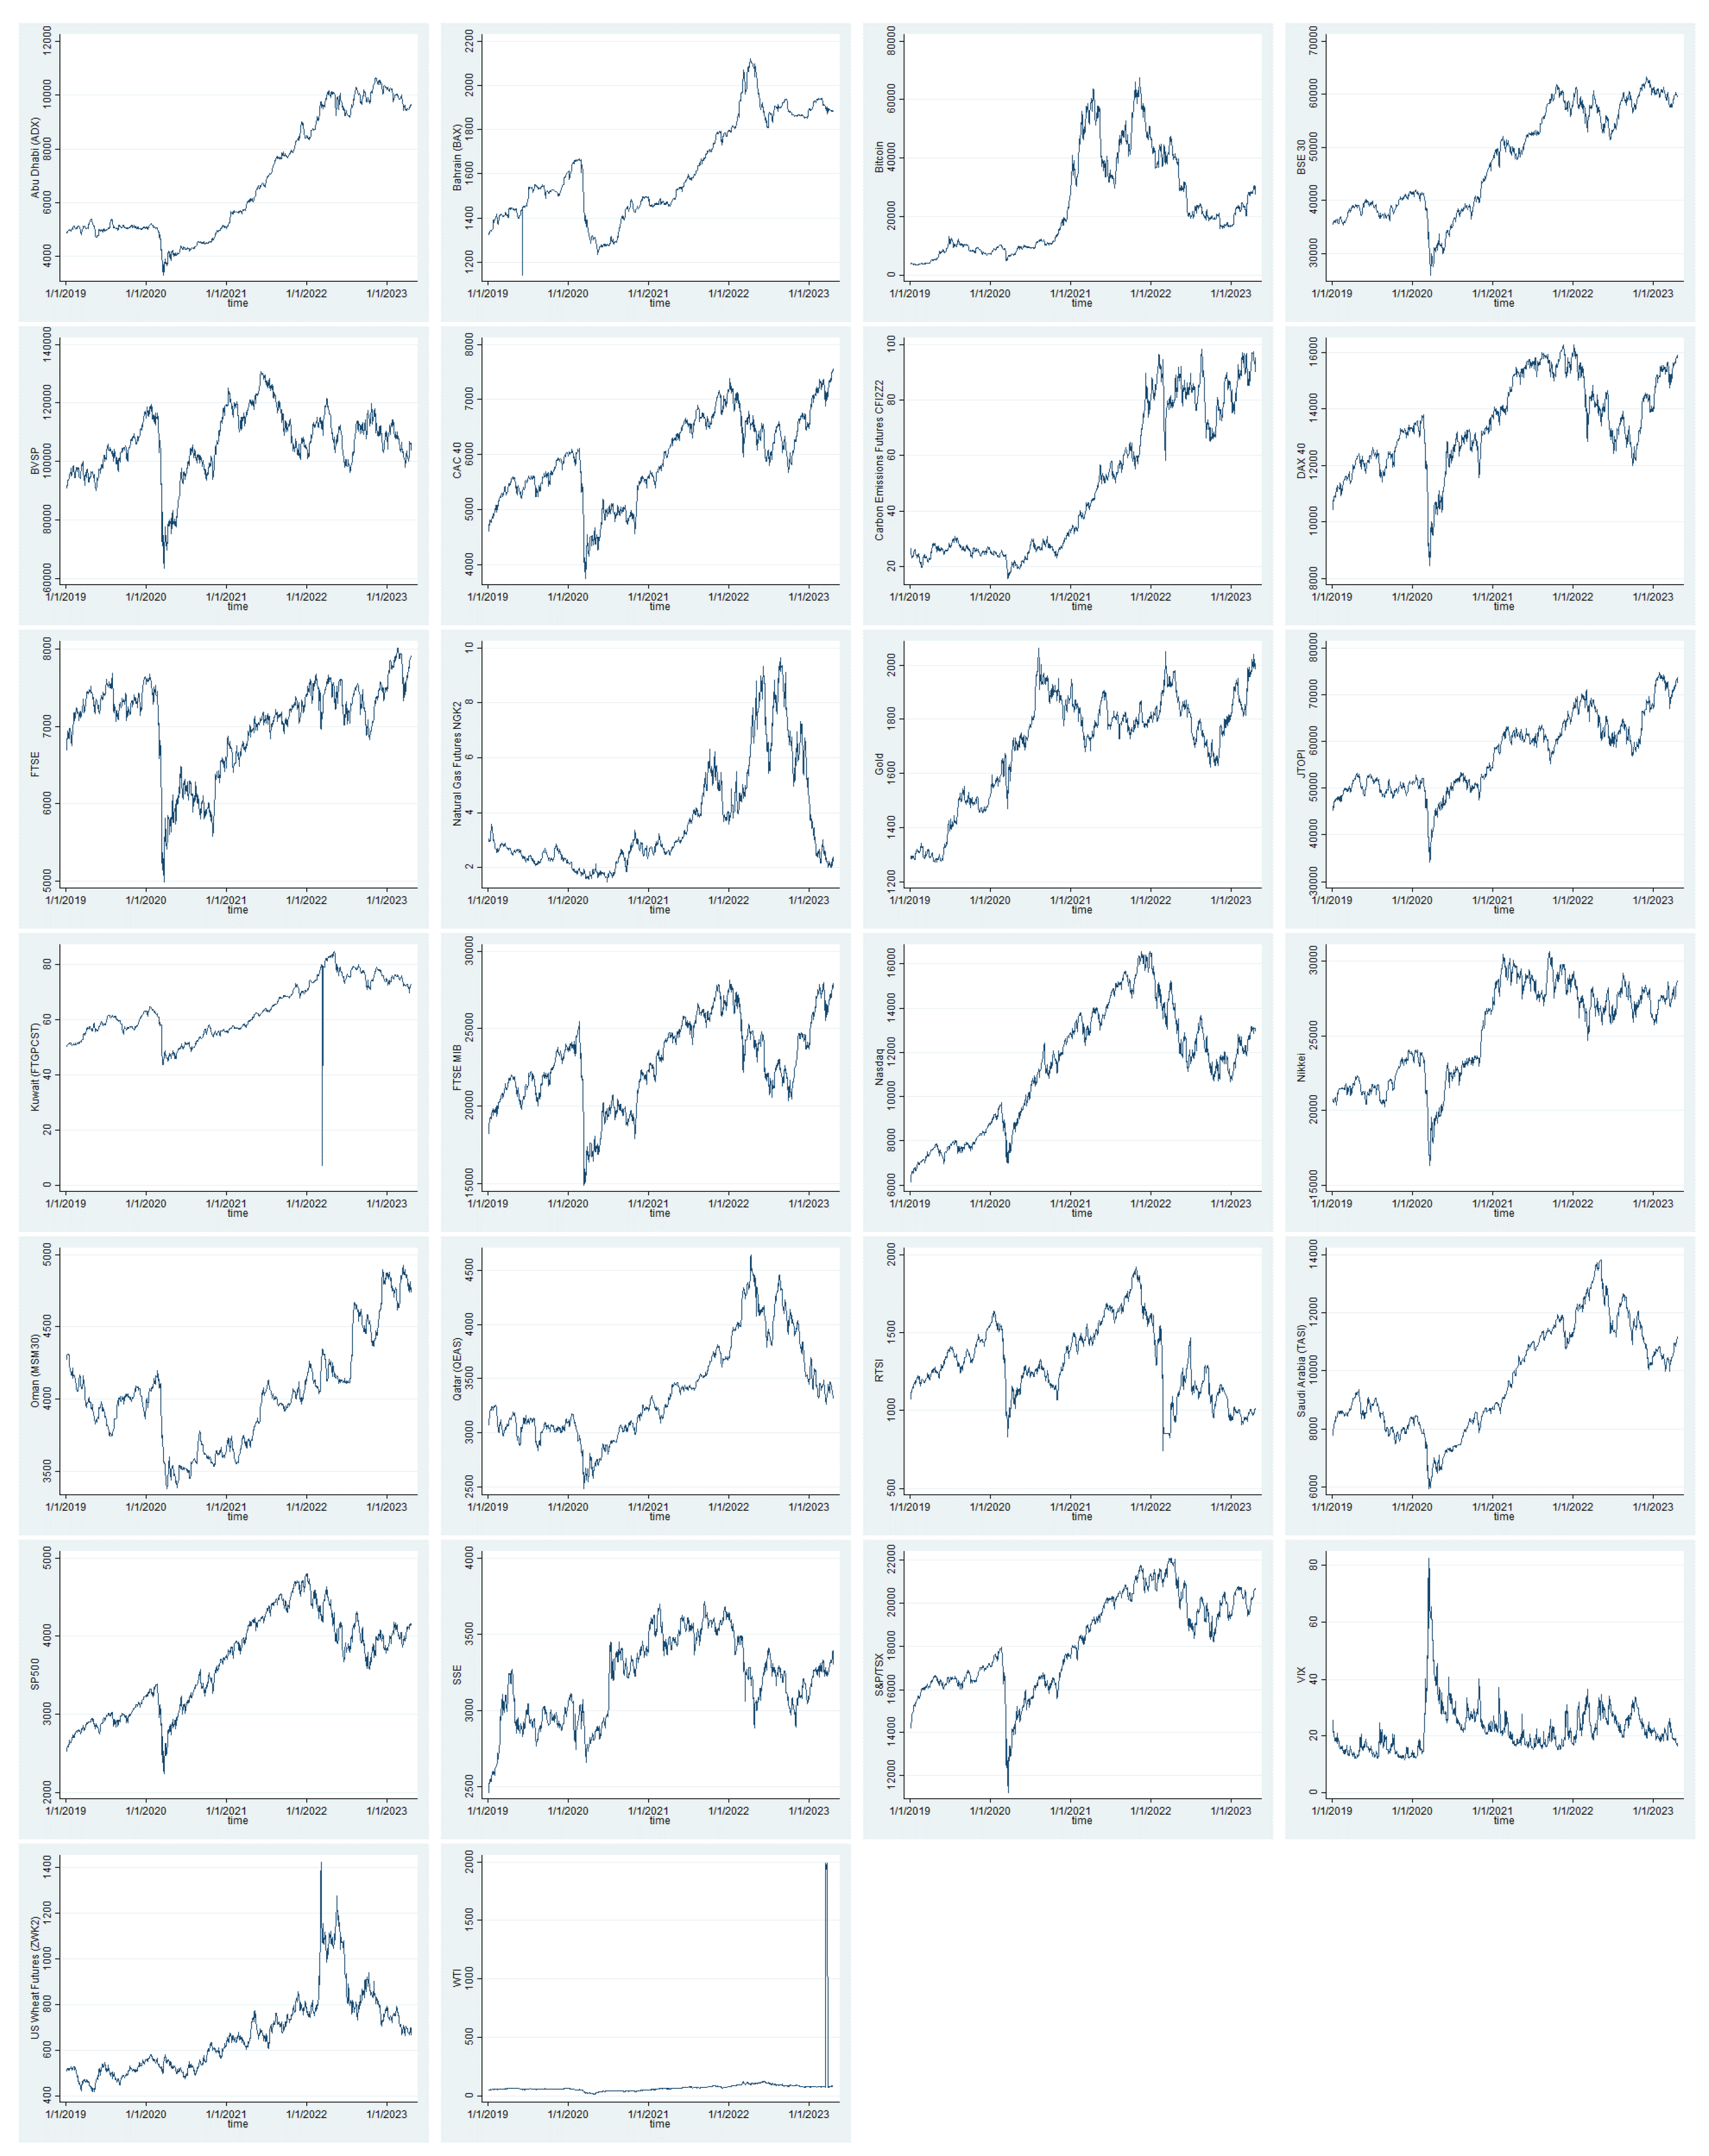
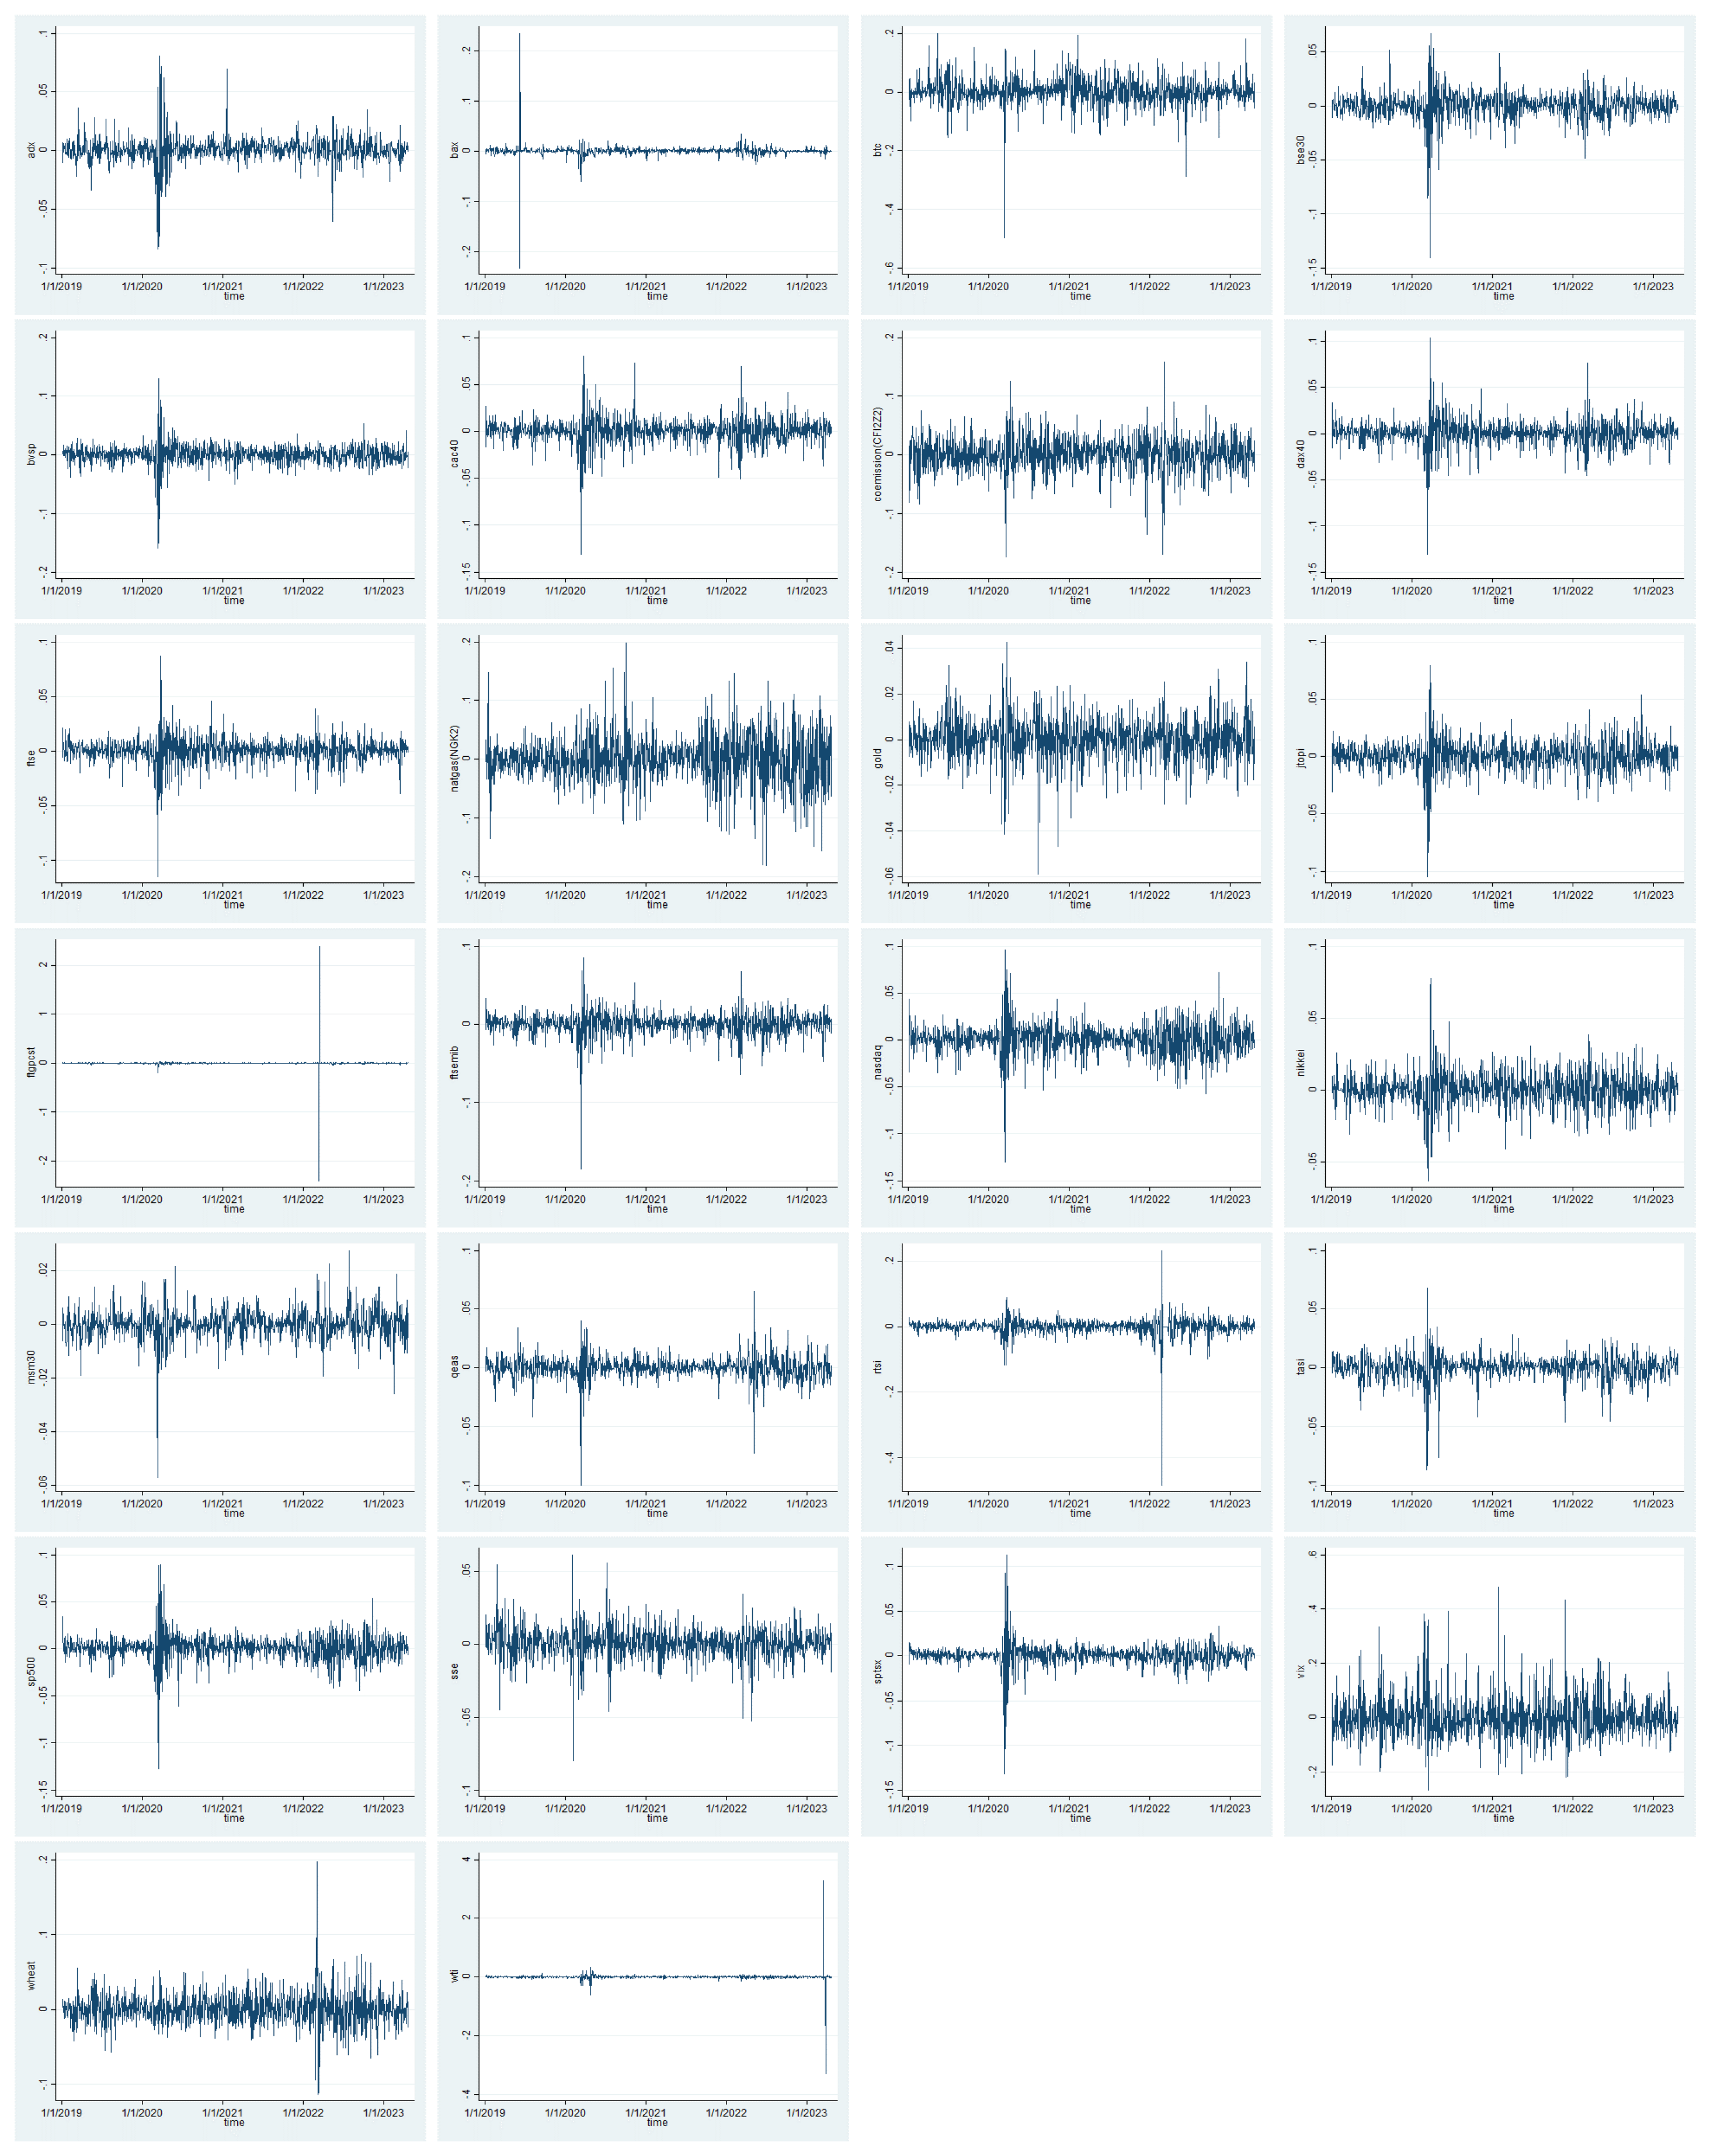
3. Data and Descriptive Statistics

This paper investigates the dynamic relationship between different assets. In this regard, we gather the adjusted closing values of stock market indices from three different regions: G7 stock markets including S&P500, NASDAQ (United States), CAC40 (France), FTSE100 (United Kingdom), Nikkei225 (Japan), DAX40 (Germany), FTSEMIB (Italy), and SP-TSX (Canada); BRICS stock markets including SSE (China), RTSI (Russia), BSE30 (India), Bovespa (Brazil) and South Africa (JSE40) and Gulf stock markets including BAX (Bahrain), FTGP (Kuwait), TASI (Saudi Arabia), MSM30 (Jordan), QEAS (Qatar) and ADI (United Arab Emirates). The time period is from 2 January 2019 to 21 April 2023. The chosen sample period has the advantage of capturing the impact of the COVID-19 pandemic, the Russia-Ukraine War and the 2023 bank crisis. We also collect the closing prices of Gold and the Wheat, West Texas Intermediate Crude Oil (WTI) futures prices. We thereafter use the daily prices of Carbon emissions futures during the period 2 January 2019–21 April 2023. As well, we use the level of VIX index provided by the Chicago Board Options Exchange. The VIX index is generally defined as the risk neutral expected stock market variance for the US S&P500 contract and is calculated based a panel of options prices. It is overwhelmingly considered as fear index for asset markets (Whaley 2000) and investors’ risk perceptions (Marfatia 2020) and reflects the stock market uncertainty (Bekaert and Hoerova 2014).
We further utilize the daily prices of Carbon emissions futures for the period spanning from 2 January 2019 to 21April 2023. This financial settlement contract is based on the global carbon futures published on the ICE Consolidated Feed. During the lockdown imposed due to the COVID-19 pandemic, industrial activity reached an all-time low, leading to a subsequent decrease in CO2 emissions. We then employ Bitcoin prices for the same period for our analysis.
Figure 1 illustrates time series plots of the raw data. Overall, such graphs seem to exhibit cyclical movements over the sample period. Some similar time series patterns among different asset classes are well-documented. Strikingly, they display a (large) trough around the date of 3 March 2020. During such time, VIX shows a large spike, indicating more market uncertainty.
Following this, continuously compounded daily returns were computed as the first difference of the logarithm of market indices. Table 1 summarizes the descriptive statistics for different market behaviors over the periods of pre- (2 January 2019 to 31 December 2019), during the COVID-19 pandemic (1 January 2020 to 23 February 2022), and the Russia-Ukraine War and 2023 bank crisis (24 February 2022 to 21 April 2023). These descriptive statistics include the mean, median, standard deviation, skewness, kurtosis, Jarque-Bera for normality test, and respective probabilities. The overwhelming descriptive statistics demonstrate certain salient preliminary facts based on the sub-period under consideration. During the pre-COVID-19 period, the average stock market returns for each country appeared to be positive, except for Jordan (−0.000321). The mean returns for Natural Gas and CO2 futures prices, as well as VIX, tended to be negative during this period. On average, the stock market return was negative for Brazil (−0.000042), Russia (−0.000454), and the United Kingdom (−0.0000106) during the COVID-19 pandemic period. However, during both the Russia-Ukraine War and the 2023 bank crisis, the average stock market returns were negative for most countries. The average return of Bitcoin turned negative during this period. The mean returns for Natural Gas futures prices, VIX, and gold were also negative. This can be attributed to the significant swings in different stock markets triggered by the outbreak of the health crisis and political events. The standard deviation in different stock markets across different regions demonstrated a tendency to be higher during the sub-periods of the COVID-19 pandemic and the 2022 Russia-Ukraine War compared to the calmer period. The daily returns of stock indices appeared to be negatively skewed during turbulent periods. Notably, the leptokurtic feature of the return distributions appeared pronounced for different sub-periods. The Jarque-Bera statistics were significant at the 1% level. Therefore, the daily returns were not normally distributed.
Afterward, the continuously compounded daily returns are computed as the first difference of the logarithm of market indices. Table 1 summarizes the descriptive statistics for different market behaviors over the periods of pre- (2 January 2019–31 December 2019), during the COVID-19 pandemic (2 January 2020–23 February 2022) and the Russia-Ukraine war and 2023 bank crisis (24 February 2022–21 April 2023). Such descriptive statistics include the mean, median, standard deviation, skewness, kurtosis, Jarque-Bera for normality test and respective probabilities. The descriptive statistics overwhelmingly show certain salient preliminary facts according to the sub-period under consideration. For the pre-COVID-19 period, the average stock market returns of each country seem to be positive, except for Jordan (−0.000321). The mean returns for the Natural Gas and CO2 futures prices as well as VIX tend to be negative during such period. On average, the stock market return is negative for Brazil ( 4.26 × 10 5 ), Russia (−0.000454) and United Kingdom ( 1.06 × 10 5 ) during the COVID-19 pandemic period. Nevertheless, during both the Russia-Ukraine war and 2023 bank crisis, the average stock market returns are negative for most countries. The average return of Bitcoin becomes during this period. The mean returns for the Natural Gas futures prices, VIX ad gold are also negative. This can be explained by the large swings in different stock markets with the outbreak of the health crisis and political event. The standard deviation in different stock markets for different regions tends to be higher during the sub-periods of COVID-19 pandemic and the 2022 Russia-Ukraine War, compared to the calm one. The daily returns of stock indices seem to be negatively skewed during turbulent periods. Most notably, the leptokurtic feature of the return distributions appears to be pronounced for different sub-periods. The Jarque-Bera statistics are significant at 1% level. Therefore, the daily returns are not normally distributed. These findings do not, however, influence the empirical findings of the wavelet coherence analysis (Fareed et al. 2020).
Figure 2 depicts the evolution of different asset returns from 1 February 2019, to 21 April 2023. While all plots exhibit clear cyclical variations, their overall trends appear divergent. Additionally, beyond the cyclical fluctuations, the time series appear to exhibit volatility clustering behavior. Next, we analyze the linear relationships between these variables using the variance-covariance matrix. As a reminder, diagonal elements represent the variances of individual variables, while off-diagonal elements represent the covariances between each pair of variables. Our initial observations suggest the presence of asymmetric patterns among variables. Notably, the sign and magnitude of these associations seem to vary across sub-periods. For instance, the covariance between gold and S&P 500 changes from 1.597 during the pre-pandemic period to 2.371 during the health crisis, before shifting to 2.195 with the onset of the Russia-Ukraine war and the 2023 bank crisis.

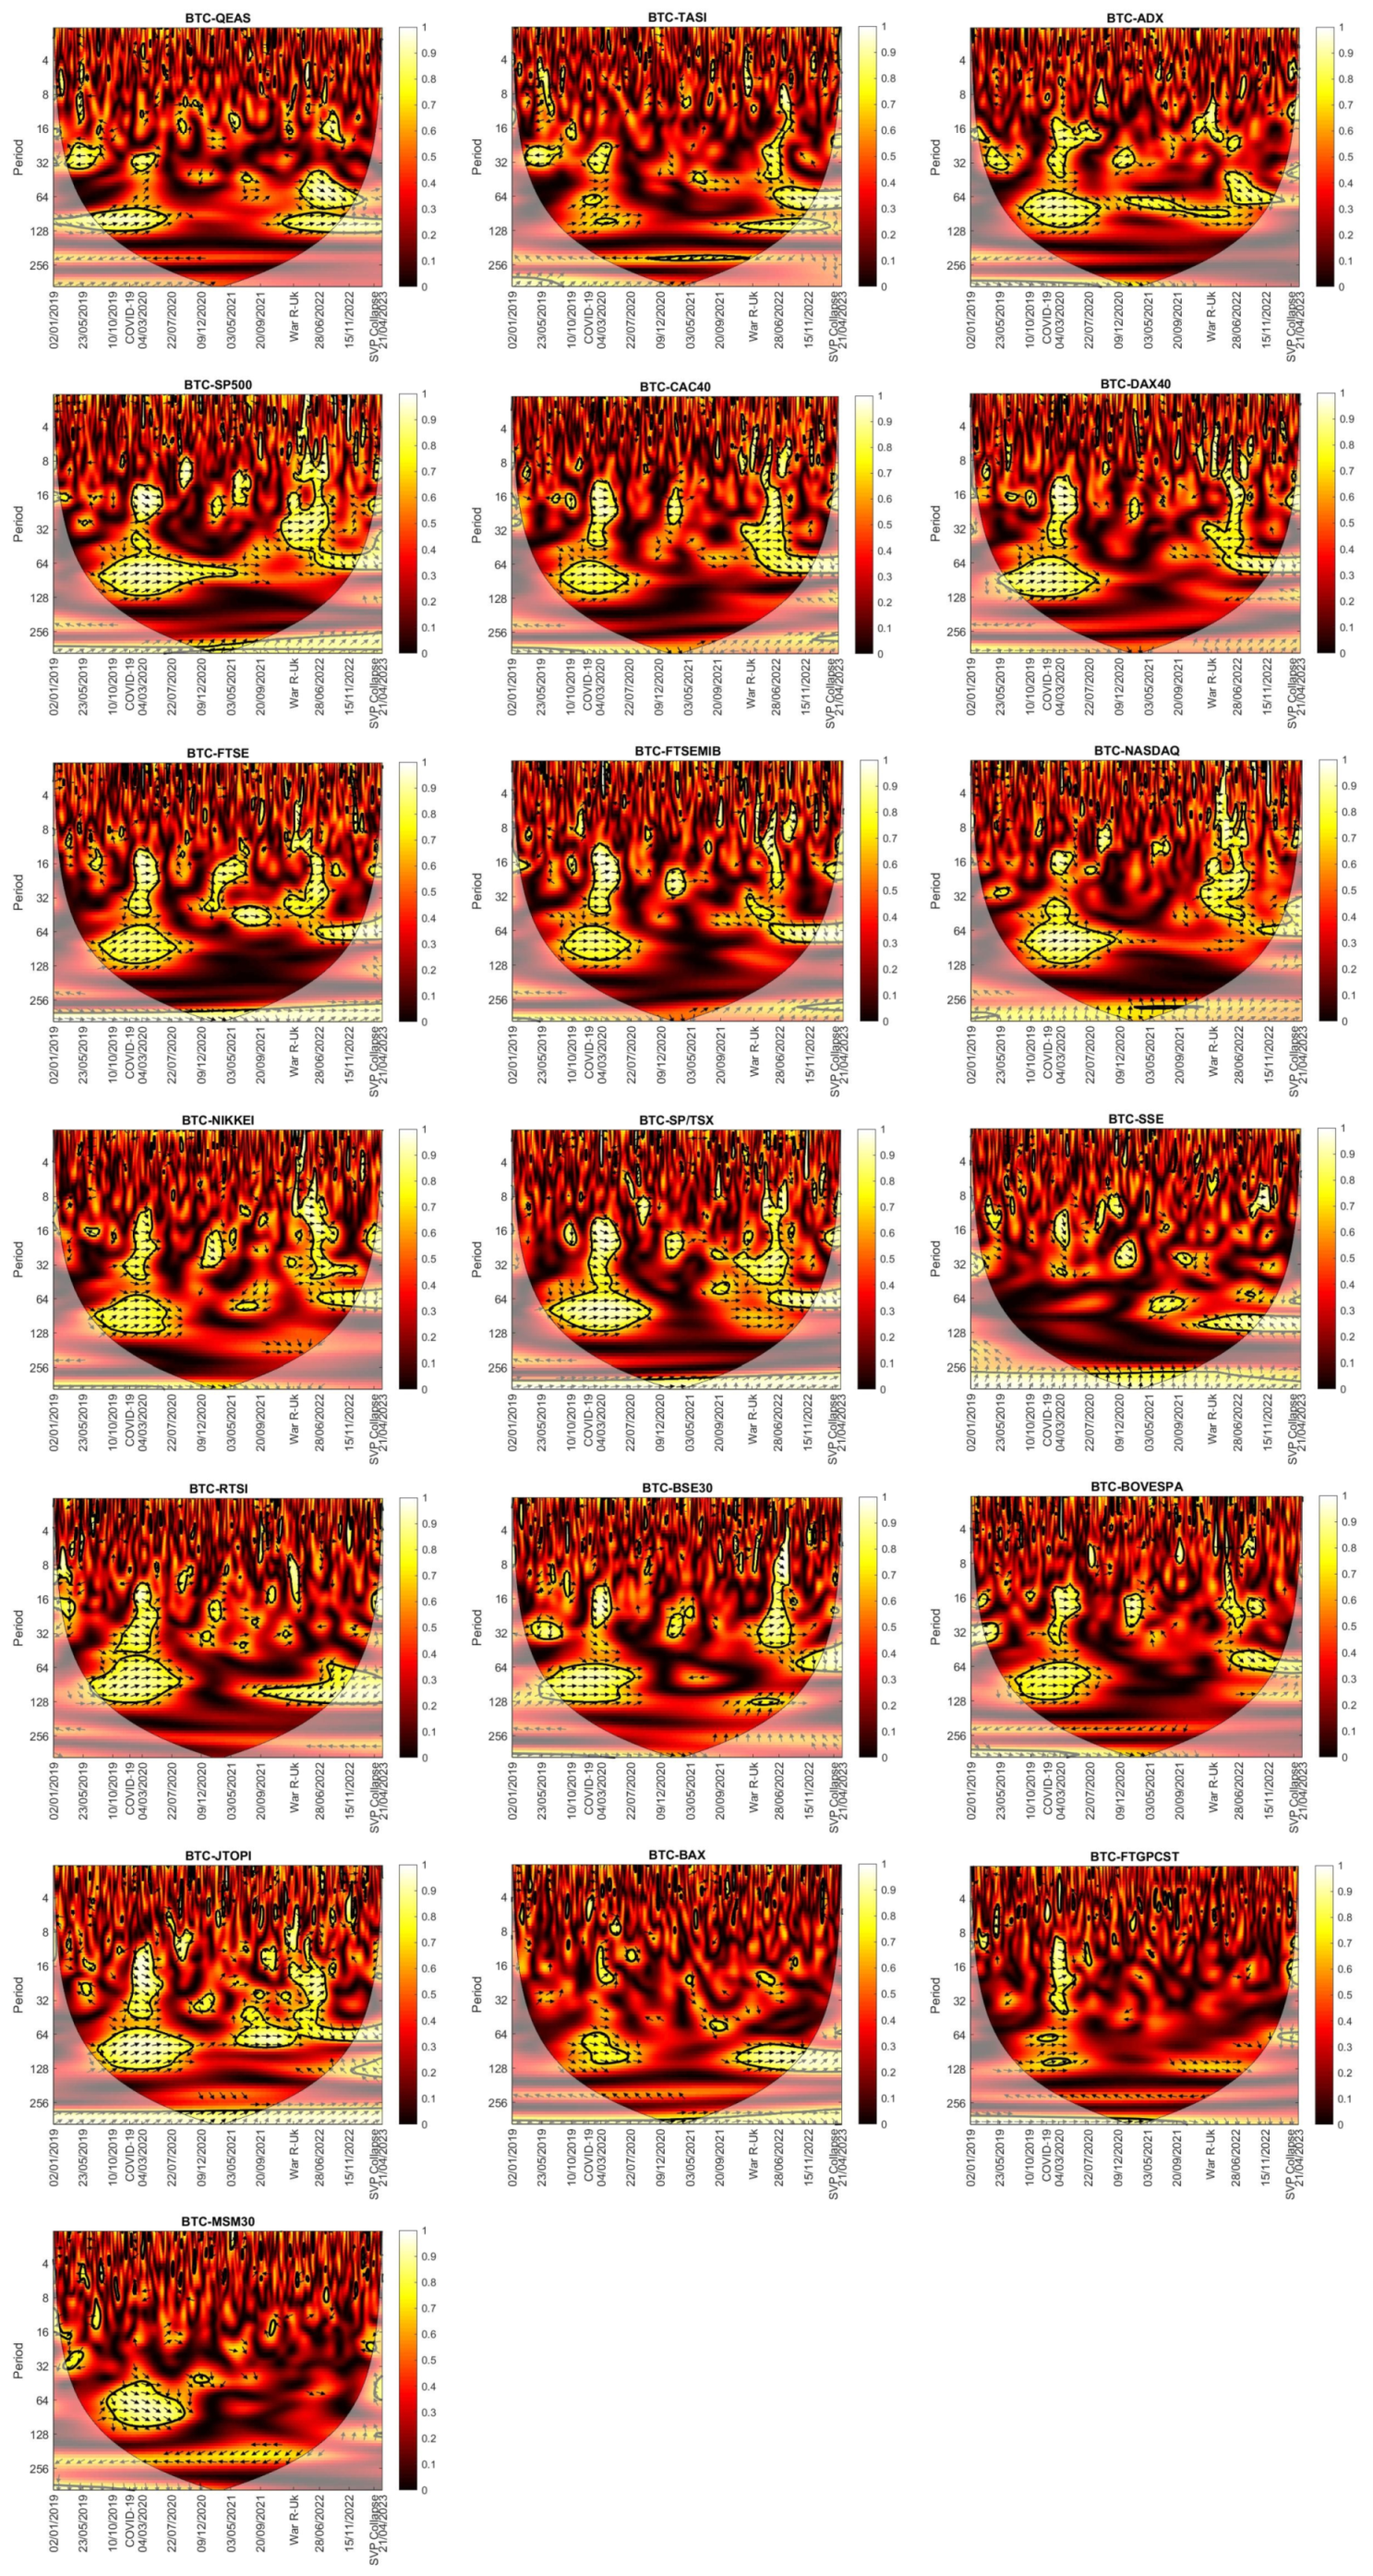
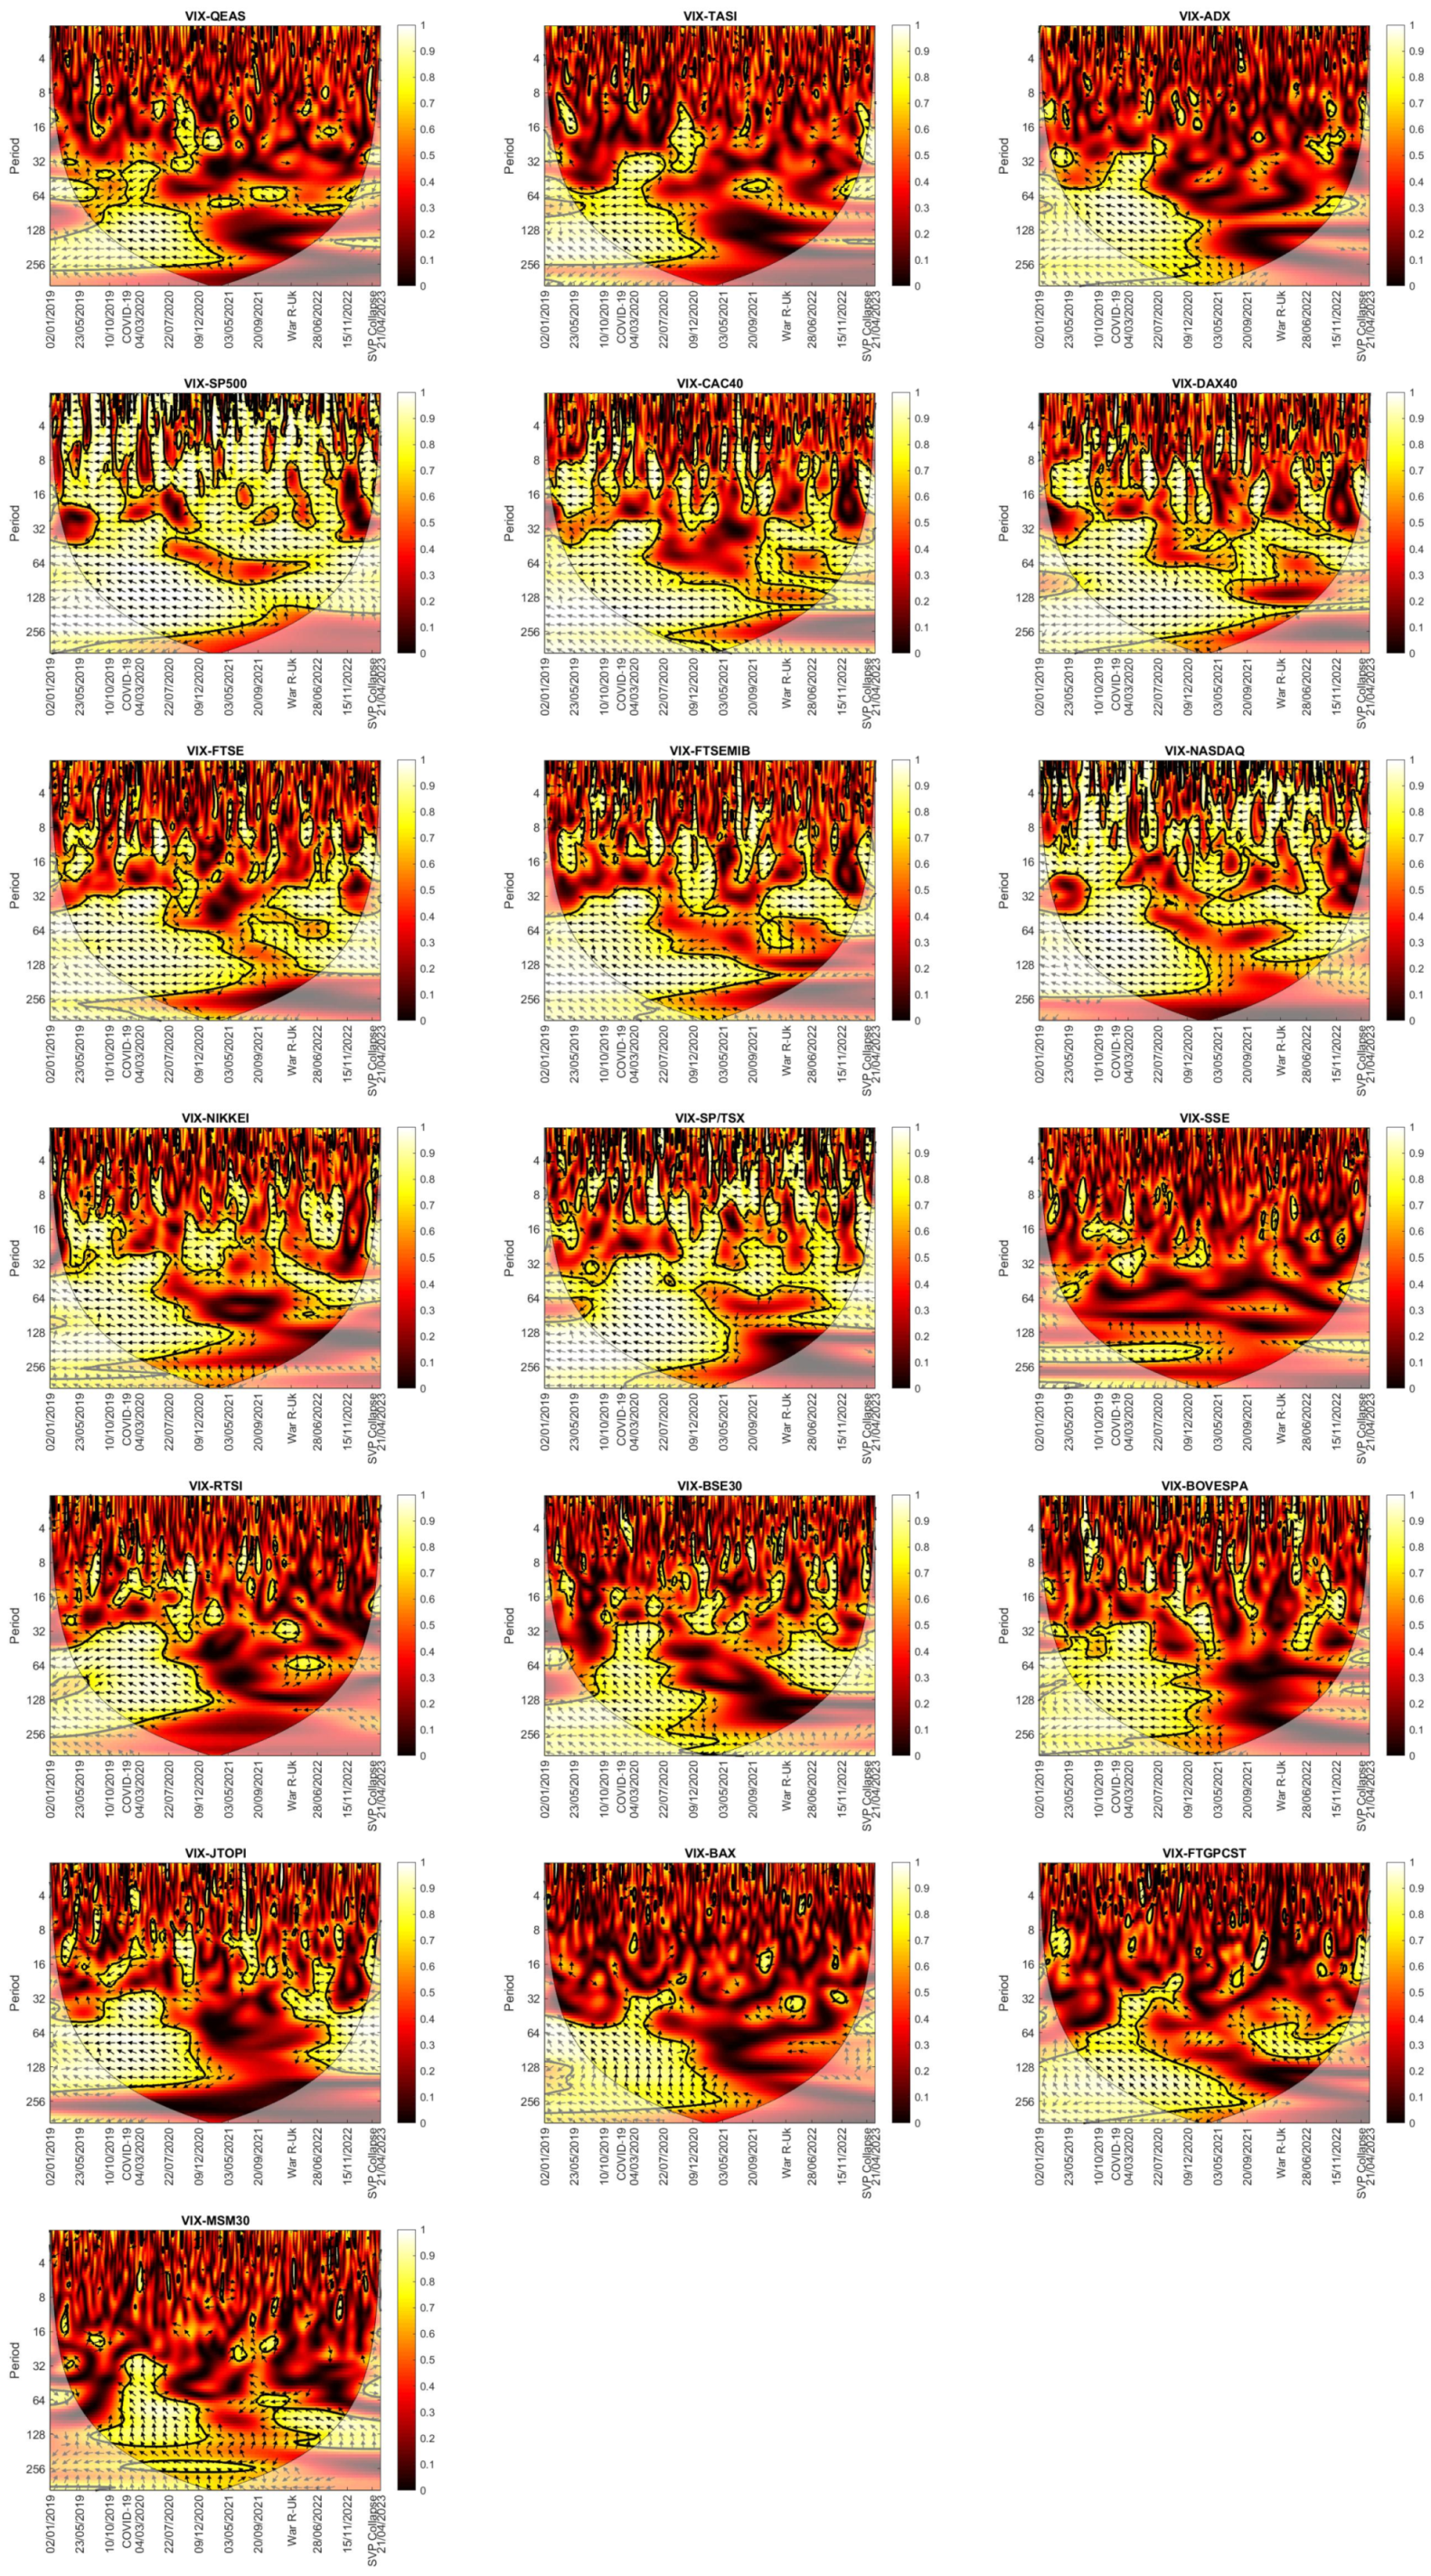
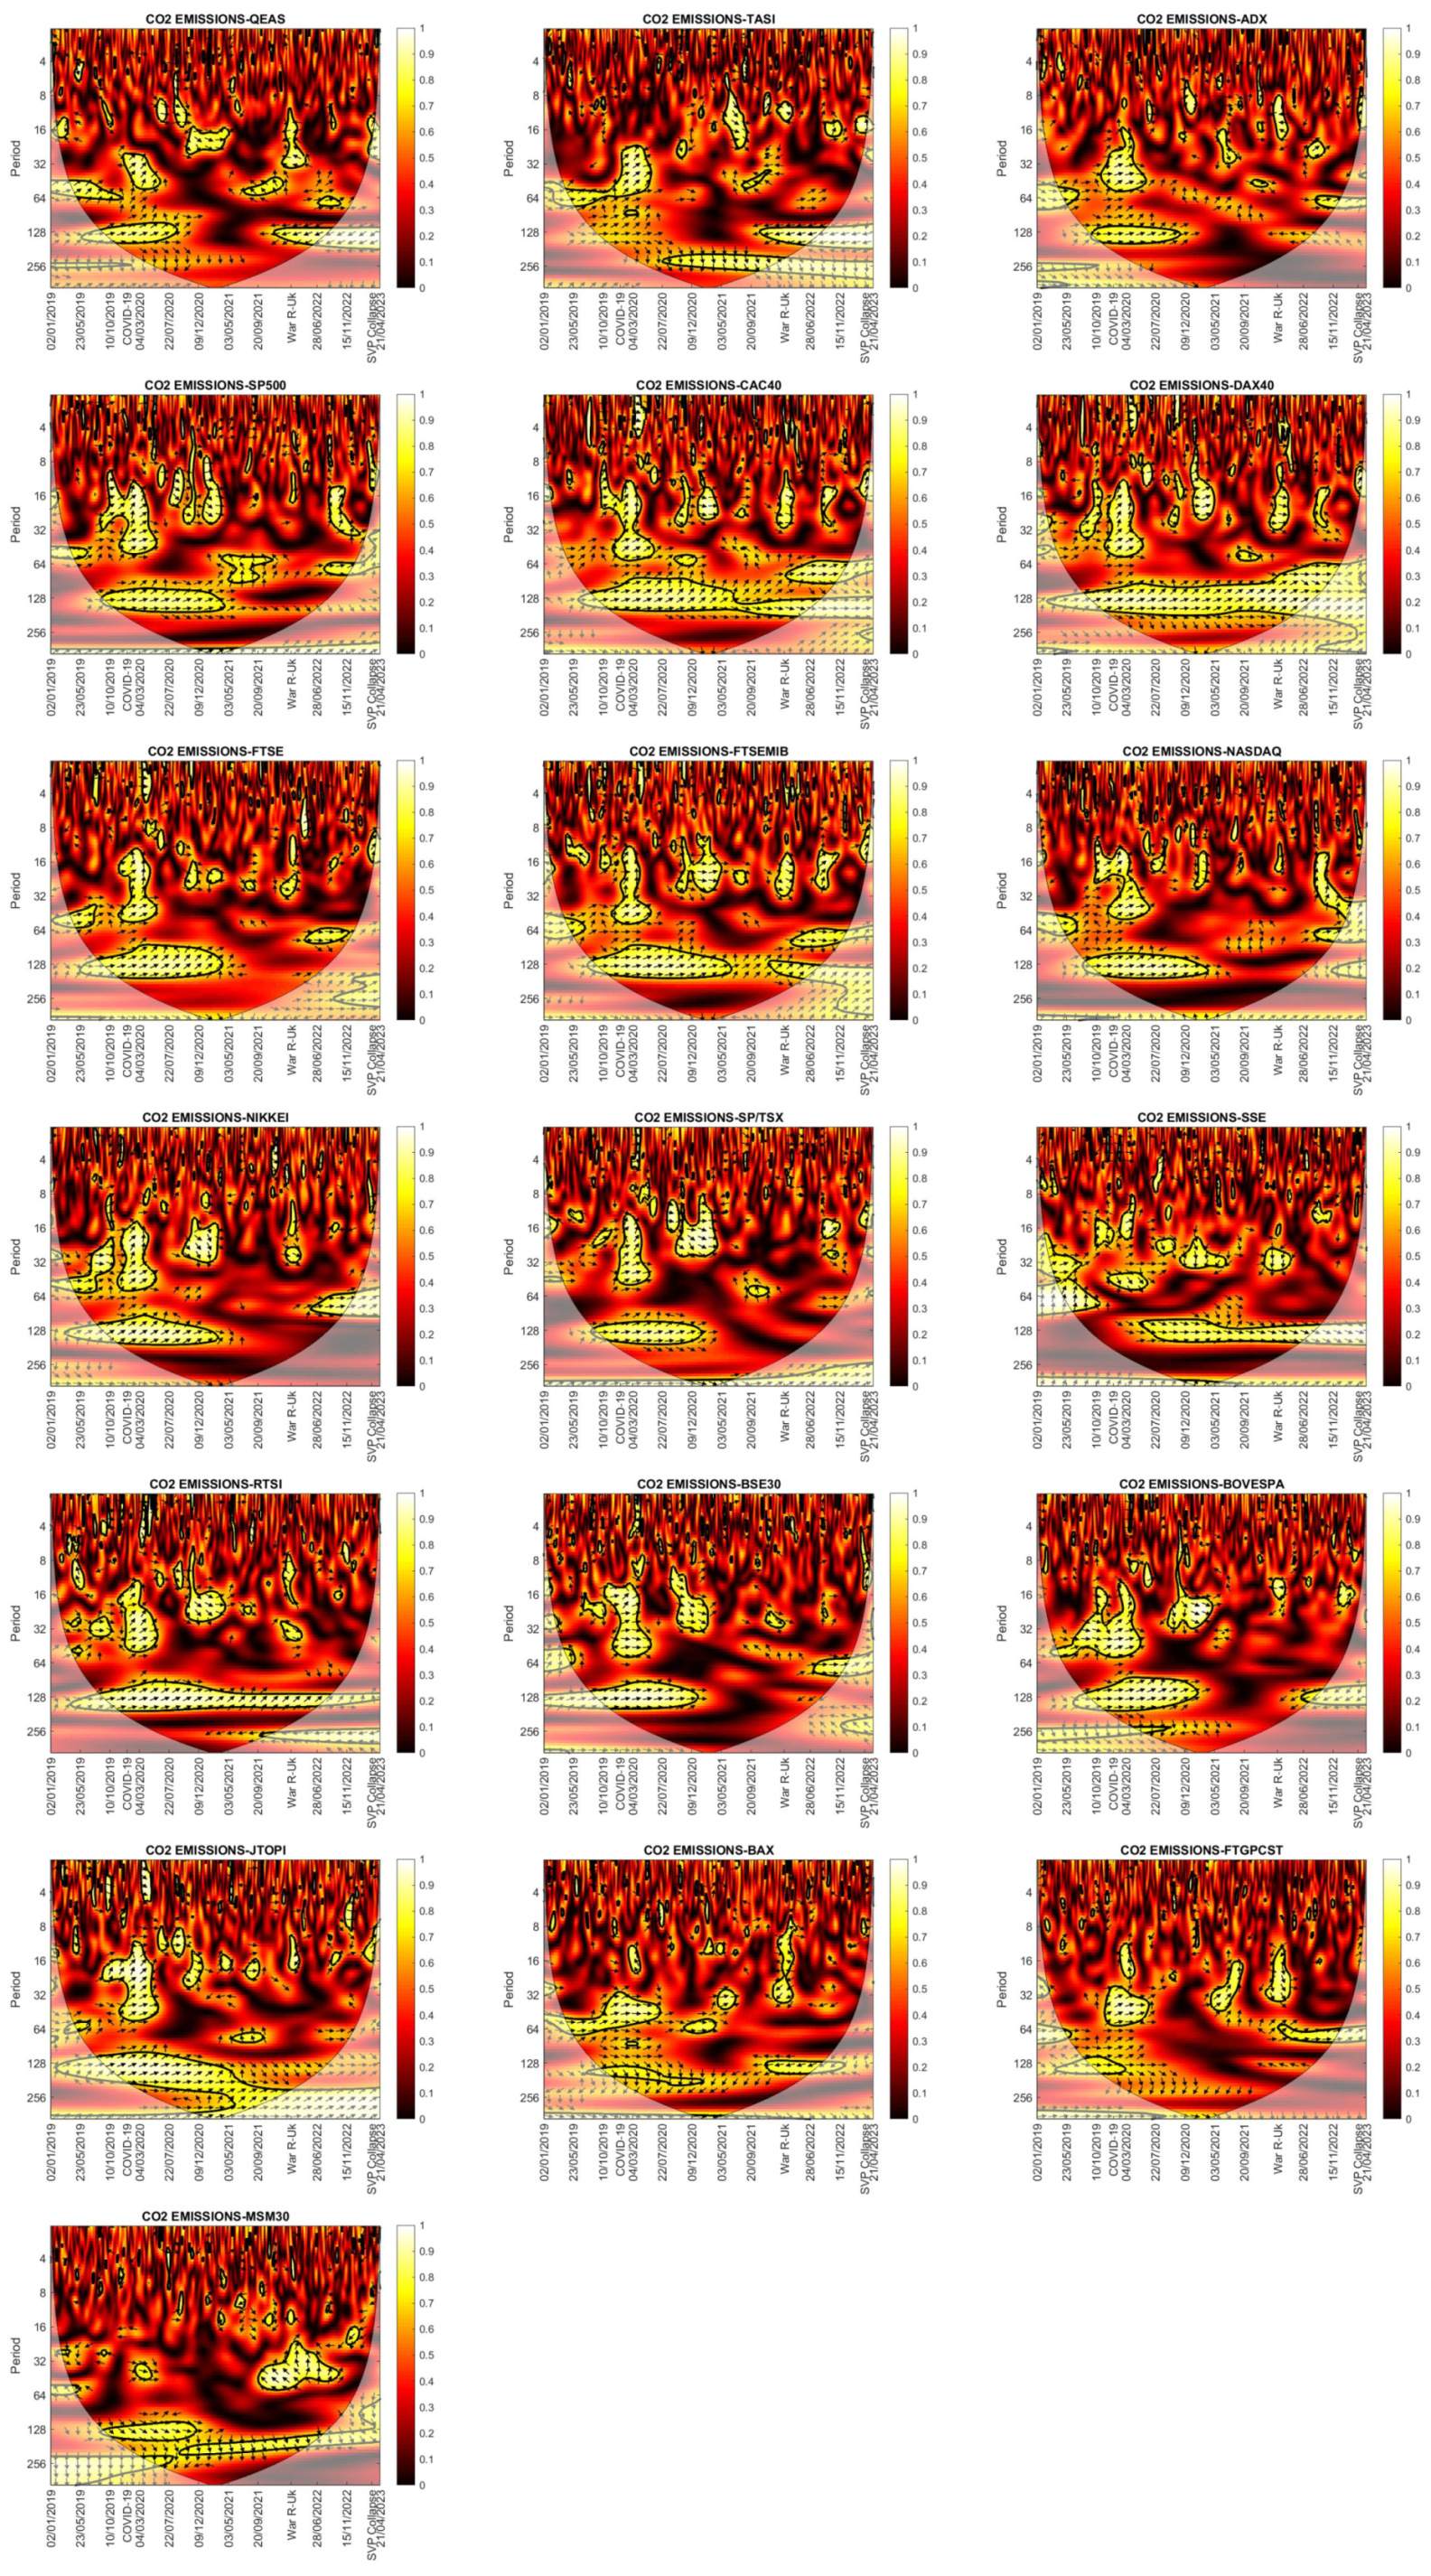
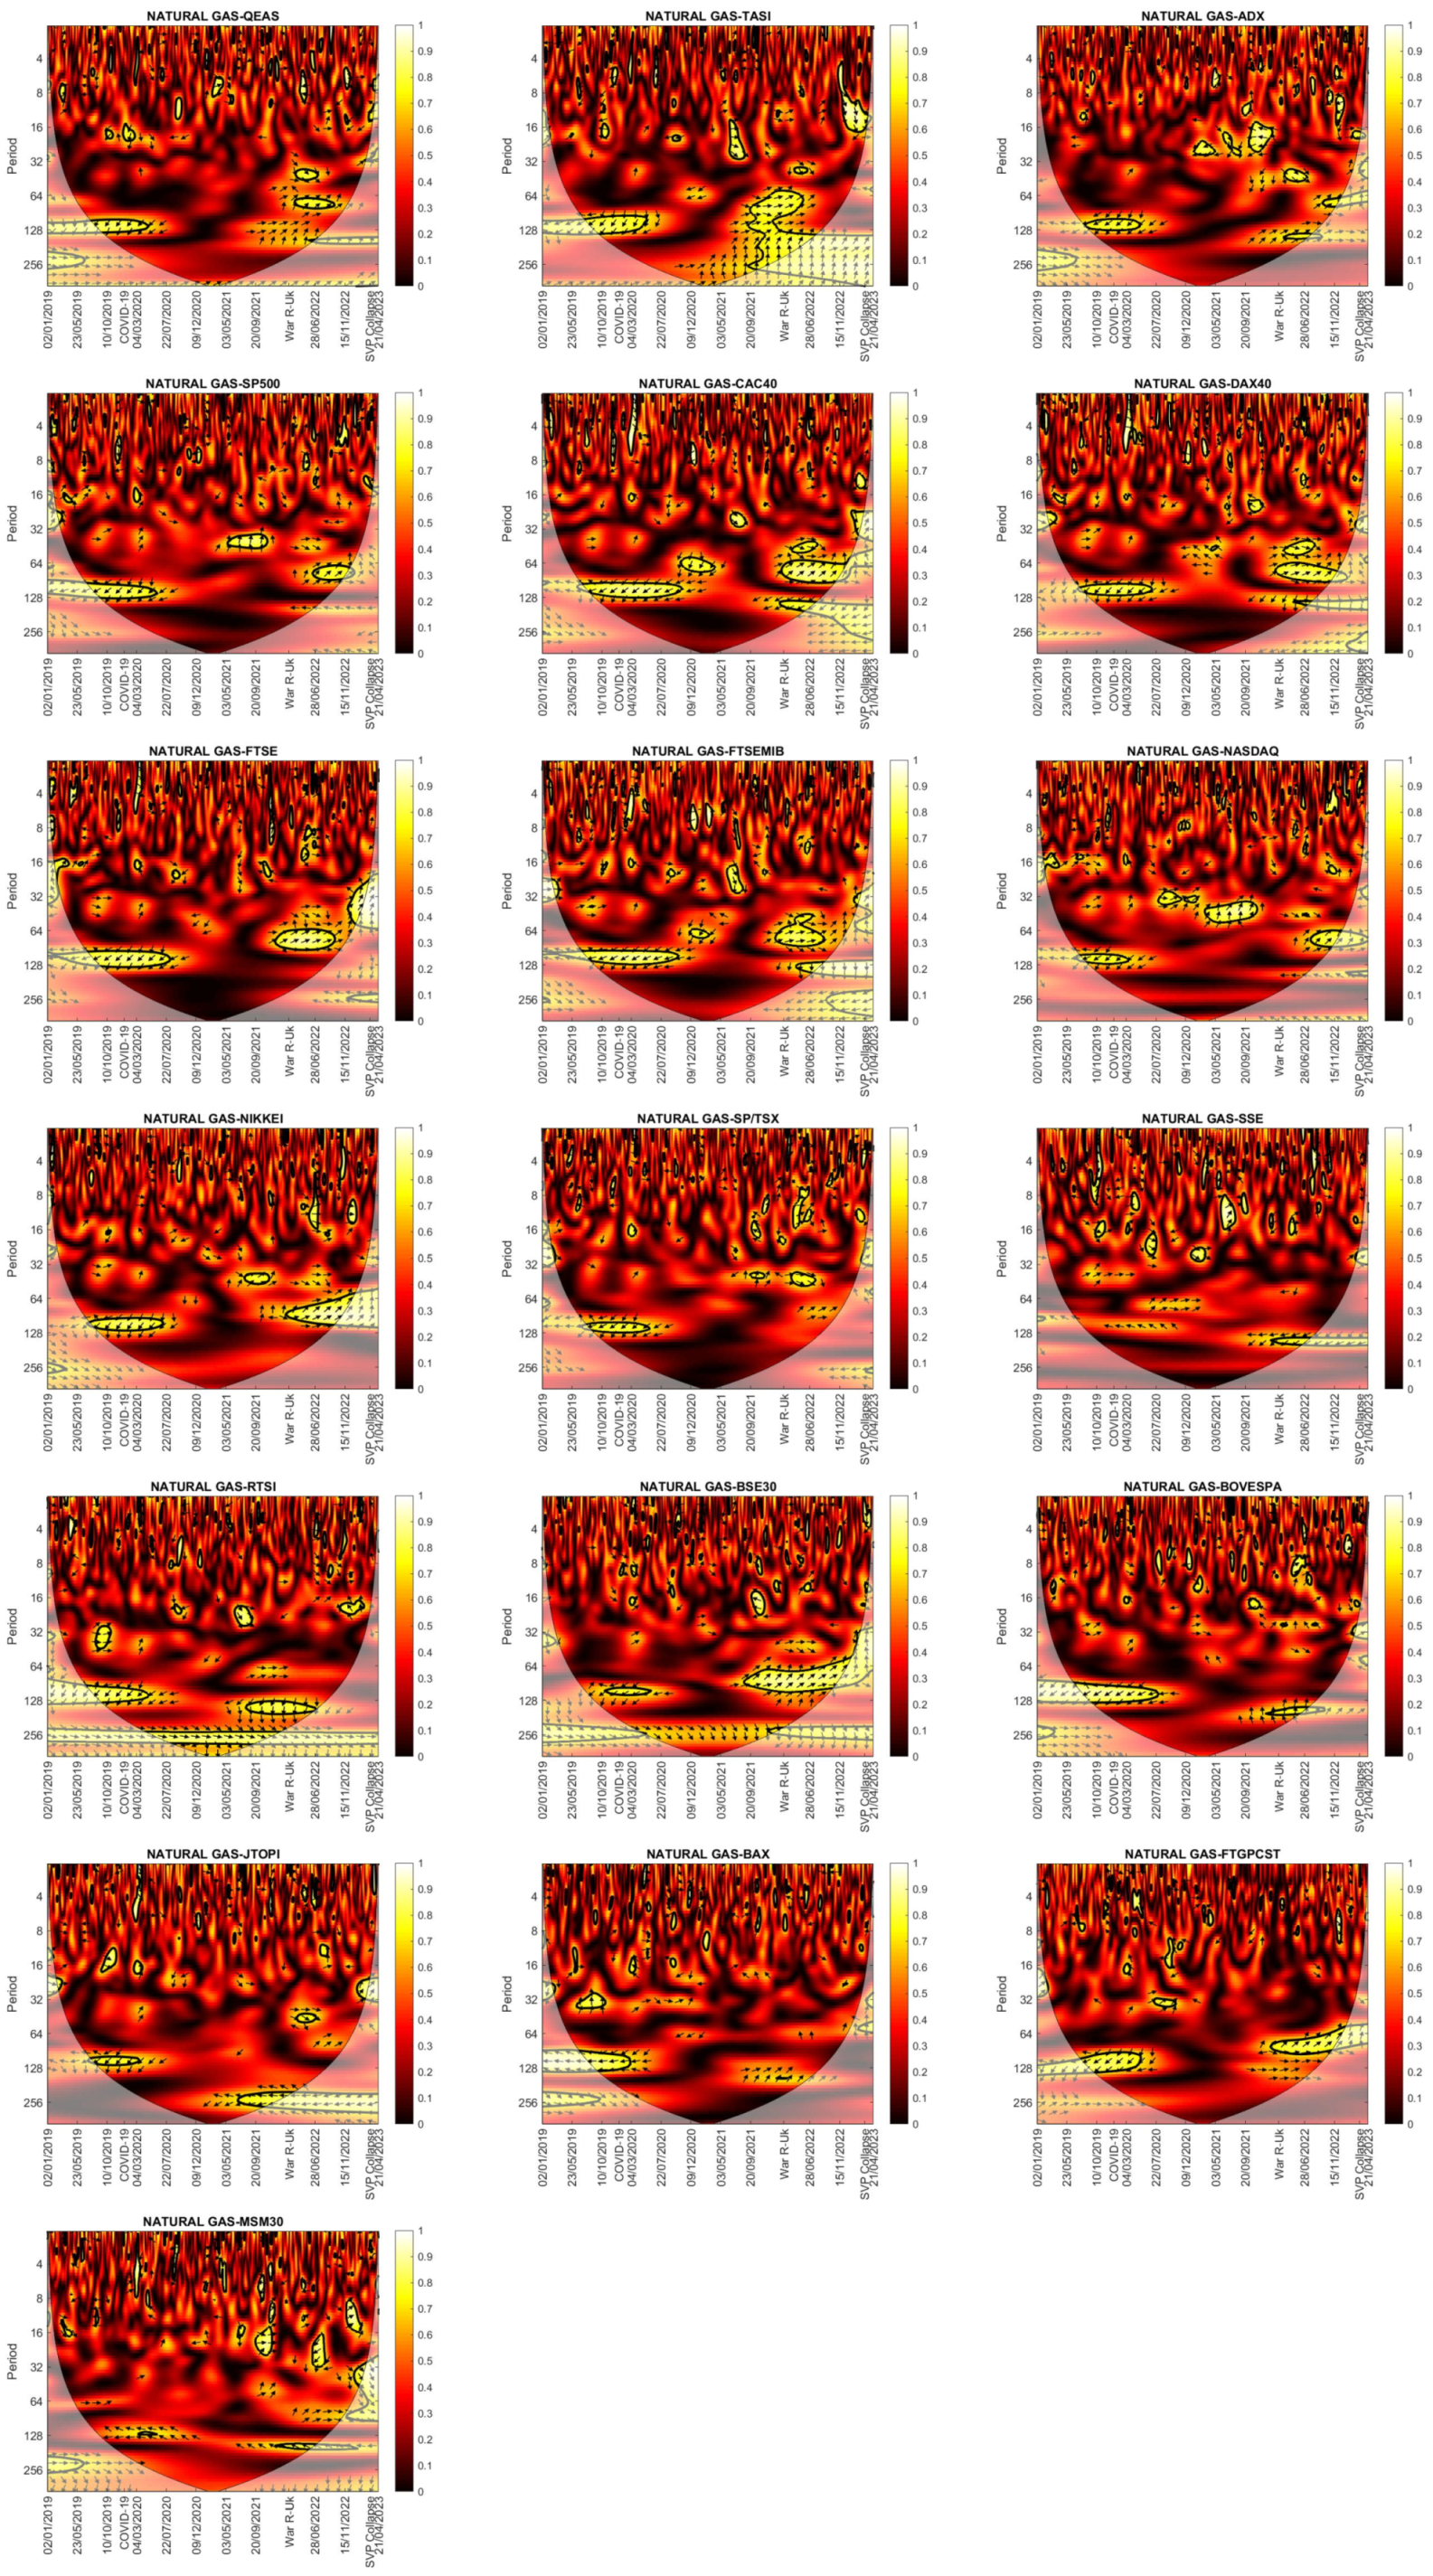
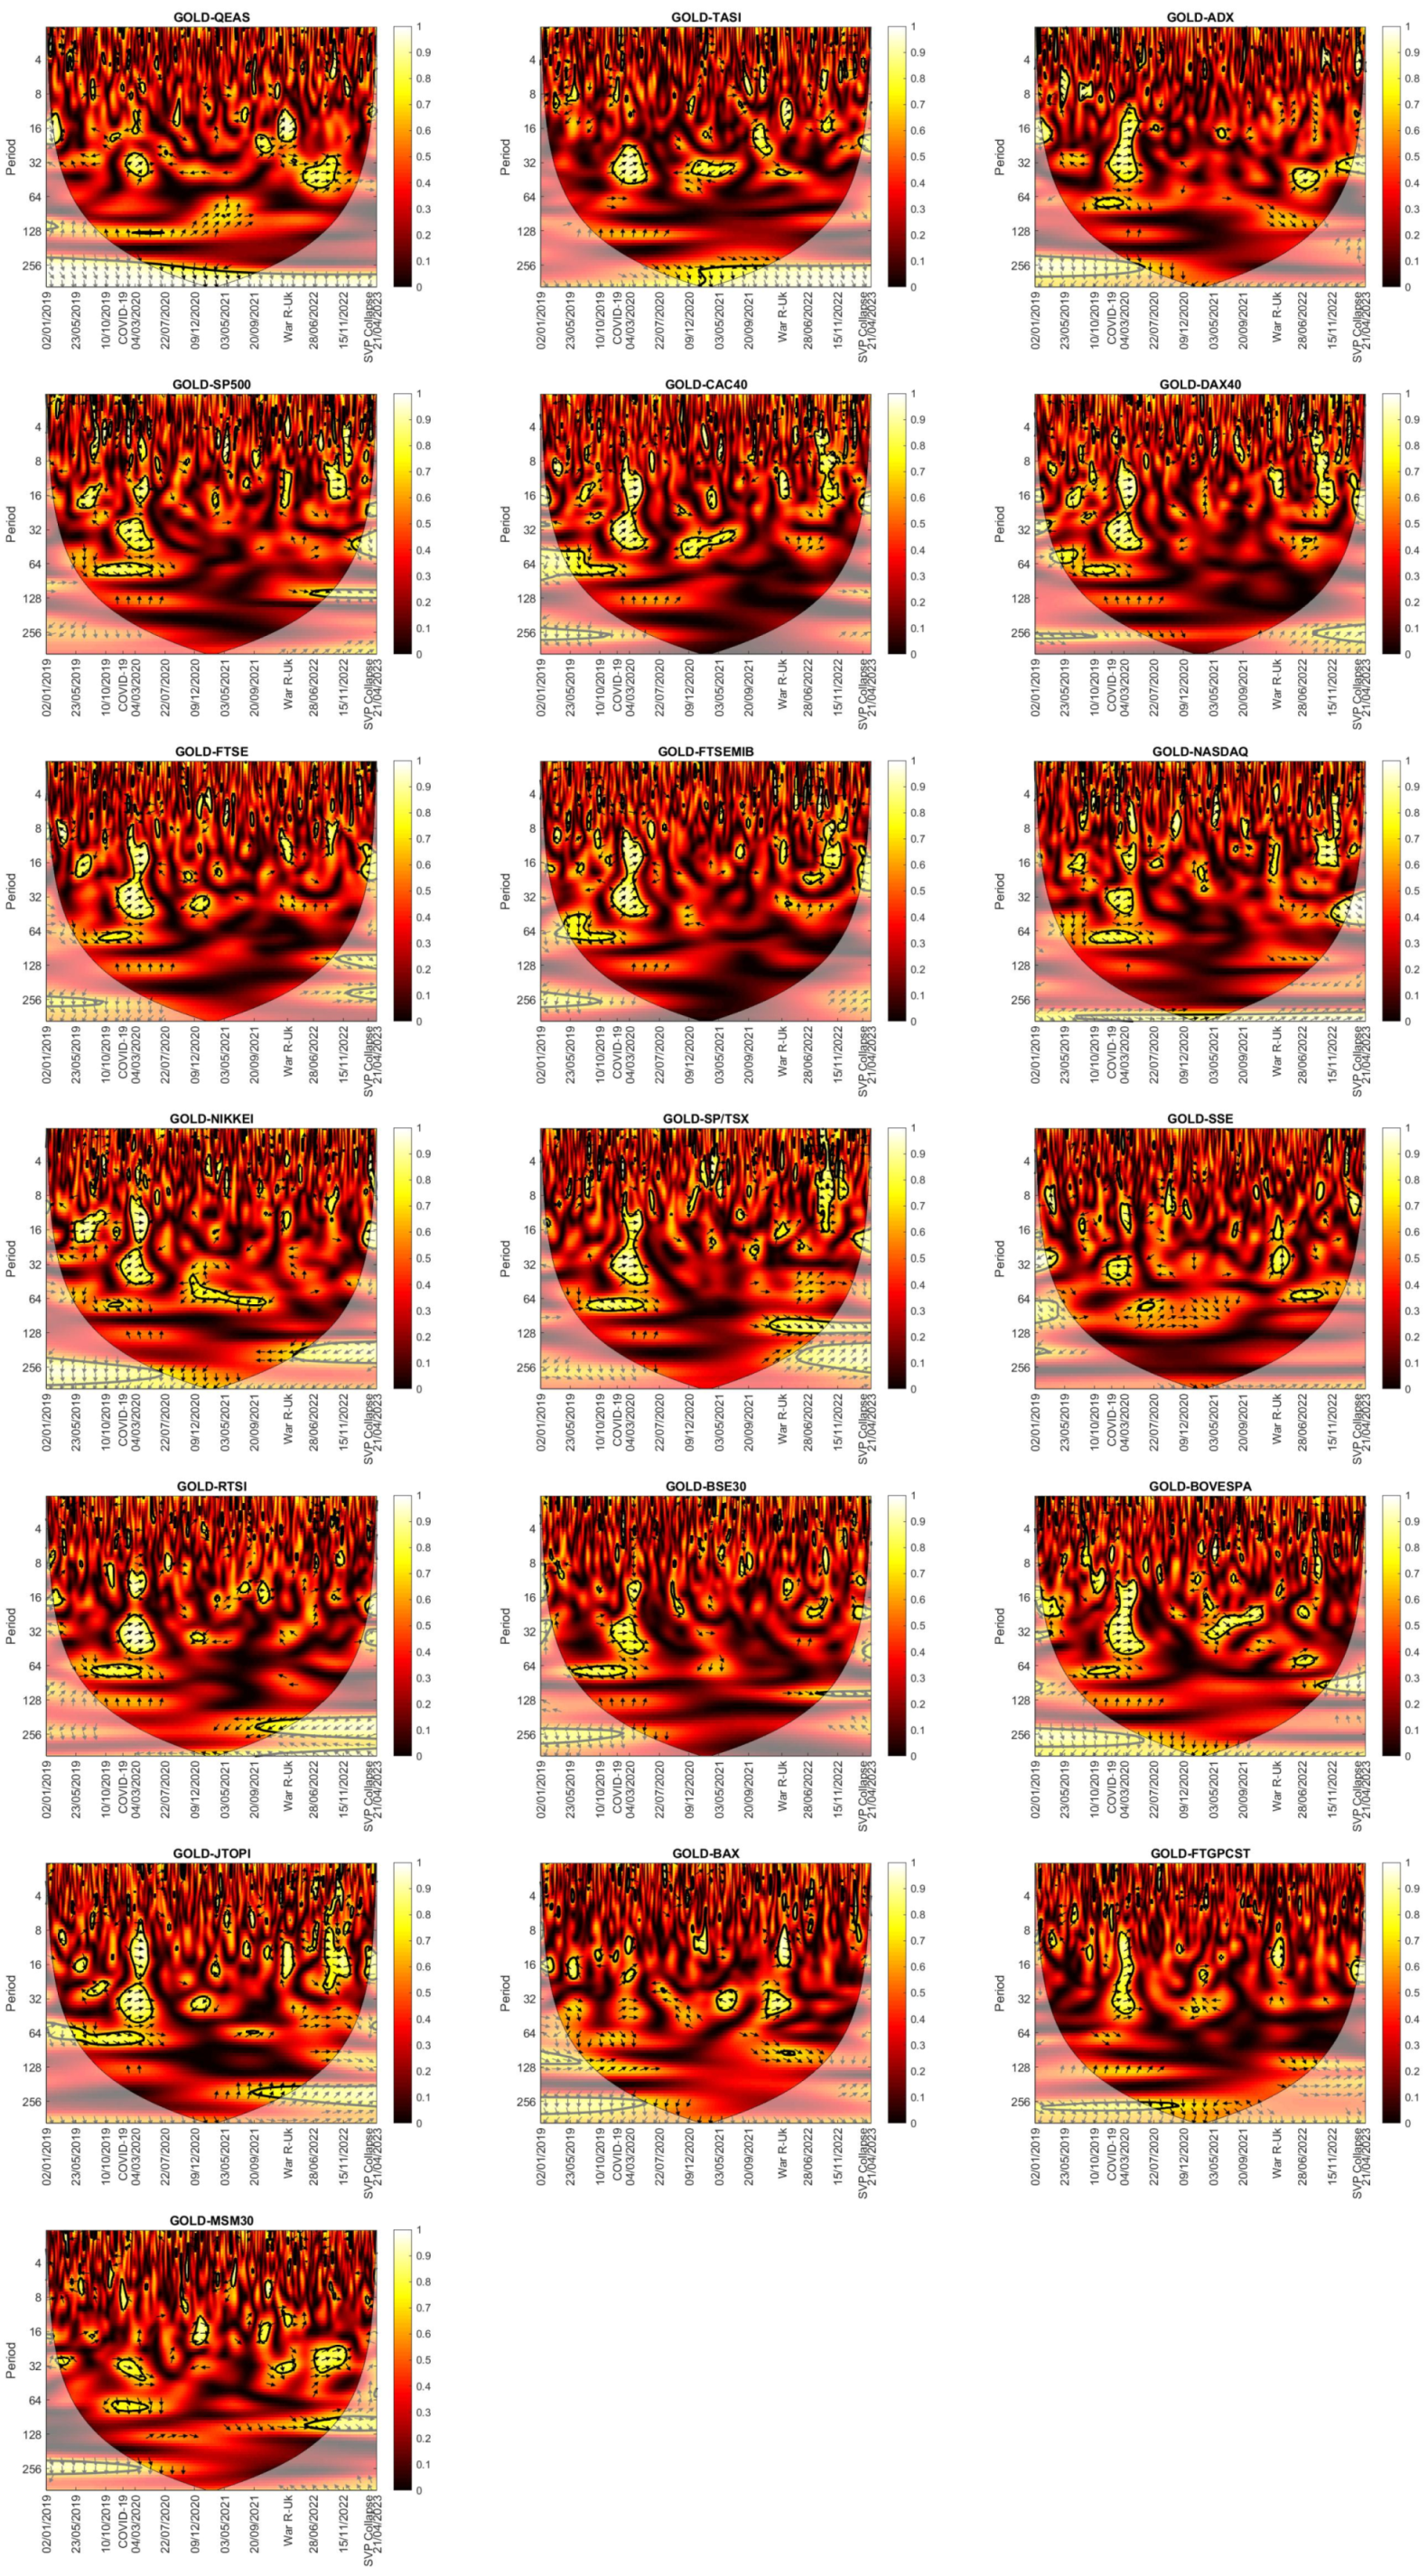
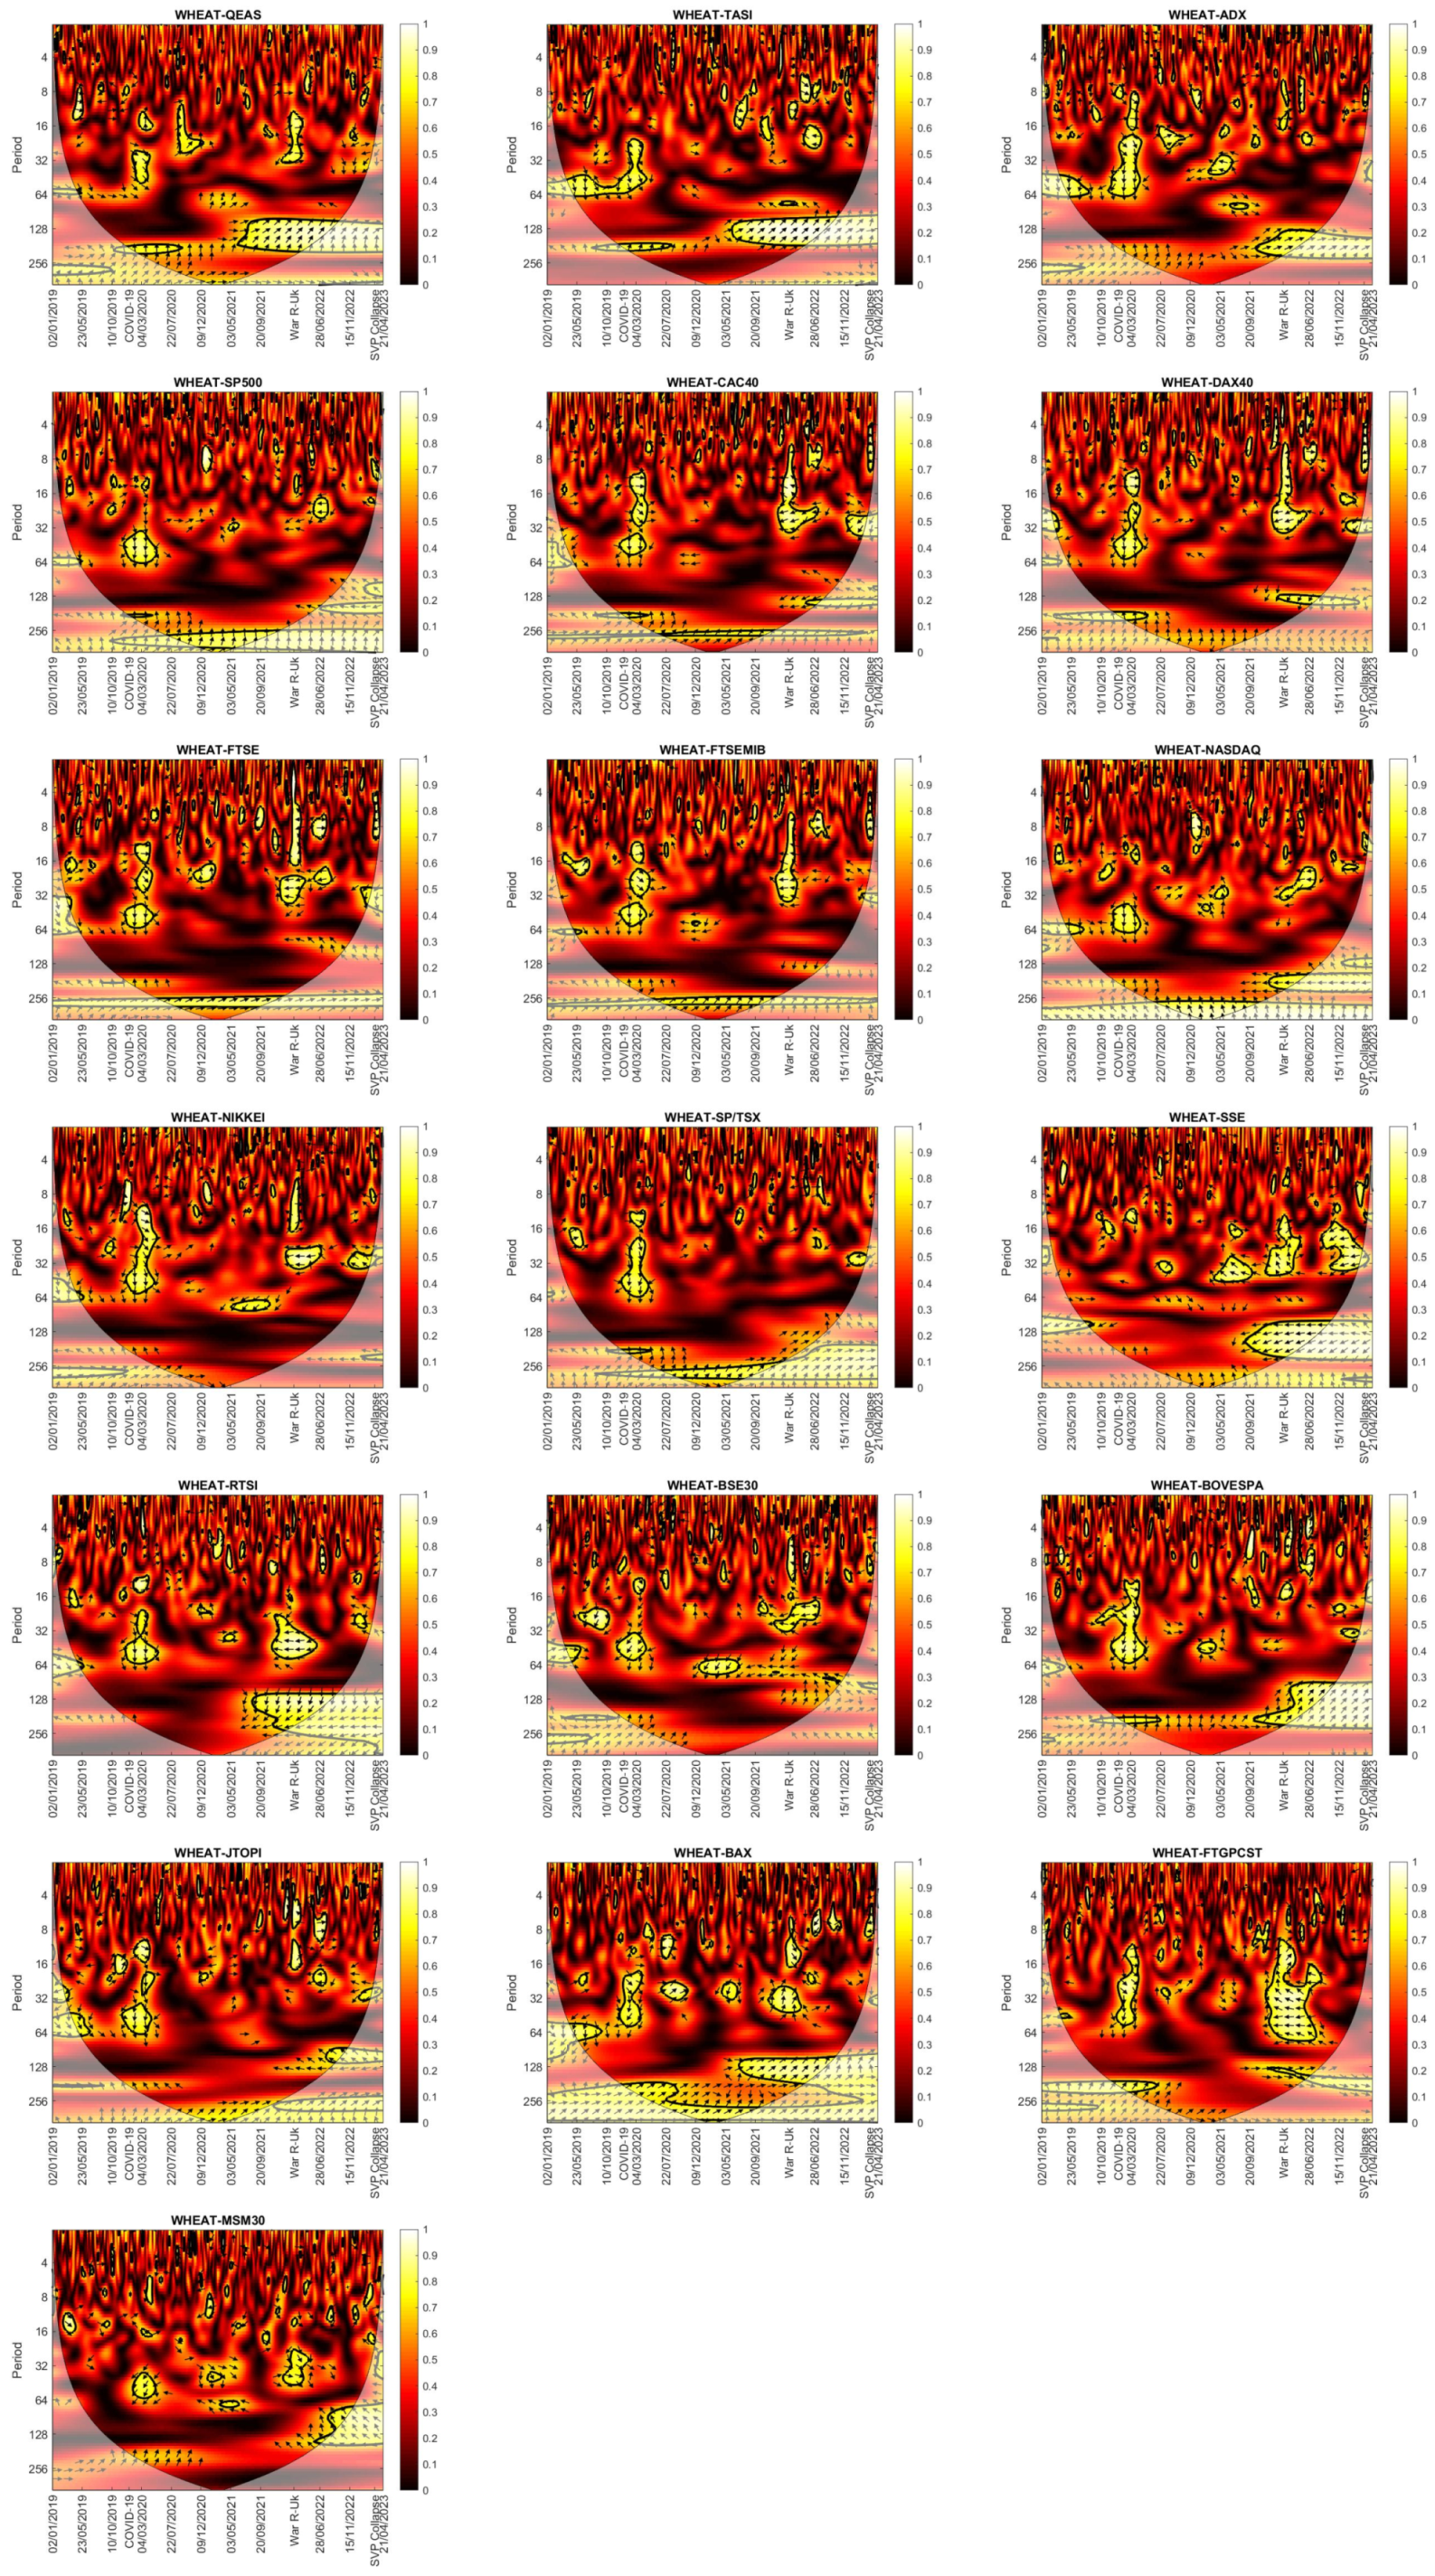
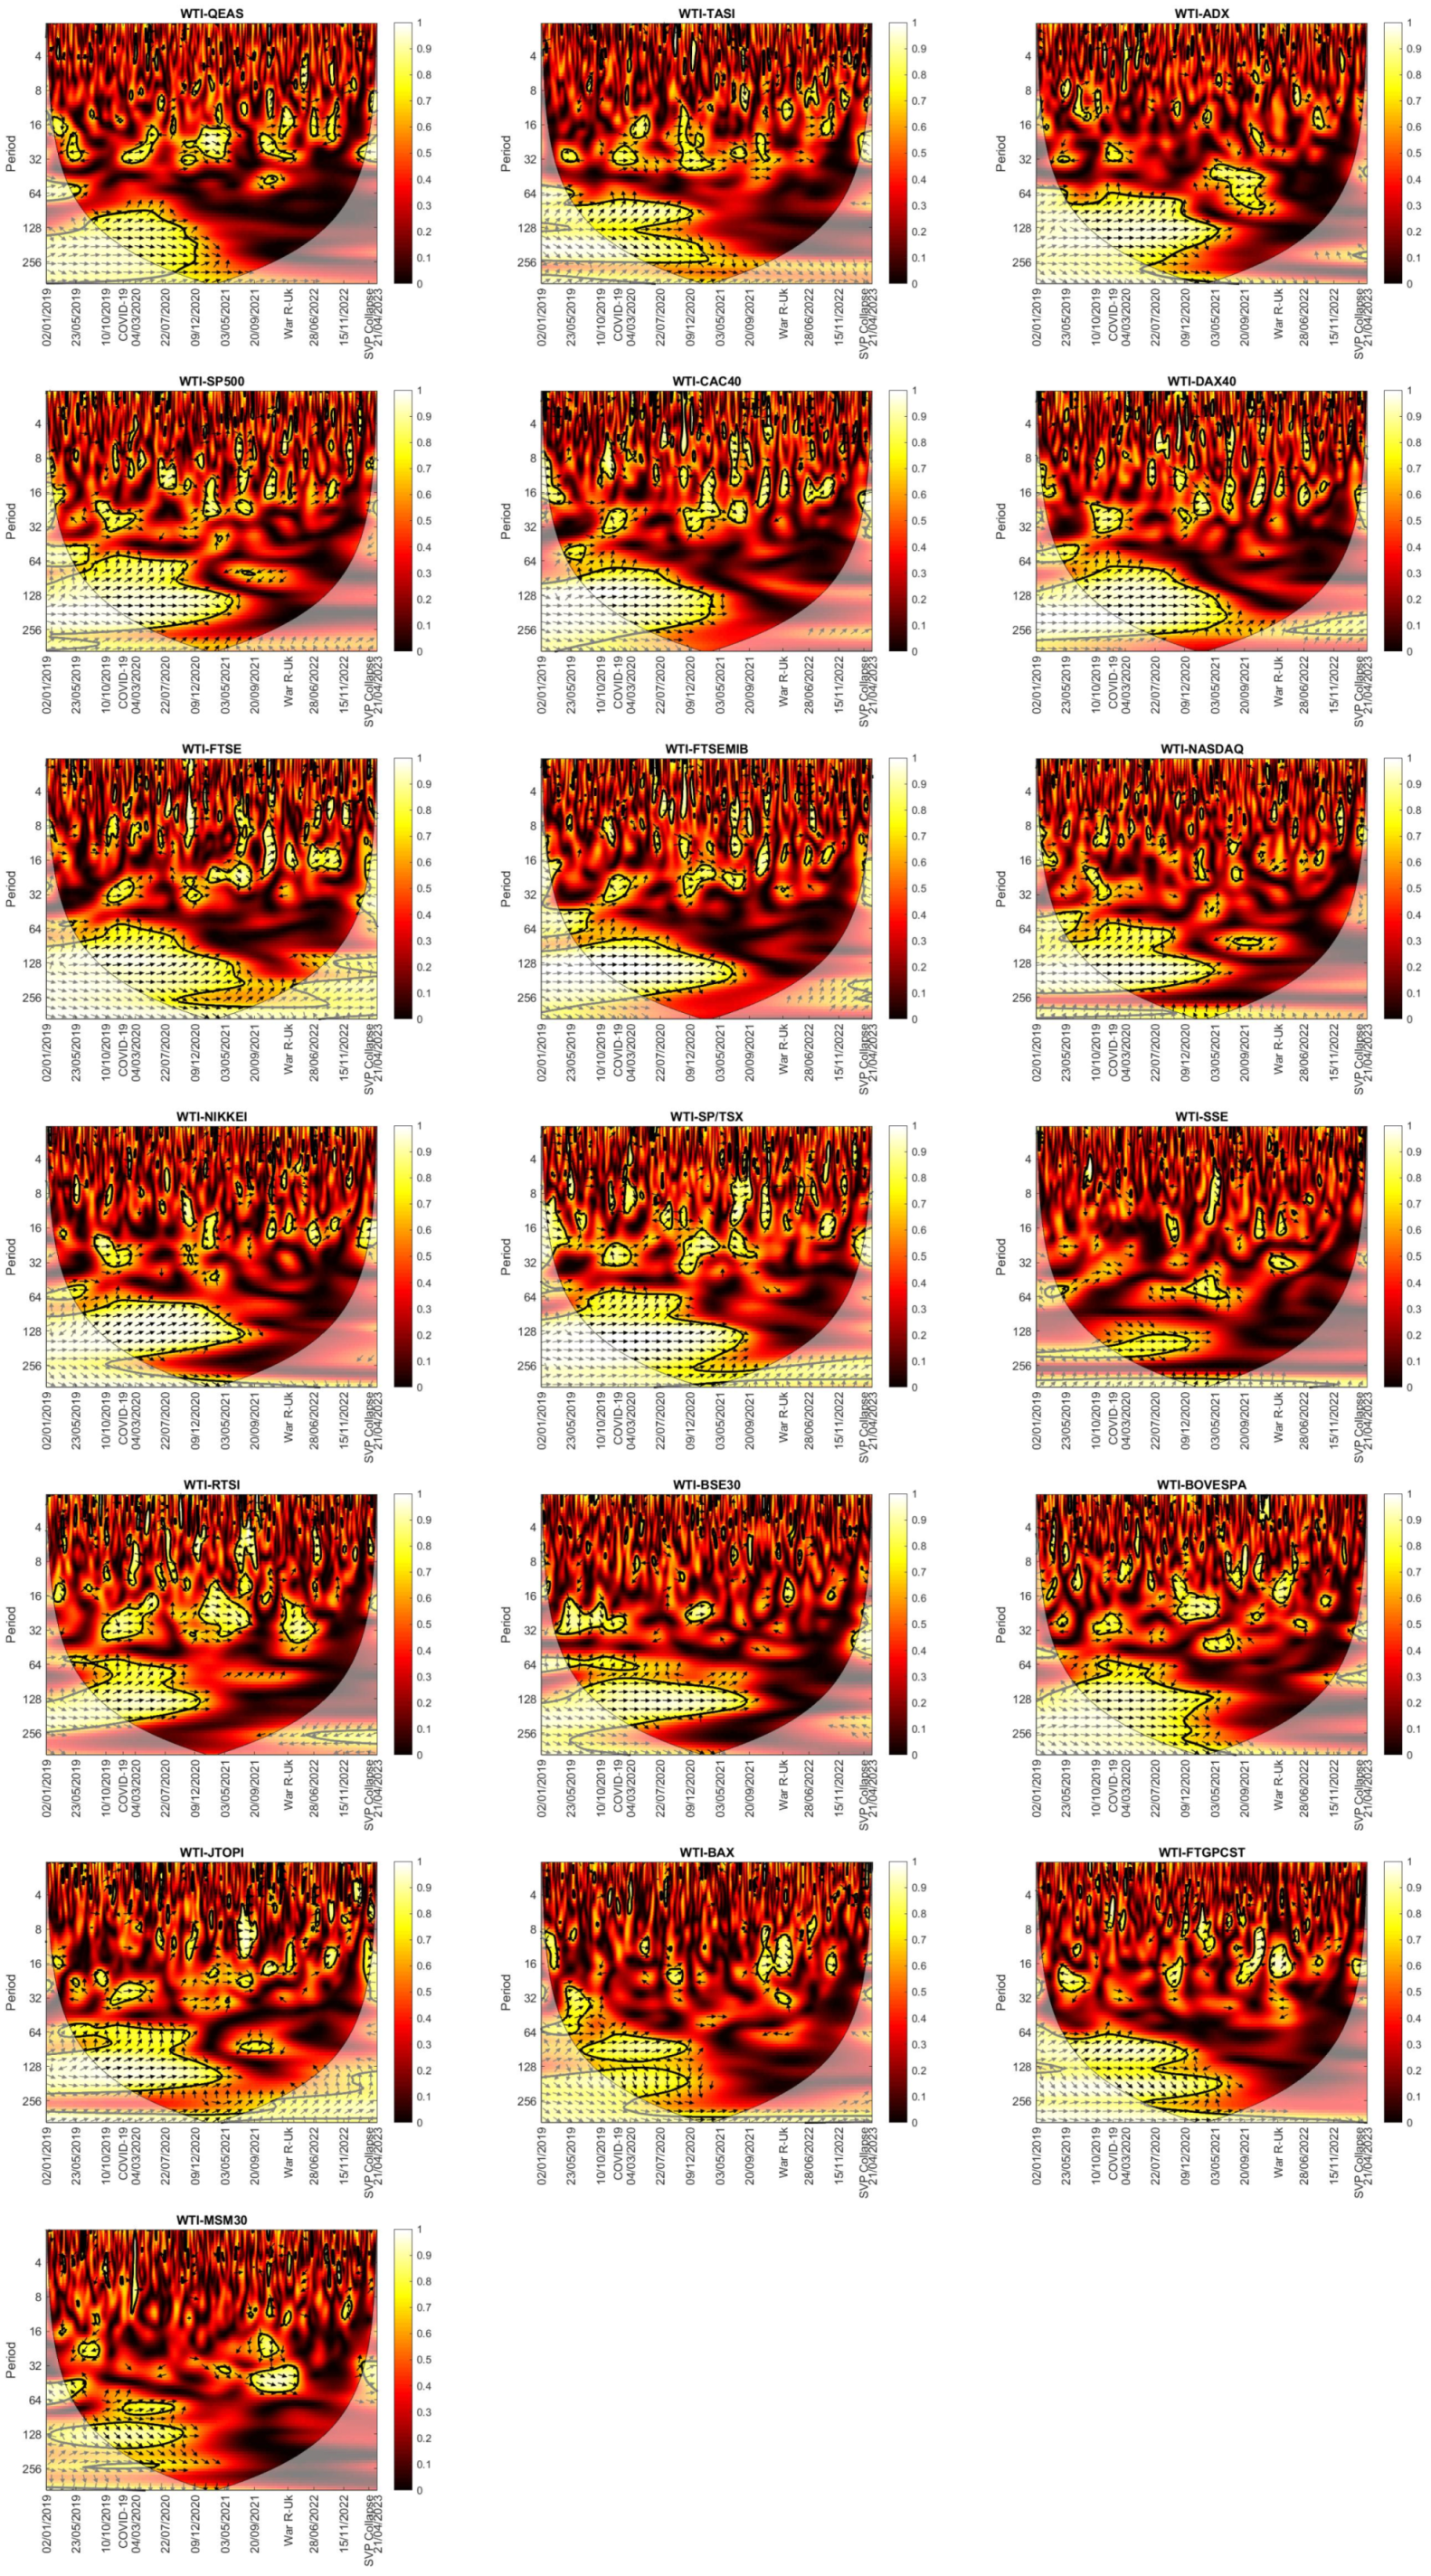
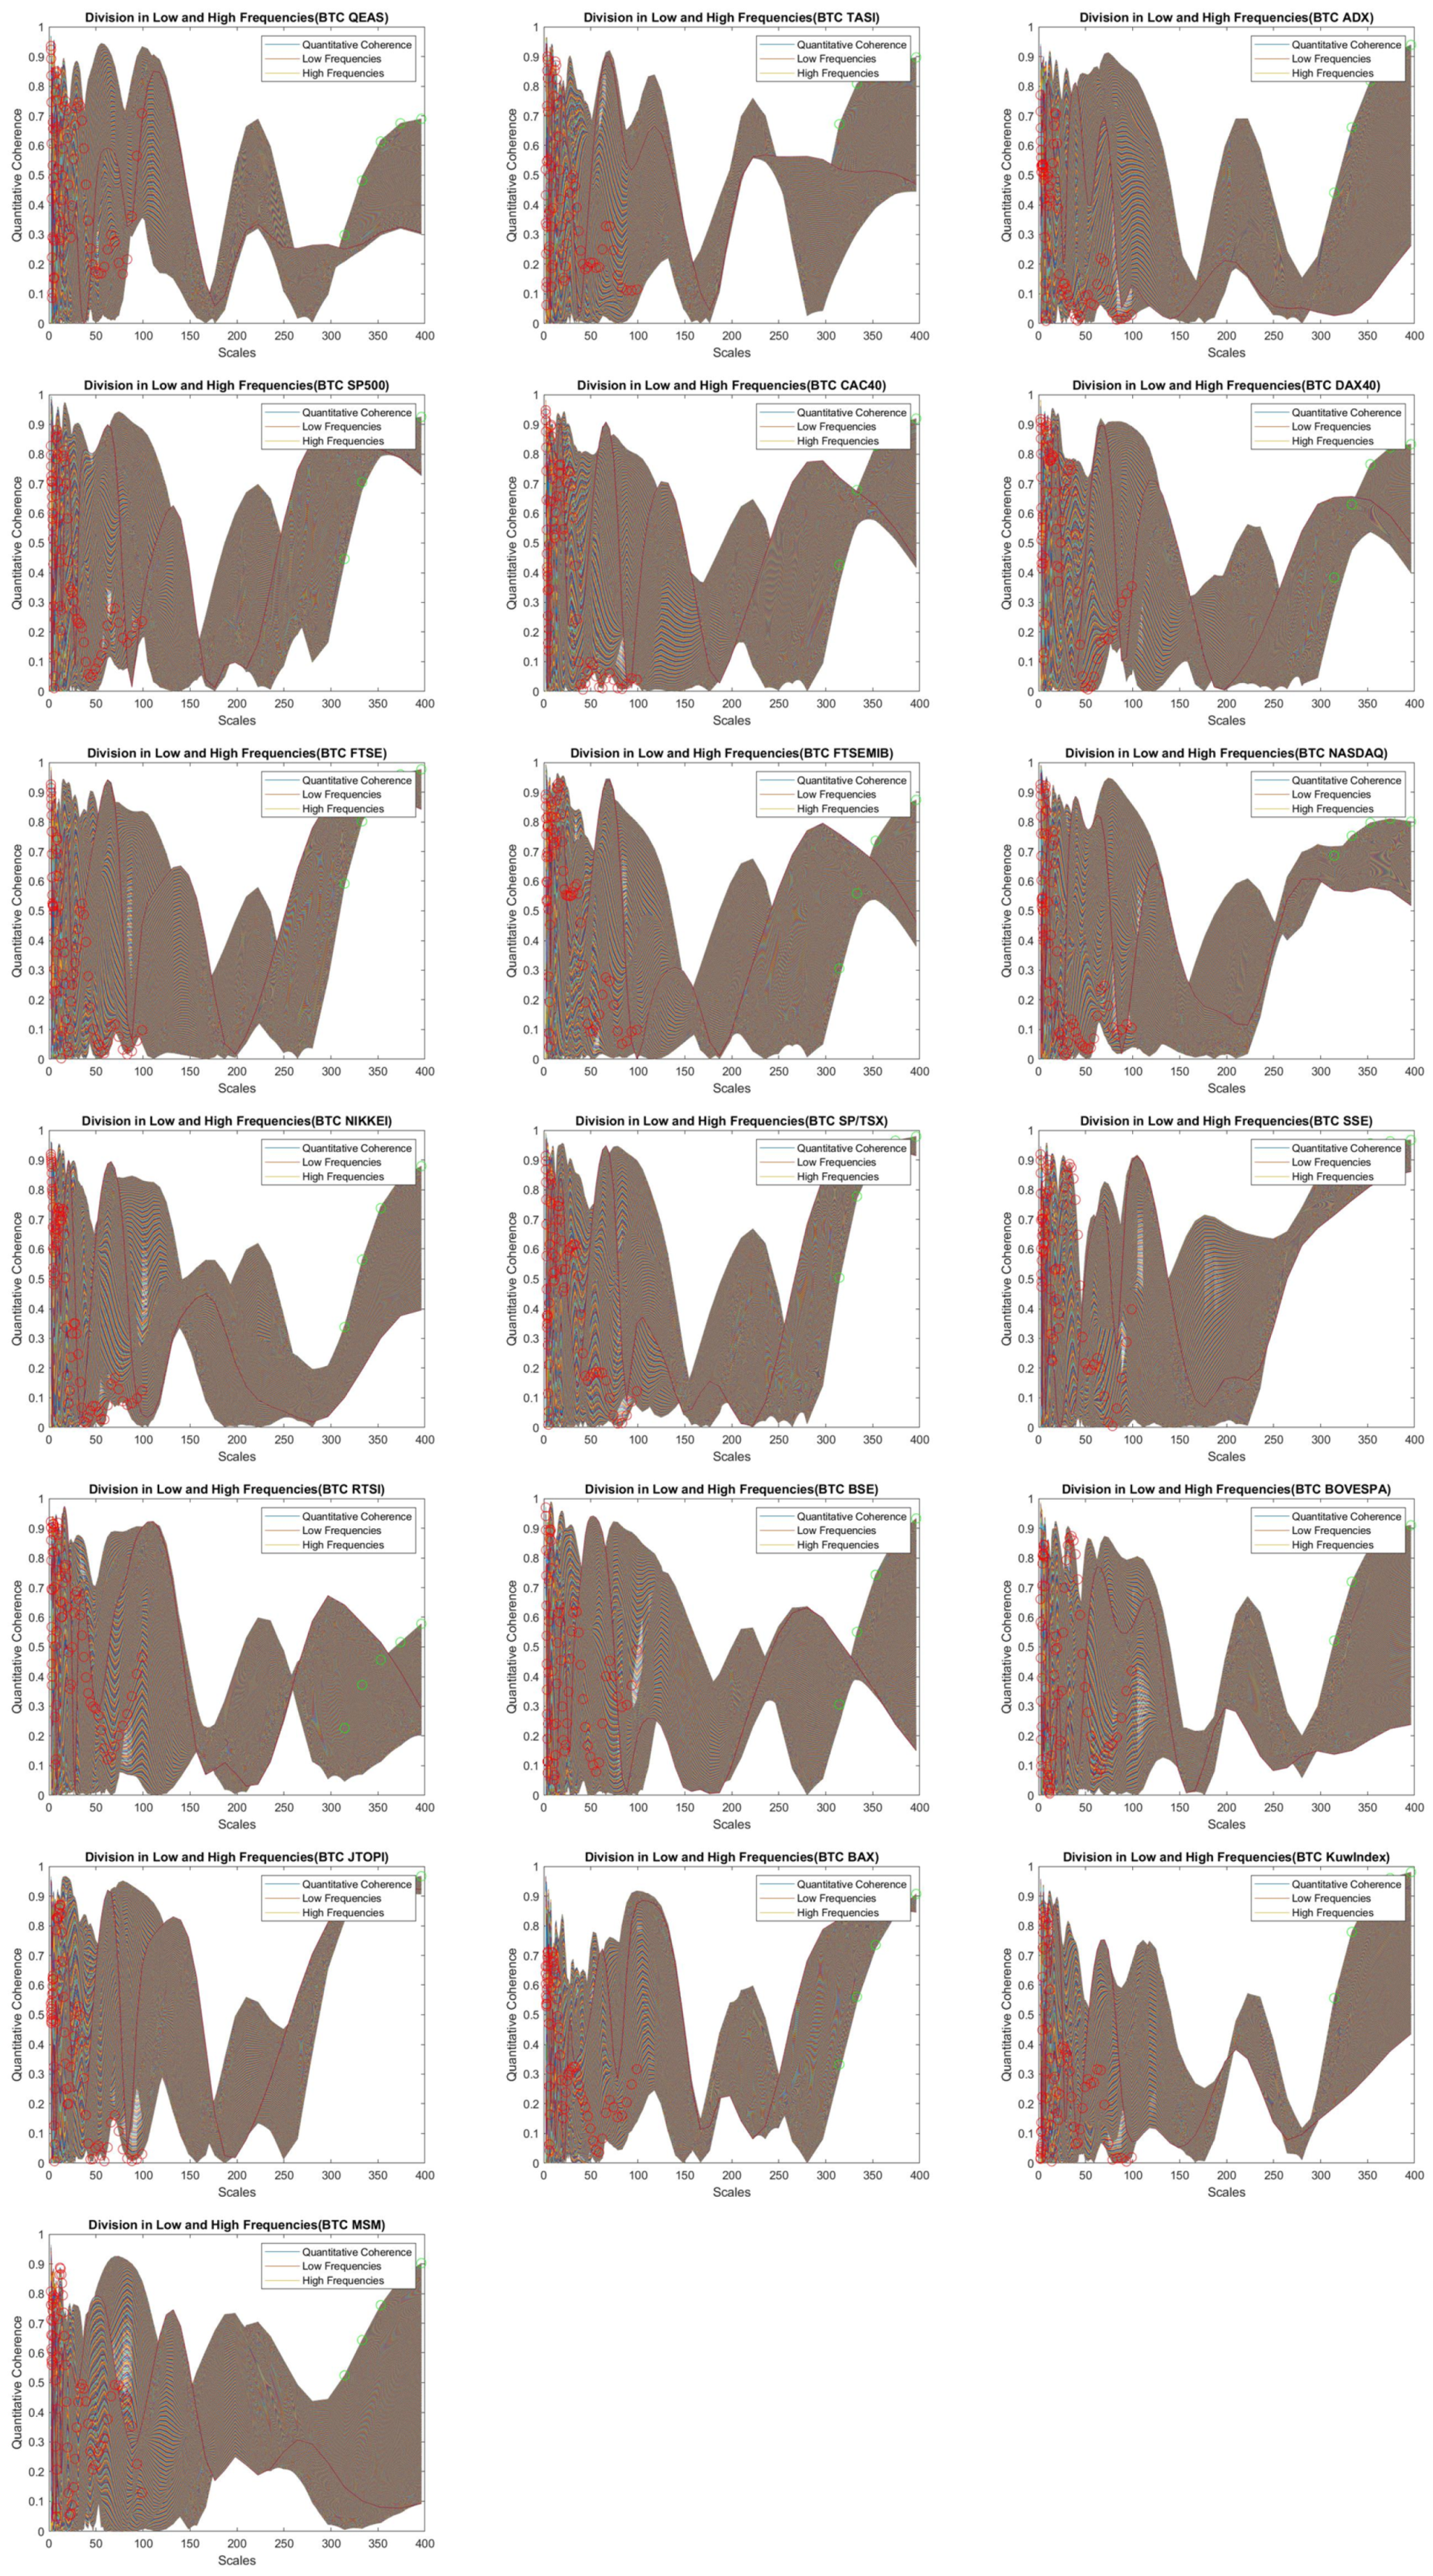
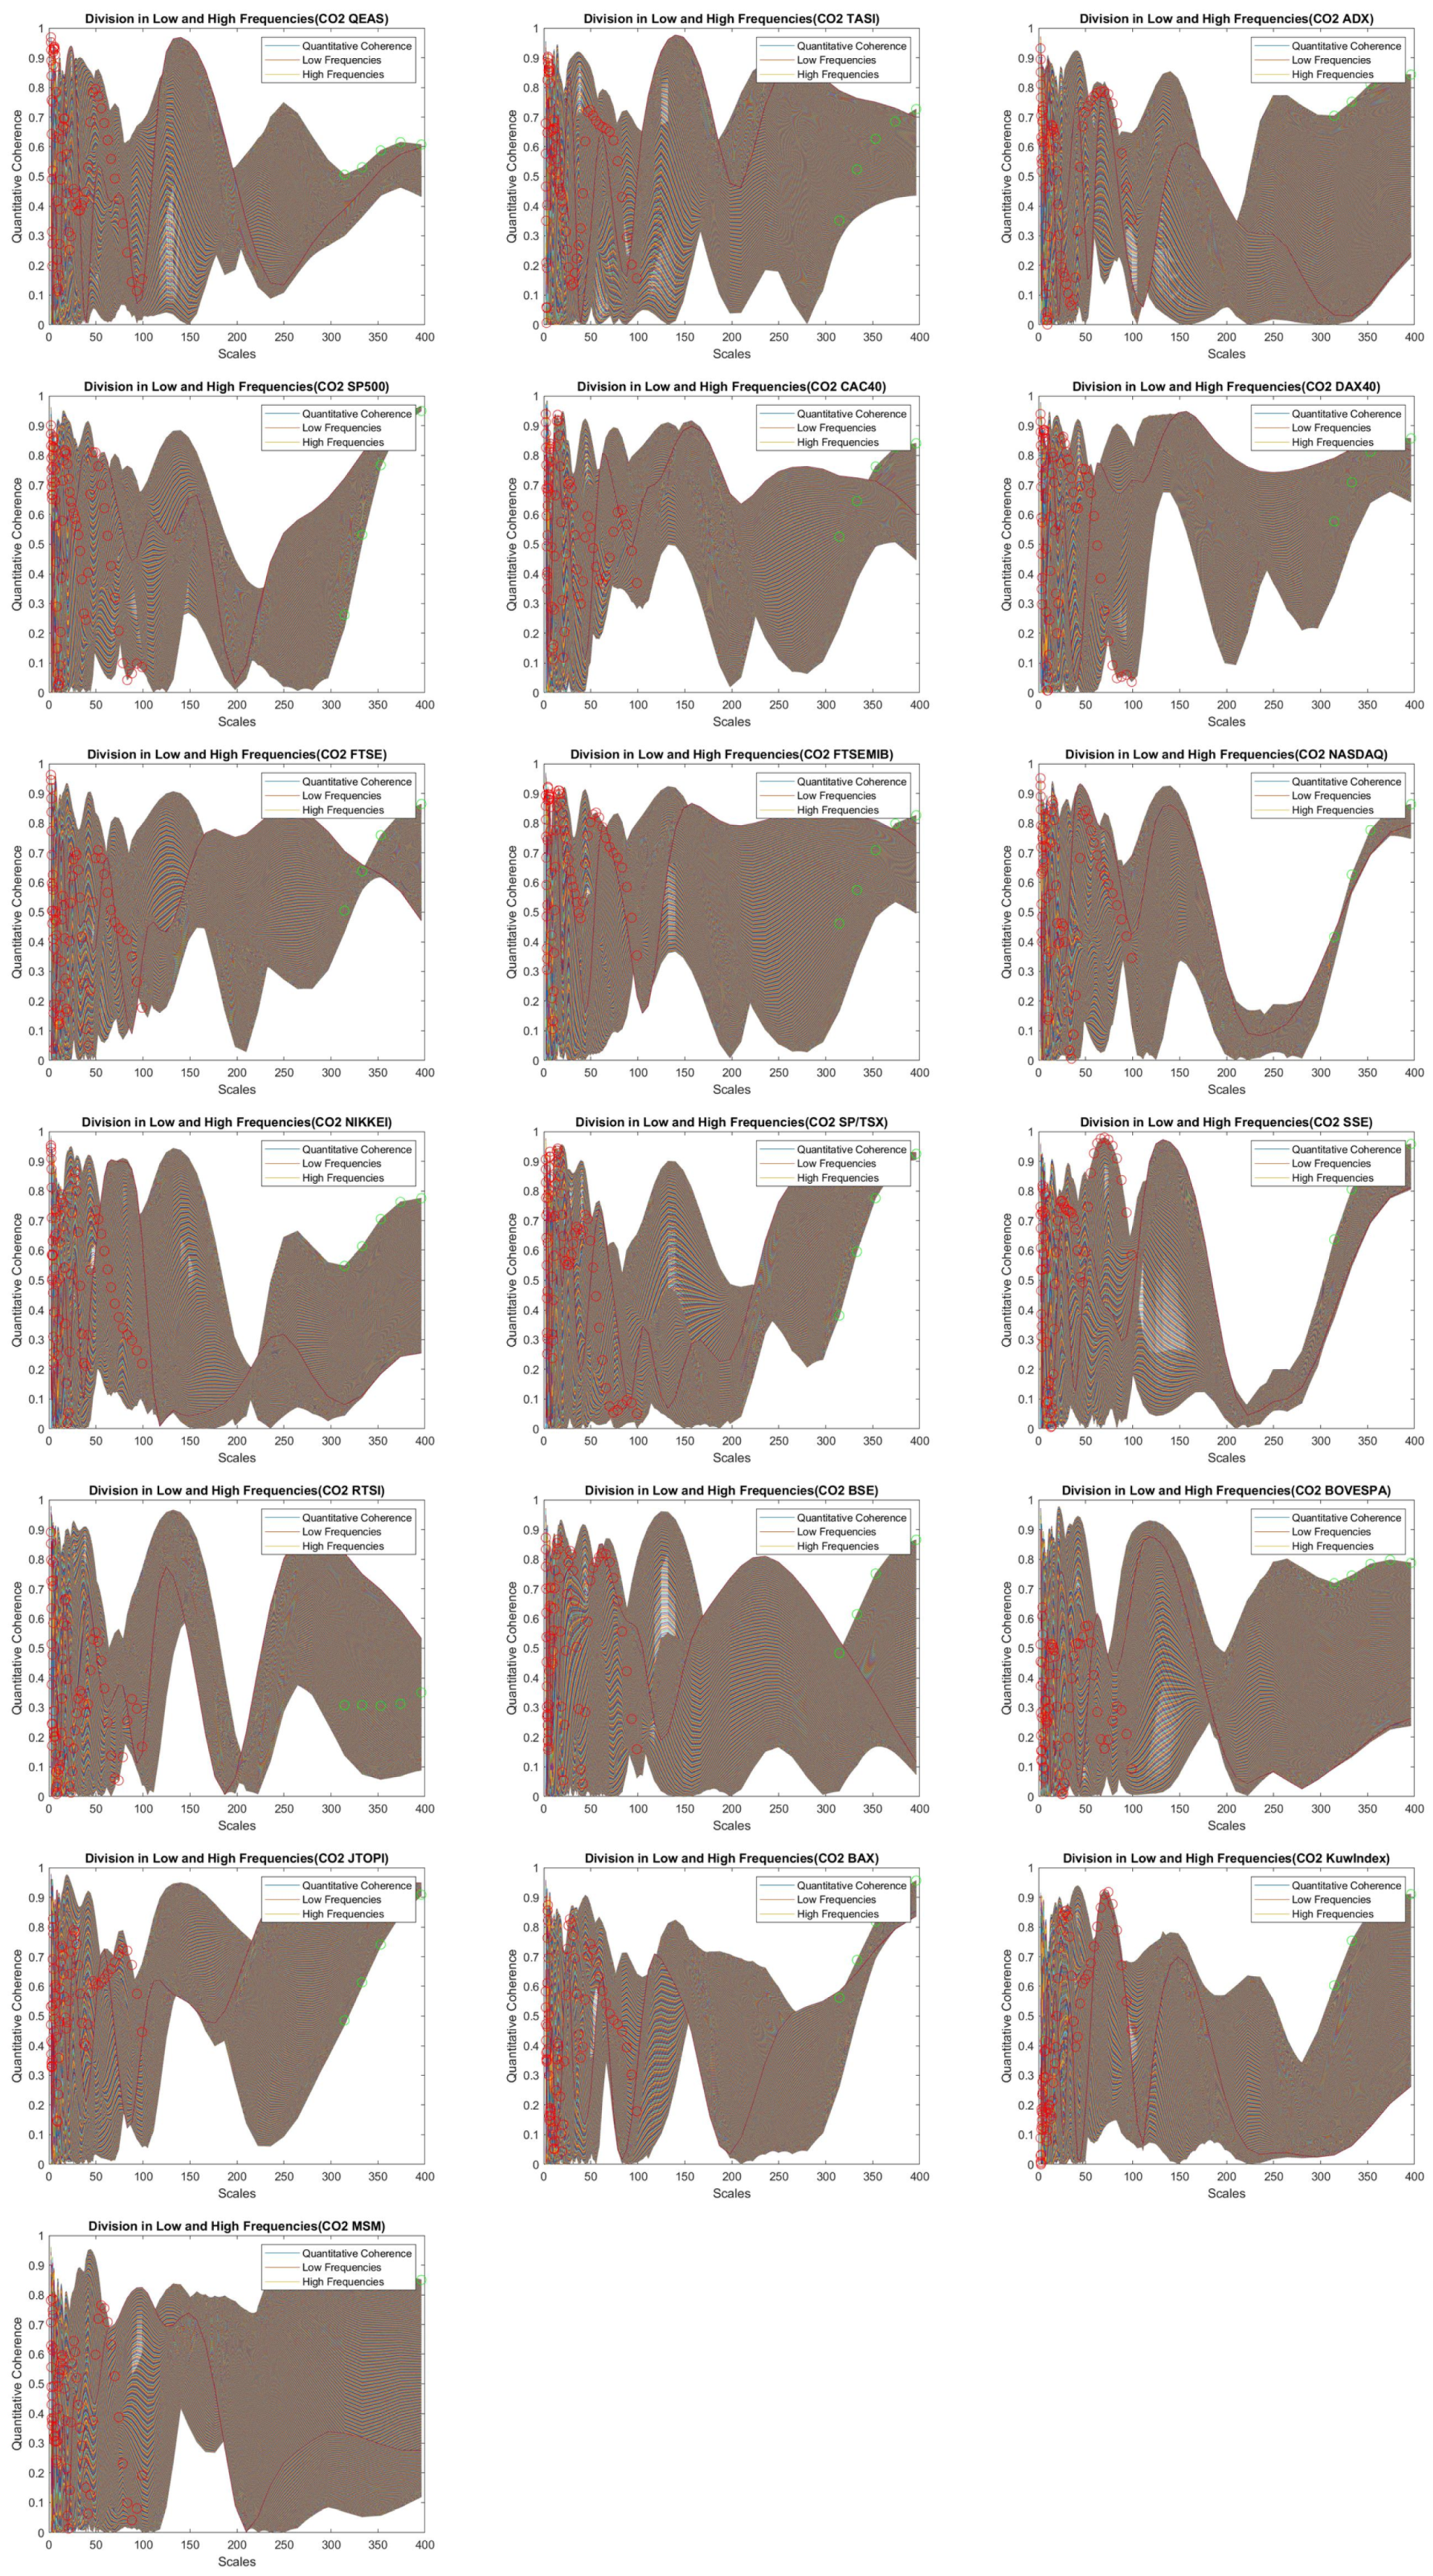
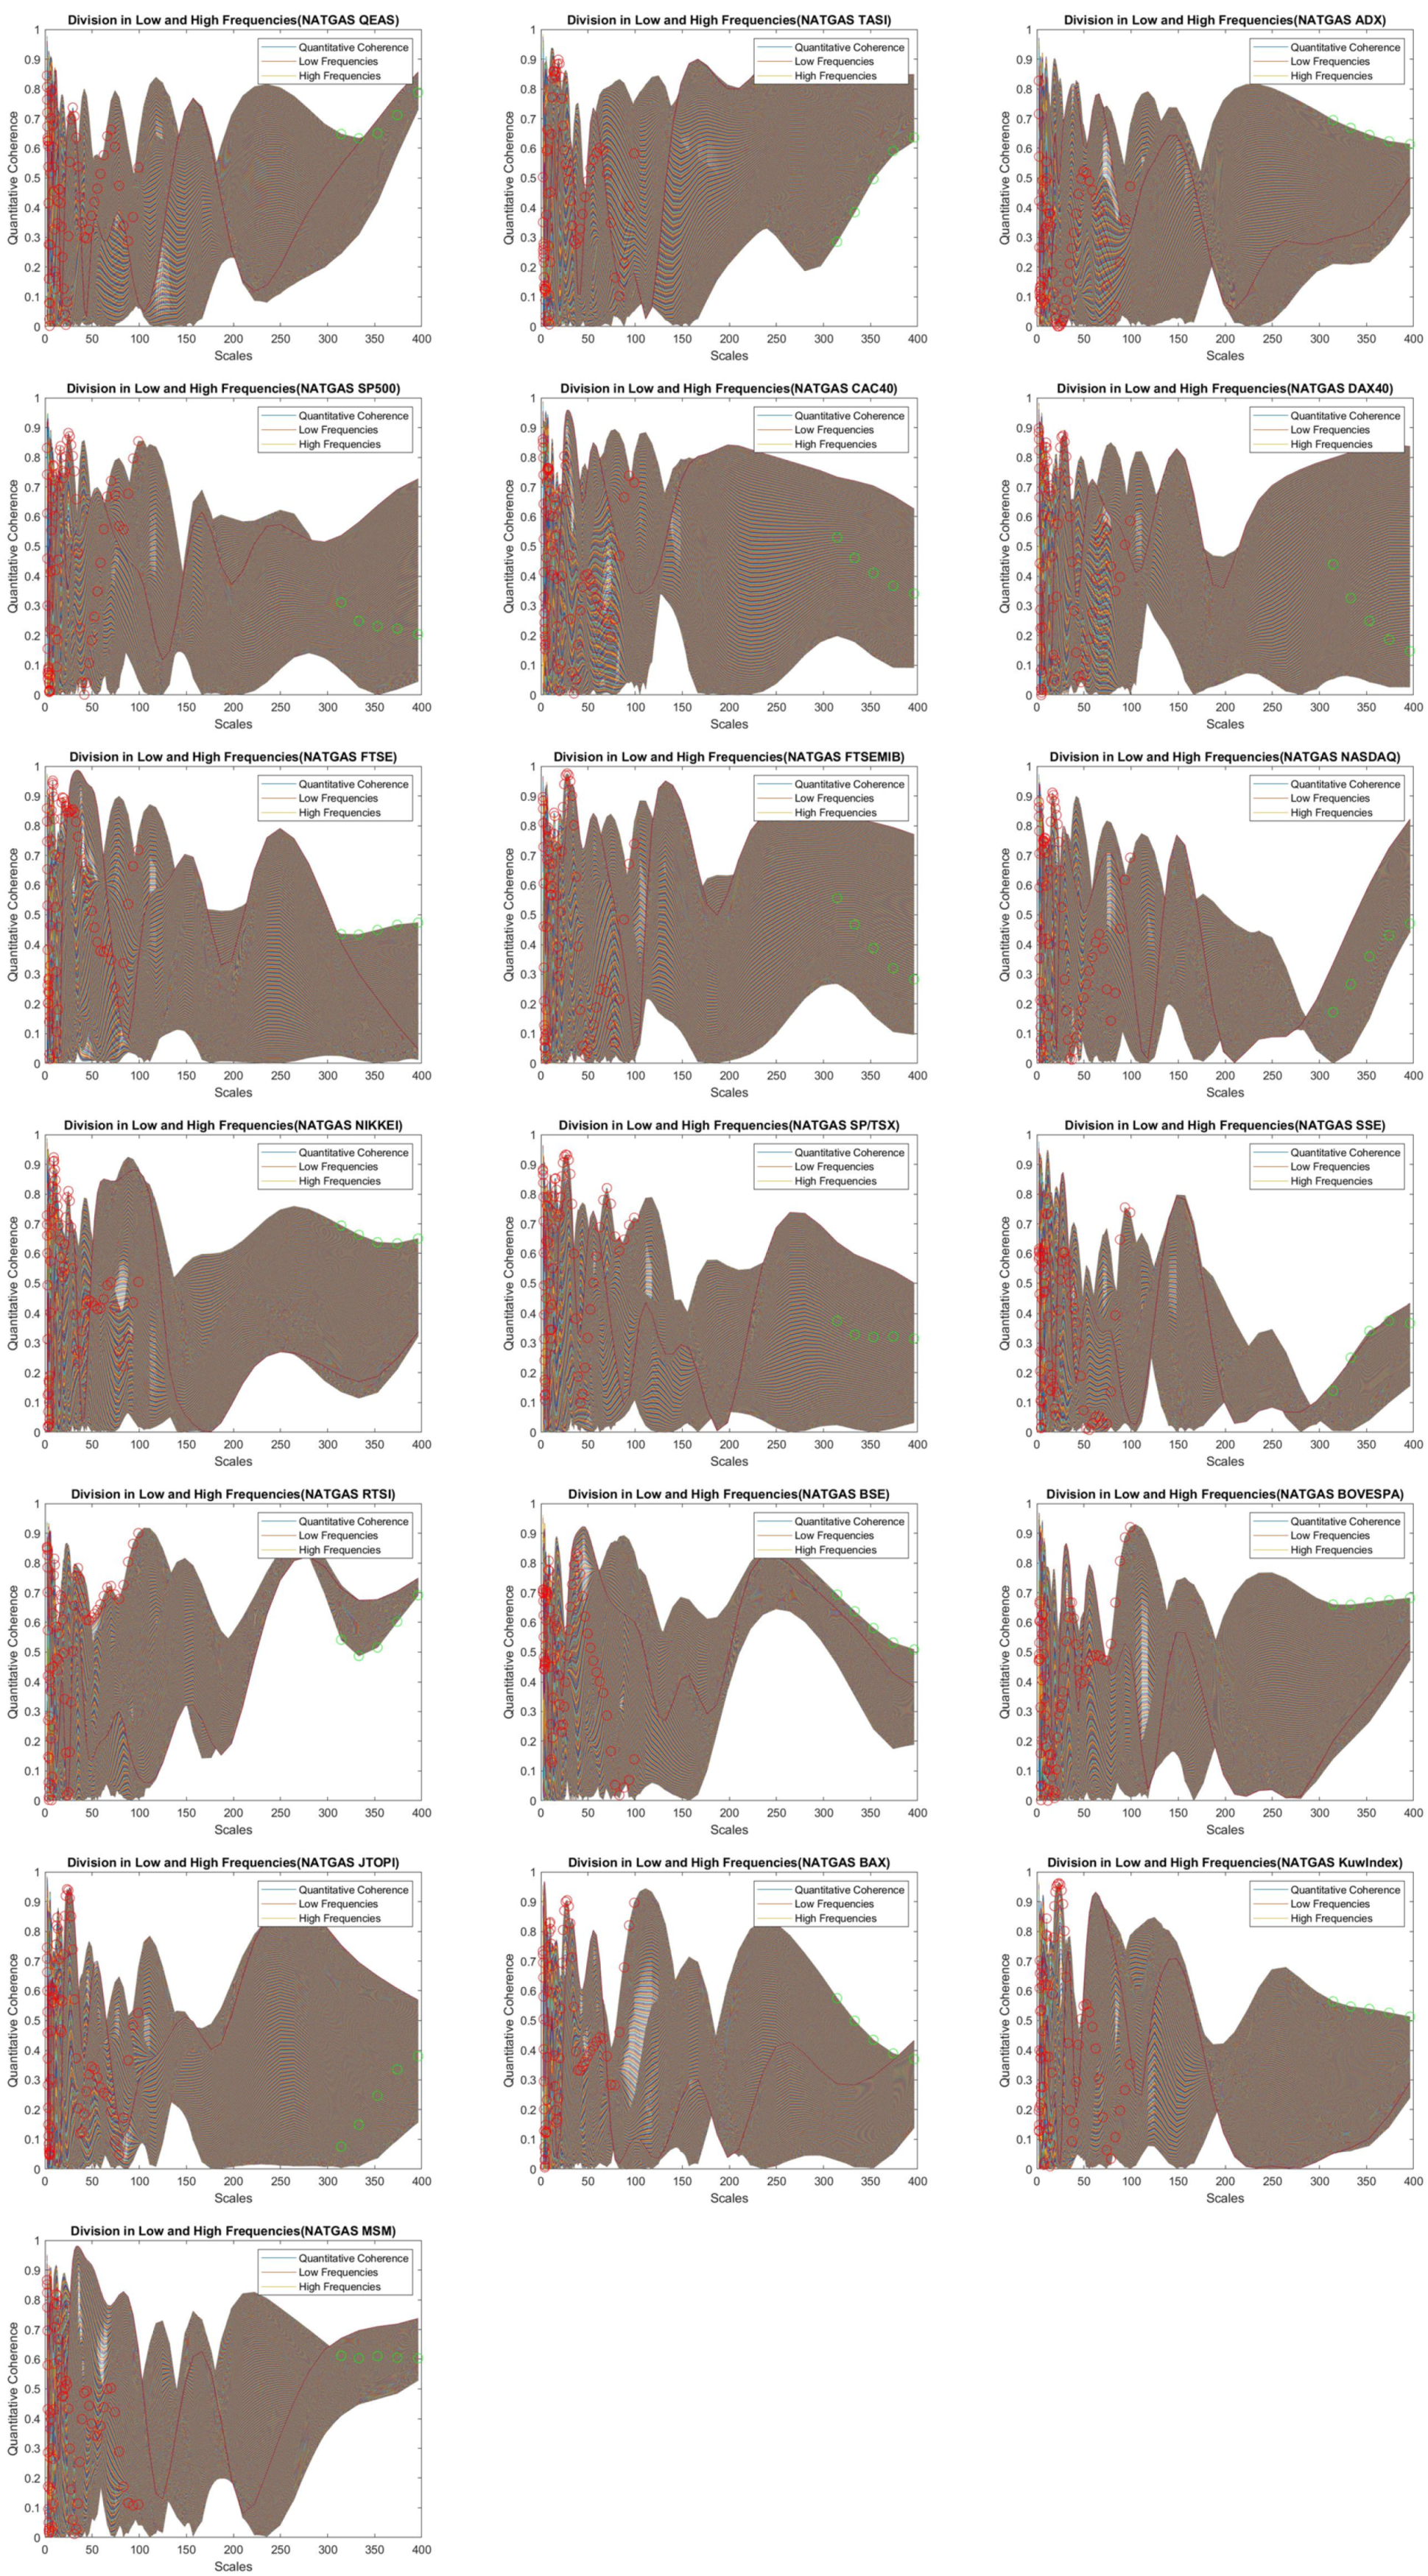
4. Empirical Results & Interpretation

In this section, we present the dynamic connectedness between stock market indices in the G7, BRICS and Gulf regions and WTI, gold, wheat, natural gas, Bitcoin and CO2 during the 2 January 2019–21 April 2023. By leveraging the wavelet’s ability to decompose time series into localized frequency components1, the co-movements between different variables can be meticulously dissected.
That is why one can use the wavelet method to investigate the comovements between different variables. More precisely, the wavelet coherence is employed to find out correlation estimates and how the potential associations across different assets change according to different times and frequencies. Each pairwise association figure displays the time dimension as the X-axis (horizontal axis) and the Y-axis (vertical axis) corresponding to the frequency scale.
Figure 3, Figure 4 and Figure A1, Figure A2, Figure A3, Figure A4 and Figure A5 plot the estimated wavelet coherence and phase difference for different pairs. These charts clearly illustrate the localization and evolution of the linkage between different pairs and identify lead-lag relationships if they exist in the time-frequency space. In such plots, the thick black contour is the 5% significance level and outside of the thin line is the boundary affected zone. This indicates that the substantial coherence is well-documented. The black colors correspond to no coherence while the white colors reflect significant coherence. Afterward, arrows show the phase difference among two time series. For notable contours, arrows localized in the left (resp. right) show that variables are out of phase (resp. in phase). Out of phase (resp. in phase) indicates that variables seem to be negatively (resp. positively) related and move in opposite fashion (resp. jointly). If arrows change to the right and down (resp. up), the first variable is lagging (resp. leading). However, whether arrows move to the left and down (resp. up), the first variable is lagging (resp. leading). Overall, information on the phases indicates that the linkages across different couples seem to be heterogeneous among scales and the direction of arrows. Such information can potentially help to determine which asset(s) can possibly act as safe-haven asset during turbulent times.
Figure 3 provides a compelling visual representation of the wavelet coherence between Bitcoin and stock markets across distinct geographical regions. Intriguingly, the wavelet coherence analysis reveals a remarkably consistent pattern among G7 stock market indices during the timeframe under examination. Notably, Bitcoin exhibits a positive correlation with the S&P500 index, characterized by a lag phase, during the health crisis at the 64–128-day frequency scale. In contrast, during the geopolitical crisis, Bitcoin takes the lead in driving the dynamics of the American stock market.
Turning our attention to the BRICS region, the RTSI index demonstrates a positive comovement with Bitcoin during the health crisis, while exhibiting a negative correlation with the Russian stock market during political events. Moreover, Bitcoin assumes a leading (resp. lagging) position relative to RTSI in the wake of the COVID-19 pandemic (resp. the 2022 Russia-Ukraine war). For the remaining markets, the Bitcoin-stock market indices display a general and positive correlation during both health and political crises. This consistent pattern is observed across all crises examined.
Another noteworthy observation from the heatmaps pertains to the impact of the Silicon Valley bank failure on the comovements between Bitcoin and certain G7 stock markets. Notably, Bitcoin exhibits a negative correlation with the DAX40, FTSE, FTSEMIB, and SP/TSX indices. This finding could suggest that Bitcoin may reassume its role as a safe-haven asset during bank crises.
Figure 4 presents the correlation between the VIX index and stock market indices from various regions, revealing a distinct pattern that diverges from the observed comovement with other assets. We can see many large islands which seem to be very significant. In other words, the wavelet cross-coherency displays low-to-medium statistically significant coherence, except for China. This suggests that both time series are highly correlated and anti-phase during the period of the health and political crises. Not surprisingly, VIX tends to lead the major stock markets at almost all frequencies. Despite VIX mainly computes the implied volatility in the US stock markets, its movement tends to affect other stock market worldwide. As previously mentioned, the correlation coefficient is statistically significant. This suggest that a decrease (resp. an increase) in VIX leads to put downward (resp. raise) the world stock market returns. In this regard, Marfatia (2020) reports that an increase in VIX indicates that investors could foresee raised uncertainty in the US market and curb the sentiments in the world stock markets. In particular, the uncertainty is well-documented during health, geopolitical and bank crises for some stock markets in G7 region (S&P500, CAC40, FTSE, DAX40, FTSEMIB, NASDAQ, NIKKEI and SP/TSX).
The rest of Figures related CO2 emissions and commodities are reported in the Appendix A. In this respect, Figure A1 displays the Wavelet coherence plots between CO2 futures and the G7 stock market indices. Overall, medium-run (16–32) coherence and long-run (64–128) periods seems to be well-documented. Most notably, arrows are generally pointing right for almost CO2 future-market index pairwises during 6 March 2020–5 May 2021. This clearly indicates positive and significant comovement between CO2 futures and the G7 stock indices. More precisely, the arrows tend to move in upward direction. This indicates that CO2 futures are lagging the G7 stock market indices over the period of the COVID-19 pandemic. However, CO2 futures and the G7 stock market indices are in phase, with CO2 futures leading during the scale 64–128 days during the outbreak of the Ukraine-Russia war. Figure A1 shows the Wavelet coherence plots between CO2 futures and the Gulf stock market indices. Significant association between different indices and CO2 future is well-pronounced during the scale 32–128 days. Arrows are pointing right and upwards, indicating that CO2 futures are lagging the Gulf stock market indices over the period 14 October 2019–11 December 2020. Except for Saudi Arabia, CO2 futures are leading the other stock markets during the scale 8–32 days. This clearly indicates that both series are highly correlated throughout the political event. The same findings are overwhelmingly reported for the CO2 futures and the BRICS stock markets pairwise (Figure A1). Afterward, no significant islands among pairs are documented with the failure of Silicon Valley Bank.
Figure A2 presents the Wavelet coherence charts between natural gas futures and the G7, BRICS and Gulf stock market indices, respectively. Overall, substantial islands between the stock market indices and natural gas futures are smaller during the period 14 October 2019–24 July 2020 at 64–128-day frequency bands. In particular, arrows tend to point towards the left and downward direction, indicating that natural gas futures are lagging the stock market indices. Some significant contours for some markets are visible during the long-run period (64–128-day frequency bands) with the 2022 Russia-Ukraine War. Nevertheless, the bank crisis seems not to affect the cross-market linkages.
Figure A3 illustrates the Wavelet coherence charts between gold and the G7, BRICS and Gulf stock market indices, respectively. The comovement between these different assets seems to be only during the period 14 October 2019–24 July 2020 at 8–32 days scale. During the first waves of coronavirus, gold tends to generally lag the most of stock market indices. Only stock markets in Canada, China, Bahrain and Qatar tend to significantly comove with gold due to the outbreak of political event. For instance, gold is leading Canada during the scale 64–128 days. On the other hand, gold seems to be negatively correlated and leading United Kingdom during the scale 8–16 days with the outbreak of bank crisis. But, it is positively correlated and lagging NASDAQ during the scale 32–64 days.
Figure A4 illustrate the Wavelet coherence charts between wheat futures and the G7, BRICS and Gulf stock market indices, respectively. The wavelet coherence analysis reveals seems to be very similar patterns, except for Bahrain, Kuwait and Qatar. Indeed, one might observe that wheat futures commove with the stock market indices in different regions at certain frequencies (in general, 16–32 day bands). This can reflects that the stock markets are not tightly connected to the wheat futures. Nevertheless, the wheat futures are lagging the stock market in Bahrain, Kuwait and Qatar at long-run periods (128–256 day bands) during the health crisis period. One might also observe negative and significant association between wheat future and some stock markets in different regions. During the political crisis, the wheat futures are lagging China and Russia at 128–256 day bands. As well, the wheat futures tend to be leading different stock markets in Gulf region at 128–256 day bands. Nevertheless, no impact of the bank crisis on the cross-market linkages is detected.
Based on our empirical results obtained from the Wavelet coherence plots between crude oil and the G7, BRICS and Gulf stock market indices (see Figure A5), one might conclude that major world indices appear to commove significantly with crude oil. Most of time, they are in phase during the first waves of COVID-19 pandemic, indicating that the stock markets are positively and significantly correlated at medium- and long-run periods. In particular, arrows are pointing right and upward direction. Interestingly enough, the crude oil market is leading major world indices. One might see that the association between different markets becomes weaker during the beginning of the Russia-Ukraine war. Nevertheless, when we focus on the bank crisis on the commovement with stock markets, we document that only the association between FTSE and JTOPI indices and crude oil tend to be lightly and significantly affected at 16–32 days scale.
Overall, the connectedness between CO2 emissions, commodities, Bitcoin, VIX and stock markets seems to be non-trivial and heterogeneous. The pairwise connectedness framework reveals some asymmetric patterns and outlines the existence of discrepancy among asset classes. Strikingly, the connectedness analysis might suggest different levels of interdependence among asset classes, indicating different hedging strategies. The empirical findings of wavelet coherence method might suggest that some emerging and developed stock and commodity markets are highly dependent upon each other in the frequency-time domain. This reveals that such two different assets should not be employed for risk diversification and hedging. The magnitude and direction and of dependence seem to change according to variables. The empirical results can afterwards contribute to maximize the benefits of portfolio diversification. Apprehending how shocks due to the outbreak of unexpected events can spread from market to another might help to diminish contagion risk during episodes of turbulent turmoil. In this context, the study findings can invite investors and portfolio managers to better rethink the short- and long-run adoption of risk hedging techniques. Our results might suggest that the interdependence structure among markets the specific features of emerging markets compared to developed ones. In this regard, emerging markets mainly pose salient challenges with respect to the lack of institutional development and market microstructure distortions (Bellalah et al. 2003). In particular, many studies suggest that emerging markets are differentiated from developed ones in terms of market microstructure and institutional landscape (e.g., market regulations, capital controls).
Figure A6, Figure A7, Figure A8, Figure A9, Figure A10, Figure A11 and Figure A12 offer a compelling visual comparison of how different events differentially affect asset connectedness across frequencies and the strength of such comovement. This observed variability across asset classes and frequencies underscores the need for flexible and dynamic policy responses to distinct types of crises. A ‘one-size-fits-all’ approach is unlikely to be effective in these circumstances.

5. Discussion

A substantial body of prior research has explored cross-market linkages and investigated the effectiveness of various asset classes during periods of extreme market conditions and heightened uncertainty. Analyzing such comovements using a range of econometric models can provide valuable insights into hedging market risk and constructing more resilient portfolios that can withstand stress. In this study, we examine the connectedness between CO2 emissions, commodities, VIX, and stock markets in different regions (G7, BRICS, and Gulf) over the period 2 January 2019 to 6 June 2022. We delve into the comovements in both the frequency and time domains, enabling us to assess the level of pairwise connectedness across various frequency horizons (Adekoya et al. 2021). Additionally, we investigate the cross-market linkages during the onset of the COVID-19 pandemic and the Russia-Ukraine war to evaluate the cross-market information content. To achieve this, we implement two econometric models related to connectedness and coherence analysis on different time series. More specifically, we employ the wavelet coherence method to gain a deeper understanding of the diverse pairwise connectedness frameworks.
Our key findings can be summarized as follows. The connectedness between different asset classes exhibits a complex and heterogeneous nature. Time-domain analysis reveals substantial interrelationships with varying levels and patterns across distinct markets and regions. Frequency-domain analysis further complements our understanding of pairwise connectedness by highlighting the heterogeneity and dissimilarity among different frequency bands. Some commodities exhibit heightened dynamic connections at shorter frequency scales, while others demonstrate stronger linkages at longer frequency bands. Additionally, investigating interdependence structures may suggest the existence of lead-lag relationships among asset classes. Furthermore, the pairwise relationship between CO2 emissions and stock markets is well-documented. This association, along with cross-market linkages, appears to be highly sensitive to unexpected events. A notable increase in the dynamic commodity-equity correlation can be observed during the COVID-19 pandemic. Such findings confirm those of Badshah et al. (2019), Naeem et al. (2020) and Jiang and Chen (2022b) which support that the connectedness heightens when adverse shocks related to worsened economic conditions suddenly occur. In this respect, Adekoya and Oliyide (2022) report that the outbreak of the COVID-19 pandemic has increased fear in stock and commodity markets.
Jiang and Chen (2022a) explain such finding by the rise of the Omicron variant in the second half of 2021 and its wide spreading. The dynamic equity-commodity correlation structure changes significantly with the advent of the Russia-Ukraine war for some stock markets. The time-varying correlations of all markets alternate between positive and negative values. Nevertheless, the empirical findings suggest negative dependence between VIX and stock markets. All these findings corroborate the existence of different magnitude of interdependence among asset classes. The emergence of adverse events has increasingly revived not only the impact of uncertainty and fear on cross-market linkages but also how persistent the shock impact and the causal effect of fear from market to another. In this respect, our findings might complement the current literature on cross-market linkages. For instance, Mensi et al. (2022) display negative (resp. moderate positive) association between S&P500 returns and gold (resp. Brent oil) before and during (resp. during) the COVID-19 pandemic, revealing that gold (resp. oil) can be considered as safe-haven (resp. diversifier) asset against S&P500 index. Junttila et al. (2018) display the existence of time-varying correlations with stock market returns but change substantially with the crude oil and gold futures. During periods of stock-market-offs, S&P500 returns and crude oil futures (resp. gold futures) seem to be positively (resp. negatively) linked. Marimoutou and Soury (2015) show the connectedness between CO2 emission spot prices and commodity prices (e.g., Brent crude oil, natural gas and coal). In light of the foregoing discussion, the development of a comprehensive theory that addresses the optimal level of connectedness between commodities and other assets, while incorporating behavioral factors, is increasingly crucial.
Additional intriguing empirical findings emerge from the connectedness analysis following the collapse of Silicon Valley Bank. Firstly, gold exhibits a negative correlation and leads the UK market in the short term. However, it moves in the same direction as the NASDAQ with a lag phase at a medium horizon. Another noteworthy observation is that Bitcoin tends to reclaim its role as a safe-haven asset during bank crises. On the other hand, increased market uncertainty is evident during health, geopolitical, and bank crises for several stock markets in the G7 region (S&P500, CAC40, FTSE, DAX40, FTSEMIB, NASDAQ, NIKKEI, and SP/TSX).
Financial markets play a pivotal role in facilitating the flow of investment and savings within an economy, thereby enabling efficient production of goods and services and capital accumulation. Furthermore, well-functioning and developed financial markets have a growing influence on the effectiveness of monetary policy transmission to the real economy. This underscores the profound and broad implications of time-varying relationships between financial markets and other markets for global investment and savings flows, as well as for macroeconomic developments. Such findings highlight the importance of understanding the characteristics of a sound financial system and developing measures to enhance its stability. They also urge us to consider how financial risks can impact macroeconomic performance. From a portfolio perspective, the heterogeneous connectedness highlights the importance of for investors and portfolio managers to take into account the complex relationships between different asset classes. The varying lead-lag relationships revealed by the analysis can inform dynamic hedging strategies, adjusting positions based on specific asset pairs and frequencies during different crisis phases.

6. Conclusions

Overall, it is crucial for asset managers, regulators, and investors to assess and determine the susceptibility of stock markets to unexpected and unprecedented shocks. This study aims to investigate the dynamic connectedness between various markets during exogenous shocks related to political, banking, and health crises. This provides valuable information and supplementary evidence on market comovements during the health crisis, the Russia-Ukraine war, and the failure of Silicon Valley Bank. From a methodological perspective, applying the wavelet coherence method to asset returns is beneficial. Analyzing wavelet correlation in a dynamic manner has practical applications for investors and potential diversification opportunities for their portfolios.
Our study examines the dynamic connections between various commodities and stock prices in Gulf, G7, and BRICS countries. We aim to understand the (dis)similarities in information transmission within and between these regions. Additionally, we explore the interdependence structure among CO2 emissions, market uncertainty, and the events of the COVID-19 pandemic and the Russia-Ukraine war.
Our empirical findings confirm the existence of time-varying linkages between the markets, with these connections appearing stronger during the COVID-19 pandemic. However, some of these associations seem to weaken following the onset of the Russia-Ukraine war.
Furthermore, our results demonstrate a significant negative link between investor risk perceptions, as measured by the VIX index, and stock markets across different regions. These findings offer valuable insights for investors and policymakers regarding the interconnectedness of various markets during times of crisis.
Our findings overwhelmingly demonstrate the existence of time-varying comovement among markets, which intensified throughout the COVID-19 pandemic. However, it weakened for some linkages with the outbreak of the Russia-Ukraine war. Additionally, we show that investor risk perceptions, as measured by VIX, are significantly and negatively correlated with stock markets in different regions. Furthermore, phase analysis indicates that arrows point in different directions depending on the market and period under consideration. This suggests that the relationship between different assets is not homogenous across frequency and time scales. Based on these results, we support the use of the wavelet method to study comovement between assets during both calm and turbulent periods, given its ability to decompose two time series into frequency-time scale domains.
Our findings have significant implications for various stakeholders, including investors, asset managers, and policymakers. The empirical results derived from the wavelet coherence method can inform policymakers about the information connectedness through return series analysis. This knowledge can lead to the establishment of a unified framework for information network connections across equity and commodity markets, promoting market stability and enabling the development of more sustainable fiscal and monetary policies. Policymakers should also be vigilant against the adverse consequences of future crises and formulate timely and efficient precautionary measures. For investors and asset managers, our findings have implications for long- and short-term risk hedging strategies. By understanding the extent of shocks and how they propagate through markets, investors can develop strategies to mitigate contagion risk during financial turmoil and market uncertainty. The portfolio risk implications highlight the usefulness and impact of including different commodities in equity portfolios. Investors should be particularly cautious during periods of market stress, as connectedness intensifies during crises compared to normal times. These findings are valuable for short- and long-term investors making decisions to avoid or mitigate losses, and for financial market authorities concerned about the contagion effects of different crises.
International investors must carefully consider the significant heterogeneity present in each region. While economies within each region may share some common factors, they exhibit varying degrees of exposure to commodities, which could lead to different portfolio strategies. Additionally, policymakers should be aware that policy actions, structural reforms, and market regulations need to be tailored more effectively to manage the specific interdependencies between financial and commodity markets within each region, ultimately seeking to achieve economic stability.
The emergence of diverse and unexpected adverse events underscores the crucial need to consider more suitable reforms that can create more resilient financial and economic systems. Future research could productively focus on quantifying the impact of different events on interconnectedness, providing valuable insights for policymakers and investors.
Overall, our study has some limitations related to the methodology, which does not account for modeling the directional volatility spillover effect. This methodology could provide a deeper understanding of the dependence structure and spillover effects that occurred during the COVID-19 pandemic. Future studies could analyze the connectedness between commodities, gold-backed cryptocurrencies, and other green financial assets such as green bonds, while employing alternative measures of market sentiment indices such as OVX and OIV and a fake news index related to the COVID-19 pandemic. While each adverse event possesses unique characteristics and impacts financial markets differently, blindly generalizing empirical results from one scenario to predict future events can be misleading. Notably, market sentiment and investor psychology, which demonstrably influence market dynamics and reactions, are subject to change, further complicating such generalizations. Therefore, acknowledging the inherent uniqueness of each event while recognizing the evolving role of investor sentiment is crucial for accurate future findings.

Author Contributions

Conceptualization, W.F., A.B., A.F.B. and A.J.; methodology, W.F., A.B., A.F.B. and A.J.; software, W.F., A.B. and A.J.; validation, W.F., A.B. and A.J.; formal analysis, W.F., A.B. and A.J.; data curation, W.F., A.B. and A.J.; writing—original draft preparation, W.F., A.B., A.F.B. and A.J.; writing—review and editing, W.F., A.B., A.F.B. and A.J.; visualization, W.F., A.B. and A.J.; supervision, A.F.B. and A.J. All authors have read and agreed to the published version of the manuscript.

Funding

This research received no external funding.

Data Availability Statement

Data will be provided upon request to the corresponding author.

Conflicts of Interest

The authors declare no conflict of interest.

Appendix A

Figure A1. Wavelet coherence plots between CO2 futures and stock market indices.
Risks 12 00047 g0a1
Figure A2. Wavelet coherence plots between natural gas futures and stock market indices.
Risks 12 00047 g0a2
Figure A3. Wavelet coherence plots between gold and stock market indices.
Risks 12 00047 g0a3
Figure A4. Wavelet coherence plots between wheat futures and stock market indices.
Risks 12 00047 g0a4
Figure A5. Wavelet coherence plots between crude oil and stock market indices.
Risks 12 00047 g0a5
Figure A6. Connectedness at low and high frequencies between BTC futures and stock market indices.
Risks 12 00047 g0a6
Figure A7. Connectedness at low and high frequencies between CO2 futures and stock market indices.
Risks 12 00047 g0a7
Figure A8. Connectedness at low and high frequencies between natural gas futures and stock market indices.
Risks 12 00047 g0a8
Figure A9. Connectedness at low and high frequencies between gold and stock market indices.
Risks 12 00047 g0a9
Figure A10. Connectedness at low and high frequencies between VIX and stock market indices.
Risks 12 00047 g0a10
Figure A11. Connectedness at low and high frequencies between wheat futures and stock market indices.
Risks 12 00047 g0a11
Figure A12. Connectedness at low and high frequencies between crude oil and stock market indices.
Risks 12 00047 g0a12

Note

1
In our paper, we omit the tests for serial correlation and heteroskedasticity of the residuals because we do not estimate an econometric model. Instead, we employ the wavelet method to analyze the linkages between assets during crisis and calm periods. From an econometric standpoint, diagnosing residuals is necessary only after model estimation, which is not applicable in our case.

References

  1. Adekoya, Oluwasegun B., and Johnson A. Oliyide. 2022. Commodity and financial markets’ fear before and during COVID-19 pandemic: Persistence and causality analyses. Resources Policy 76: 102598. [Google Scholar] [CrossRef]
  2. Adekoya, Oluwasegun B., Johnson A. Oliyide, and Ambreen Noman. 2021. The volatility connectedness of the eu carbon market with commodity and financial markets in time- and frequency-domain: The role of the U.S. economic policy uncertainty. Resources Policy 74: 102252. [Google Scholar] [CrossRef]
  3. Astrov, Vasily, Mahdi Ghodsi, Richard Grieveson, Mario Holzner, Artem Kochnev, Michael Landesmann, Olga Pindyuk, Robert Stehrer, Maryna Tverdostup, and Alexandra Bykova. 2022. Russia’s invasion of Ukraine: Assessment of the humanitarian, economic, and financial impact in the short and medium term. International Economics and Economic Policy 19: 331–81. [Google Scholar] [CrossRef]
  4. Badshah, Ihsan, Riza Demirer, and Muhammad Tahir Suleman. 2019. The effect of economic policy uncertainty on stock-commodity correlations and its implications on optimal hedging. Energy Economics 84: 104553. [Google Scholar] [CrossRef]
  5. Baker, Scott R., Nicholas Bloom, Steven J. Davis, and Stephen J. Terry. 2020. COVID-Induced Economic Uncertainty. NBER Working Papers 26983. Cambridge, MA: National Bureau of Economic Research, Inc. [Google Scholar]
  6. Batten, Jonathan A., and Xuan Vinh Vo. 2015. Foreign ownership in emerging stock markets. Journal of Multinational Financial Management 32: 15–24. [Google Scholar] [CrossRef]
  7. Bejaoui, Azza, Wajdi Frikha, Ahmed Jeribi, and Aurelio F. Bariviera. 2023. Connectedness between emerging stock markets, gold, cryptocurrencies, defi and nft: Some new evidence from wavelet analysis. Physica A: Statistical Mechanics and Its Applications 619: 128720. [Google Scholar] [CrossRef]
  8. Bekaert, Geert, and Marie Hoerova. 2014. The vix, the variance premium and stock market volatility. Journal of Econometrics 183: 181–92. [Google Scholar] [CrossRef]
  9. Bellalah, Mondher, Chaker Aloui, and Ezzeddine Abaoub. 2003. Long-Range Dependence in Daily Volatility on Tunisian Stock Market. Working Papers 0340. Cairo: Economic Research Forum. [Google Scholar]
  10. Bodart, Vincent, and Bertrand Candelon. 2009. Evidence of interdependence and contagion using a frequency domain framework. Emerging Markets Review 10: 140–50. [Google Scholar] [CrossRef]
  11. Bossman, Ahmed, Mariya Gubareva, and Tamara Teplova. 2023. Hedge and safe-haven attributes of faith-based stocks vis-à-vis cryptocurrency environmental attention: A multi-scale quantile regression analysis. Applied Economics 2023: 1–24. [Google Scholar] [CrossRef]
  12. Bouri, Elie, Mahamitra Das, Rangan Gupta, and David Roubaud. 2018. Spillovers between bitcoin and other assets during bear and bull markets. Applied Economics 50: 5935–49. [Google Scholar] [CrossRef]
  13. Bredin, Don, Thomas Conlon, and Valerio Potì. 2015. Does gold glitter in the long-run? Gold as a hedge and safe haven across time and investment horizon. International Review of Financial Analysis 41: 320–28. [Google Scholar] [CrossRef]
  14. Cai, Yu Xin, Yun Lu Gong, and Guo Yang Sheng. 2021. The gold price and the economic policy uncertainty dynamics relationship: The continuous wavelet analysis. Economic Computation and Economic Cybernetics Studies and Research 55: 105–16. [Google Scholar] [CrossRef]
  15. Chang, Chia-Lin, Jukka Ilomäki, Hannu Laurila, and Michael McAleer. 2020. Causality between CO2 Emissions and Stock Markets. Energies 13: 2893. [Google Scholar] [CrossRef]
  16. Ciner, Cetin, Brian Lucey, and Larisa Yarovaya. 2018. Spillovers, integration and causality in lme non-ferrous metal markets. Journal of Commodity Markets 17: 100079. [Google Scholar] [CrossRef]
  17. Cong, Ren, and Alex Y. Lo. 2017. Emission trading and carbon market performance in Shenzhen, China. Applied Energy 193: 414–25. [Google Scholar] [CrossRef]
  18. Corbet, Shaen, Charles Larkin, and Brian Lucey. 2020. The contagion effects of the COVID-19 pandemic: Evidence from gold and cryptocurrencies. Finance Research Letters 35: 101554. [Google Scholar] [CrossRef]
  19. Creti, Anna, Marc Joëts, and Valérie Mignon. 2013. On the links between stock and commodity markets’ volatility. Energy Economics 37: 16–28. [Google Scholar] [CrossRef]
  20. Crowley, Patrick M. 2007. A guide to wavelets for economists. Journal of Economic Surveys 21: 207–67. [Google Scholar] [CrossRef]
  21. Deng, Jing, Jingxuan Lu, Yujie Zheng, Xiaoyun Xing, Cheng Liu, and Tao Qin. 2022. The Impact of the COVID-19 Pandemic on the Connectedness between Green Industries and Financial Markets in China: Evidence from Time-Frequency Domain with Portfolio Implications. Sustainability 14: 13178. [Google Scholar] [CrossRef]
  22. Dutta, Anupam, Elie Bouri, and Md Hasib Noor. 2018. Return and volatility linkages between CO2 emission and clean energy stock prices. Energy 164: 803–10. [Google Scholar] [CrossRef]
  23. Dwyer, Gerald P. 2015. The economics of bitcoin and similar private digital currencies. Journal of Financial Stability 17: 81–91. [Google Scholar] [CrossRef]
  24. El Hedi Arouri, Mohamed, Amine Lahiani, and Duc Khuong Nguyen. 2015. World gold prices and stock returns in china: Insights for hedging and diversification strategies. Economic Modelling 44: 273–82. [Google Scholar] [CrossRef]
  25. Fakhfekh, Mohamed, Ahmed Jeribi, Ahmed Ghorbel, and Nejib Hachicha. 2021. Hedging stock market prices with WTI, Gold, VIX and cryptocurrencies: A comparison between DCC, ADCC and GO-GARCH models. International Journal of Emerging Markets 18: 978–1006. [Google Scholar] [CrossRef]
  26. Fang, Yi, and Zhiquan Shao. 2022. The russia-ukraine conflict and volatility risk of commodity markets. Finance Research Letters 50: 103264. [Google Scholar] [CrossRef]
  27. Fareed, Zeeshan, Najaf Iqbal, Farrukh Shahzad, Syed Shah, Bushra Zulfiqar, Khurram Shahzad, Shujahat Hashmi, and Umer Shahzad. 2020. Co-variance nexus between COVID-19 mortality, humidity, and air quality index in Wuhan, China: New insights from partial and multiple wavelet coherence. Air Quality, Atmosphere & Health 13: 673–82. [Google Scholar] [CrossRef]
  28. Ghorbel, Achraf, and Ahmed Jeribi. 2021. Investigating the relationship between volatilities of cryptocurrencies and other financial assets. Decisions in Economics and Finance 44: 817–43. [Google Scholar] [CrossRef]
  29. Grinsted, Aslak, John C. Moore, and Svetlana Jevrejeva. 2004. Application of the cross wavelet transform and wavelet coherence to geophysical time series. Nonlinear Processes in Geophysics 11: 561–66. [Google Scholar] [CrossRef]
  30. Huang, Xiaohong, and Shupei Huang. 2020. Identifying the comovement of price between china’s and international crude oil futures: A time-frequency perspective. International Review of Financial Analysis 72: 101562. [Google Scholar] [CrossRef]
  31. Jain, Anshul, and Pratap Chandra Biswal. 2016. Dynamic linkages among oil price, gold price, exchange rate, and stock market in india. Resources Policy 49: 179–85. [Google Scholar] [CrossRef]
  32. Jeribi, Ahmed, and Achraf Ghorbel. 2022. Forecasting developed and brics stock markets with cryptocurrencies and gold: Generalized orthogonal generalized autoregressive conditional heteroskedasticity and generalized autoregressive score analysis. International Journal of Emerging Markets 17: 2290–320. [Google Scholar] [CrossRef]
  33. Jiang, Wei, and Yunfei Chen. 2022a. The time-frequency connectedness among carbon, traditional/new energy and material markets of china in pre- and post-COVID-19 outbreak periods. Energy 246: 123320. [Google Scholar] [CrossRef]
  34. Jiang, Wei, and Yunfei Chen. 2022b. The time-frequency connectedness among metal, energy and carbon markets pre and during COVID-19 outbreak. Resources Policy 77: 102763. [Google Scholar] [CrossRef] [PubMed]
  35. Jiménez-Rodríguez, Rebeca. 2019. What happens to the relationship between eu allowances prices and stock market indices in europe? Energy Economics 81: 13–24. [Google Scholar] [CrossRef]
  36. Junttila, Juha, Juho Pesonen, and Juhani Raatikainen. 2018. Commodity market based hedging against stock market risk in times of financial crisis: The case of crude oil and gold. Journal of International Financial Markets, Institutions and Money 56: 255–80. [Google Scholar] [CrossRef]
  37. Kang, Sang Hoon, and Jang Woo Lee. 2019. The network connectedness of volatility spillovers across global futures markets. Physica A: Statistical Mechanics and Its Applications 526: 120756. [Google Scholar] [CrossRef]
  38. Khalfaoui, Rabeh, Mohamed Boutahar, and Heni Boubaker. 2015. Analyzing volatility spillovers and hedging between oil and stock markets: Evidence from wavelet analysis. Energy Economics 49: 540–49. [Google Scholar] [CrossRef]
  39. Krueger, Philipp, Zacharias Sautner, and Laura T Starks. 2020. The Importance of Climate Risks for Institutional Investors. The Review of Financial Studies 33: 1067–111. [Google Scholar] [CrossRef]
  40. Li, Xin, and Chong Alex Wang. 2017. The technology and economic determinants of cryptocurrency exchange rates: The case of bitcoin. Decision Support Systems 95: 49–60. [Google Scholar] [CrossRef]
  41. Liadze, Iana, Corrado Macchiarelli, Paul Mortimer-Lee, and Patricia Sanchez Juanino. 2023. Economic costs of the Russia-Ukraine war. The World Economy 46: 874–86. [Google Scholar] [CrossRef]
  42. Lin, Boqiang, and Nan Wu. 2022. Will the China’s carbon emissions market increase the risk-taking of its enterprises? International Review of Economics & Finance 77: 413–34. [Google Scholar] [CrossRef]
  43. Lo, Gaye-Del, Isaac Marcelin, Théophile Bassène, and Babacar Sène. 2022. The russo-ukrainian war and financial markets: The role of dependence on russian commodities. Finance Research Letters 50: 103194. [Google Scholar] [CrossRef]
  44. Loukil, Sahar, Mouna Aloui, Ahmed Jeribi, and Anis Jarboui. 2021. Are digital assets backstops for GCC stock markets in COVID-19-led financial crisis? International Journal of Electronic Finance 10: 232–59. [Google Scholar] [CrossRef]
  45. Magazzino, Cosimo, and Lorenzo Giolli. 2024. Analyzing the relationship between oil prices and renewable energy sources in italy during the first COVID-19 wave through quantile and wavelet analyses. Renewable Energy Focus 48: 100544. [Google Scholar] [CrossRef]
  46. Maghyereh, Aktham I., Hussein Abdoh, and Basel Awartani. 2019. Connectedness and hedging between gold and islamic securities: A new evidence from time-frequency domain approaches. Pacific-Basin Finance Journal 54: 13–28. [Google Scholar] [CrossRef]
  47. Marfatia, Hardik A. 2020. Investors’ risk perceptions in the us and global stock market integration. Research in International Business and Finance 52: 101169. [Google Scholar] [CrossRef]
  48. Marimoutou, Vêlayoudom, and Manel Soury. 2015. Energy markets and CO2 emissions: Analysis by stochastic copula autoregressive model. Energy 88: 417–29. [Google Scholar] [CrossRef]
  49. Mensi, Walid, Ferihane Zaraa Boubaker, Khamis Hamed Al-Yahyaee, and Sang Hoon Kang. 2018. Dynamic volatility spillovers and connectedness between global, regional, and gipsi stock markets. Finance Research Letters 25: 230–38. [Google Scholar] [CrossRef]
  50. Mensi, Walid, Xuan Vinh Vo, and Sang Hoon Kang. 2022. COVID-19 pandemic’s impact on intraday volatility spillover between oil, gold, and stock markets. Economic Analysis and Policy 74: 702–15. [Google Scholar] [CrossRef] [PubMed]
  51. Naeem, Muhammad Abubakr, Mudassar Hasan, Muhammad Arif, Faruk Balli, and Syed Jawad Hussain Shahzad. 2020. Time and frequency domain quantile coherence of emerging stock markets with gold and oil prices. Physica A: Statistical Mechanics and Its Applications 553: 124235. [Google Scholar] [CrossRef]
  52. Nguyen, Quang H., Binh P. Nguyen, Trung B. Nguyen, Trang T. T. Do, James F. Mbinta, and Colin R. Simpson. 2021. Stacking segment-based cnn with svm for recognition of atrial fibrillation from single-lead ecg recordings. Biomedical Signal Processing and Control 68: 102672. [Google Scholar] [CrossRef]
  53. Ramsey, James B., and Zhifeng Zhang. 1997. The analysis of foreign exchange data using waveform dictionaries. Journal of Empirical Finance 4: 341–72. [Google Scholar] [CrossRef]
  54. Rehman, Mobeen Ur, and Nicholas Apergis. 2019. Determining the predictive power between cryptocurrencies and real time commodity futures: Evidence from quantile causality tests. Resources Policy 61: 603–16. [Google Scholar] [CrossRef]
  55. Rua, António, and Luís C. Nunes. 2009. International comovement of stock market returns: A wavelet analysis. Journal of Empirical Finance 16: 632–39. [Google Scholar] [CrossRef]
  56. Sadorsky, Perry. 2014. Modeling volatility and correlations between emerging market stock prices and the prices of copper, oil and wheat. Energy Economics 43: 72–81. [Google Scholar] [CrossRef]
  57. Shahzad, Syed Jawad Hussain, Elie Bouri, David Roubaud, and Ladislav Kristoufek. 2020. Safe haven, hedge and diversification for g7 stock markets: Gold versus bitcoin. Economic Modelling 87: 212–24. [Google Scholar] [CrossRef]
  58. Singh, Jitendra, Wasim Ahmad, and Anil Mishra. 2018. Coherence, connectedness and dynamic hedging effectiveness between emerging markets equities and commodity index funds. Resources Policy 61: 441–60. [Google Scholar] [CrossRef]
  59. Szczygielski, Jan, Ailie Charteris, Princess Bwanya, and Janusz Brzeszczyński. 2021. The impact and role of COVID-19 uncertainty: A global industry analysis. International Review of Financial Analysis 80: 101837. [Google Scholar] [CrossRef] [PubMed]
  60. Umar, Muhammad, Yasir Riaz, and Imran Yousaf. 2022. Impact of russian-ukraine war on clean energy, conventional energy, and metal markets: Evidence from event study approach. Resources Policy 79: 102966. [Google Scholar] [CrossRef]
  61. Urquhart, Andrew, and Hanxiong Zhang. 2019. Is bitcoin a hedge or safe haven for currencies? An intraday analysis. International Review of Financial Analysis 63: 49–57. [Google Scholar] [CrossRef]
  62. Wen, Fenghua, Lili Zhao, Shaoyi He, and Guozheng Yang. 2020. Asymmetric relationship between carbon emission trading market and stock market: Evidences from china. Energy Economics 91: 104850. [Google Scholar] [CrossRef]
  63. Whaley, Robert. 2000. The investor fear gauge. Journal of Portfolio Management 26: 12–17. [Google Scholar] [CrossRef]
  64. Yadav, Miklesh Prasad, Amar Rao, Mohammad Zoynul Abedin, Sabia Tabassum, and Brian Lucey. 2023. The domino effect: Analyzing the impact of silicon valley bank’s fall on top equity indices around the world. Finance Research Letters 55: 103952. [Google Scholar] [CrossRef]
  65. Yoon, Seong-Min, Md Al Mamun, Gazi Salah Uddin, and Sang Hoon Kang. 2019. Network connectedness and net spillover between financial and commodity markets. The North American Journal of Economics and Finance 48: 801–18. [Google Scholar] [CrossRef]
  66. Zhu, Bangzhu, Xinxing Zhou, Xianfeng Liu, Haifang Wang, Kaijian He, and Ping Wang. 2020. Exploring the risk spillover effects among china’s pilot carbon markets: A regular vine copula-coes approach. Journal of Cleaner Production 242: 118455. [Google Scholar] [CrossRef]
Figure 1. Time series plots of the raw data.
Risks 12 00047 g001
Figure 2. Daily returns for different assets.
Risks 12 00047 g002
Figure 3. Wavelet coherence plots between bitcoin and stock market indices.
Risks 12 00047 g003
Figure 4. Wavelet coherence plots between Vix and stock market indices.
Risks 12 00047 g004
Table 1. Descriptive Statistics.
ADXBAXBSE30BTCBVSPCAC40Co2DAX40KuwIndxFTSEFTSEMIBGOLDJTOPIMSM30NASDAQNatgasNIKKEIQEASRTSISP500SPTSXSSETASIVIXWHEATWTI
Pre-COVID-19 Pandemic
Mean0.000130.000710.000520.002580.000930.00091−0.000220.000870.000920.000440.000980.000650.00033−0.000320.00125−0.001150.000530.000030.001440.001080.000680.000820.00027−0.002380.000410.00116
Median−0.000350.000360.000180.000060.001800.001420.000000.001370.000710.000720.000970.000740.00050−0.000090.00158−0.001500.00034−0.000380.001660.000910.000700.000500.00118−0.006380.000000.00157
Maximum0.036210.234280.051860.200790.027530.026880.076170.033140.021730.022270.033110.032440.021980.016210.043850.147350.025780.033880.028330.033760.014940.054500.024150.333870.055280.13694
Minimum−0.03373−0.23186−0.02027−0.15601−0.03811−0.03636−0.08375−0.03156−0.03476−0.03284−0.02912−0.02138−0.03078−0.01919−0.03669−0.13575−0.03053−0.04168−0.04032−0.03023−0.01882−0.04496−0.03615−0.19814−0.05716−0.08234
Std. Dev.0.007830.021010.008210.042570.010850.008330.025500.008720.006540.007330.009200.007440.008420.004520.010180.026410.007910.007850.009280.007610.004530.010610.008710.074010.016680.02090
Skewness0.372570.070571.355730.40146−0.57795−0.72633−0.12509−0.35808−0.58180−0.43672−0.408410.39103−0.393120.01907−0.470240.05179−0.08367−0.35659−0.39309−0.55715−0.438280.37156−0.469500.813320.032060.57962
Kurtosis7.20147118.806009.588447.199564.113745.577723.628365.038327.353175.246334.396904.624833.526975.192605.705098.821574.943577.507984.879166.476544.410456.624053.840375.209824.1279810.33779
Jarque–Bera194.97240143,610.10000543.54990195.7585027.5899593.749574.8982649.98248217.4223062.2036328.0401434.820389.5930551.4958587.83010363.0270040.75019223.0597044.43212142.7208029.53042146.5538017.0042680.6254813.66866590.96110
Probability0.000000.000000.000000.000000.000000.000000.086370.000000.000000.000000.000000.000000.008260.000000.000000.000000.000000.000000.000000.000000.000000.000000.000200.000000.001080.00000
Sum0.032170.183150.134330.662710.237630.23403−0.056310.223060.237330.113340.252930.166640.08390−0.082540.32182−0.294970.137240.006510.369900.277500.175080.210960.06940−0.612320.104620.29858
Sum Sq. Dev.0.015700.112990.017240.463840.030150.017770.166480.019470.010960.013750.021650.014180.018170.005230.026530.178570.016010.015780.022040.014820.005240.028830.019441.402110.071210.11181
During COVID-19 Pandemic
Mean0.001050.000360.000590.00297−0.000040.000230.002410.000190.00034−0.000010.000170.000410.000540.000030.000790.001350.000190.00047−0.000450.000480.000350.000240.000720.001460.000740.00074
Median0.001340.000660.001320.002860.001020.001060.002870.000760.000810.000650.001270.001110.001050.000120.002150.001590.000300.000580.001780.001330.001290.000720.00132−0.007570.000000.00258
Maximum0.080760.024200.067470.193670.130230.080560.124970.104140.041370.086670.085500.042970.079070.021570.095970.197980.077310.039960.088250.089680.112950.061300.068320.480210.053500.31963
Minimum−0.08406−0.06001−0.14102−0.49728−0.15994−0.13098−0.17369−0.13055−0.19188−0.11512−0.18541−0.05893−0.10450−0.05735−0.13003−0.12881−0.06274−0.09998−0.14169−0.12765−0.13176−0.07994−0.08685−0.26623−0.04269−0.60168
Std. Dev.0.013080.006330.015270.048560.021170.015600.028920.015730.011890.013850.017080.010340.014970.005640.018030.040400.013660.008790.021530.015990.014980.011060.011280.087590.017170.04959
Skewness−0.54164−2.51892−2.04826−1.95788−1.59476−1.36453−0.62315−1.03200−8.07087−1.23483−2.88955−0.76321−1.03922−2.26695−0.748780.265970.09881−2.83482−1.38388−1.01386−1.79608−0.50328−2.199761.278320.35121−3.12788
Kurtosis19.0963723.6421020.9711523.6762119.7091116.438217.2361116.87138128.3827016.6103833.214467.1448112.2140424.0254611.860945.293827.3324536.7266310.8092318.3161431.9286611.1018721.761447.772183.1593951.97299
Jarque–Bera6018.6690010,440.390007856.5680010,240.640006691.624004348.27200450.888904548.11400369,569.300004424.7750021,883.46000451.156002063.1770010,698.230001867.55200128.21880434.9615027,047.700001587.405005519.8400019,650.960001541.363008587.40900677.7969011.9970356,366.91000
Probability0.000000.000000.000000.000000.000000.000000.000000.000000.000000.000000.000000.000000.000000.000000.000000.000000.000000.000000.000000.000000.000000.000000.000000.000000.002480.00000
Sum0.583830.198800.327371.64717−0.023620.125981.337880.102950.18997−0.005880.095120.228890.296720.015870.436270.747600.105930.25895−0.251820.268410.195330.134480.400990.811410.412990.40856
Sum Sq. Dev.0.094840.022200.129111.306100.248360.134770.463180.137010.078250.106220.161540.059200.124170.017640.180010.904190.103310.042790.256700.141690.124230.067720.070474.250720.163391.36229
During War
Mean0.00020−0.000140.00014−0.00105−0.000230.00037−0.000180.00027−0.000290.000180.000220.000130.000190.00056−0.00013−0.002420.00027−0.00063−0.00055−0.00007−0.00001−0.00018−0.00040−0.00204−0.00093−0.00056
Median−0.00044−0.00010−0.00015−0.00096−0.000160.000770.001870.00117−0.000130.000970.001470.000190.000080.00039−0.001030.000870.00101−0.000900.00010−0.000760.000750.000010.00011−0.00972−0.002260.00174
Maximum0.034510.034230.033580.181200.053930.068830.158740.076232.396000.038450.067230.034020.053420.027620.072200.133510.038610.065310.232040.053950.032850.034240.025900.218190.197013.29177
Minimum−0.06013−0.02618−0.04837−0.28683−0.03408−0.05093−0.16984−0.04508−2.40532−0.03961−0.06439−0.02836−0.03882−0.02585−0.05702−0.18066−0.03054−0.07323−0.48292−0.04420−0.03147−0.05268−0.04544−0.14034−0.11297−3.30159
Std. Dev.0.009140.005710.009680.040530.013010.013260.031230.013730.196180.009830.014960.009740.013240.006140.018690.053130.011400.011740.038730.014030.009450.010240.010160.059740.029760.27073
Skewness−0.574540.31955−0.19344−1.225890.182370.12397−0.351020.25380−0.06693−0.57697−0.490870.122300.275590.41602−0.03613−0.409670.03450−0.06486−5.81767−0.11141−0.18330−0.81011−0.574260.942960.82485−0.04831
Kurtosis9.9910910.512245.4321013.418403.528286.108248.023966.38920150.007406.154485.891373.734434.024876.035213.577143.227033.6988410.5934385.659913.807983.869697.112584.775324.5819410.40134147.06300
Jarque–Bera629.53740712.8954076.062591436.700005.16864121.93820322.73460147.29340271,040.30000141.49850116.936707.5151316.98324124.223004.242979.065966.18485723.3659087,390.860008.8101811.17169245.0442056.0721875.99256721.16220260,291.70000
Probability0.000000.000000.000000.000000.075450.000000.000000.000000.000000.000000.000000.023340.000210.000000.119850.010750.045390.000000.000000.012220.003750.000000.000000.000000.000000.00000
Sum0.05865−0.040680.04147−0.31471−0.068240.11104−0.052880.08200−0.085690.053980.066720.038740.056510.16900−0.03838−0.727700.08259−0.19015−0.16672−0.02201−0.00246−0.05535−0.12099−0.61504−0.28048−0.16783
Sum Sq. Dev.0.025080.009770.028100.492750.050740.052710.292510.0565411.545350.028980.067110.028470.052580.011300.104840.846750.038970.041330.449970.059060.026780.031480.030971.070610.2656321.98894
Disclaimer/Publisher’s Note: The statements, opinions and data contained in all publications are solely those of the individual author(s) and contributor(s) and not of MDPI and/or the editor(s). MDPI and/or the editor(s) disclaim responsibility for any injury to people or property resulting from any ideas, methods, instructions or products referred to in the content.

