The literature provides a rich source of studies on the future evolution of various financial instruments and macroeconomic data. Most of the research focuses on the forecasting of financial markets (
Liu et al. 2021;
Ayala et al. 2021;
Bhandari et al. 2022;
Hanauer and Kalsbach 2023;
Vancsura and Bareith 2023;
Md et al. 2023;
Vancsura et al. 2023). Among the publications dealing with macro data, the topic of inflation is quite popular (
Ülke et al. 2018;
Medeiros et al. 2021;
Joseph et al. 2021;
Aras and Lisboa 2022;
Araujo and Gaglianone 2023). It is a restricted group of studies where researchers analyse inflation data and stock markets combined.
Constantinos et al. (
2012) examined the hypothesized relationship between inflation and stock returns for Greece. They argue that previous empirical research did not take into account asymmetric dynamic effects. Their research suggests that monetary policy reacts to inflation and that monetary policy actions affect stock prices; however, monetary intervention has different effects on inflation and stock prices. Economic agents use shares as a hedge against inflation. Their purchases raise the price of shares. When inflation falls, portfolio adjustments lead to sales. This causes stock prices to fall. Their empirical results show that there is a positive relationship between inflation and stock prices. Nevertheless, monetary intervention has less effect on the change in stock prices than on the change of the inflation rate.
Nwude (
2013) analysed how the share prices of the chemical and paint industries listed on the Nigerian Stock Exchange have evolved between 2000 and 2011. The objective of the study was to determine whether the shares provided a hedge against inflation during the given period. The author conducted a regression analysis between real stock prices and inflation. This was used to filter out stocks that provided a real hedge against inflation and a positive real return. As a result of the analysis, the author concluded that equities did not provide a significant hedge against inflation.
Chaves and Silva (
2019) examined the relationship between stock returns and expected inflation in the Brazilian stock market. The study covered the period 2003–2016. They found a negative correlation between stock returns and inflation. This suggests that it makes sense to actively manage investments. They recommend that if expected inflation rises, it is worth selling equities and investing in fixed-income, short-term assets. When the magnitude of inflation expectations falls, the portfolio should be held back in equities.
Marjohan et al. (
2023) investigated the factors affecting stock returns in the Indonesian banking sector. Their quantitative analysis showed that investment risk did not significantly affect the returns of the stocks studied. In contrast, market liquidity had a significant impact on the assessed stock returns. They also found that the magnitude of inflation influences the relationship between the above factors and stock returns. Higher inflation may strengthen the relationship between investment risk and stock returns. The same amplifying effect was found between liquidity and returns when inflation increases. The aim of the study by
Eldomiaty et al. (
2020) was to assess the relationship between inflation rates, interest rates, and stock prices of non-financial companies included in the DJIA30 and NASDAQ100 indices. The period under study was from 1999 to 2016. For the analysis, the authors used standard statistical tools, such as Johansen’s co-integration test, linearity and normality tests, and co-integration regression calculation. According to their results, both the change in inflation rate and the change in real interest rates have a significant effect on the evolution of stock prices. A negative relationship between the change in inflation rate and the evolution of stock prices was found according to the authors’ results. The starting point of the study by
Neville et al. (
2021) was that there has been no significant inflation in developed countries over the past three decades. In their study, they examined the exchange rate developments of different asset classes in the UK, the US, and Japan over a period of about 100 years. Their analyses showed that active strategies could also provide a hedge against rising inflation in equity investments. Stock prices fell in the face of soaring inflation, but profitable strategies could be developed with active portfolio management. Active portfolio management proved more effective than passive investment strategies.
Karimi et al. (
2015) evaluated the relationship between stock returns and inflation rates using a study of 546 companies on the Tehran Stock Exchange. They studied the period between 2007 and 2013. At a 95% confidence level, they showed that there was a significant positive relationship between stock returns and the inflation rate of the companies included in the study. They pointed out in their conclusions that quantifying the relationship using a price index rather than the consumer price index yields different results.
Bouri et al. (
2023) evaluated the relationship between expected inflation and stock returns in the US stock market using time series from January 2003 to December 2022. Their method of analysis was multiple correlation calculation. The time series data covered the period of the 2008 global financial crisis, the COVID-19 pandemic and the beginning of the Russian–Ukrainian war. Their results were heterogeneous, which may be due to the intervention of monetary policy in the deflationary period following the global financial crisis. In the period of rising inflation following the COVID-19 pandemic, the correlations took increasingly positive values.
Yeoh (
2023) investigated the relationship between the diversified portfolio represented by the Malaysian Stock Exchange index and the inflation rate over a 20 year time series, using data from 2002 to 2021. The research method used was correlation and regression calculation. The calculations showed a weak positive correlation between the factors. However, it showed that the average annual increase in the value of the portfolio represented by the stock market index exceeded the increase in the consumer price index. They concluded that investing in a stock portfolio could provide a hedge against inflation.
Giofré (
2012) analysed whether, after the establishment of the monetary union, portfolio convergence in the member countries of the monetary union was faster relative to each other than relative to non-euro area member countries. The study covered the period 1997–2004. The faster convergence could have been based on convergence of inflation rates as a result of the common monetary policy and exposure to the common currency. In addition, investment barriers have also disappeared. The result of the study was that the convergence of investment portfolios in the Member States belonging to the monetary union was faster. This was despite the fact that the convergence of inflation rate fluctuations was not significant. The convergence in portfolio composition cannot, therefore, be seen as a similarity in hedging strategies against inflation.
Ni et al. (
2023) tested a neural network method for portfolio optimization. The optimal dynamic allocation was studied for a high inflation period. The objective was to outperform a benchmark portfolio. The optimal asset allocation was achieved using a novel neural network model. The performance of their model was measured using historical data from a high inflation environment. Their results showed that their neural network method has a 90% probability of outperforming the benchmark portfolio constructed using the alternative method used in the test.
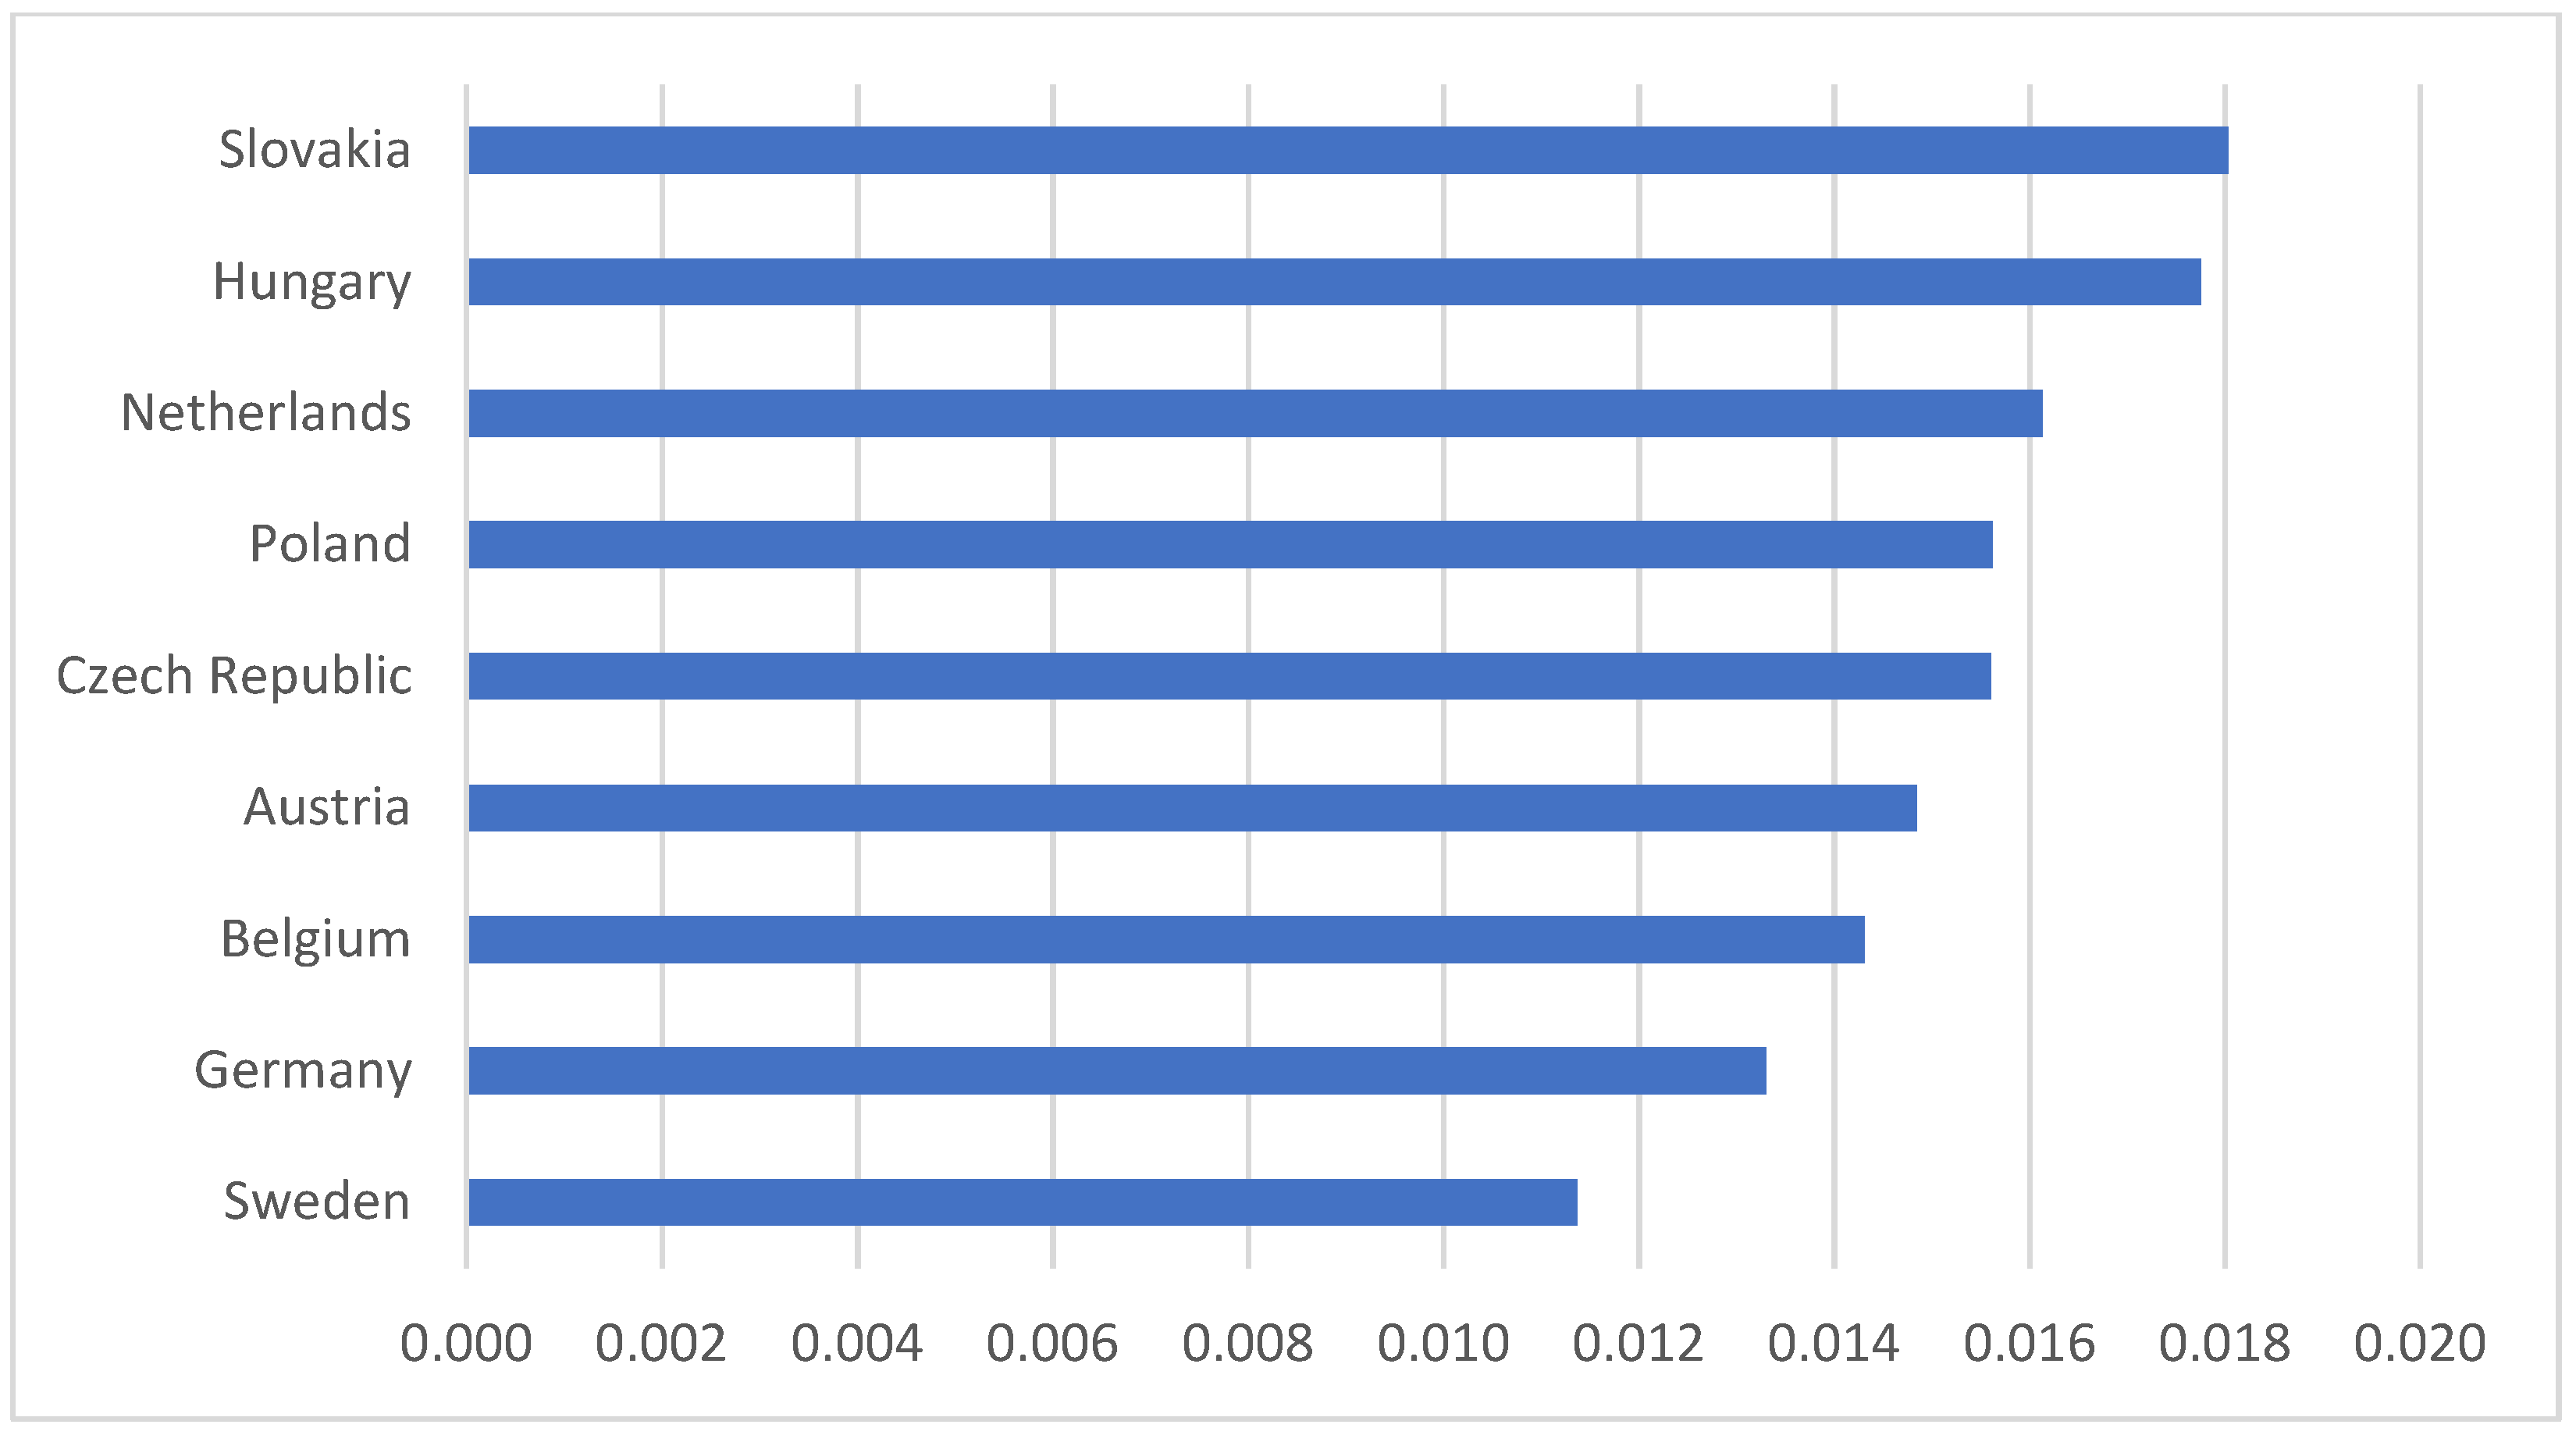
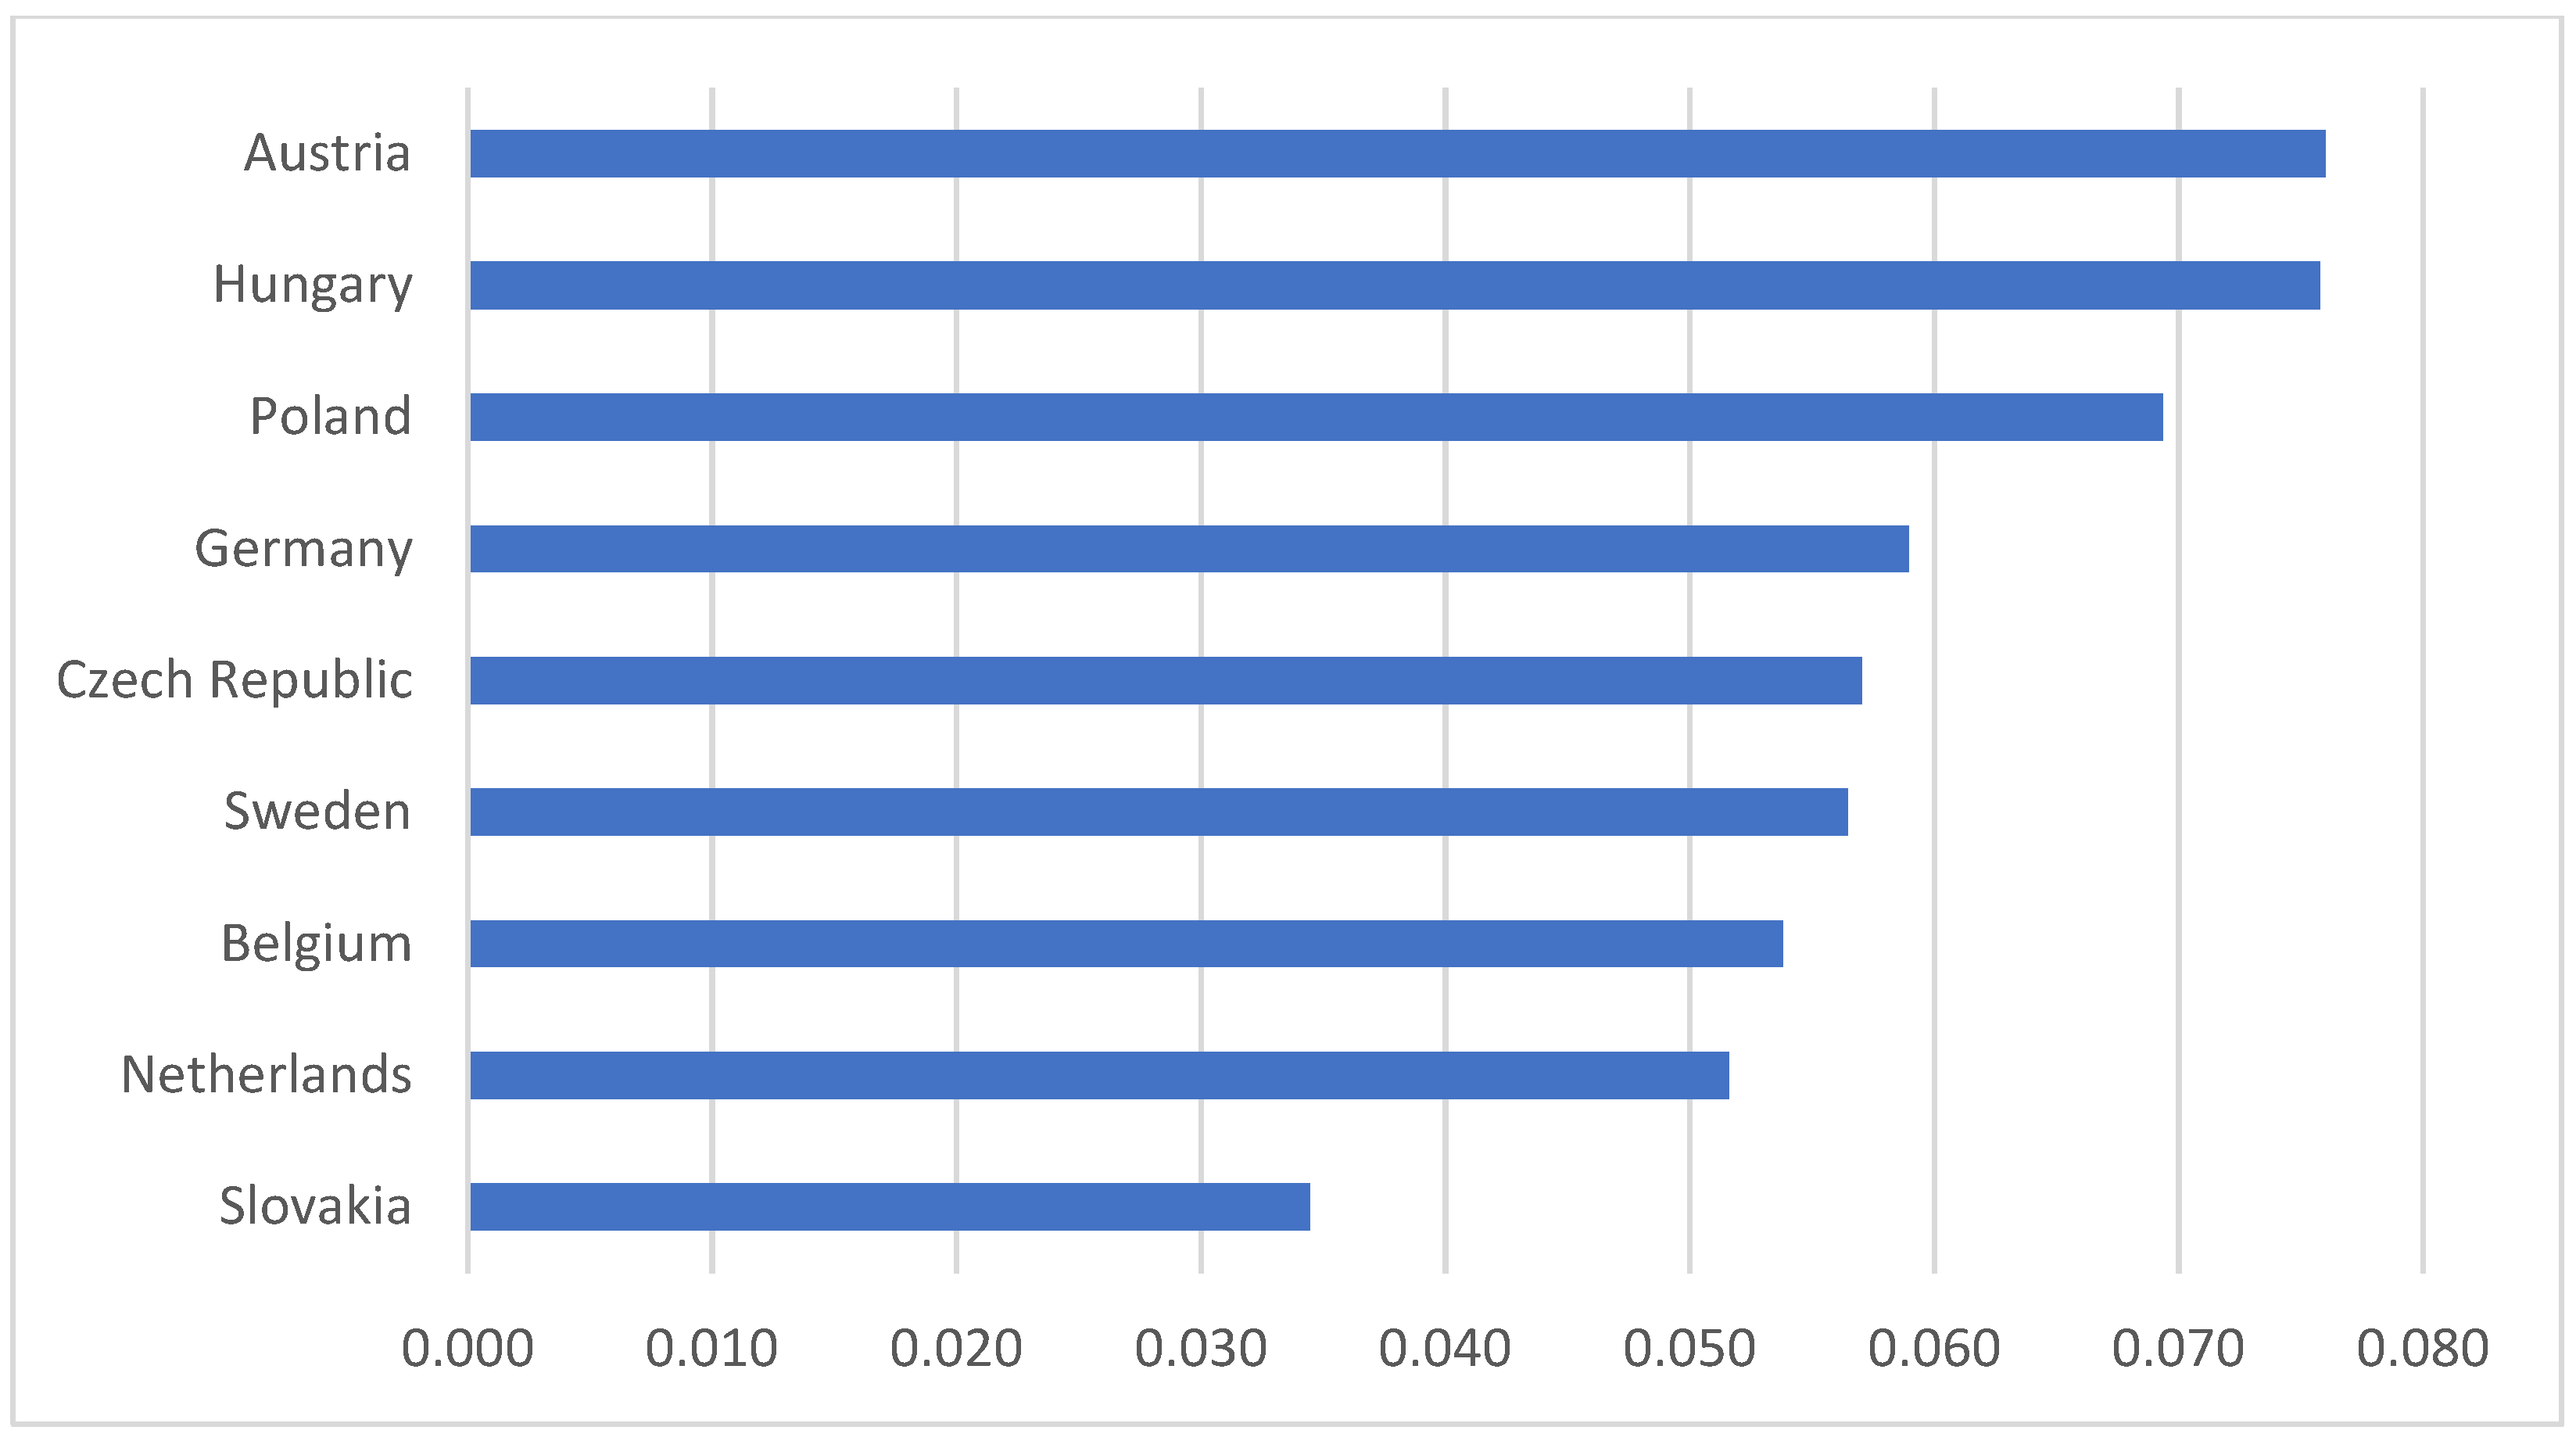
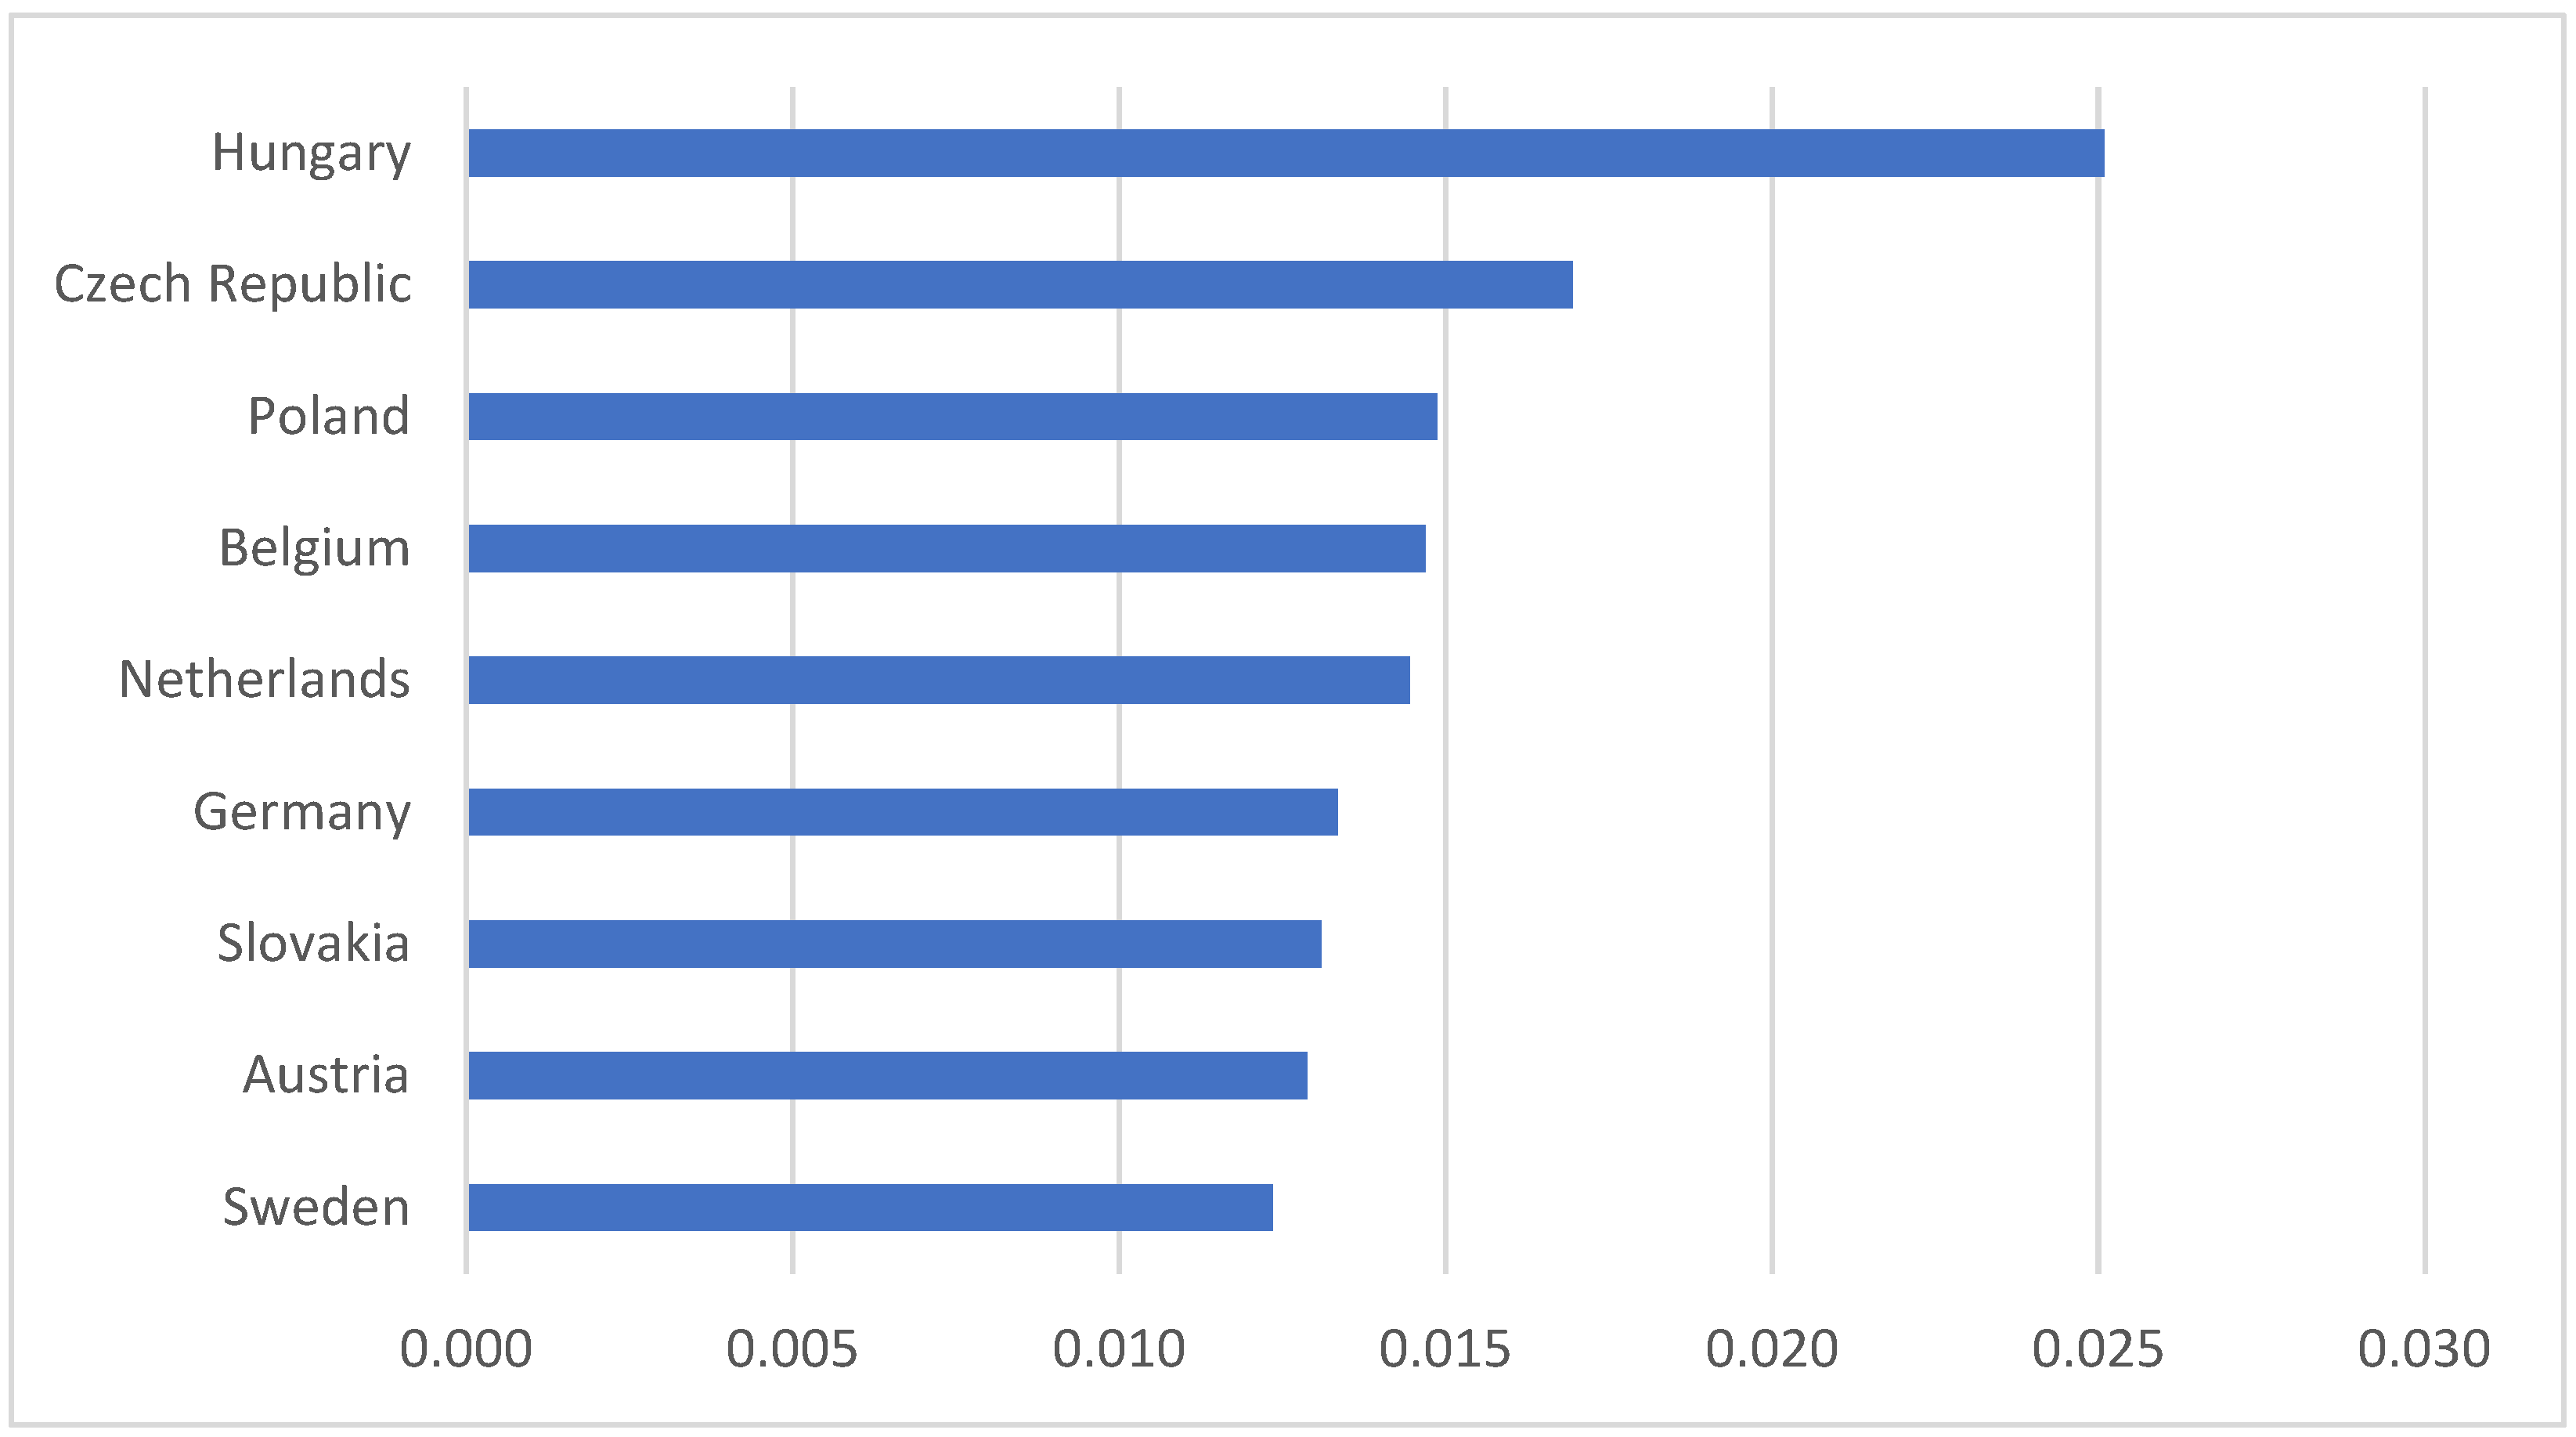
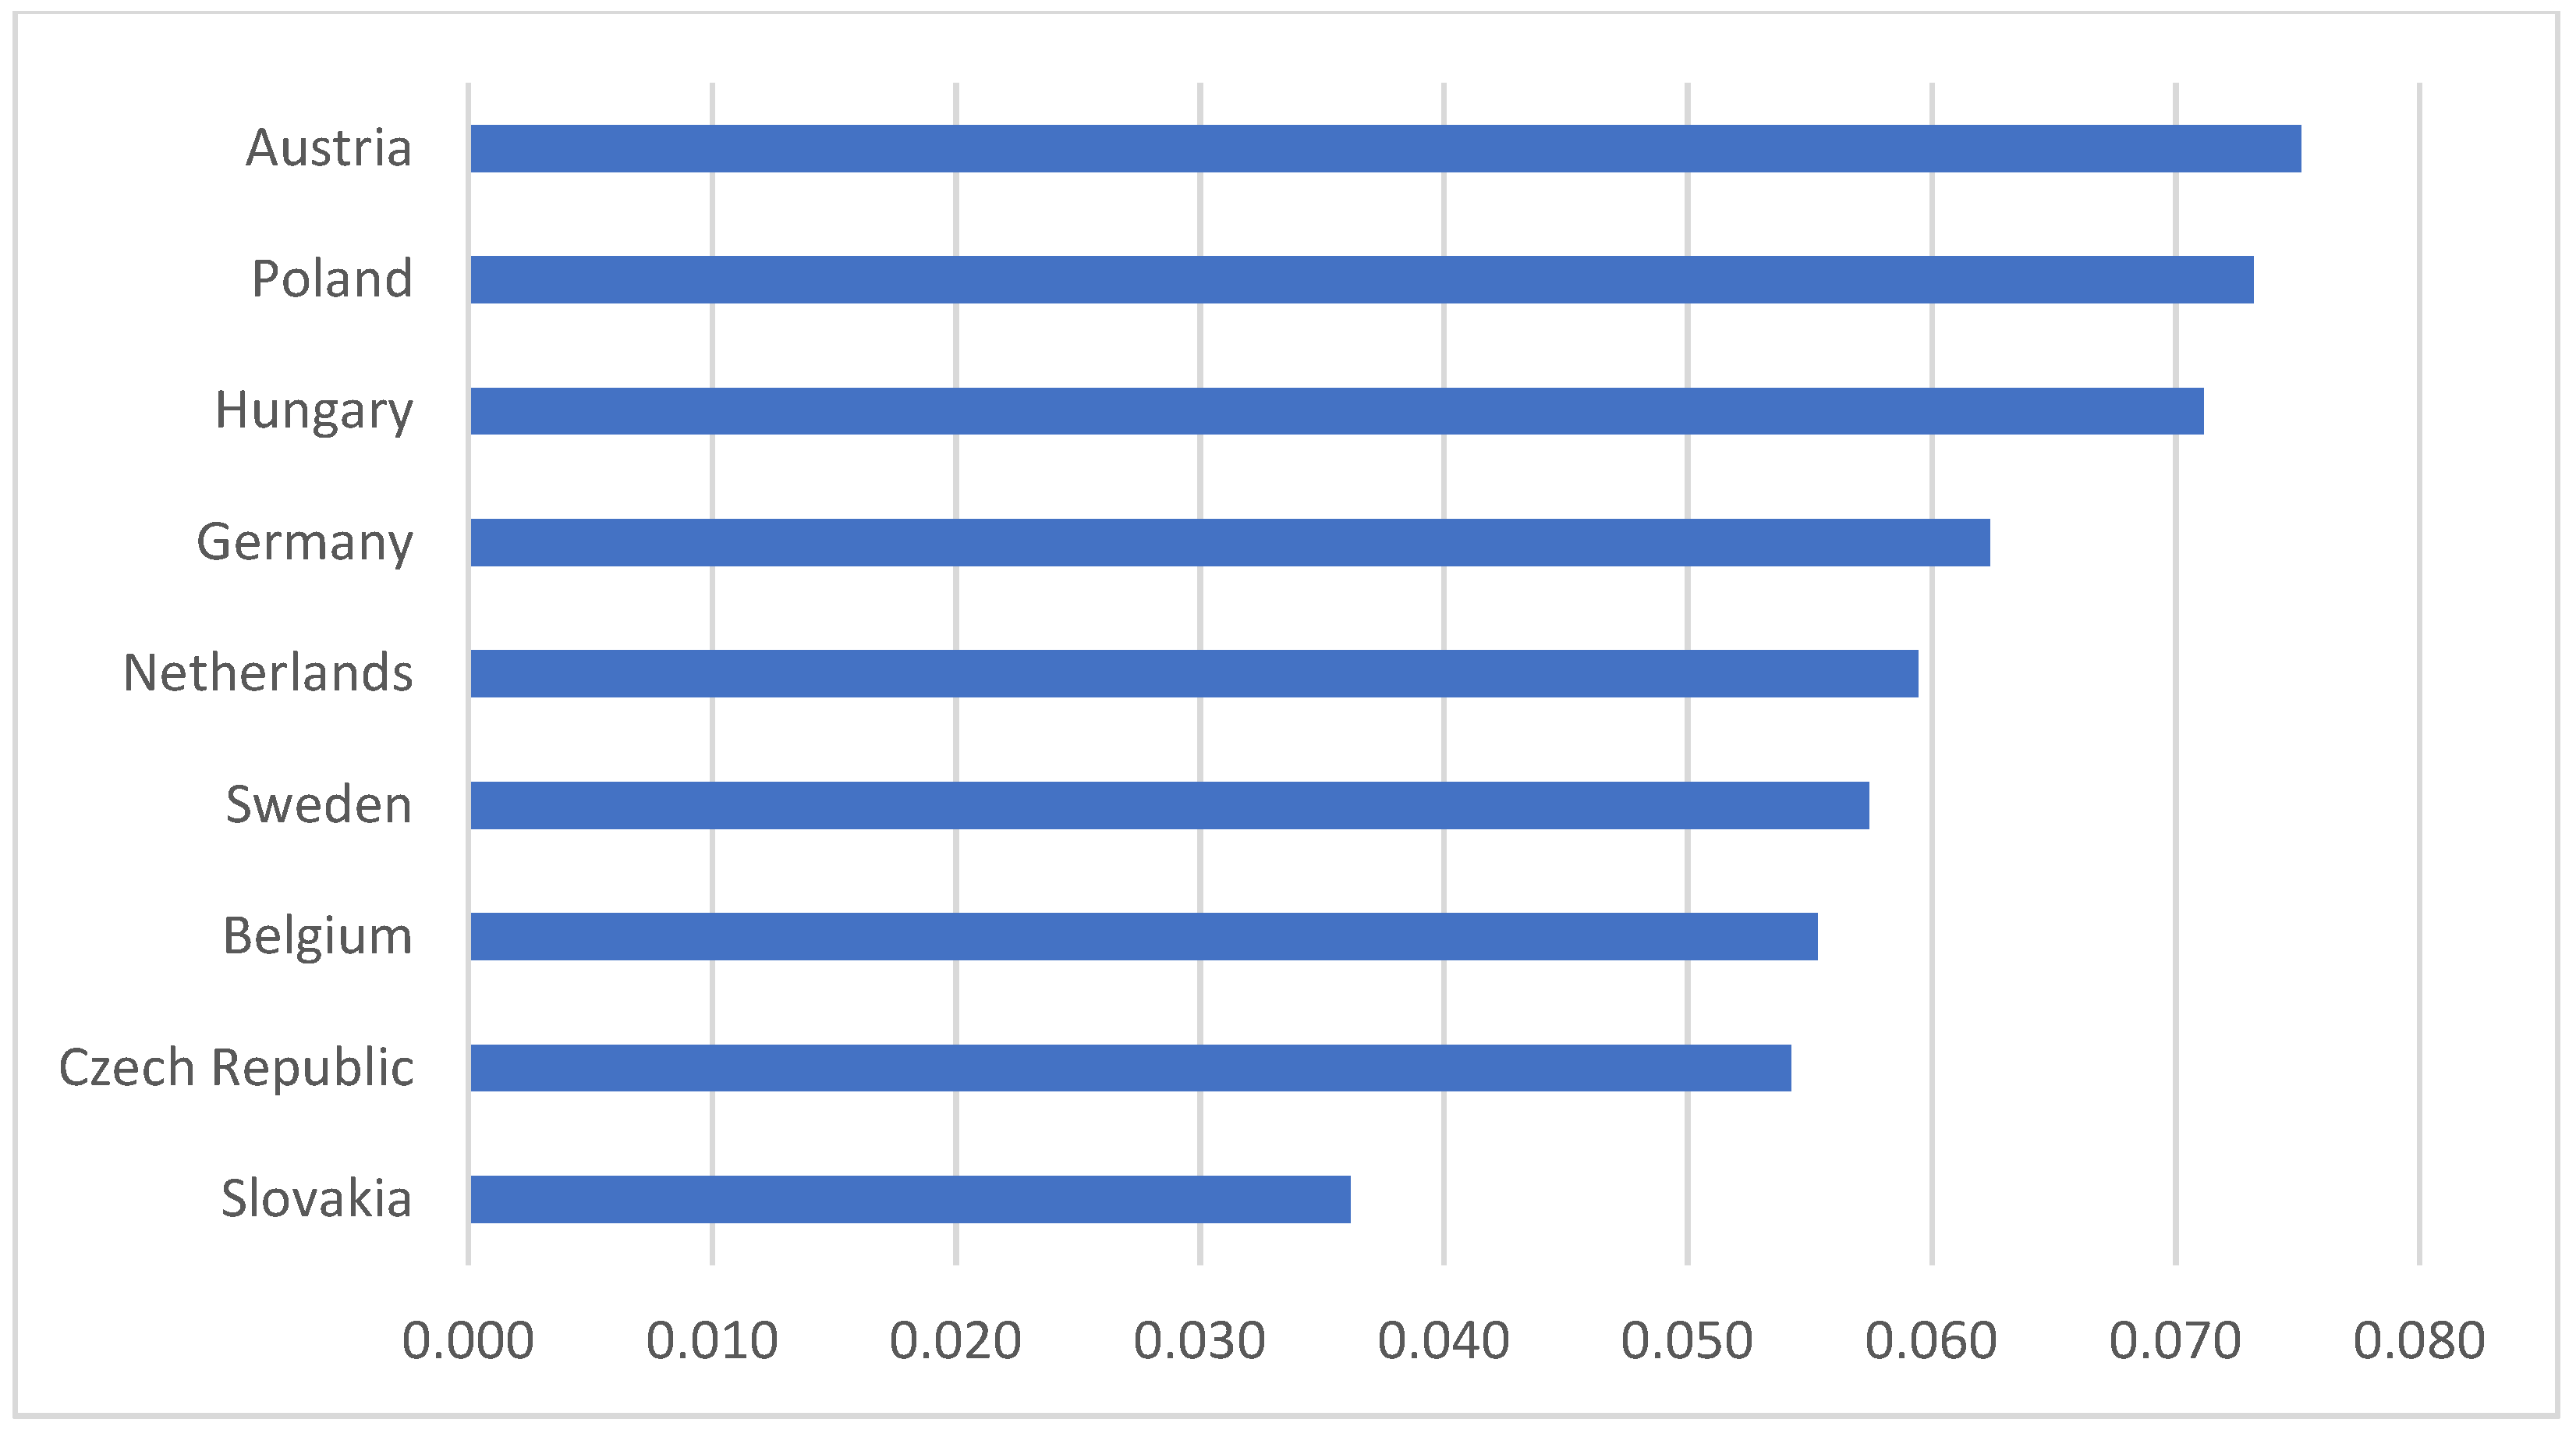
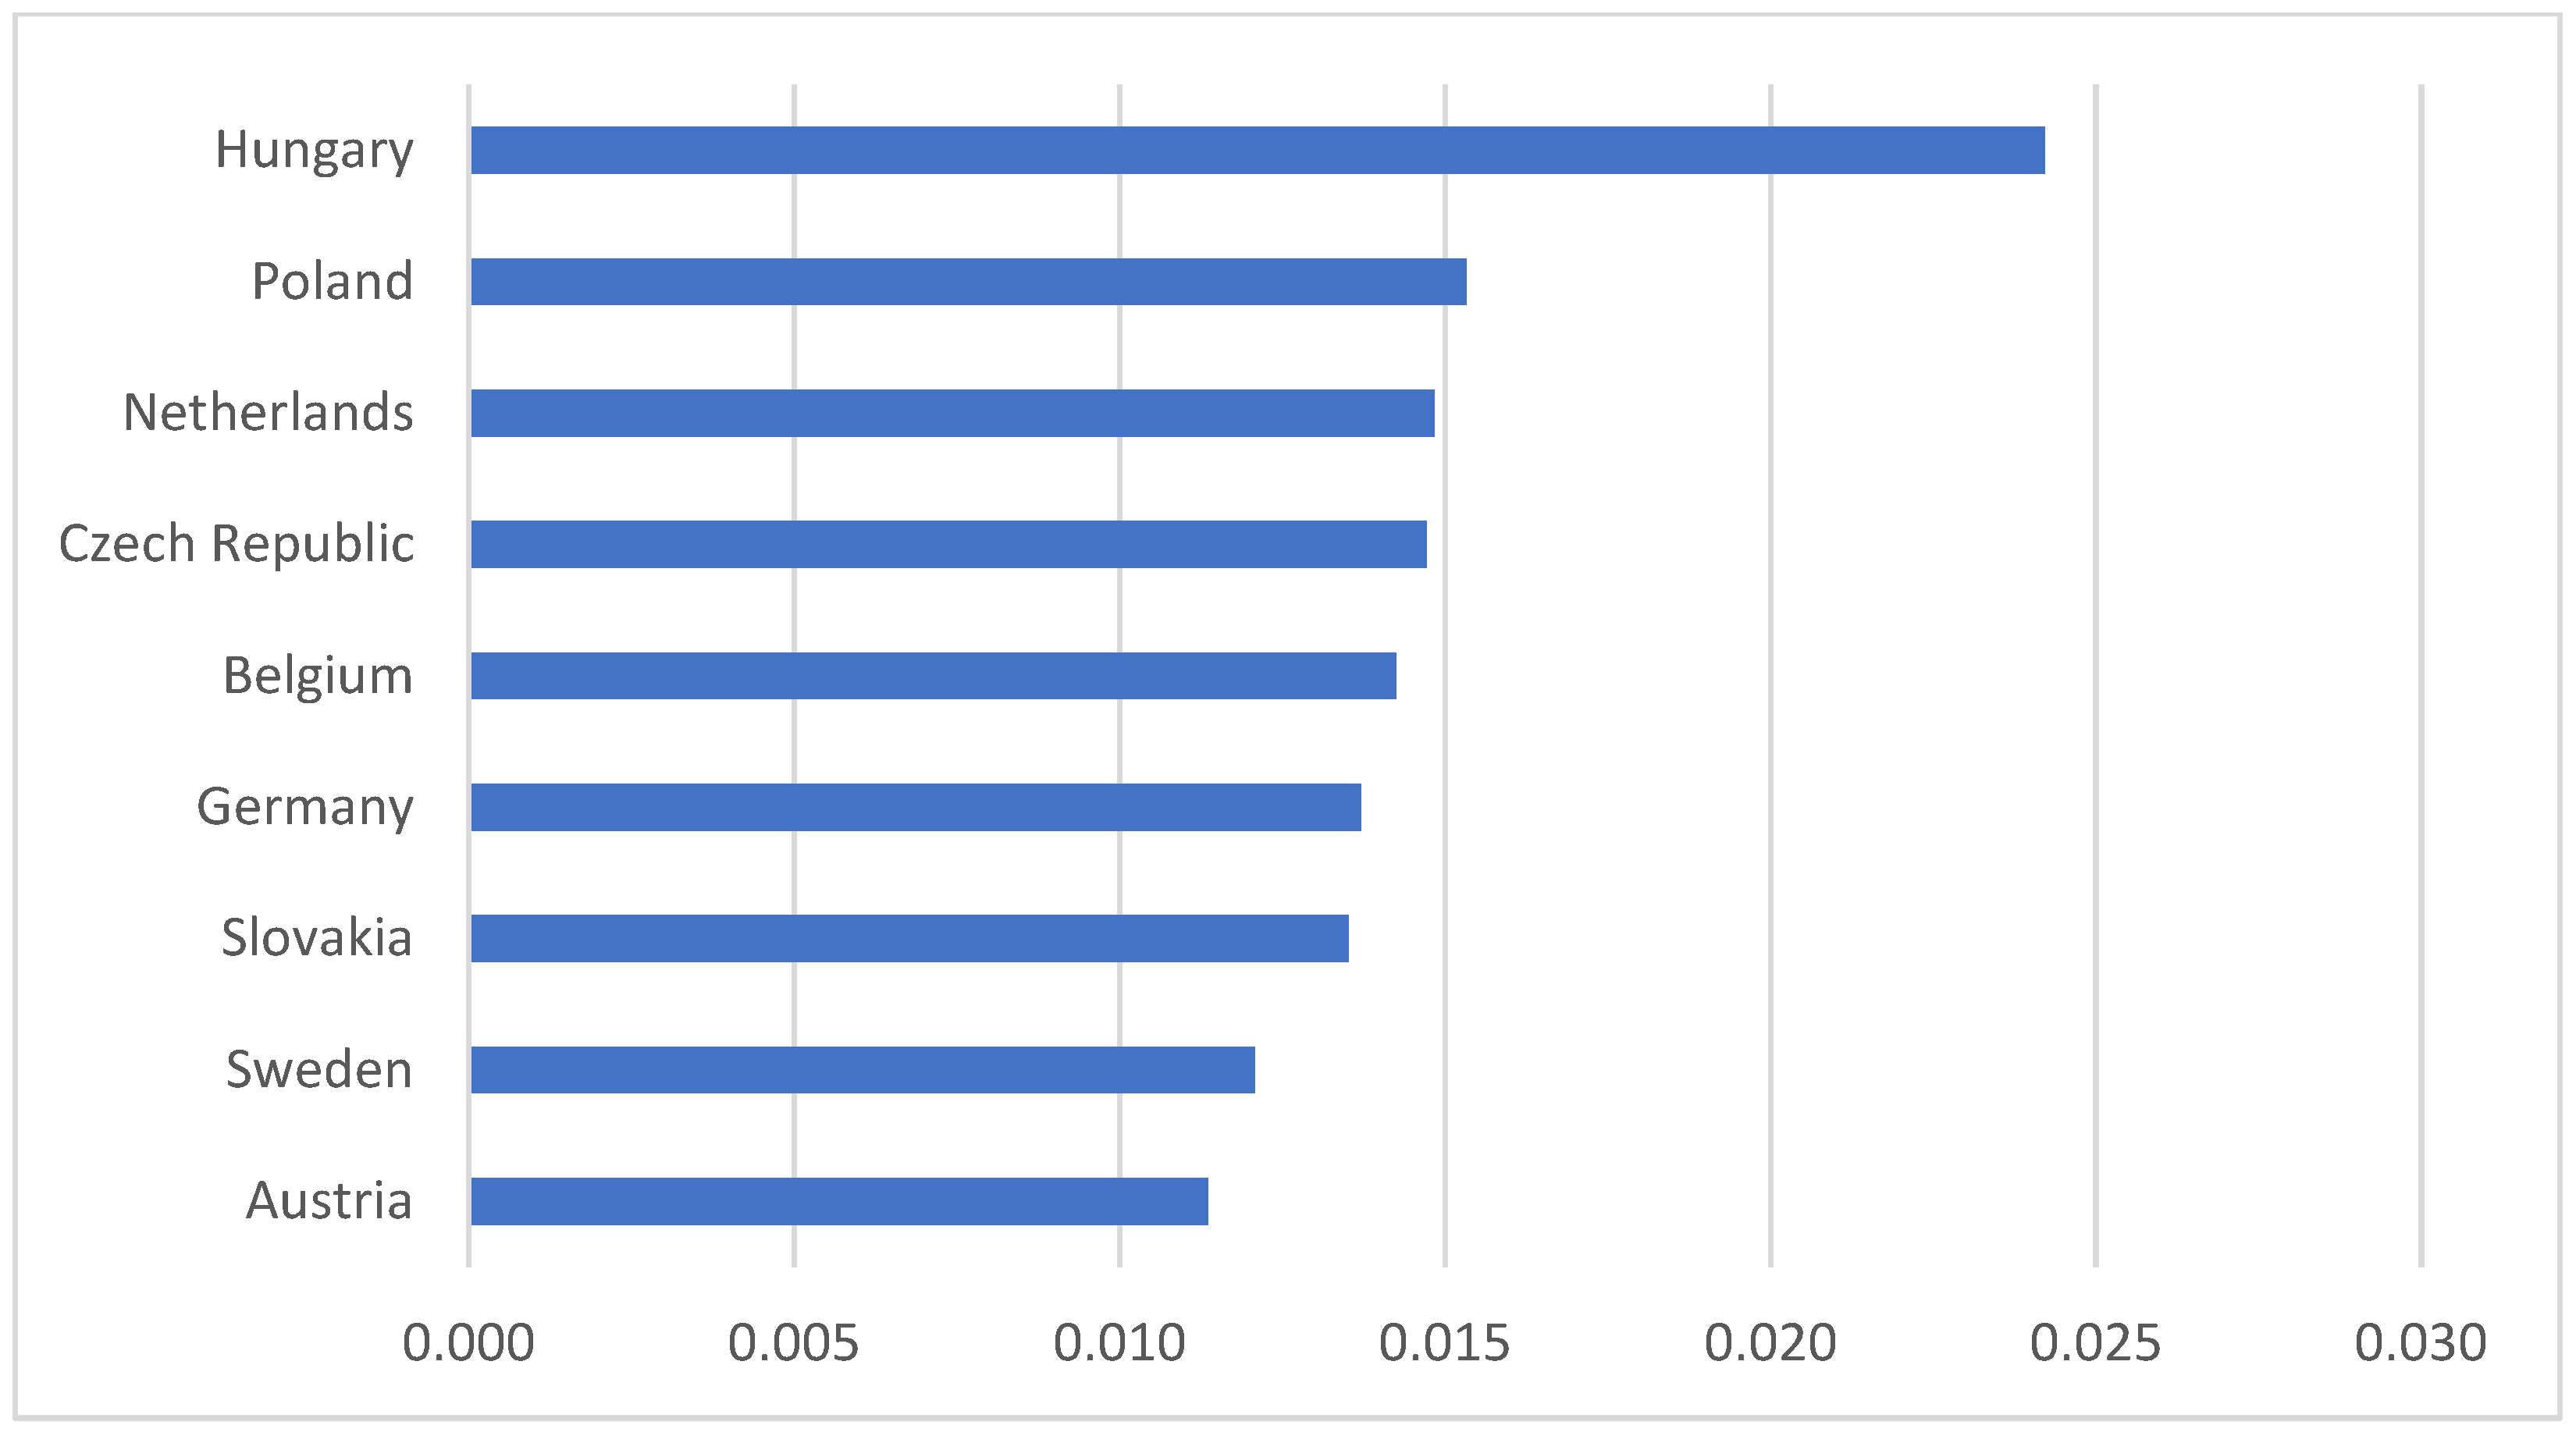
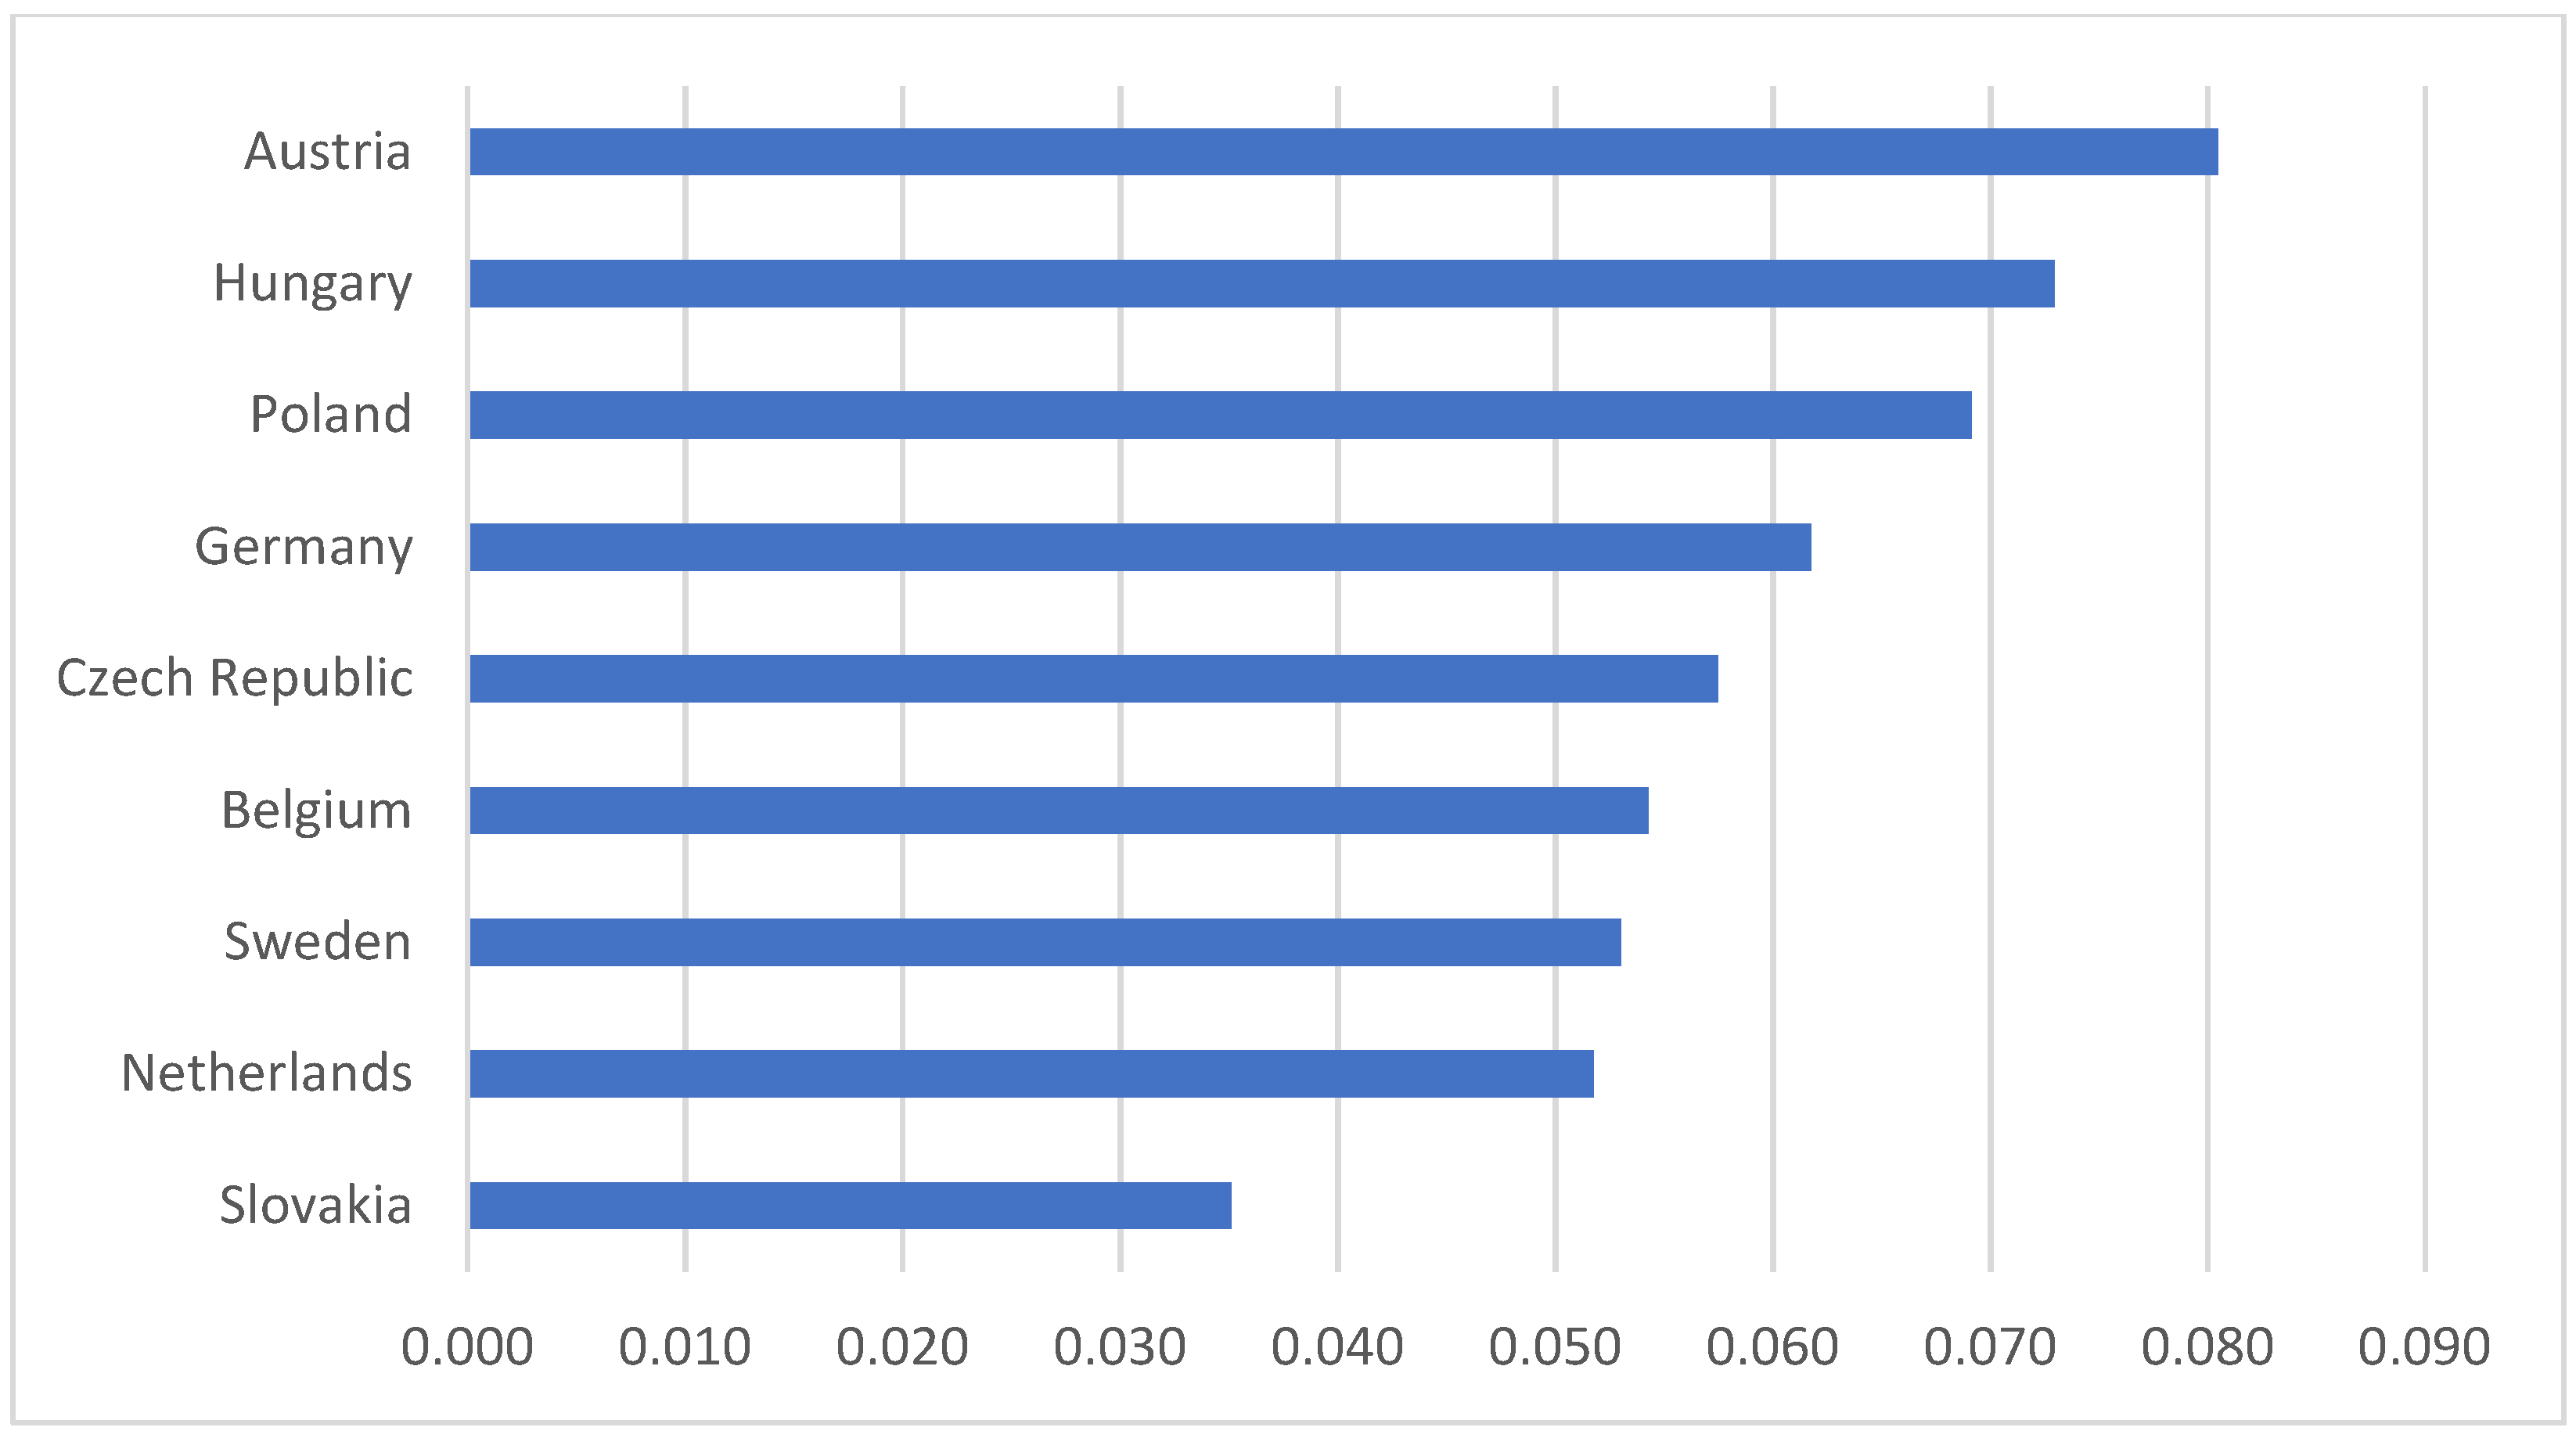
Our study aims to use artificial intelligence to forecast inflation. We also use artificial intelligence to forecast stock index changes. Based on the forecasts, we propose portfolio re-allocation decisions to protect against inflation.
The forecasting literature does not address the importance of structural breaks in the time series, which, among other things, can affect both the pattern recognition and prediction capabilities of various machine learning models. The novelty of our study is that we used the Zivot–Andrews unit root test to determine the breakpoints and partitioned the time series into training and testing datasets along these points. We then examined which database partition gives the most accurate prediction.


