1. Introduction
The rapid growth in the number and size of sustainable (also known as Environmental, Social, and Governance, or ESG) funds has given rise to several concerns. Perhaps the most pressing issue is the phenomenon of greenwashing, where ESG funds falsely present themselves as adhering to sustainable and ESG-driven investment strategies in order to attract investor capital. This problem stems from the lack of consistent and standardized data available for evaluating the sustainability practices of individual portfolio companies. This lack of transparency makes it challenging to accurately gauge the true ESG orientation of a mutual fund and to make meaningful comparisons regarding the sustainable nature of one fund’s portfolio versus another’s. The risk of investors being deceived by misleading claims of sustainability has heightened substantial consumer protection concerns, highlighting a potential regulatory gap that may require attention.
A natural question is whether mutual funds disguise their actual actions (portfolio choices) and greenwash their true deeds behind the curtains of “cheap” labels and self-attributed virtues, for instance, by adding to their names the moniker “ESG” or similar ones. If so, to what extent does the practice of greenwashing occur? Also, has the greenwashing phenomenon been declining over time or are we still in the early stages of this loathsome marketing practice? In this paper, we tackle these research questions from an empirical angle and aim at providing answers (in the form of statistical estimates of appropriate coefficients) with reference to data concerning major, active equity mutual funds originating in the United States between 2011 and 2022.
ESG investments have become one of the most popular investment classes over the last decade. Sustainable assets grew by 17% annually in the US alone between 2014 and 2020 (see
Global Compact Leaders 2004). As of 2020, 35.9% of total assets under management are sustainable investments, equaling USD 35.3 billion. At the same time, ESG is among the most discussed asset classes. Many questions arise around its definition, and allegations of greenwashing have been made. Fueled by concerns about consumer protection, policymakers, regulators, and standards organizations are becoming increasingly involved in the issue, as they try to decipher sustainable investment products and shape regulatory guidelines. For instance, in March 2021, the SEC announced the creation of a Climate and ESG Task Force that will “(…) develop initiatives to proactively identify ESG-related misconduct” and “proactively address (…) emerging disclosure gaps”. Hence, it seems to be a key endeavor to develop a progressive understanding of the greenwashing phenomenon and to empirically test relevant hypotheses concerning its existence and evolution over time.
Addressing the research questions stated above poses two major practical hurdles. First, how does one objectively measure the subjective tendency by mutual funds to self-identify themselves as sustainable or ESG-driven. We address this issue by following the earlier literature (discussed in
Section 1.1) and identify as self-labelled all funds that carry names containing the words/adjectives “ESG”, “Sustainable”, “Sustainability”, “Green”, or “Social”. We accomplish this by starting from 1 January of the year that follows the appearance of one or more such words in a fund’s name. Second, how does one measure the actual (and hopefully, also objective) sustainable investment performance of a mutual fund, irrespective of its subjective self-identification as a sustainable one. We resort to two rather uncontroversial measures: the first one is the aggregate, portfolio-weighted score of a fund implied by a variety of ESG scores attributed to the stocks that the fund owns; the second one is the percentage share of the net asset value that a fund allocates to “sin stocks”, defined in a variety of alternative ways.
There is a precise reason for adopting two alternative and arguably rather different notions of actual performance of a fund in the sustainability space. To investigate whether greenwashing exists in the US mutual fund industry, one must first understand the nature of ESG funds and their workings. Currently, there is no formal, precise definition of what ESG funds are. The term ESG originated from a 2004 Global Compact Report. At the time, major financial institutions emphasized the significance of environmental, social, and governance issues in corporate management (see
Global Compact Leaders 2004). Today, ESG investing aims to exploit financial resources to tackle global concerns, such as climate change and sustainable land use (environmental), human rights and labor standards (social), and governance issues like tax avoidance and corruption. Practically, sustainable investing is defined as “(…) an investment approach that considers environmental, social and governance (ESG) factors in portfolio selection and management” by the Global Sustainable Investment Alliance (GSIA) (see
Global Sustainable Investment Alliance 2020).
To achieve their ESG goals, investors employ various strategies to embed sustainability in their asset allocation policies. These strategies encompass shareholder action, positive and negative screening, ESG incorporation, best-in-class approaches, sustainability-themed investing, and impact/community investing (see the discussion in
Amel-Zadeh and Serafeim 2018). In recent years, an increasing number of portfolio managers have adopted multiple ESG investment strategies within their ESG funds. Nonetheless, the two most popular ESG strategies are negative screening and ESG incorporation. In 2020, the global investments in these two strategies reached USD 15.9 trillion and 25.2 trillion, respectively (see
Global Sustainable Investment Alliance 2020). Negative screening primarily involves excluding investments in specific industries (e.g., oil, gas, tobacco, or gambling) and sometimes in certain companies or countries. ESG incorporation refers to the systematic inclusion of environmental, social, and governance concerns into the portfolio selection and management process. According to the Global Sustainable Investment Alliance, negative screening held the title of the most popular investment strategy until 2018, when ESG incorporation surpassed it as the most frequently employed approach. The co-existence of these two approaches supports our choice to measure the actual sustainable performance fund in the two ways described above (i.e., funds’ ESG scores and the percentage of sin stocks held by the fund).
In this paper, we adopt actual sustainability performance measures based on ESG ratings. Earlier research indicates that most investors rely on third-party ESG scores when making ESG investment decisions (see, for instance,
Amel-Zadeh and Serafeim 2018). Notable third-party providers include Refinitiv LSEG, Morningstar, and MSCI. Typically, ESG scores are available at the firm level, allowing investors to quantify a fund’s ESG “performance” as an average score based on the fund’s portfolio holdings. In addition to overall ESG ratings, rating agencies provide individual Environmental, Social, and Governance (ESG) scores for each firm and/or listed stock. These providers aggregate data from sources such as annual reports, CSR reports, news, and NGO reports, applying their methodologies to estimate individual equity-level scores. Controversies’ ratings, which reflect a company’s public image, also offer investors valuable insights. Asset managers may leverage this information to gain ESG insights and construct ESG funds aligned with their ESG incorporation or screening methodologies. Importantly, the scoring methodology and rating scales frequently vary significantly among ESG data providers. This variability introduces additional uncertainty into investors’ decisions regarding the implementation of ESG strategies (see
Avramov et al. 2022).
ESG rating agencies often offer a flagging system for identifying “sin stocks”, which assists investors employing negative screening in sustainable investing. The exclusion of such stocks is rooted in the belief that these companies exploit natural resources and human vulnerabilities or contribute to climate change for profit-driven motives. However, even in the case of negative screening, there exists no universally defined criterion of how the screening should be performed. The determination of which stocks to exclude hinges on the ethical perspectives of individual investors (see
Amel-Zadeh and Serafeim 2018). Most negative screening-oriented investors commonly exclude stocks from industries like tobacco, gambling, oil and gas, adult entertainment, and weapons. However, for other industries with negative externalities, such as alcohol or nuclear power, a substantial debate lingers among investors.
Exemplified by the two primary ESG investment strategies, this system introduces significant ambiguity regarding the defining characteristics of ESG funds and other sustainable investment products. On the one hand, this ambiguity creates opportunities for greenwashing: the vagueness in the definition of ESG funds mirrors the ambiguity surrounding greenwashing. It is widely believed that many ESG funds fail to genuinely uphold their commitment to sustainable investing. This skepticism arises from the temptation to gain unfair advantages by falsely claiming to be sustainable. These deceptive rewards sought by mislabeled funds are financial and exploit the positive associations between asset valuations, investors’ flows of funds, and sustainability. Using US data, (
Hartzmark and Sussman 2019) present experimental evidence indicating that sustainability is perceived as a positive predictor of future performance, despite no concrete evidence demonstrating that highly rated ESG funds would or should outperform their lower-rated counterparts. On the other hand, this very ambiguity explains our decision to resort to two alternative measures of actual sustainable performance by mutual funds.
We report two main empirical findings. First, both panel regressions that include time-fixed effects and a set of cross-sectional regressions performed in correspondence to each of the 12 years of our sample (2011–2022) provide evidence of moderate differences in portfolio behavior between self-declared ESG and non-ESG US equity mutual funds. The implications for the former funds are twofold. First, self-declared ESG funds tend to invest, on average, in stocks with higher ESG ratings than the latter. Second, they tend to shun sin stocks to a larger extent than non-ESG funds. These differences are moderate, because even though they tend to correspond to precisely estimated coefficients associated with a dummy, capturing the self-designated ESG nature of a fund, these are often not of first-order magnitude in economic terms. Hence, our empirical tests rule out extreme, complete greenwashing, by which there would exist no differences in the portfolio choices of ESG and non-ESG mutual funds, but fail to reject the conjecture of the existence of potentially important “pockets” of greenwashing in our data.
Second, most of the estimated coefficients associated with the distinction in behaviors between ESG and non-ESG funds evolve over our overall sample in ways that are consistent with the extent and spread of greenwashing having declined. Self-declared ESG mutual funds have held stocks characterized by relatively high sustainability ratings at an increasing pace, which has increased their difference vs. non-ESG funds. Moreover, self-declared ESG funds have reduced their holdings of sin stocks more rapidly than all other funds, creating a wedge that has increased, especially after 2017. Of course, for greenwashing to be found to be declining in the second half of our sample implies that non-negligible greenwashing must have been occurring early in the sample.
1.1. Literature Review
Various studies have tested the hypothesis that labeling funds as “ESG” may yield important financial implications. Most of these studies rely on “objective” lists of ESG funds provided by third-party sources (see
Gil-Bazo et al. 2010). For instance, in researching inflows into socially responsible funds, (
Bialkowski and Starks 2016) combine Morningstar’s socially conscious list with Bloomberg’s socially responsible list. Prior studies used various definitions of ESG funds, which are slightly different from ours. (
Bollen 2007) obtained the ESG fund list from SIF (The Forum for Sustainable and Responsible Investment). SIF only considers funds that its member firms offer and classifies a fund to be socially responsible if the fund applies any social screening or sponsors shareholder resolutions on social responsibility issues. (
Starks et al. 2017), on the other hand, use the FTSE4Good US Select Index, which adjusts its composition based on ESG performance evaluations provided by FTSE Russell analysts. They then convert this equity-level list into a fund-level list using value-weighting to define ESG funds. However, this approach, which employs objective ESG scoring to define ESG funds, sidesteps the issue of greenwashing. The vetting process during list compilation inherently excludes greenwashing funds. Consequently, this approach is not further explored in this paper because—as discussed in the Introduction—our explicit goal is to test the existence and pervasiveness of greenwashing behaviors among US equity mutual funds.
Following our logic, to detect potential greenwashing behavior, it is crucial for funds to explicitly designate themselves as ESG funds. Research that defines ESG funds based on their self-designation can be categorized into two strands, depending on how these funds choose to label themselves. On the one hand, self-labelled funds are those that voluntarily identify themselves as ESG funds, often without adhering to specific regulations or pledging to follow any formal criteria. To promote themselves as ESG funds, they frequently incorporate terms like “ESG”, “green”, “social”, or “sustainability” into their fund names. In light of growing concerns related to climate change and social issues, renaming a fund may represent a vital marketing strategy to attract large inflows. For example, (
Kaustia and Yu 2021) observed the impact of what they called “ESG labelling effects”. A self-labelled ESG retail fund experiences, on average, a four-fold increase in inflows, while an institutional fund can see a nine-fold boost compared to non-ESG labelled funds. Furthermore, (
Kaustia and Yu 2021) addressed greenwashing by comparing actual (Sustainalytics) ESG ratings between ESG and non-ESG funds. They report that ESG-labelled funds attract more inflows than non-labelled funds, despite the latter often being characterized by higher objective ESG ratings. This observation suggests that the potential for increased inflows through ESG labelling prompts investors to redirect their funds toward ESG-labelled options, though this may result in minimal changes in portfolio choices and capital allocation policies. Additionally,
Kaustia and Yu (
2021) find that the “ESG labelling effect” has declined over time. In contrast to the initial period (2016–2017), the increased inflows driven by ESG labelling ceased to be statistically significant from 2018 to 2020. This shift indicates a growing awareness among investors regarding the issue of greenwashing. Simultaneously, during the same period, inflows into ESG-labelled retail funds decreased by one-quarter. While (
Kaustia and Yu 2021) focus their analysis on the effects of potential greenwashing on fund flows, in this paper we shift the attention to the measurement of greenwashing and its evolution over (a longer period of) time by focusing on actual portfolio allocation decisions by the mutual funds in our sample. Moreover, our measurement of actual sustainability and ESG quality is based on Thomson Reuters Refinitiv ratings, which guarantee a wider coverage.
These observed investors’ behavioral changes may be linked to the introduction of the inaugural fund-level ESG rating by Morningstar in 2016, which progressively enhanced the overall transparency regarding funds’ ESG performance in subsequent years (see
Kaustia and Yu 2021).
Ammann et al. (
2019) corroborate a similar empirical trend, indicating a shift of capital away from funds receiving low ratings by the Morningstar Fund Sustainability Rating system. Intriguingly, this effect is considerably more pronounced among retail investors than among institutional investors (as also noted in
Hartzmark and Sussman 2019). Yet,
Dumitrescu et al. (
2022) adopt a narrower perspective in defining ESG funds and greenwashing. They combine ESG self-labeling, sustainability scores of portfolio holdings, and data on funds’ voting behavior to assess a fund’s sustainability. According to their criteria, with reference to a 2016–2020 sample, they identify 31 out of 130 ESG funds within their sample as greenwashers.
On the other hand, a second strand of literature employs membership lists from organizations dedicated to supporting ESG investing and establishing industry standards in order to identify self-declared ESG funds. In their research,
Gibson Brandon et al. (
2021) and (
Liang et al. 2021) utilize the UN Principles for Responsible Investing (PRI) signatory list. The PRI represents the largest voluntary initiative aiming to guide the financial activities of major institutional investors toward addressing the Sustainable Development Goals. All signatories commit to integrating ESG considerations into their investment analysis and decision-making processes (see the discussion in
Gibson Brandon et al. 2022). However, there are no well-defined investment regulations applicable to sustainable mutual funds, and this membership pertains to the asset manager rather than the specific fund, thereby creating opportunities for greenwashing.
Gibson Brandon et al. (
2022) perform a comparison between the portfolio-weighted ESG scores of PRI signatories and non-signatories to assess their adherence to the PRI-driven commitments. The results reveal ambiguity regarding the ESG performance of PRI signatories. Notably, PRI signatories outside the United States exhibit superior ESG scores, which are enhanced after joining the PRI initiative. However, within the United States, PRI signatories showcase similar or even inferior ESG scores compared to non-signatories. Consequently,
Gibson Brandon et al. (
2022) conclude that greenwashing is prevalent in the United States. This seems to derive from lighter regulations (relative to the EU, which instead adopted the Sustainable Finance Disclosure Regulation in 2021) and the prevalence of marketing strategies that deliberately leverage ESG branding to boost sales. This finding aligns with
Gibson Brandon et al. (
2022), whose study reports that only European investors actively encourage the companies in their portfolios to enhance their environmental and social performance, even when this does not yield additional financial returns.
Amel-Zadeh and Serafeim (
2018) also identify a stronger ethical drive for ESG investing among European investors. Furthermore,
Liang et al. (
2021) focus their research on the financial performance of hedge funds potentially involved in greenwashing. They define greenwashing funds as PRI signatories whose ESG performance falls below the median ESG performance of hedge funds. According to their criteria, 20.8% of hedge fund signatories engaged in greenwashing between 2006 and 2019. A recent analysis by
Rompotis (
2023) concerning 24 passively managed, ESG-labelled, exchange-traded funds offered in the United States revealed that about one-quarter may engage in greenwashing practices, as they invest 10% or more of their assets in S&P 500 Index stocks with high or severe ESG risk. Even though our paper concerns actively managed mutual funds, the methods and tenor of the findings are similar.
A closely related paper is
Curtis et al. (
2021), in which the authors approach the problem of the ESG nature of mutual funds and of the corresponding self-labelling from a legal perspective. Among a variety of empirical tests concerning ESG mutual funds (including voting behavior, performance, and fees charged),
Curtis et al. (
2021) also test whether the portfolio choices of funds designated as being of an ESG type according to a variety of criteria differ from those of non-ESG funds. Using ratings data from ISS, S&P, Sustainalytics, and TruValue Labs and with reference to a 2018–2019 sample of US equity funds (active and non-active), their regression results imply that funds that identify themselves as ESG funds hold portfolios that represent a significant ESG tilt and thus deliver on their promise to invest differently from other funds. Our research design differs from theirs because of the focus on actively managed mutual funds only, a much longer sample (2011–2022), and the (much needed, because of the longer time span covered) use of panel regressions that include fixed effects instead of simpler, pooled OLS regressions. Our attention is not confined to the implied ESG portfolio score of a fund implicit in its portfolio weights but actively extends to funds’ decisions concerning sin stocks, to be defined below. Moreover, our ESG scores are sourced from Thomson Reuters Refinitiv, which represents a large-scale rating provider and eliminates the need to resort to four different providers. Nonetheless, the findings, among our results, that are directly comparable to those in
Curtis et al. (
2021) similarly point to scant evidence of massive greenwashing practices.
2. Data and Methods
2.1. Data
We obtain data from two main sources: the financial data concerning mutual funds and their historical performance are retrieved from the CRSP Survivor-Bias-Free US Mutual Fund database. The ESG ratings are obtained from the Refinitiv Workspace.
The CRSP Survivor-Bias-Free US Mutual Fund database gathers historical data on publicly traded open-end mutual funds dating back to 1962. It includes information on funds’ strategies, such as portfolio holdings, key financial indicators like net asset values or monthly total returns, and management information such as fees or the asset managers’ names. Since 2008, the data have been provided electronically by Thomson Reuters and Lipper. The database is updated quarterly.
We begin by acquiring data on mutual funds’ equity holdings from the CRSP US Mutual Fund database, specifically on 31 December for each year spanning from 2011 to 2022. The choice of this sample period aligns with the literature, which indicates significant developments in the industry and the sustainability sphere, commencing in 2011 (see
Global Sustainable Investment Alliance 2020;
Hartzmark and Sussman 2019). Our focus is exclusively on active equity funds originating in the United States. To ensure the inclusion of economically relevant funds, we set a minimum threshold of total net assets exceeding USD 15 million. We use US open-end equity funds in all analyses, for instance, excluding funds of funds, index funds, and value-based funds. We eliminate duplicate entries representing different share classes within funds, as multiple share classes per fund could potentially obscure our analysis.
As previously discussed, we differentiate between ESG and non-ESG mutual funds based on each fund’s self-identification. Self-identification pertains to the asset manager’s subjective choice to establish and designate a fund as ESG, adhering to their individual ESG standards, independently of any objective ESG regulations or rankings. Given the absence of a precise ESG fund definition, earlier research has employed various techniques to pinpoint self-identified ESG funds for their investigations. For example,
Starks et al. (
2017) and
Kaustia and Yu (
2021) employ a fund-level-based approach to recognize ESG funds. They assess any funds that reference ESG-related aspects in their investment strategy within their prospectus as self-identified ESG funds. Their procedure starts off with Morningstar’s “socially conscious” list and is subsequently enhanced through manual scrutiny of fund names and prospectuses. In this paper, we adopt a largely similar method, identifying ESG funds by searching for specific “ESG keywords” within the fund names.
We intentionally focus solely on the fund names to emphasize fund branding over the stated strategy, aiming to encompass the widest range of ESG funds and potential greenwashers. The crucial factor in defining greenwashing is the misrepresentation, where investors are assured a level of sustainability that is not delivered in practice. In our dataset, funds classified as ESG have names containing “ESG”, “Sustainable”, “Sustainability”, “Green”, or “Social”. We analyze the fund names in the mutual fund data set to distinguish between ESG and non-ESG funds, marking the former with an ESG dummy variable set to 1 for ESG funds and 0 for non-ESG funds.
Regarding ESG data, Refinitiv, a subsidiary of Thomson Reuters, covers over 80% of the global market capitalization and has a historical dataset dating back to 2002. Within its data repository, Refinitiv offers a vast array of more than 630 distinct ESG metrics, which are further consolidated into 186 comparable measures. These measures are subsequently aggregated into ten primary themes categorized under the Environment (E), Social (S), and Governance (G) dimensions. The Environment dimension encompasses aspects such as resource utilization, emissions, and innovation, while the Social dimension delves into topics such as workforce relationships, human rights, community engagement, and product responsibility. On the other hand, the Governance dimension focuses on management quality, shareholder relations, and CSR strategies. The data used for these ratings are drawn from various sources, including annual and CSR reports, company and NGO websites, stock exchange filings, and news sources (see
Gibson Brandon et al. 2022). Each stock or company is assigned an individual percentile rank, ranging from 0 to 100, for each dimension, as well as an overall ESG percentile rank. The overall ESG score incorporates considerations of controversies, which are adjusted to account for the company’s size. Additionally, the score is based on ESG weights that are specific to the company’s industry, as indicated by verifiable reported data.
Table 1 summarizes the descriptive statistics for the mutual fund data over our full sample. It shows an overview of the portfolio characteristics differentiated according to the classification of ESG funds vs. non-ESG funds. The mutual fund data set includes 17,071 fund-year observations over a 12-year sample. The 17,071 data points contain 2449 individual funds, as most funds appear several times over different years. This delivers an average of almost 7 observation-year per mutual fund, reflecting a natural, albeit limited, rate of turnover, fund birth, and closure process over our sample. Around 3.3% of the funds are self-designated ESG funds, for a total of 560 observation-years. The number of ESG funds grew from two dozen in 2011 to 150 in 2022, thus representing more than 6% of all US equity funds as of the end of 2022. These absolute numbers and percentages are structurally lower than those retrieved by
Kaustia and Yu (
2021) from Morningstar but, apart from a longer list of text attributes they apply to the full funds’ prospectuses, this may be attributed to a differential precision by CRSP in reporting the exact fund names. They are instead similar to the sample of ESG funds analyzed in
Dumitrescu et al. (
2022).
ESG funds hold, on average, total net assets of USD 637 million and are therefore (again, on average) much smaller than non-ESG funds (characterized by average total net assets of USD 2290 million). The median total net assets only amount to USD 178 million for ESG and USD 257 million for non-ESG funds and are therefore only 28% and 11% of the mean, respectively. The fact that the mean net total assets systematically exceed the corresponding median statistics implies a strongly right-skewed distribution, by which only a few big funds with high total net assets push the mean above the median. The biggest ESG fund has total net assets of USD 26.8 billion, while the biggest non-ESG fund is around 18 times larger (USD 487.4 billion). Moreover, ESG funds display, on average, more highly diversified, smaller stock holdings compared to non-ESG funds, as they hold 227 vs. 201 stocks. However, they invest in companies that have a higher mean and median company market capitalization, as shown by the fact that the mean market cap is almost USD 97 billion in the former case vs. just less than USD 70 billion in the latter. As expected, ESG funds imply stock holdings with a higher ESG coverage by Refinitiv.
One additional characterization concerns the types of clientele the two types of mutual funds are destined for and offered to. Just over 50% of the ESG funds are offered to institutional investors only, while just around 23% of ESG funds are only offered to retail investors. Non-ESG funds show a similar distribution of offerings by investor type, with the difference that an additional 16% is available to both institutional and retail investors. In addition, 24% and 21% of all funds, respectively, do not belong to either of the two categories, which means that their specific clientele target is unknown based on the CRSP Mutual Funds database.
2.2. Preliminary Evidence
To develop some preliminary understanding of whether ESG funds engage in greenwashing, we start by looking at two key indicators: first, one actual ESG ranking of each fund based on the weighted, aggregate score of the stocks held in its portfolio; and second, the percentage sin stock ownership of each fund. Both indicators share the goal of measuring whether the self-attributed ESG label ends up matching the realized ESG performance produced by the mutual fund for its shareholders in terms of CSR quality of the portfolio allocation. The two criteria reflect the two key ESG investment strategies discussed in
Section 1: ESG incorporation and negative screening. An ESG incorporation strategy should be reflected by higher actual ESG scores, while a negative screening strategy ought to imply structurally lower stakes in sin stocks.
To obtain the first type of objective ESG scoring, we retrieve ESG data at the stock/firm level from the Refinitiv Workspace. We follow a voluminous amount of literature that has employed these data to calculate ESG performance (see, e.g.,
Liang et al. 2021). By merging CRSP and Refinitiv data by stock CUSIP identifiers, we implicitly remove all equities that did not receive an ESG score. Practically, this removes between 30% and 40% of all individual stocks in the original CRSP Mutual Fund data. Even though this is, of course, reason for some concern, we believe this not to represent a key driver of our analysis: an inspection of the stocks missing an ESG score in our sample period reveals that these are mainly small stocks. In fact, in terms of total net assets held by the US mutual funds under investigation, such a step only removes around 12% of the net invested capital through mutual funds. On rare occasions, this criterion leads to the removal of the majority of a fund’s portfolio. In these cases, we drop from our analysis the funds for which at least 50% of the equity holdings fail to carry an ESG score.
Because Refinitiv only offers its ESG, Environmental Pillar, Social Pillar, and Governance Pillar Score at the equity level, we need to estimate and aggregate them to yield an ESG score at the fund level. Therefore, we adopt the approach in
Gibson Brandon et al. (
2021) to compute a weighted portfolio ESG score using the weights of individual portfolio holdings within each fund. We adapt the formula in
Gibson Brandon et al. (
2021) to our application, as follows:
where
represents the weight of stock
i in fund
j at the end of year
t,
, and
quantifies the fund-level sustainability score for fund
j at the end of year
t, as measured by the weighted aggregate ESG score or alternatively by one among the weighted E, S, or G scores. The
is the ESG score of each stock
i at the end of year
t.
is the total number of equities included in the portfolio of fund
j that have received an ESG rating at the end of the year
t. The need to divide by
to obtain the
weights derives from the fact that, as not all stocks receive an ESG score from Refinitiv (and therefore were removed), some scaling of the raw weights
available in CRSP is required to allow weights to sum to one. The scaling makes
interpretable as a rank score, similarly to the individual equity scores. Incidentally, (1) follows Morningstar’s sustainability fund rating methodology, which is widely used in earlier research (see
Hartzmark and Sussman 2019;
Bialkowski and Starks 2016). Nonetheless, we depart from a mere implementation of Morningstar’s approach because, as in
Gibson Brandon et al. (
2021), we drop from our analysis all funds for which at least 50% of the equity holdings fail to carry an ESG score. On the one hand, this course of action is sensible because it is never clear why a stock that is favored by intuitional investors’ attention would fail to receive a Refinitiv score. The latter is heightened by Refinitiv’s tendency to rate most stocks representing an important worldwide investment target. On the other hand, one would like to avoid the situation that the possibly extreme ESG scores of just a minority of stocks are aggregated in scarcely representative objective ESG scores at the fund level. In any event, using (1), from this point onwards, the weighted ESG and weighted E, S, and G scores are the main variables representing the actual ESG performance of each mutual fund.
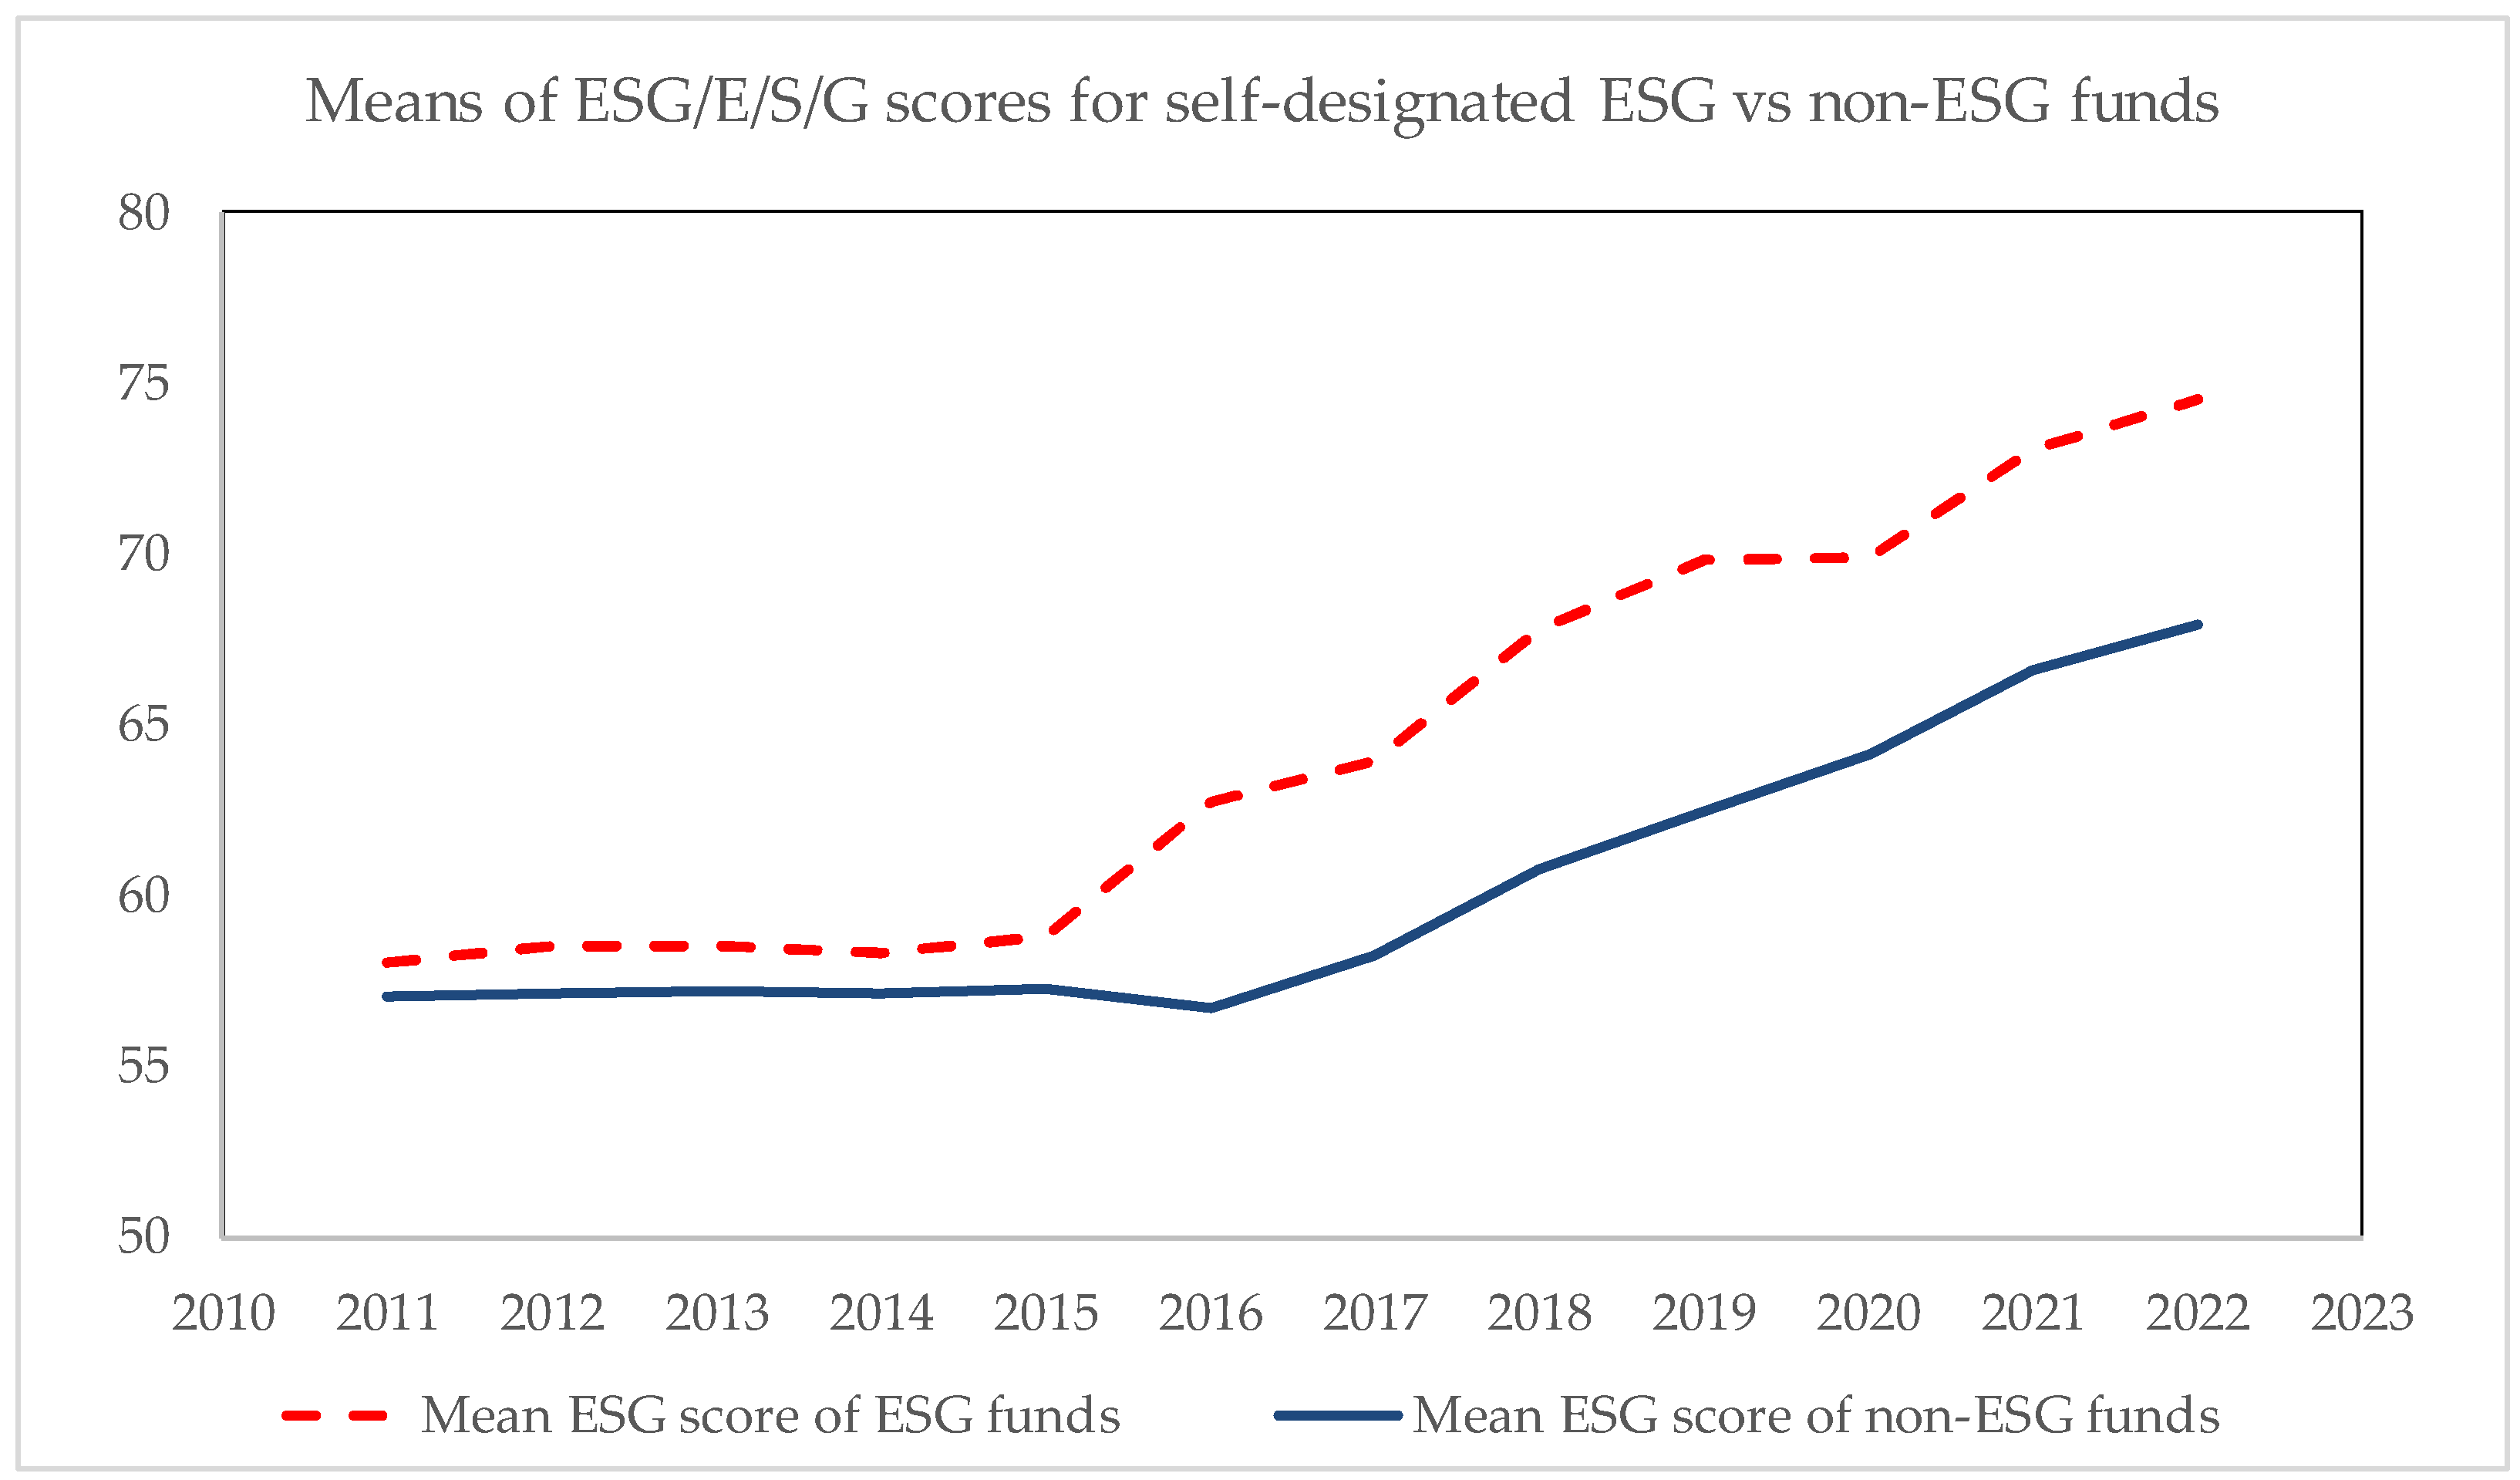
Figure 1 shows that, starting in 2015, while the mean overall ESG score of all types of mutual funds substantially increased by almost a 20% rank score, the spread in average scores grew from positive but moderate to almost 20% of the average score for non-ESG funds. This may be attributed to a period of impetuous growth in the average scores of ESG funds that occurred between 2016 and 2022 and that appears to be still under way. The introduction of the Morningstar Sustainability Fund rating might have driven this development, making ESG performance easily visible to investors of self-designated funds (see
Ammann et al. 2019). Overall,
Figure 1 is reassuring, showing that ESG funds are objectively more “virtuous” than non-ESG ones, which is at a first glance, inconsistent with the idea of widespread greenwashing taking place. An additional plot, unreported to save space, shows that the strongest wedge between ESG and non-ESG funds opens up with reference to the average Environmental sub-score, which may reflect asset managers placing a specific focus on this dimension. This aligns with the literature, which found empirical evidence of investors attaching increasing value to green stocks and firms and, as a result, to ESG funds that display a bias toward green mutual funds; see, e.g.,
Hartzmark and Sussman (
2019).
Table 2 summarizes the weighted ESG and E, S, and G scores for the whole period. All mean ESG scores and ESG sub-scores of ESG funds are higher than the ones for non-ESG funds. The average Social sub-score is the highest for both ESG and non-ESG funds, while the Environmental sub-score is the lowest. In general, means and medians are close to each other, indicating a rather symmetrical distribution of the ESG scores. However, the median is always slightly higher, suggesting the existence of a few well-below-mean, low-scoring outlier funds. In particular, the non-ESG funds have lower minimal scores (i.e., unreported analyses show that the lowest ESG score is 9.5 in the non-ESG fund data set vs. 12.4 in the ESG fund data set). Investigating this heterogeneity, we further identify 108 ESG funds that have a lower ESG score than the mean ESG score of non-ESG funds. This is equal to 19.2% of all the self-identified ESG funds, suggesting the existence of a long left tail of the ESG distribution of ESG funds and pointing towards the existence of greenwashers. Finally, all differences in both samples and sample medians turn out to be statistically significant (and positive) using appropriate tests of hypothesis, which leads us to conclude that ESG funds carry stronger ESG scores and are greener and more socially sustainable than non-ESG mutual funds.
To account for the possibility that US mutual funds may pursue sustainability goals by using simple, negative screening ESG strategies, we also identify the actual ESG quality of a fund with its share invested in sin stocks. Many different interpretations of the definition of a sin stock exist (see
Paradis and Schiehll 2021) for a confirmation that sin stocks do imply lower average ESG scores under all pillars, as one would hope). These are highly dependent on the cultural and social environment an investor is immersed in. Because in this paper we aim to capture the negative screening behavior across a large number of potentially heterogeneous funds, we adopt a broadly accepted and simple definition: we follow the classification of ESG-unfriendly industries in
Kaustia and Yu (
2021) and proceed to cross-check their selection with other papers and reports (e.g.,
Global Sustainable Investment Alliance 2020;
Amel-Zadeh and Serafeim 2018). This implies that all stocks in the oil and gas, tobacco, and gambling industries are classified as “sinful”. To identify sin stocks within our data, we use Refinitiv’s Business Classification codes. Therefore, for our purposes, we create variables that sum all the shares of one fund’s equities that fall into one of the sin stock sub-categories and compute their relative weight as a percentage of the net total asset value of the fund. In addition, we create an aggregate variable that sums all the sin stock percentage shares at the fund level. A lower value of the sin stock variable will then indicate that ESG funds implement negative screening strategies compared to non-ESG funds.
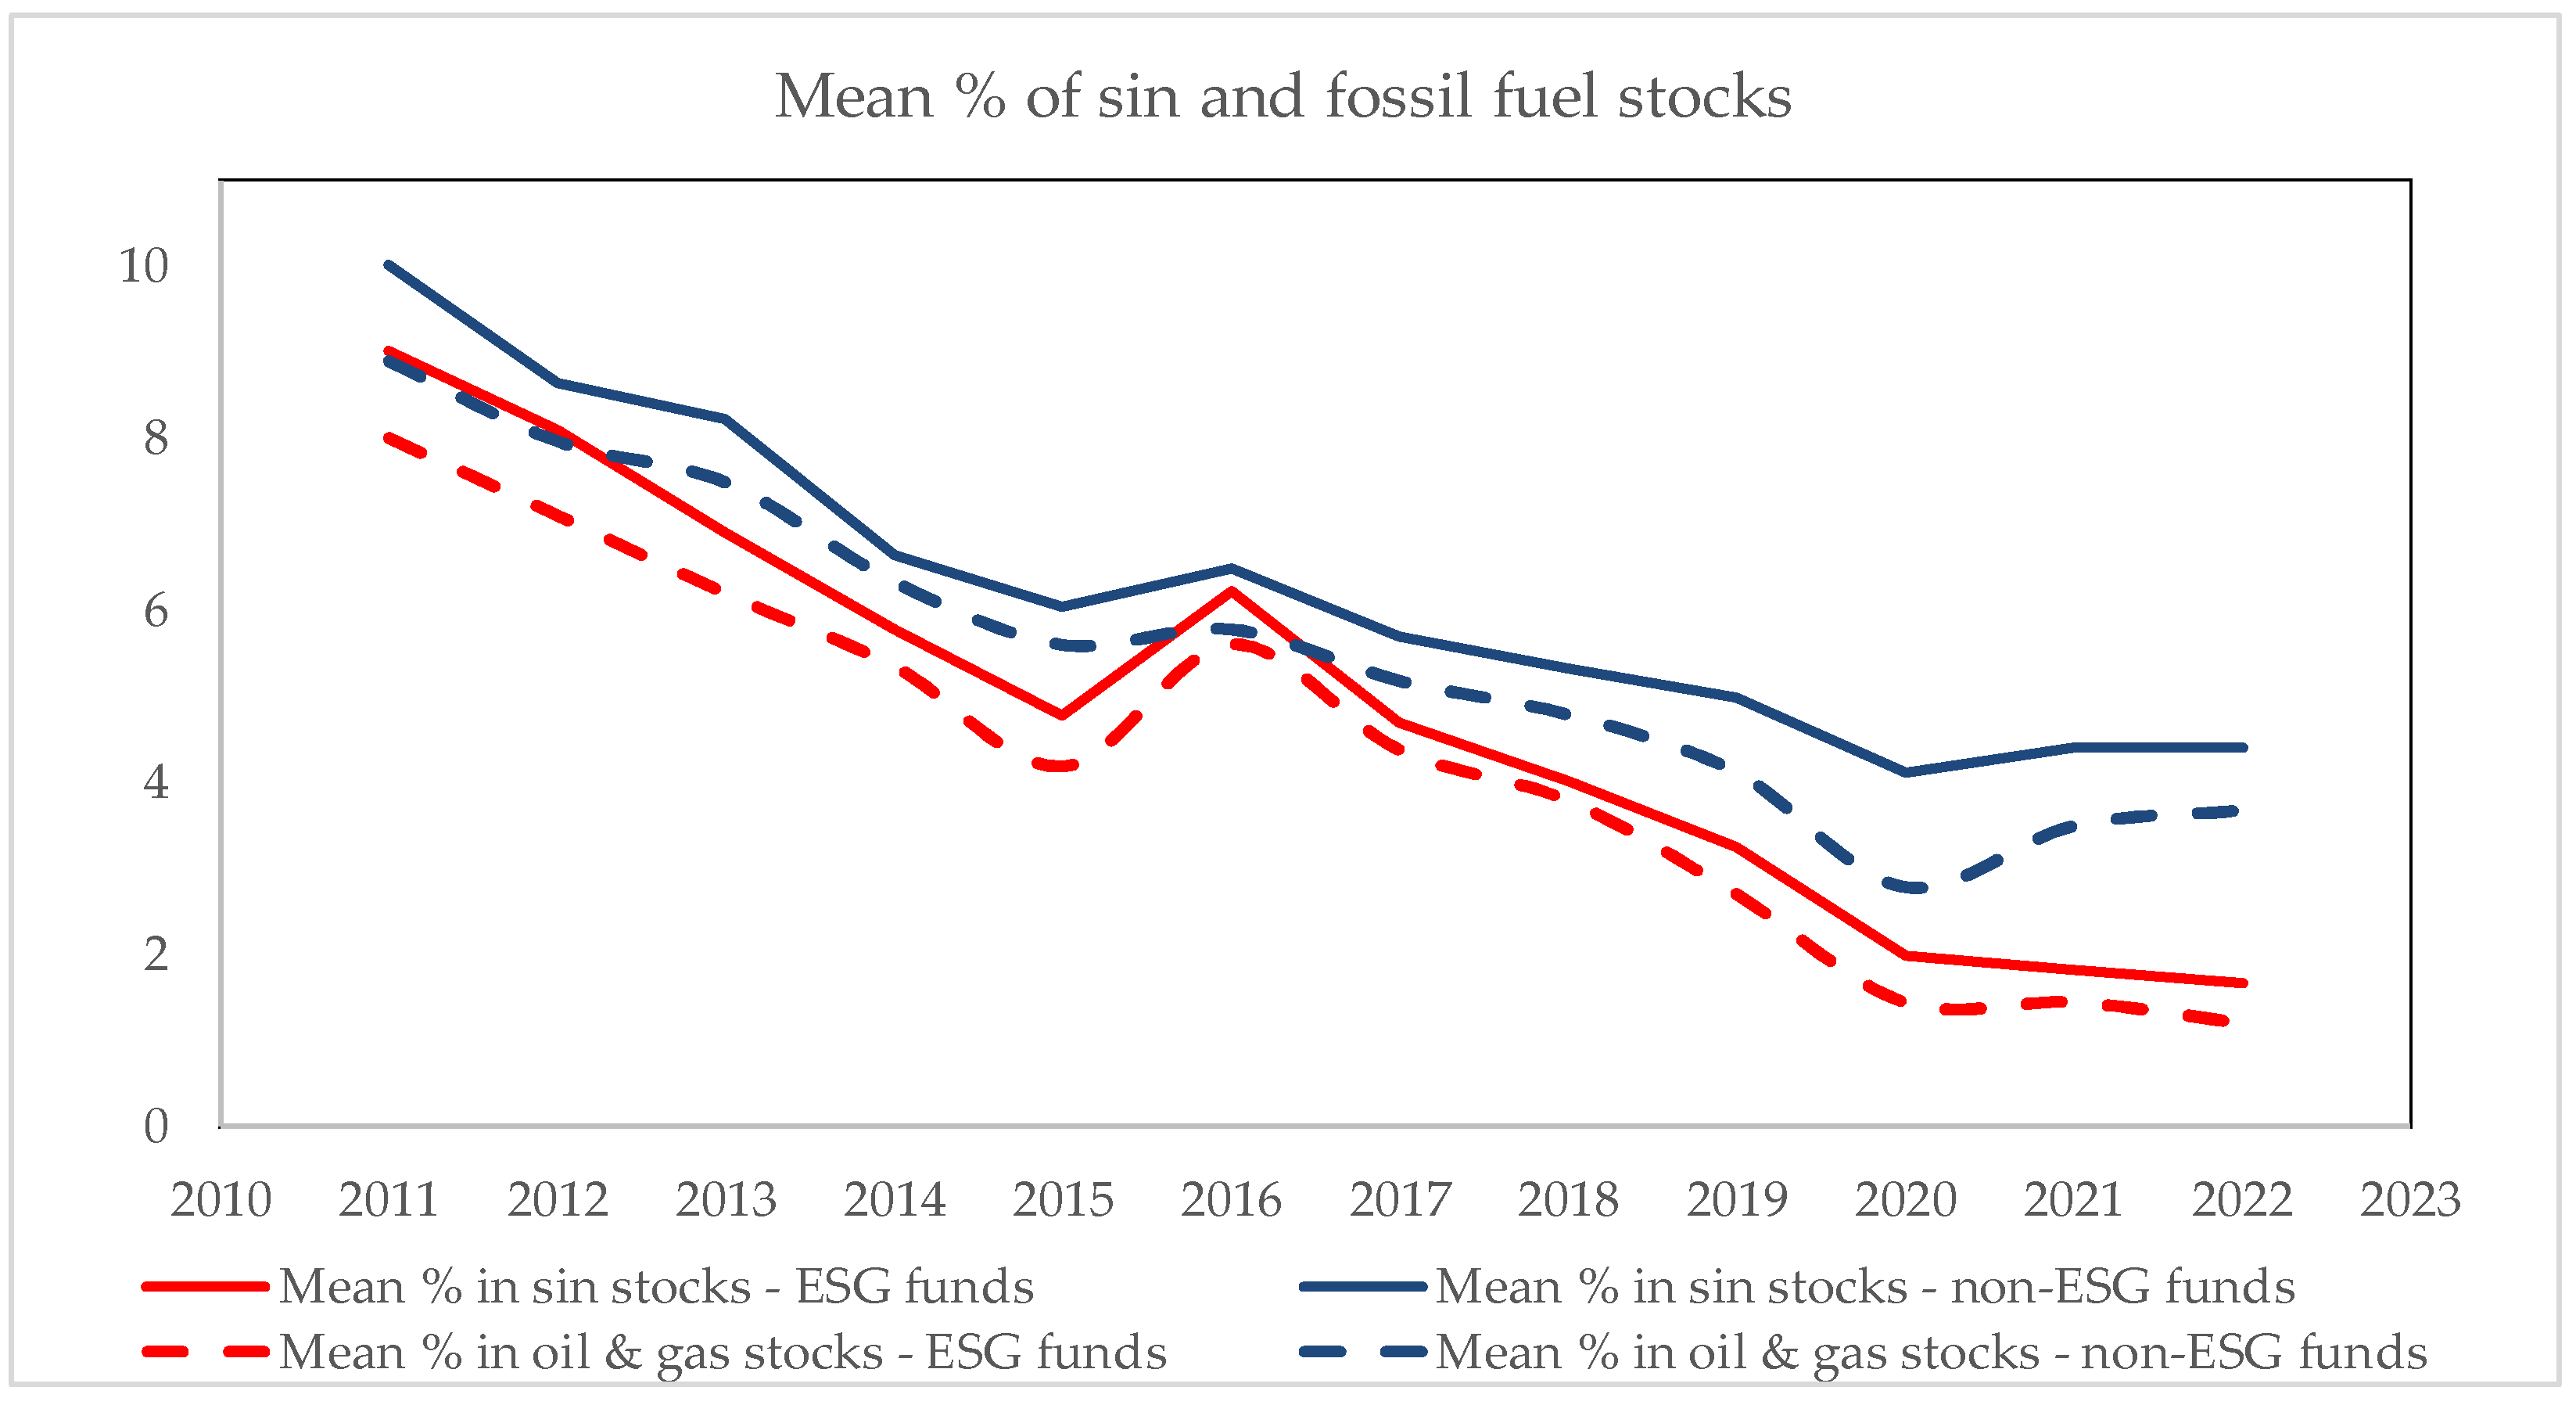
Table 3 shows that, as one would expect, self-defined ESG mutual funds (mutual equity funds that carry the words “ESG”, “Sustainable”, “Sustainability”, “Green”, or “Social” in their fund names) apply stronger exclusionary criteria than non-ESG funds. Looking at median portfolio shares, for instance, ESG funds hold only 4.1% in sin stocks (vs. 6% in the case of non-ESG funds), almost entirely (4%) in oil and gas firms (vs. 5.7% for non-ESG funds), and avoid tobacco and gambling firms altogether (while non-ESG funds carry negligible but positive median holdings). All the differences in portfolio shares across ESG and non-ESG funds are statistically significant, irrespective of whether standard parametric t-tests are applied to the spreads in sample means or nonparametric Kruskal–Wallis tests are applied to spreads in sample medians.
Figure 2 shows the dynamics over time of the mean shares of sin stocks (both in general and for the special sub-category of oil and gas stocks) for ESG and non-ESG funds. As one would expect, non-ESG funds are more inclined to invest in sin stocks when compared to ESG ones, but this difference is never massive, being 1.4% in the aggregate and 1% with reference to oil and gas portfolio holdings. However, such modest differences are quite large in relative terms, at 28.8% and 28.5% when computed as a proportion of the average holdings of the ESG fund. Moreover, these differences in the portfolio shares of ESG stocks did visibly grow over time, for instance, from 1% in 2010 to 2.7% in 2022 for the aggregate, and from 0.9% to 2.5% in the case of oil and gas. In summary, although self-designated ESG mutual funds seem to find sin stocks less attractive, and this lack of appeal seems to have grown over time, the very fact that, as of the end of 2022, ESG funds could be investing 1.7% (1.2%) of their portfolios in sin (oil and gas) stocks may be surprising and indeed hides some lingering pockets of green washing.
2.3. Econometric Modelling
To test whether self-designated ESG funds display a higher overall actual ESG score when compared to non-ESG funds, we employ panel (cross-sectional time-series) regressions. We follow the approach in
Gibson Brandon et al. (
2022), who aim at understanding if PRI signatories exhibit higher objective portfolio ESG scores, to detect greenwashing. To perform a panel regression instead of a simpler pooled OLS regression turns out to be crucial, because even though the majority of the mutual funds exist throughout the entire sample period, we do not drop the funds with an incomplete history, with the result that the data set fails to be balanced. Yet, this is crucial to avoid any survivorship bias that would unduly lessen the influence of the funds that drop from the data set because they were unsuccessful and, in particular, of the funds that were created over our sample period as a result of the sustainable finance movement. An explicit panel approach is flexible enough to also account for the dynamics of the fairly new asset class of ESG funds, with new funds being created, and older, non-ESG funds being re-purposed, during our sample period.
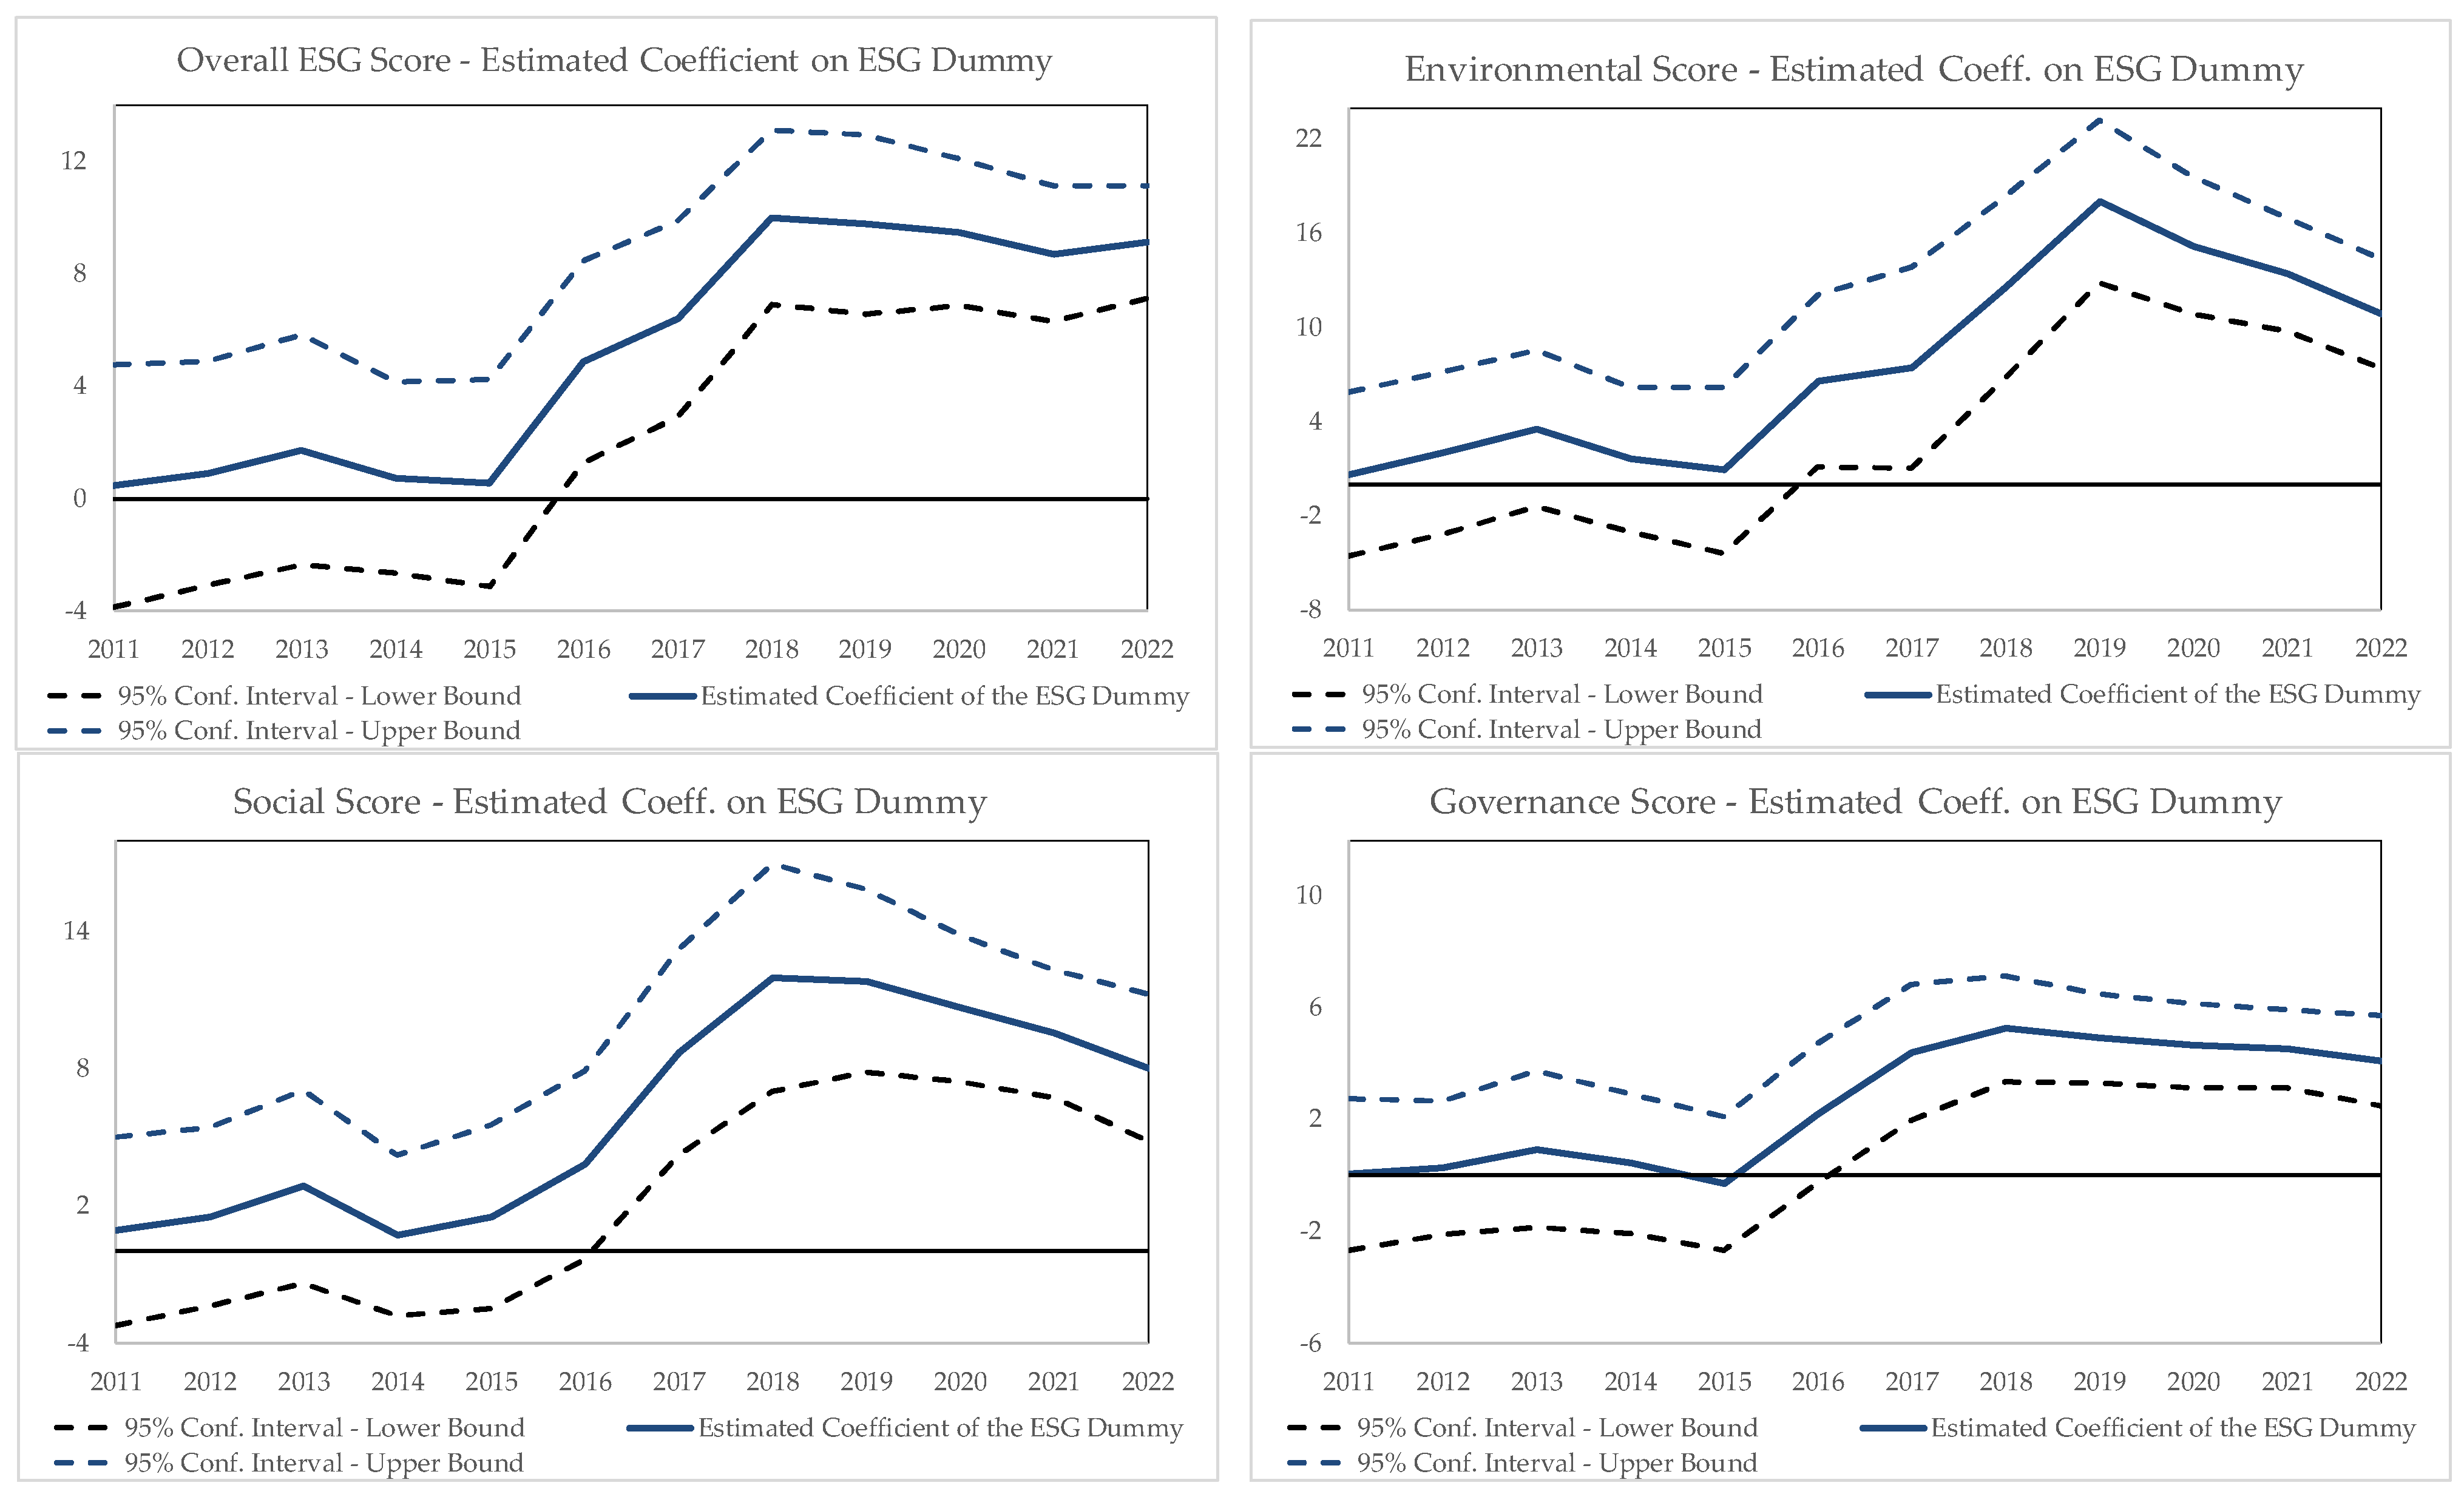
However, to also assess how ESG funds’ objective behavior in the sustainability space has changed and developed over time, we estimate separate, cross-sectional regressions at an annual frequency and proceed to aggregate the annual results in two sets, based on 2011–2016 and 2017–2022, respectively. We select this breakdown of our sample period because, in light of the literature (see
Ammann et al. 2019;
Gibson Brandon et al. 2021), we expect the strongest change in ESG funds’ ESG performance to occur in 2016–2017.
Under both statistical frameworks, to detect potential greenwashing, we regress the weighted ESG score (dependent variable) using a variable capturing a fund’s ESG self-designation. The fund’s ESG self-designation is denoted by the ESG dummy, which takes the value of 1 for a self-designated ESG fund and 0 otherwise. The key result variable is the coefficient of the ESG dummy variable; when this takes a significant positive value, it can be concluded that greenwashing cannot be detected. Apart from the ESG dummy coefficient, we place special emphasis on the estimates of the coefficients of variables related to the fund type, as previous studies have found it exercises a strong influence on the occurrence of greenwashing (see
Hartzmark and Sussman 2019;
Kaustia and Yu 2021;
Gibson Brandon et al. 2021).
The analysis is further finetuned to use the weighted Environmental, Social, and Governance scores as separate dependent variables. Such a step makes sense from two perspectives. First, because each sub-score fails to be aggregated into an overall ESG score according to a simple, linear scheme: in the case of each stock, each sub-score is weighted depending on the materiality of the industry the firm belongs to. Additionally, the aggregate ESG score has a controversy score integrated into it; the sub-scores do not. Second, because the question of whether self-designated sustainable mutual funds care more for any of the dimensions of the ESG spectrum is of interest on its own.
To ensure that our results are in no way driven by omitted variables, we control for fund characteristics (i.e., the fund type in terms of customers it preferentially caters to) and other portfolio characteristics (i.e., the number of stock holdings as well as the natural logarithm of total net asset values and fund coverage).
Liang et al. (
2021) and
Gibson Brandon et al. (
2022) use similar control variables when investigating the actual sustainability performance of self-defined ESG funds. To account for potential time-invariant differences across funds, and consistent with prior studies on greenwashing, we also specify time fixed effects. Standard errors are double-clustered at the fund and year level. The analysis includes 17,071 observations over a sample period of 12 years.
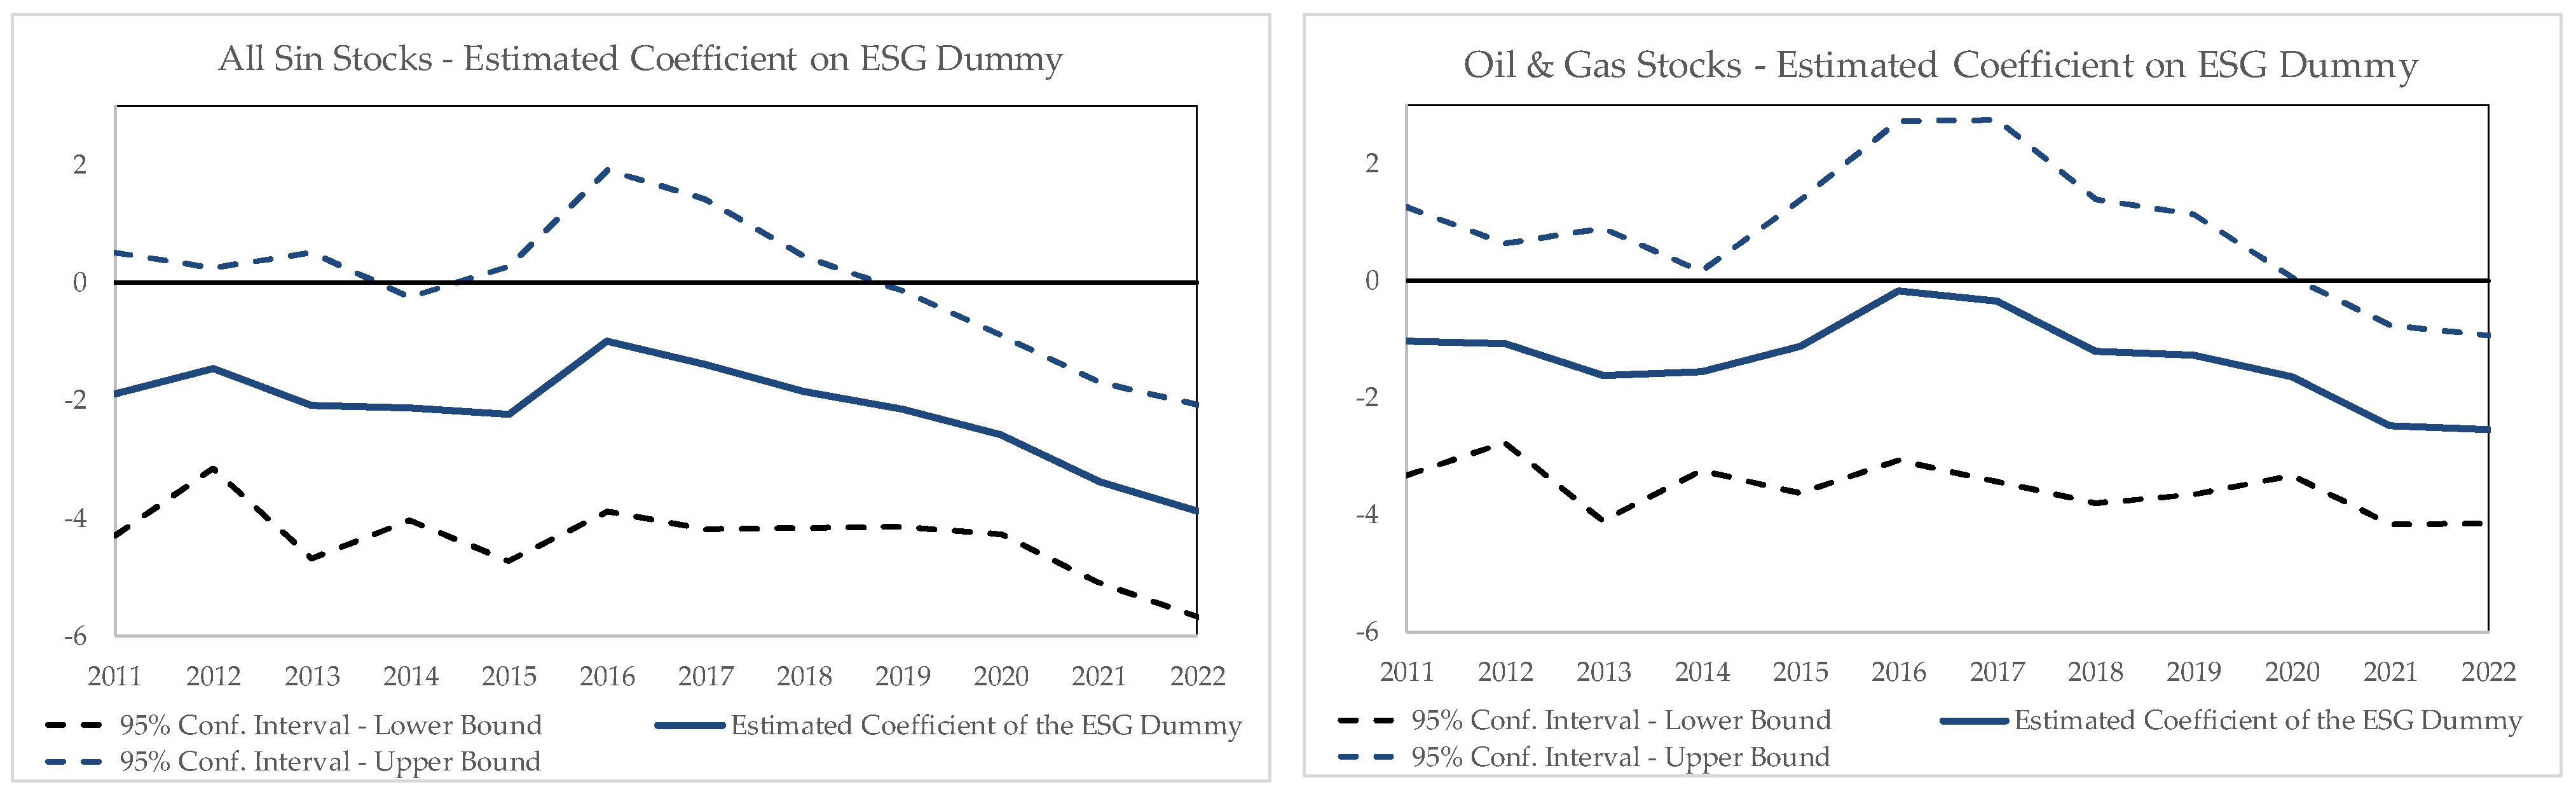
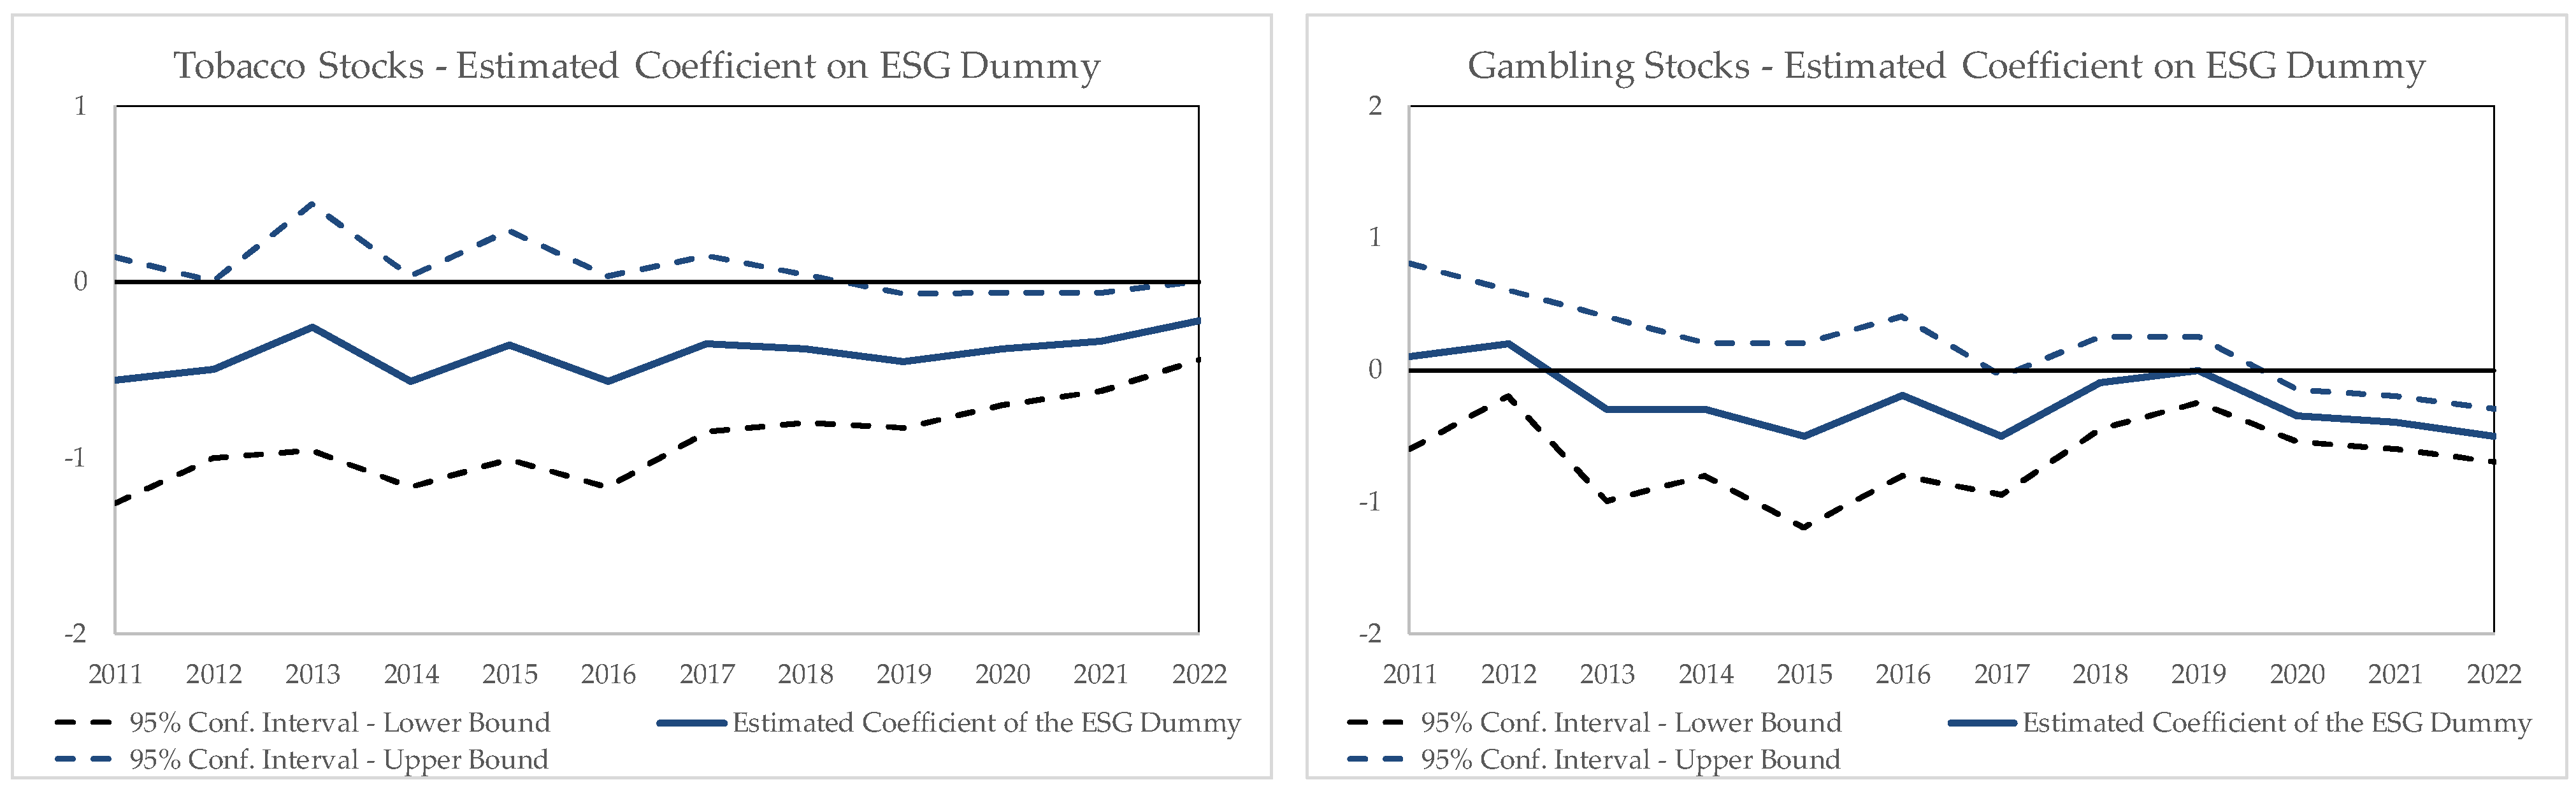
To account for self-designated ESG funds that use negative screening as a key ESG fund strategy, we also analyze the impact of self-designation on the share of sin stocks in a fund’s portfolio. To this aim, we use panel regressions with the same control variables and time-fixed effects to understand whether self-designated ESG funds carry significantly lower shares of sin stock holdings than non-ESG funds. Also in this case, the key result variable is the ESG dummy coefficient; a negative, significant coefficient signals a lower share of sin stocks (as an aggregate or of specific types) in a self-designated ESG fund, which is consistent with ESG funds applying more intense screening for sustainability. The dependent variable in this application is Sin-Stocks_w, defined as the sum of the weights of the different sin stock sub-categories (i.e., oil and gas, tobacco, and gambling, with any small differences due to the presence of the firearms production industry). Once more, we perform several empirical exercises using the specific sin sub-categories to gain deeper insights into the drivers of sin stock ownership by US equity mutual funds.
4. Discussion and Conclusions
In this paper, we used panel regressions and sequences of yearly cross-sectional regressions to investigate whether there is evidence of greenwashing in the portfolio choices concerning sin stocks and in the ESG scores attained by US active equity mutual funds that elect to self-characterize as ESG-driven (by labelling themselves as sustainable, green, or other equivalent tags). We find evidence of moderate differences in the portfolio choices of self-declared ESG vs. non-ESG US equity mutual funds. Self-declared ESG funds tend to invest, on average, in stocks with higher ESG ratings than non-ESG ones. Moreover, they tend to shun sin stocks to a larger extent than non-ESG funds. Hence, our empirical tests rule out extreme, complete greenwashing, in which there would exist no difference in the portfolio choices of ESG and non-ESG mutual funds, but fail to reject the conjecture of the existence of potentially important “pockets” of greenwashing in our data.
In the light of the results obtained over time using cross-sectional regressions estimated on an annual basis, it is also reasonable to conclude that greenwashing may have been prevalent among self-designated ESG funds during the early years covered in our analysis. The significant change observed from 2017 onwards is likely linked to the introduction of the Morningstar Sustainability Fund Rating methodology (see
Ammann et al. 2019). The introduction of Morningstar’s methodology revolutionized the ESG fund industry by providing the first fund-level rating system, helping investors identify whether funds engaged in greenwashing. As a result, many self-designated ESG funds may have ceased their greenwashing practices as they became publicly exposed. Supporting evidence in
Hartzmark and Sussman (
2019) shows that with the introduction of Morningstar Sustainability Fund Rating scores, investors began shifting their investments towards highly rated ESG funds. For instance, funds with a Morningstar Globe rating of five, representing the top 10% rated ESG funds, saw an additional inflow of 4% of their fund size in the subsequent 11 months after receiving the rating. Investors seemed to have gradually learnt about ESG investing, which could explain why it took time to observe a significant improvement in the alignment between ESG self-designations and actual ESG performance, starting in 2017. Additionally,
Kaustia and Yu (
2021) suggest that investors began recognizing greenwashing funds and stopped investing in them around 2018. In fact, they reported that self-designated ESG labels ceased to attract abnormally high inflows for funds. In our paper, we contribute to this literature by providing a statistical measurement of the impact of these institutional and cultural shifts for two key aspects: (i) the partial, conditional correlation between the sustainability quality and weighted ESG rating of fund portfolios and their self-designation as ESG-driven, and (ii) the partial correlation between any remaining attractiveness associated with sin stocks and the self-designated ESG nature.
Interestingly, when we dissect the funds’ actual, ownership-implied ESG scores, so that we can observe distinct Environmental, Social, and Governance scores or separately examine the influence on portfolio allocations of the three primary categories of sin stocks (oil and gas, tobacco, and gambling), we find that results of the same or even greater strength are obtained at the intersection between Environmental scores and the shares invested in oil and gas stocks. This can be taken as evidence of a particular sensitivity of financial markets and mutual funds to environmental issues and the prospective challenges posed by climate change.
Arguably, the results reported are more pronounced and robust, and often more accurately estimated, when the variables of interest are the actual, implied ESG scores, in contrast to the empirical findings related to investments in sin stocks. However, this outcome can be expected for two reasons: first, various GSIA reports have demonstrated that negative screening served as the primary ESG investment strategy until 2018, after which it was supplanted by a more comprehensive integration of sustainability into the primary fund allocation strategies. Second, the impact of the Morningstar Fund Sustainability Rating system introduction may not have significantly affected ownership shares in sin stocks because negative screening generally contradicts Morningstar’s philosophy.
In summary, our findings indicate a distinct shift towards greater sustainability within the mutual equity fund industry. Notably, this trend is not exclusive to self-labeled ESG funds; all types of funds have enhanced their ESG ratings and reduced their investments in sin stocks. The number of self-labeled ESG funds has continued to rise in recent years, and importantly, most of these ESG funds, on average, appear to genuinely adhere to their claims of prioritizing sustainable investing. Consequently, they demonstrate significantly higher actual ESG scores in their portfolio holdings. Moreover, we are witnessing a noticeable reduction in sin stocks within their portfolios.
Despite the strong progress shown in our findings, it remains questionable whether these results definitively rule out the occurrence of greenwashing among US active equity mutual funds. First, while, as discussed in the Introduction, it is clear what extreme greenwashing or the decline in its extent imply for the type of data investigated, it still remains uncertain whether moderate greenwashing can be discerned from the same analysis. This also applies to situations where some degree of greenwashing may persist in the behavior of mutual funds. The challenge lies in our inability to derive a precise, actionable measure of greenwashing from our empirical results. What can be ascertained, however, is that extreme greenwashing is unlikely, and that it has seen a consistent decline since at least 2017–2018. This conclusion echoes the main point in
Dumitrescu et al. (
2022). Second, the data show a left long tail, indicating that even though, in overall terms, on average the self-labelled ESG funds performed better than non-ESG funds in the sustainable investment dimension, an undeniably large number of ESG funds did not. In fact, a fifth of all ESG funds have a lower ESG score than the mean of the non-ESG funds. All in all, our results show that even though the industry is not “rife with greenwashing”, as some might suggest, greenwashing cannot yet be disregarded altogether. Even though it is encouraging to observe that, on average, US equity mutual funds have increasingly adhered to their sustainability pledges and hence refrained from exploiting the investors’ inclination towards environmentally conscious investments, our findings emphasize the pivotal role of policymakers. A centralized oversight would have the power to steer the ESG landscape towards a more transparent and regulated disclosure framework, for instance, by establishing comparable ESG scoring metrics and rules. In fact, the enforcement of stringent regulations on when and how financial institutions can adopt ESG or sustainability labels would mitigate the potential for greenwashing; see, e.g., the discussion in
Curtis et al. (
2021).
Needless to say, all these intriguing insights and empirical findings have been mediated by a number of very precise choices, and it remains unclear whether their removal or replacement may affect them and to what extent. For instance, our analysis is entirely based on US mutual fund data; it would be interesting to test whether similar results may also characterize mutual funds globally (see, e.g.,
Lesser et al. 2014). Whether some of the conclusions offered in this paper may represent the basis for new methodologies to detect and measure greenwashing is also left to future research (see
Lapinskienė and Danilevičienė 2023) for one such example in which the “greenness” of the firms receiving funds is not the only element to be optimally assessed). Moreover, many rating providers will be able to supply ratings on much finer aspects and categories (besides Environmental, Social, and Governance elements) than those used in this paper. It would be interesting to explore whether any residual pockets of greenwashing were to remain with reference to some of these categories. While the CRSP Mutual Fund data represent a standard yardstick in the financial economics literature, many important rating providers exist besides Thomson Reuters Refinitiv. In this paper, we ignored the effects of self-identification of funds as ESG entities on their realized performance. For instance, after having identified a mismatch between a manager’s ESG signal and a fund’s ESG rating,
Candelon et al. (
2021) analyze the financial performance of a panel of US and European funds, finding a negligible impact of SRI signaling by fund managers (see also
Rehman and Vo 2020). Moreover, it is well known that different raters often tend to assign quite heterogeneous scores to the same firm; see, for instance,
Berg et al. (
2022). Concerns about ESG data quality persist, and issues include a lack of relevance and materiality, inaccuracies, reliability problems due to self-assessment by companies, and a lack of comparability due to misaligned standards (see
Jonsdottir et al. 2022). In fact, it is apparent that using different providers may yield rather heterogeneous conclusions in standard financial applications; see, e.g.,
Berg et al. (
2023) and
Berk et al. (
2023).


