Article

Financial Literacy Confidence and Retirement Planning: Evidence from China

1
Department of Finance, School of Economic and Management, Tsinghua University, Beijing 100084, China
2
China Insurance Institute, Department of Insurance, School of Finance, Renmin University of China, Beijing 100872, China
*
Author to whom correspondence should be addressed.
Risks 2023, 11(2), 46; https://doi.org/10.3390/risks11020046
Submission received: 5 December 2022 / Revised: 30 January 2023 / Accepted: 7 February 2023 / Published: 15 February 2023
(This article belongs to the Special Issue Frontiers in Quantitative Finance and Risk Management)

Abstract

:
Though ample empirical evidence demonstrates the relationship between objective financial literacy and retirement planning, we have a limited understanding of the role of individuals’ subjective financial literacy in their retirement planning. In this study, we examine how individuals’ financial literacy confidence bias affects their retirement planning behaviors using survey data in China. Based on the difference between respondents’ subjective and objective financial literacy from survey data, we construct measures of individuals’ financial literacy overconfidence and underconfidence for empirical analysis. Our results document the critical role of individuals’ assessment of financial literacy in their retirement planning. We find that individuals’ financial literacy overconfidence (underconfidence) significantly promotes (demotes) their retirement planning behaviors.

1. Introduction

Financial literacy is critical for individuals’ preparation for retirement who are taking increasing responsibility for their retirement nowadays. Existing studies have investigated the reason for individuals’ under-planning or under-saving for retirement and found an important relationship between people’s financial literacy and their retirement planning behaviors. Prior work has demonstrated that those who are objectively less financially literate prepare less for their retirement and amass less retirement wealth in many countries (Behrman et al. 2012; Lusardi and Mitchell 2011b, 2011c; Lusardi 2008).
The concept of financial literacy is well-established in the literature. Generally, financial literacy refers to an individual’s ability to understand and effectively use various financial skills. Many studies have well identified the important relationship between financial literacy and household financial behavior, including investment, saving, and retirement planning. To evaluate individuals’ financial knowledge, respondents are often asked three questions covering fundamental concepts of economics and finance, such as simple calculations about interest rates, inflation, and risk diversification. These three questions on financial literacy (often known as the “Big Three”) have become standard in measuring financial literacy and are included in many surveys worldwide (Lusardi and Mitchell 2006). For example, the Big Three were adopted in the Health and Retirement Study (HRS), a U.S. nationally representative longitudinal dataset.
Financial literacy has been found to affect personal and household financial decision-making. This is mainly because financial decisions related to asset investment or debt management require individuals to understand the basics and perform calculations. Though surveys worldwide have documented varying level of financial literacy, studies have commonly linked financial literacy to household financial decisions. In addition to retirement planning and saving, financial literacy is found to affect decisions about household debt, entrepreneurship, and financial investment (Arrondel 2021; Calcagno et al. 2019; Guiso and Viviano 2015; Lusardi 2012; Lusardi and Mitchell 2011a; Stolper and Walter 2017).
Moreover, individuals’ subjective financial literacy is also biased as studies have found mismatches between actual and self-assessed financial knowledge (e.g., Lusardi and Mitchell 2011a). Empirical evidence has revealed that individuals’ optimistic bias toward their financial literacy can affect their financial decisions, such as household saving and investment behaviors (Van Rooij et al. 2012; Xia et al. 2014). However, we have a limited understanding of whether and how individuals’ biased perception, that is, the difference between objective and subjective financial literacy, can affect their retirement planning in addition to the identified effect of objective financial literacy. To this end, this study investigates how an individual’s financial literacy overconfidence/underconfidence bias affects their retirement planning actions with evidence from China. The Chinese pension system consists of three pillars (see, e.g., Fang and Feng (2018) for a comprehensive overview). The first pillar is the public pension scheme, which aims to provide all residents basic social security. The second pillar is employer-sponsored voluntary programs, which is so far of limited scale. The third layer consists of household tax-deferred savings accounts and savings-based annuity insurance policies. Generally, the first and second pillars provide insufficient coverage and the third pillar is important for personal retirement preparations.
In our analysis, financial literacy overconfidence is measured by the difference between an individual’s subjective and objective financial literacy scores. The survey contains questions on respondents’ subjective evaluation of preparedness and awareness of retirement planning, and also measures their actual preparation actions by asking whether they have participated in private pensions and purchased variable annuity products. Thus, our study design brings insights into the effect of financial literacy bias on individuals’ retirement planning.
The main contribution of this paper is that we find the effect of financial literacy overconfidence and underconfidence on individuals’ retirement planning and preparation actions. Our empirical results suggest that respondents with more confidence in their financial knowledge have a higher propensity to plan and take actual actions for retirement. Moreover, individuals who are underconfident about their financial literacy are less likely to plan for retirement well. This finding based on the evidence of China contributes to the growing literature on financial literacy and its effect on individuals’ retirement planning.
The second contribution is our supplement to the literature with Chinese evidence of the relationship between financial literacy and retirement planning. In our sample, a considerable proportion of respondents display a lack of financial knowledge but tend to be optimistic about their financial knowledge. Our empirical result also confirms the widely-acknowledged finding that individuals’ objective financial literacy contributes to their retirement planning.
The remainder of the paper proceeds as follows. Section 2 summarizes the related literature. Section 3 presents the survey data and introduces the measurements. Section 4 analyzes the relationship between financial literacy, overconfidence, and retirement planning. Section 5 concludes.

2. Literature Review

Our work is linked to two main streams of the literature. The first strand is the well-established literature on the relationship between financial literacy and retirement planning. The most common measure of financial literacy is based on the surveys first proposed by Lusardi and Mitchell (2011c), which was part of the 2004 Health and Retirement Study (HRS). Lusardi and Mitchell (2007a, 2011c) were pioneers in finding that financial knowledge is directly related to retirement planning; those who display a higher level of financial knowledge are more likely to plan and succeed in their planning. Using the database of the Rand American Life Panel (ALP), Lusardi and Mitchell (2007b, 2017) confirmed the positive relationship between knowledge of financial matters and retirement planning. Since then, this relationship has also been investigated in many countries other than the U.S., such as Finland, Italy, German, Japan, and Sweden (Almenberg and Säve-Söderbergh 2011; Bucher-Koenen and Lusardi 2011; Fornero and Monticone 2011; Sekita 2011). For instance, evidence from Finland showed that financial literacy measured with some extended questions in addition to the basic financial literacy questions positively affects retirement planning (Kalmi and Ruuskanen 2018). Some recent works also have identified more evidence from other countries such as Ghana, India, Slovakia, and Switzerland (Agarwal et al. 2015; Brokesova et al. 2017; Cupák et al. 2019; Kendzia and Borrero 2022; Sarpong-Kumankoma 2021).
Second, our work joins long-standing discussions on financial literacy and household financial behavior. Financial literacy is unbalanced in different genders, regions, and countries (Bucher-Koenen et al. 2017; Bumcrot et al. 2013; Karakurum-Ozdemir et al. 2019; Reiter and Beckmann 2020). For example, Reiter and Beckmann (2020) studied the financial literacy in the region of Central, Eastern, and Southeastern Europe. In addition, many studies linked financial literacy to household financial decisions. For example, Brown and Graf (2013) found that Swiss household financial literacy is strongly correlated with financial market participation, voluntary retirement saving, and mortgage borrowing; Kurowski (2021) showed that during the COVID-19 crisis people who have a higher debt literacy are better prepared to manage credit liabilities. More evidence can be found in financial decisions about household debt, entrepreneurship, and financial investment (Arrondel 2021; Arrondel et al. 2015; Calcagno et al. 2019; Guiso and Viviano 2015; Lusardi 2012; Stolper and Walter 2017).
The third strand of literature deals with overconfidence and its effect on financial behaviors. On the one hand, overconfidence has long been found to affect various investment decisions in the finance literature (Barber and Odean 2001; Grinblatt and Keloharju 2009; Malmendier and Tate 2005). For instance, Barber and Odean (2000, 2001) find that overconfident investors trade excessively and end up with lower returns. Grinblatt and Keloharju (2009) provided evidence that overconfidence promotes a tendency in stock market trades. On the other hand, financial literacy overconfidence is a specific form of overconfidence, referring to an individual’s self-assessed financial literacy exceeding the actual level. Limited existing literature has linked people’s financial literacy overconfidence to some financial decision behaviors (Glaser and Weber 2010). For example, financial literacy overconfidence was found to be positively correlated with people’s stock market participation and vice versa (Chu et al. 2017; Xia et al. 2014). Moreover, Van Rooij et al. (2012) identified that individuals with higher subjective financial literacy were more likely to actively plan for retirement.

3. Data and Description

Our study is based on a proprietary survey dataset. In 2018, the China Center for Insurance and Risk Management of Tsinghua University and Aegon Center for Longevity and Retirement jointly conducted a nationwide online retirement readiness survey. These survey data include 1432 individuals aged 25–65 from all provinces in China and is representative in terms of gender, age, and province.1

3.1. Objective Financial Literacy

The survey contained seven questions that measured respondents’ objective financial literacy. The famous ‘Big Three’ financial literacy questions proposed by Lusardi and Mitchell (2011c) were incorporated. Among the ‘Big Three’ questions, the first two questions measure respondents’ ability to perform simple interest calculations and understand the effect of inflation, and the third question evaluates the knowledge of risk diversification, which is crucial to making informed investment decisions. To further evaluate the respondents’ other financial knowledge, four additional questions were asked in the survey, covering fundamental concepts of mortgage repayment, bond pricing, and simple calculation of income tax. In our empirical design, the variable of objective financial literacy (objective FL) is derived by adding together the number of all correctly answered questions and has a theoretical range of 0–7. The precise wording of all objective financial literacy questions is given in Table 1.
Summary statistics of responses to these questions appear in Table 2. Approximately 31.7% of respondents could correctly answer the Big Three questions. This number is close to that in the U.S. (35%) and Japan (26.9%). Specifically, 78% correctly answered the interest rate question, approximately 72% of respondents answered the inflation question correctly, and another 43% could answer the risk diversification question. In addition, among all the respondents, only 5.1% answered all seven questions correctly. These are discouragingly low numbers in view of the complex financial decisions that individuals confront in the current economic environment.

3.2. Subjective Financial Literacy Measurement

In order to measure respondents’ self-assessment of their own financial knowledge, the survey asked about subjective financial literacy. The respondents’ subjective financial literacy (subjective FL) is measured by asking: “On a scale from 1 to 5, where 1 means very incapable and 5 means very capable, how would you assess your overall understanding of financial matters when you prepare for retirement?” Thus, the value of the subjective FL variable varies within the range of 1–5.
Although many respondents perform poorly in their responses to the objective financial literacy questions, as just described above, they tend to believe they do rather well. Around two-fifths (70%) award themselves the top knowledge scores (4 and 5), only 4% give themselves failing marks (1–2), and the other 27% perceive themselves to be at a medium level (3). That is, almost 70% of respondents believe they are above-median with regard to financial knowledge, which is in great contrast to the findings on the respondents’ actual financial knowledge.
Figure 1 shows the distribution of subjective and objective financial literacy scores. The area of each circle is proportional to the number of subjects with that value. It is obvious that there are more people in the upper left area than in the bottom right part, indicating a higher percentage of overconfidence in our sample.

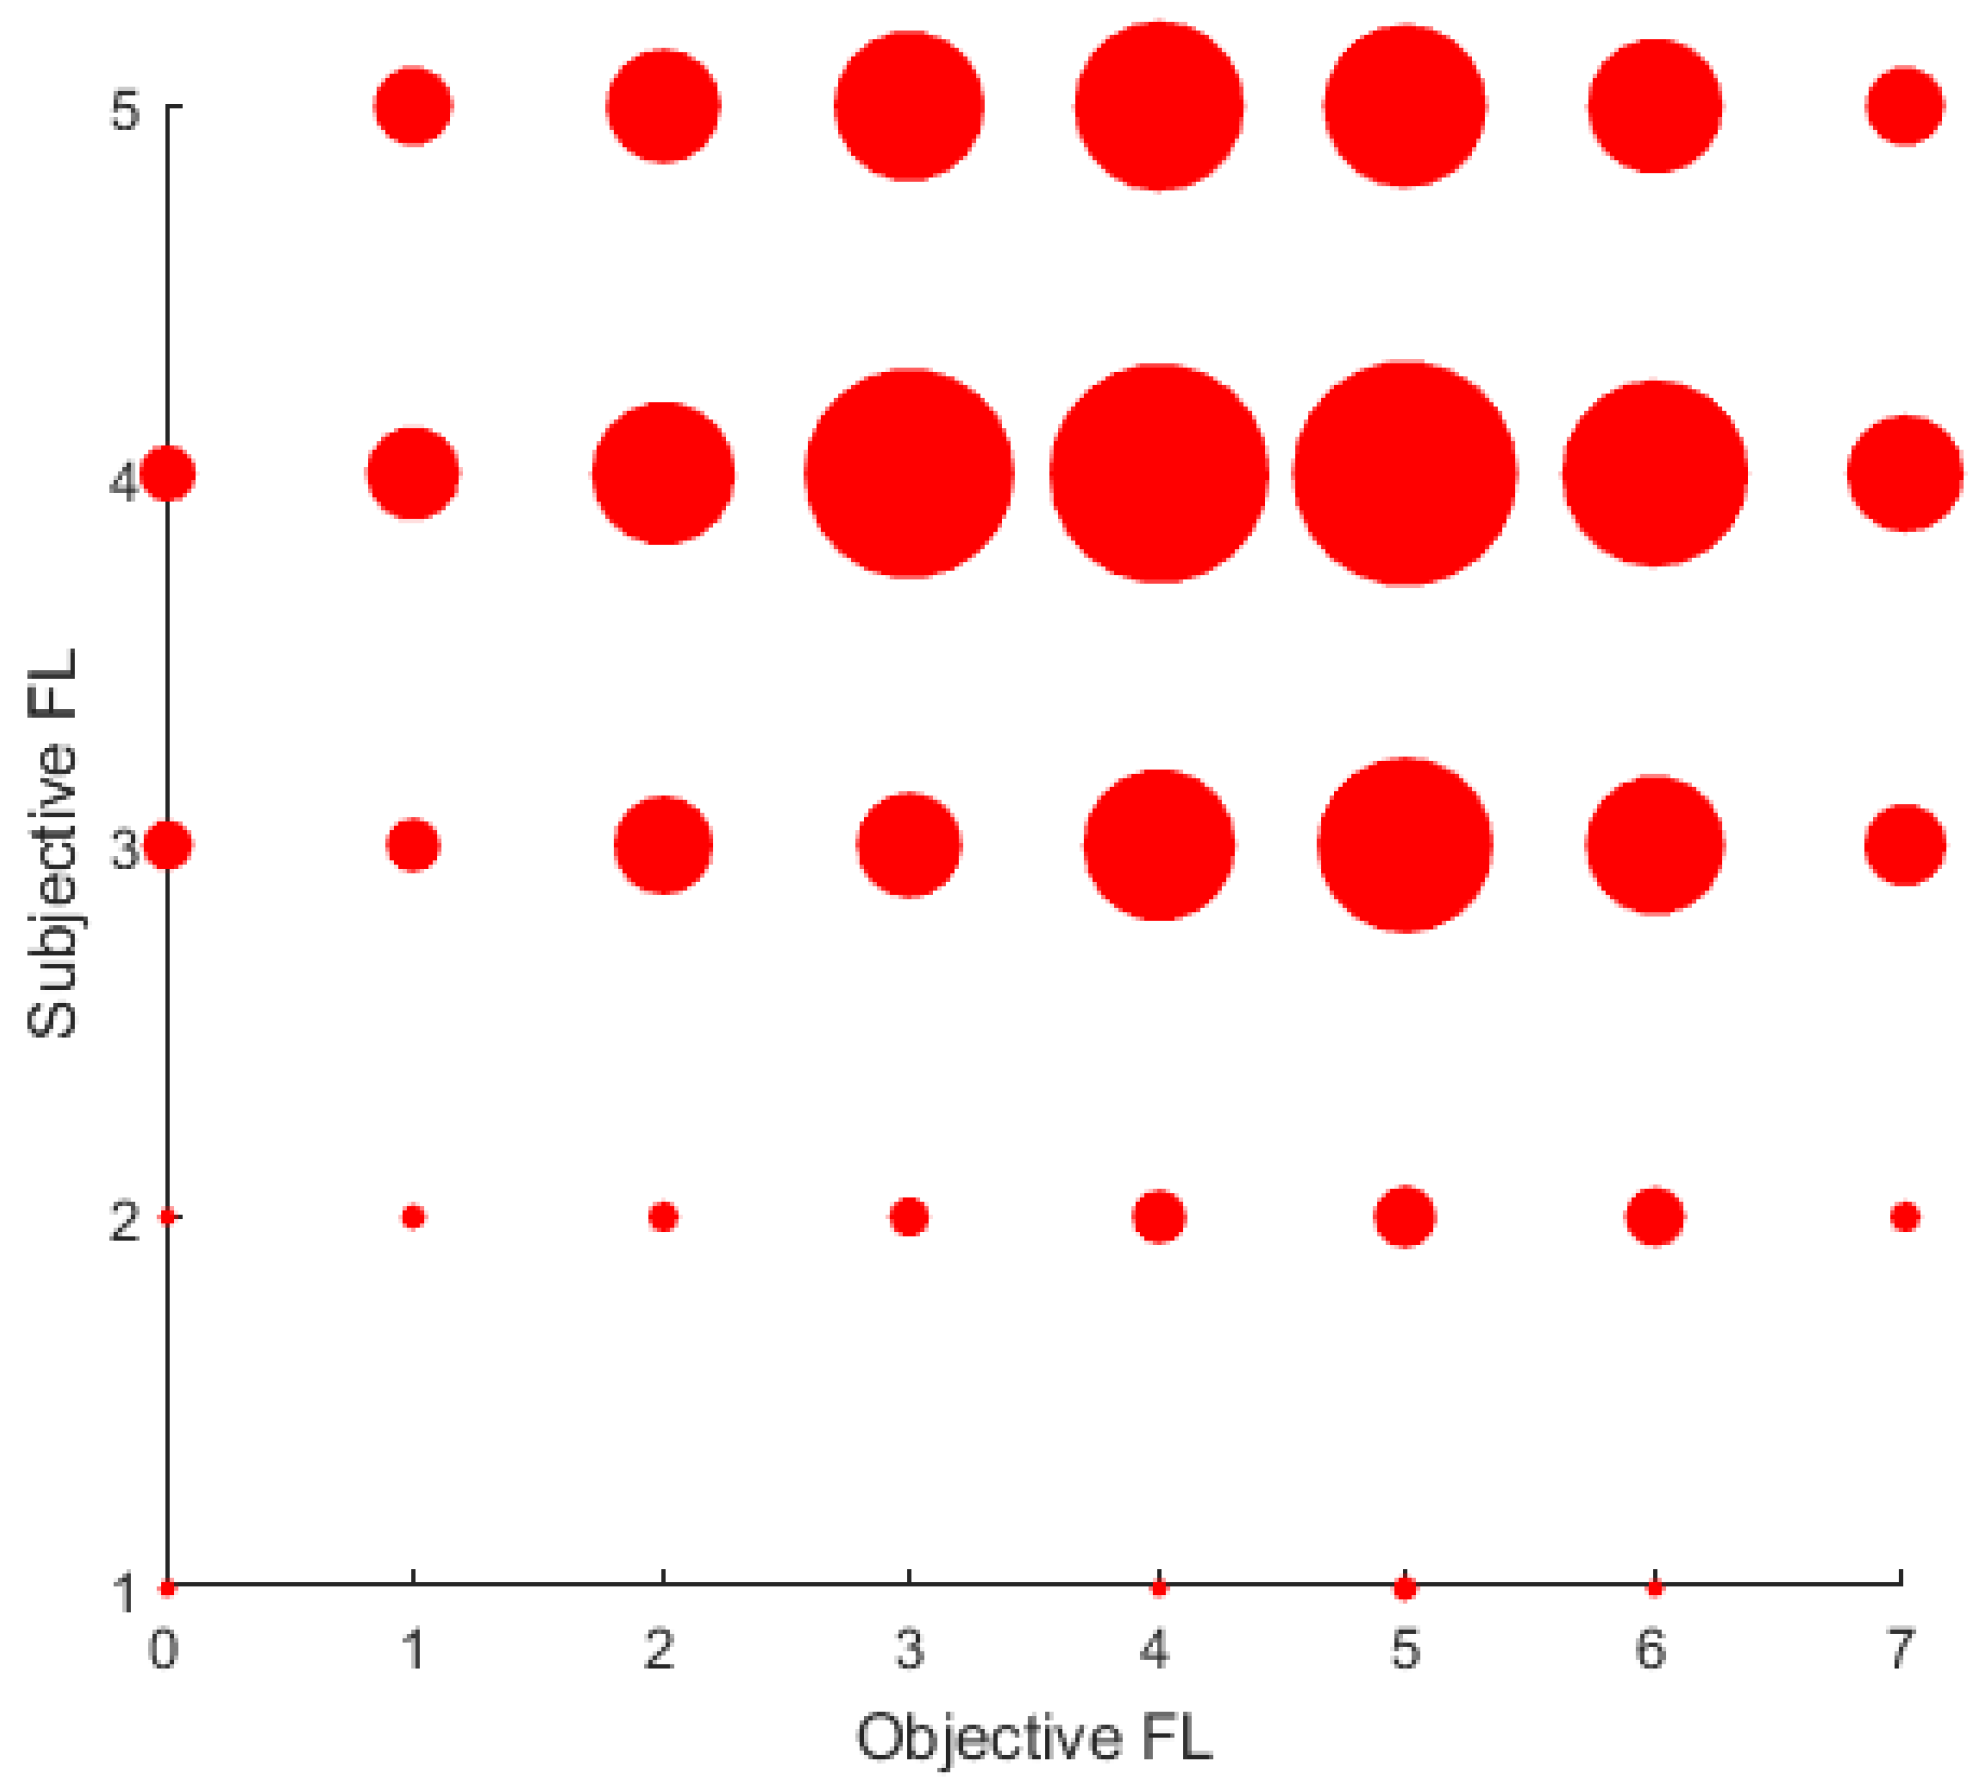
3.3. Financial Literacy Overconfidence and Underconfidence

The comparison between the results of objective and subjective financial literacy reveals that people tend to be overconfident about their financial literacy. It is meaningful to quantify this difference between perceived and actual financial knowledge. Consistent with Xia et al. (2014), we measure FL overconfidence by the difference between respondents’ subjective and objective financial literacy scores.
Due to the scale difference, the self-assessed and objective financial literacy are not directly comparable. In this study, the concept of financial literacy overconfidence (FL overconfidence) refers to the phenomenon that some respondents perform poorly (below average) in their responses to objective financial concepts but believe they do rather well (above average). The opposite of overconfidence is financial literacy underconfidence (FL underconfidence), referring to respondents’ subjectively underestimating their financial literacy. Both variables are binary dummies taking the value of 1 if the respondent is overconfident or underconfident, respectively, and 0 otherwise. Thus, the introduced FL overconfidence and underconfidence capture the mismatch between the respondent’s perceived and actual financial knowledge.
Figure 2 reports the respondents’ types of FL confidence. In Figure 2, the means of subjective FL (3.957) and objective FL (4.209) jointly divide the graph into four regions, each representing a different type of observation. The respondents in Region II are overconfident about their financial literacy, who have a below-average objective FL but subjectively believe to possess an above-average financial literacy. Conversely, the respondents in Region IV, being underconfident about their financial literacy, have above-average objective FL scores but below-average subjective FL scores. We are interested in respondents in Regions II and IV. The overconfidence FL (underconfidence FL) dummy equals one for participants in Region II (Region IV), and zero otherwise.
To determine which sub-groups are more confident about their financial knowledge, we compare the overconfidence of each group, as indicated in Table 3. The statistics show that the relationship between FL overconfidence and age is a U-shaped curve. Those in the group aged 40–49 are the most modest, and those younger or older are more overconfident. Table 3 also shows that FL overconfidence is negatively correlated with educational attainment. The least financial literacy overconfident are those who lack a college degree; only about one-third of such respondents could answer the risk diversification question correctly. The percentage of FL overconfidence decreases with the education level, and this number is reduced to 31.3% for the groups with postgraduate degrees (master’s and Ph.D.). This interesting observation shows that financial literacy overconfidence is related to an individual’s education to a large extent. Those who are more highly educated have a better understanding of their financial capability.

3.4. Retirement Planning Measurement

The main interested aspect of this study is retirement planning. Retirement planning is an inherently complex task since the planner needs to collect and process a lot of information. It is hard to comprehensively measure an individual’s retirement planning level with a single question. The survey contained measures that consider both the self-assessment and effective behaviors of respondents’ retirement planning.
The survey contained questions on retirement planning that about asked both the respondents’ self-perception of retirement preparation and actual behaviors. First, the existing literature commonly adopts questions to elicit respondents’ self-perception of their retirement planning wellness, see, e.g., Alessie et al. (2011), Lusardi and Mitchell (2011a, 2017) and Sekita (2011). The survey contained two questions measuring how well respondents have prepared their retirement plans. Second, in addition to these two questions on respondents’ subjective assessment of retirement planning, the survey asked about the respondents’ actual behaviors including joining private pensions and purchasing variable annuity products. The exact wording of the retirement planning questions is given in Table 4.
These four questions asked about the respondent’s retirement planning from perspectives of acknowledging, planning, and actions. Questions 1 and 2 are based on the respondent’s perception and self-assessment to some extent and measure the planning and acknowledging aspects of retirement planning. Questions 3 and 4 supplement the measurement by asking about actions related to retirement preparation.
The responses to the retirement-planning questions appear in Table 4. It shows that around 76% of respondents have a plan for their retirement, but only approximately 13% have written down their plan. The percentage of respondents who do not have any plan for retirement is around 24%. Most people believe they have a good idea of the total value of their retirement assets (levels 4 and 5), and only less than 30% of respondents think they are not well aware of the savings and investments for retirement.
As for the actual actions taken by the respondents to prepare for retirement, around 44% of the respondents have participated in a private pension, which is explained as pension sources other than the national public pension. Moreover, it is not surprising to find that only 8% have purchased a variable annuity as the market of variable annuities is rather limited due to its high investment threshold. Hence, from the simple observation, we can draw the conclusion that there are more planners who have drafted a plan than those who have turned their retirement plans into real actions.

4. Empirical Analysis

4.1. Regression Model

Our regression design aims to examine whether individuals’ confidence in financial knowledge might assert an independent effect on their retirement planning behaviors. The literature on financial literacy and retirement planning commonly adopts one-wave survey data and multivariate ordinary least squares (OLS) or Probit regression models (Almenberg and Säve-Söderbergh 2011; Bucher-Koenen and Lusardi 2011; Chu et al. 2017; Fornero and Monticone 2011; Lusardi and Mitchell 2011a; Sekita 2011). This stream of the literature commonly adopts the survey data and directly links an individual’s retirement planning to financial literacy.2 Based on the regression of these related studies, we performed a regression analysis of the relationship between retirement planning and financial literacy. The main regression model is as follows:
Retirement planning = α + β1 FL overconfidence + β2 FL underconfidence
+ β3 Objective FL + γ·controls + Fixed effect + ε.
The dependent variables indicate readiness for retirement planning. The four adopted dependent variables can be classified into two categories: 1. the respondent’s retirement planning assessment; and 2. the retirement planning actions. The OLS regression is applied to the former two self-assessment retirement-planning variables; the Probit regression is used for the latter two since the dependent variables are binary. The list of controls includes objective financial literacy, age, gender, and marital status; other controls include income levels, region of residence, and educational attainment. Table 5 and Table 6 provide the definition and summary statistics of the regression variables, respectively.

4.2. Main Results

We ran the regressions to investigate how FL overconfidence additionally affects an individual’s retirement planning. Table 7 reports the regression results with the dependent variable of respondent’s retirement planning assessment; Table 8 reports the results of Probit regressions for the binary dependent variables that indicate specific financial actions in preparing for retirement. Consistent with the findings in prior studies, the coefficients of the objective financial literacy in both Table 7 and Table 8 are significantly positive. This means that those who answered more questions correctly are more likely to plan for retirement and take actual preparation actions. Thus, our evidence using the data of 2018 provides a new dataset for checking the method and relationship between financial literacy and retirement planning. We provide supporting evidence to the findings of existing studies with new evidence from China.
Our primary interest is the effect of FL overconfidence and underconfidence. Both Table 7 and Table 8 have identified the significant impact of FL overconfidence and underconfidence on retirement preparation before and after controlling for financial literacy. In the following, we present and discuss the results of FL overconfidence and underconfidence, respectively.
First, we expect a positive role of FL overconfidence, on the basis of prior findings in the literature. Columns (1) to (3) in Table 7 show that FL overconfidence significantly promotes individuals’ retirement plan preparation with or without controlling for financial literacy. The similar results in columns (4) to (6) also suggest that those overconfident about their financial knowledge are more likely to be aware of the value of their retirement savings and investments. Moreover, the results in Table 8 confirm the finding that FL overconfidence could contribute to individuals’ engagement in actual retirement preparation behaviors after controlling for some variables, including financial literacy. This means that the overconfident group is more likely to join a private pension and purchase a variable annuity. Therefore, these findings indicate that individuals’ high confidence in their financial knowledge motivates them not only to prepare more for making a retirement plan, but also to put the retirement plan into effect.
Second, we expect the opposite effect of FL underconfidence on retirement planning. In contrast to FL overconfidence, the coefficients of FL underconfidence are significantly negative, indicating that individuals’ pessimistic belief about their financial literacy decreases their motivation and actions in retirement planning. Moreover, the coefficients of FL underconfidence in columns (3) and (6) of both Table 7 and Table 8 are significantly negative, without affecting the significant effects of financial literacy and FL overconfidence. This independent effect might be intuitively explained by those individuals who are overly modest about their knowledge and refrain from drafting retirement plans and taking actions such as buying financial products due to their underconfidence.
Last, apart from the role of financial literacy confidence and financial literacy, other variables are also found to affect retirement planning by observing the control variables. First, consistent with much previous literature, personal income positively encourages retirement planning and action-taking, according to our result. Second, while men are not better at making retirement plans than women, they are more aware of their financial status with respect to retirement. Third, in some regressions, education and age are found to promote retirement preparation.
Taken together, our findings show that more-ready planners not only reveal high financial knowledge for retirement planning but also have higher confidence in their level of financial literacy. Therefore, we identify the significant role of subjective financial literacy bias in individuals’ retirement planning, which extends the existing literature’s understanding of the impact of financial literacy.

5. Conclusions

Both subjective and objective financial literacy play effective roles in individuals’ retirement planning. Our study contributes to the limited existing literature on financial literacy and retirement planning, with evidence of financial literacy confidence from China. Our findings suggest that in addition to individuals’ objective financial literacy, their optimistic or pessimistic beliefs about their financial literacy also additionally affect their retirement planning behaviors. Moreover, our dataset allows us to extend examination of retirement planning by taking into account the planner’s actual actions for retirement. Our empirical results show that respondents with more confidence in their financial knowledge display a higher propensity to plan and take actions for retirement. In contrast, individuals who are underconfident are less likely to have better retirement preparation and actual actions. That is, individuals overconfident in FL are more likely to not only have thought about their retirement plan but also take actual actions to prepare for retirement. To sum up, our work confirms the effective role of subjective financial literacy and financial literacy bias in retirement planning.
Our findings may carry some implications for providing financial education programs for retirement planning. As individuals’ overconfidence in their financial ability is beneficial for planning, it may be equivalently important to encourage their confidence in taking actions when educating them necessary financial knowledge. From the government’s perspective of enhancing retirement planning, efforts are needed to provide the planners with basic knowledge for retirement planning and to encourage them to confidently take an active role in retirement planning. Moreover, from the perspective of managers of pension institutions, encouraging individuals’ confidence to take an active role in retirement planning may bring an effective role in addition to their product advertising.
As we have only considered the role of individuals’ overconfidence in their retirement planning, we leave the extension into other insurance products for future research. The investigation of the specific mechanism using household-level data may provide an additional view.

Author Contributions

Conceptualization, data resources and writing, B.C.; methodology, formal analysis and writing, Z.C. All authors have read and agreed to the published version of the manuscript.

Funding

This research was funded by the National Natural Science Foundation of China (Grant No. 72101256) and the MOE (Ministry of Education in China) Project of Humanities and Social Sciences (Project No. 21YJC790016).

Data Availability Statement

The data presented in this study are available on request from the corresponding author. The data are not publicly available due to non-disclosure agreement terms.

Acknowledgments

We thank our research assistant Yao of Xi’an Jiaotong University for her excellent research assistance during the first draft of this work.

Conflicts of Interest

The authors declare no conflict of interest. The funders had no role in the design of the study; in the collection, analyses, or interpretation of data; in the writing of the manuscript; or in the decision to publish the results.

Notes

1
The reason for restricting the respondents to be non-retired and aged between 25 and 65 is to exclude those in the decumulation or education phases. The sample is balanced in terms of gender with slightly more women (men = 49.1%) and geographically representative. For more details on Aegon’s survey design and research approach, refer to the introduction link (https://www.aegon.com/research/our-research-approach/, accessed on 4 December 2022). The Aegon Retirement Readiness Survey is conducted annually in collaboration with nonprofit academic institutes in some countries, including Australia, Brazil, Canada, China, France, Germany, Hungary, India, Japan, the Netherlands, Poland, Spain, Turkey, the United Kingdom, and the United States. The survey covers a wide range of issues, including attitudes and readiness for retirement, maintaining a healthy lifestyle, and lifelong learning to improve long-term resilience.
2
Due to limitations of the data, the existing literature commonly lacks discussion on endogeneity issues and identifications such as exogeous shock.

References

  1. Agarwal, Sumit, Gene Amromin, Itzhak Ben-David, Souphala Chomsisengphet, and Douglas D. Evanoff. 2015. Financial literacy and financial planning: Evidence from India. Journal of Housing Economics 27: 4–21. [Google Scholar] [CrossRef]
  2. Alessie, Rob, Maarten Van Rooij, and Annamaria Lusardi. 2011. Financial literacy and retirement preparation in the Netherlands. Journal of Pension Economics & Finance 10: 527–45. [Google Scholar]
  3. Almenberg, Johan, and Jenny Säve-Söderbergh. 2011. Financial literacy and retirement planning in Sweden. Journal of Pension Economics & Finance 10: 585–98. [Google Scholar]
  4. Arrondel, Luc. 2021. Financial Literacy and French Behaviour on the Stock Market. Numeracy 14: 1. [Google Scholar] [CrossRef]
  5. Arrondel, Luc, Majdi Debbich, and Frédérique Savignac. 2015. Stockholding in France: The role of financial literacy and information. Applied Economics Letters 22: 1315–19. [Google Scholar] [CrossRef]
  6. Barber, Brad M., and Terrance Odean. 2000. Trading is hazardous to your wealth: The common stock investment performance of individual investors. The Journal of Finance 55: 773–806. [Google Scholar] [CrossRef]
  7. Barber, Brad M., and Terrance Odean. 2001. Boys will be boys: Gender, overconfidence, and common stock investment. The Quarterly Journal of Economics 116: 261–92. [Google Scholar] [CrossRef]
  8. Behrman, Jere R., Olivia S. Mitchell, Cindy K. Soo, and David Bravo. 2012. How financial literacy affects household wealth accumulation. American Economic Review 102: 300–4. [Google Scholar] [CrossRef] [Green Version]
  9. Brokesova, Zuzana, Andrej Cupak, and Gueorgui Kolev. 2017. Financial Literacy and Voluntary Savings for Retirement in Slovakia. Research Department, National Bank of Slovakia: Available online: https://ideas.repec.org/p/svk/wpaper/1051.html (accessed on 4 December 2022).
  10. Brown, Martin, and Roman Graf. 2013. Financial Literacy, Household Investment and Household Debt: Evidence from Switzerland. University of St. Gallen Working Paper on Finance 13-1. St. Gallen: University of St. Gallen. Available online: https://www.alexandria.unisg.ch/Publikationen/Zitation/Martin_Brown/219130 (accessed on 12 February 2022).
  11. Bucher-Koenen, Tabea, Annamaria Lusardi, Rob Alessie, and Maarten Van Rooij. 2017. How financially literate are women? An overview and new insights. Journal of Consumer Affairs 51: 255–83. [Google Scholar] [CrossRef]
  12. Bucher-Koenen, Tabea, and Annamaria Lusardi. 2011. Financial literacy and retirement planning in Germany. Journal of Pension Economics & Finance 10: 565–84. [Google Scholar]
  13. Bumcrot, Christopher B., Judy Lin, and Annamaria Lusardi. 2013. The Geography of Financial Literacy. Numeracy 6: 2. [Google Scholar] [CrossRef] [Green Version]
  14. Calcagno, Riccardo, Yan Alperovych, and Anita Quas. 2019. Financial literacy and entrepreneurship. New Frontiers in Entrepreneurial Finance Research, 271–97. Available online: https://www.worldscientific.com/doi/abs/10.1142/9789811202766_0010 (accessed on 22 February 2020).
  15. Chu, Zhong, Zhengwei Wang, Jing Jian Xiao, and Weiqiang Zhang. 2017. Financial literacy, portfolio choice and financial well-being. Social Indicators Research 132: 799–820. [Google Scholar] [CrossRef] [Green Version]
  16. Cupák, Andrej, Gueorgui I. Kolev, and Zuzana Brokešová. 2019. Financial literacy and voluntary savings for retirement: Novel causal evidence. The European Journal of Finance 25: 1606–25. [Google Scholar] [CrossRef]
  17. Fang, Hanming, and Jin Feng. 2018. The Chinese Pension System. National Bureau of Economic Research: Available online: https://www.nber.org/system/files/working_papers/w25088/w25088.pdf (accessed on 8 February 2020).
  18. Fornero, Elsa, and Chiara Monticone. 2011. Financial literacy and pension plan participation in Italy. Journal of Pension Economics & Finance 10: 547–64. [Google Scholar]
  19. Glaser, Markus, and Martin Weber. 2010. Overconfidence. In Behavioral Finance: Investors, Corporations, and Markets. New York: John Wiley & Sons, Inc., pp. 241–58. [Google Scholar]
  20. Grinblatt, Mark, and Matti Keloharju. 2009. Sensation seeking, overconfidence, and trading activity. The Journal of Finance 64: 549–78. [Google Scholar] [CrossRef] [Green Version]
  21. Guiso, Luigi, and Eliana Viviano. 2015. How much can financial literacy help? Review of Finance 19: 1347–82. [Google Scholar] [CrossRef]
  22. Kalmi, Panu, and Olli-Pekka Ruuskanen. 2018. Financial literacy and retirement planning in Finland. Journal of Pension Economics & Finance 17: 335–62. [Google Scholar]
  23. Karakurum-Ozdemir, Kamer, Melike Kokkizil, and Gokce Uysal. 2019. Financial literacy in developing countries. Social Indicators Research 143: 325–53. [Google Scholar] [CrossRef] [Green Version]
  24. Kendzia, Michael Jan, and Yoan Suozzi Borrero. 2022. Financial Literacy among the Youth in Switzerland. Journal of Financial Risk Management 11: 323–41. [Google Scholar] [CrossRef]
  25. Kurowski, Łukasz. 2021. Household’s overindebtedness during the COVID-19 crisis: The role of debt and financial literacy. Risks 9: 62. [Google Scholar] [CrossRef]
  26. Lusardi, Annamaria. 2008. Household Saving Behavior: The Role of Financial Literacy, Information, and Financial Education Programs. National Bureau of Economic Research: Available online: https://www.nber.org/papers/w13824 (accessed on 10 February 2008).
  27. Lusardi, Annamaria. 2012. Numeracy, Financial Literacy, and Financial Decision-Making. National Bureau of Economic Research: Available online: https://www.nber.org/papers/w17821 (accessed on 10 February 2014).
  28. Lusardi, Annamaria, and Olivia S. Mitchell. 2006. Financial Literacy and Planning: Implications for Retirement Wellbeing. Pension Research Council Working Paper 1. Philadelphia: The Wharton School. [Google Scholar]
  29. Lusardi, Annamaria, and Olivia S. Mitchell. 2007a. Baby boomer retirement security: The roles of planning, financial literacy, and housing wealth. Journal of Monetary Economics 54: 205–24. [Google Scholar] [CrossRef] [Green Version]
  30. Lusardi, Annamaria, and Olivia S. Mitchell. 2007b. Financial literacy and retirement planning: New evidence from the Rand American Life Panel. Available online: https://ssrn.com/abstract=1095869 (accessed on 22 February 2008).
  31. Lusardi, Annamaria, and Olivia S. Mitchell. 2011a. Financial literacy and retirement planning in the United States. Journal of Pension Economics & Finance 10: 509–25. [Google Scholar]
  32. Lusardi, Annamaria, and Olivia S. Mitchell. 2011b. Financial literacy around the world: An overview. Journal of Pension Economics & Finance 10: 497–508. [Google Scholar]
  33. Lusardi, Annamaria, and Olivia S. Mitchell. 2011c. Financial Literacy and Planning: Implications for Retirement Well-Being. National Bureau of Economic Research: Available online: https://www.nber.org/papers/w17078 (accessed on 10 May 2011).
  34. Lusardi, Annamaria, and Olivia S. Mitchell. 2017. How ordinary consumers make complex economic decisions: Financial Literacy and retirement readiness. Quarterly Journal of Finance 7: 1750008. [Google Scholar] [CrossRef] [Green Version]
  35. Malmendier, Ulrike, and Geoffrey Tate. 2005. CEO overconfidence and corporate investment. The Journal of Finance 60: 2661–700. [Google Scholar] [CrossRef] [Green Version]
  36. Reiter, Sarah, and Elisabeth Beckmann. 2020. How financially literate is CESEE? Insights from the OeNB Euro Survey. Oesterreichische Nationalbank Focus on European Economic Integration (Austria) 3: 36–59. [Google Scholar]
  37. Sarpong-Kumankoma, Emmanuel. 2021. Financial literacy and retirement planning in Ghana. Review of Behavioral Finance 15: 103–18. [Google Scholar] [CrossRef]
  38. Sekita, Shizuka. 2011. Financial literacy and retirement planning in Japan. Journal of Pension Economics & Finance 10: 637–56. [Google Scholar]
  39. Stolper, Oscar A., and Andreas Walter. 2017. Financial literacy, financial advice, and financial behavior. Journal of Business Economics 87: 581–643. [Google Scholar] [CrossRef] [Green Version]
  40. Van Rooij, Maarten C. J., Annamaria Lusardi, and Rob J. M. Alessie. 2012. Financial literacy, retirement planning and household wealth. The Economic Journal 122: 449–78. [Google Scholar] [CrossRef] [Green Version]
  41. Xia, Tian, Zhengwei Wang, and Kunpeng Li. 2014. Financial literacy overconfidence and stock market participation. Social Indicators Research 119: 1233–45. [Google Scholar] [CrossRef]
Figure 1. Distribution of subjective and objective financial literacy scores. Note: This figure illustrates the distribution of subjective and objective FL scores in the survey sample. The horizontal axis represents the score of objective FL, and the vertical axis represents that of subjective FL. The area of each circle is proportional to the number of subjects with that value.
Risks 11 00046 g001
Figure 2. Financial literacy confidence types. Note: This figure reports the classification of respondents’ FL confidence. The horizontal axis represents the score of objective FL, and the vertical axis represents that of subjective FL. The means of subjective FL (3.957) and objective FL (4.209) jointly divide the graph into four regions, each representing a different type of observation. Respondents in Region II are overconfident about their financial literacy, and have a below-average objective FL but subjectively believe themselves to possess an above-average financial literacy. Conversely, respondents in Region IV, being underconfident about their financial literacy, have above-average objective FL scores but below-average subjective FL scores.
Risks 11 00046 g002
Table 1. Objective financial literacy questions.
QuestionsAnswers
1. Suppose you have 100 yuan in a savings account and the interest rate was 2% per year. After 5 years, how much do you think you would have in the account if you leave the money to grow?(i) More than 102 yuan
(ii) Exactly 102 yuan
(iii) Less than 102 yuan
(iv) Do not know
2. Imagine that the interest rate on your savings account is 1% per year and inflation is 2% per year. After 1 year, how much will you be able to buy with the money in this account? (i) More than today
(ii) Exactly the same
(iii) Less than today
(iv) Do not know
3. Please tell me whether this statement is true or false. ‘Buying a single company’s stock usually provides a safer return than a stock mutual fund’.(i) True
(ii) False
(iii) Do not know
4. Suppose you take a mortgage loan from the bank. One repayment term option would require you to repay the mortgage over 15 years and the other option is to repay the mortgage over 30 years. Both loans have the same interest rate (4%). Then the monthly mortgage repayment of the 15-year loan is higher than the 30-year loan.(i) This statement is right
(ii) The statement is wrong
(iii) I don’t know
5. Imagine that you want to take out a mortgage loan from your bank today. You anticipate that interest rates are set to rise over over the next few months. Which type of mortgage loan would you choose to take out?(i) Fixed rate loan
(ii) Floating rate loan
(iii) I don’t know
6. Imagine that you buy a bond today for a price of 97 yuan. In a year’s time when the bond reaches maturity it is expected to be worth 100 yuan. If interest rates rise tomorrow, then how will the market price of this bond change?(i) Its price will rise
(ii) Its price will drop
(iii) Its price will remain unchanged
(iv) I don’t know
7. Imagine that your income puts you in the 25% tax bracket. You earn 5000 yuan per month and contribute 1000 yuan before tax to cover all of your social security and pension plan payments. What would your take-home pay be?(i) 5000 yuan
(ii) 4000 yuan
(iii) 3000 yuan
(iv) 2000 yuan
(v) I don’t know
Table 2. Summary statistics on objective financial literacy questions.
QuestionCorrect Responses (%)Wrong Responses (%)Do Not Know (%)
Q1: Compound interest78.117.74.2
Q2: Inflation71.923.05.1
Q3: Risk diversification43.327.429.3
Q4: Mortgage repayment67.321.611.1
Q5: Choosing a mortgage loan70.0 24.25.8
Q6: Bond pricing28.460.411.2
Q7: Income tax58.235.06.8
Source: Authors’ calculations.
Table 3. Distribution of financial literacy overconfidence and underconfidence by age, sex, and education.
Financial Literacy Overconfidence (%)Financial Literacy Underconfidence (%)
Age
25–2941.810.4
30–3443.2 12.8
35–3944.316.9
40–4432.421.7
45–4938.914.5
50–5445.814.2
55–5945.0 8.3
60–6456.58.7
Sex
Male38.0 16.2
Female45.512.1
Education
<College56.610.1
College graduate40.614.4
Postgraduate31.917.2
Source: Authors’ calculations.
Table 4. Retirement planning questions.
QuestionsAnswers (%)
1. Which of the following best describes your retirement planning? (Retirement plan)(i) I do not have a plan (24.16%)
(ii) I have a plan, but it is not written down (62.78%)
(iii) I have a written plan (13.06%)
2. To what extent (1–5) do you agree with the statement: I have a very good idea of the total value of all my personal retirement savings and investments? (Retirement assets awareness) (i) Strongly disagree (0.75%)
(ii) Somewhat disagree (5.30%)
(iii) Neither agree or disagree (22.12%)
(iv) Somewhat agree (49.05%)
(v) Strongly agree (22.78%)
3. Are you currently participating in a private pension to prepare for your retirement? (Private pension)(i) Yes (43.79%)
(ii) No (56.21%)
4. Are you currently having a variable annuity to prepare for your retirement? (Variable annuity)(i) Yes (91.88%)
(ii) No (8.12%)
Notes: The private pension here refers to pension income sources other than the public pension, including the DC/DB pension and commercial pension products purchased from insurers. Source: Authors’ calculations.
Table 5. Variable definition.
VariableVariables Description
Retirement planReadiness of retirement planning (range 1–3)
Retirement asset awarenessAwareness of total value of retirement savings and investments (range 1–5)
Private pensionParticipation in a private pension to prepare for retirement, 1 indicating yes and 0 indicating no
Variable annuityHaving a variable annuity to prepare for retirement,
1 indicating yes and 0 indicating no
FL overconfidence For respondents with objective FL < 4.209 and subjective FL > 3.957, overconfidence = 1, otherwise = 0
FL underconfidence For Respondents with objective FL > 4.209 and subjective FL < 3.957, underconfidence = 1, otherwise = 0
Objective FL The objective financial literacy score (range 0–7)
Subjective FLThe subjective financial literacy score (range 1–5)
Gender1 for male, 0 for female
Personal incomeAnnual income (the amount is categorized into range 1–9)
ChildrenNumber of children
MarriageMarital status, 1 means married, and 0 otherwise
AgeAge (range 25–65)
<CollegeEducation below college = 1, otherwise = 0 (benchmark)
College graduateCollege diploma = 1, otherwise = 0
PostgraduateEducation above college = 1, otherwise = 0
Risk aversion dummy 1 (low)Degree of risk aversion (range 1–4)
Risk aversion dummy 2Degree of risk aversion (range 1–4)
Risk aversion dummy 3Degree of risk aversion (range 1–4)
Risk aversion dummy 4 (high)Degree of risk aversion (range 1–4)
Note: This table provides detailed definitions of all variables used in models.
Table 6. Summary statistics.
VariableMeanStd. Dev.MinMax
Retirement plan1.8890.60013
Retirement asset awareness3.8780.84515
Private pension0.5730.49501
Variable annuity0.0830.27601
FL overconfidence 0.4170.49301
FL underconfidence 0.1420.34901
Objective FL 4.2091.58507
Subjective FL3.9570.80415
Gender0.5140.50001
Personal income7.1652.17319
Children0.9690.54404
Marriage0.8780.32701
Age41.67510.0342564
<College0.1320.33901
College graduate0.7540.43101
Postgraduate0.1140.31801
Risk aversion dummy 1 (low)0.3590.48001
Risk aversion dummy 20.2860.45201
Risk aversion dummy 30.1340.34101
Risk aversion dummy 4 (high)0.1530.36001
Notes: This table provides summary statistics of all variables used in models.
Table 7. FL confidence and subjective retirement planning assessment.
(1)(2)(3)(4)(5)(6)
Dependent VariableRetirement PlanRetirement Asset Awareness
FL overconfidence 0.248 ***0.304 ***0.263 ***0.272 ***0.573 ***0.508 ***
(0.035)(0.042)(0.042)(0.058)(0.067)(0.067)
FL underconfidence −0.311 *** −0.508 ***
(0.045) (0.086)
Objective FL 0.028 **0.046 *** 0.154 ***0.179 ***
(0.014)(0.014) (0.022)(0.022)
Gender0.0210.0170.0210.128 **0.116 **0.124 **
(0.033)(0.033)(0.032)(0.053)(0.053)(0.052)
Personal income0.073 ***0.072 ***0.071 ***0.049 ***0.045 ***0.046 ***
(0.008)(0.008)(0.008)(0.014)(0.014)(0.013)
Children0.0420.0410.041−0.004−0.001−0.014
(0.036)(0.035)(0.035)(0.056)(0.054)(0.054)
Marriage−0.009−0.010−0.0200.1140.1100.096
(0.057)(0.056)(0.054)(0.093)(0.091)(0.091)
Age−0.000−0.001−0.0010.010 ***0.007 **0.007 **
(0.002)(0.002)(0.002)(0.003)(0.003)(0.003)
College graduate−0.057−0.065−0.0670.194 **0.157 *0.148
(0.055)(0.054)(0.054)(0.096)(0.093)(0.094)
Postgraduate0.0180.0050.0050.260 **0.198 *0.187
(0.073)(0.073)(0.073)(0.123)(0.120)(0.120)
Risk aversion dummy 1 (low)0.193 ***0.155 **0.121 *0.235 **0.022−0.023
(0.068)(0.068)(0.067)(0.117)(0.118)(0.113)
Risk aversion dummy 20.279 ***0.249 ***0.221 ***0.217 *0.0520.019
(0.070)(0.070)(0.069)(0.118)(0.118)(0.113)
Risk aversion dummy 30.1140.0820.0520.155−0.024−0.062
(0.075)(0.075)(0.074)(0.130)(0.129)(0.124)
Risk aversion dummy 4 (high)0.142 *0.1000.0780.261 **0.0260.000
(0.075)(0.075)(0.075)(0.132)(0.134)(0.129)
Constant0.898 ***0.826 ***0.871 ***2.628 ***2.184 ***2.278 ***
(0.159)(0.163)(0.166)(0.304)(0.309)(0.284)
Region EffectYESYESYESYESYESYES
Observations126612661266106310631063
R-squared0.1800.1830.2090.1000.1400.171
Notes: This table presents the OLS regression of individuals’ financial literacy confidence on their retirement planning behaviors. The dependent variable is respondents’ retirement planning assessment. Columns (1) to (3) report the results on the readiness of respondents’ retirement plan, and columns (4) to (6) report the results on the retirement asset awareness. Standard error in parentheses. Robust standard errors in parentheses *** p < 0.01, ** p < 0.05, * p < 0.1.
Table 8. FL confidence and retirement planning actions.
(1)(2)(3)(4)(5)(6)
Dependent VariablePrivate PensionVariable Annuity
FL overconfidence 0.149 *0.309 ***0.281 ***0.380 ***0.632 ***0.644 ***
(0.078)(0.100)(0.101)(0.113)(0.149)(0.152)
FL underconfidence −0.204 * 0.065
(0.114) (0.175)
Objective FL 0.081 **0.092 *** 0.119 **0.117 **
(0.032)(0.033) (0.053)(0.053)
Gender0.0250.0130.016−0.028−0.031−0.033
(0.075)(0.075)(0.075)(0.109)(0.110)(0.110)
Personal income0.034 *0.033 *0.032 *0.0460.0440.044
(0.019)(0.019)(0.019)(0.030)(0.031)(0.031)
Children0.0720.0680.0690.325 ***0.325 ***0.324 ***
(0.078)(0.077)(0.077)(0.103)(0.105)(0.105)
Marriage0.0800.0770.070−0.352 *−0.348 *−0.347 *
(0.129)(0.128)(0.128)(0.201)(0.200)(0.201)
Age0.001−0.001−0.0010.016 ***0.014 **0.014 **
(0.004)(0.004)(0.004)(0.006)(0.006)(0.006)
College graduate−0.001−0.027−0.0270.001−0.033−0.032
(0.121)(0.121)(0.121)(0.163)(0.167)(0.166)
Postgraduate0.0850.0480.0500.432 *0.380 *0.383 *
(0.162)(0.163)(0.163)(0.222)(0.225)(0.224)
Risk aversion dummy 1 (low)0.622 ***0.522 ***0.501 ***0.096−0.019−0.011
(0.157)(0.162)(0.163)(0.257)(0.269)(0.266)
Risk aversion dummy 20.533 ***0.458 ***0.441 ***0.430 *0.3370.343
(0.160)(0.163)(0.164)(0.253)(0.259)(0.257)
Risk aversion dummy 30.545 ***0.465 **0.446 **0.457 *0.3490.356
(0.177)(0.181)(0.181)(0.271)(0.277)(0.274)
Risk aversion dummy 4 (high)0.597 ***0.484 ***0.471 ***0.1870.0560.062
(0.173)(0.179)(0.180)(0.276)(0.289)(0.286)
Constant−0.875 **−1.085 ***−1.061 ***−2.768 ***−3.148 ***−3.163 ***
(0.378)(0.391)(0.390)(0.498)(0.526)(0.526)
Region EffectYESYESYESYESYESYES
Observations126312631263123212321232
Pseudo R-squared0.0510.0550.0570.1000.1070.107
Notes: This table presents the Probit regression of individuals’ financial literacy confidence on their retirement planning behaviors. The dependent variable is respondents’ actions on retirement plan. Columns (1) to (3) report the result on private pension, and columns (4) to (6) report the results on variable annuity. Standard error in parentheses. Robust standard errors in parentheses *** p < 0.01, ** p < 0.05, * p < 0.1.
Disclaimer/Publisher’s Note: The statements, opinions and data contained in all publications are solely those of the individual author(s) and contributor(s) and not of MDPI and/or the editor(s). MDPI and/or the editor(s) disclaim responsibility for any injury to people or property resulting from any ideas, methods, instructions or products referred to in the content.

