
Current and Expected Development of Corporate Strategies for Managing Environmental Risks in Hungary

Abstract
:1. Introduction
2. Literature Review
2.1. Environmental Risks and Their Management
2.2. Levels of Development, Innovation, Strategies for Managing Environmental Risks
- product innovation;
- product and process innovation;
- and product, process and organizational innovation factors.
- Ambiguous;
- Accountable;
- and aspirational.
- can be applied effectively by increasing the return;
- increases differentiation and competitiveness;
- generates an environmental and social surplus;
- remains resistant to emerging social and environmental trends;
- and shows network effects, promotes stakeholder engagement (Young and Reeves 2020).
- Stage 1:
- Green Compliance as Opportunity
- Stage 2:
- Making Value Chains Sustainable
- Passive: little or no consideration is given to sustainability aspects.
- Event-driven: sustainability is integrated into the business process in an ad hoc, reactive manner.
- Practice-oriented: sustainability goals are met with practices implemented at the operational level.
- Strategically managed: sustainability aspects are treated as a strategic goal, as a differentiator in the market competition.
- Stage 3:
- Designing Sustainable Products and Services
- Stage 4:
- Developing New Business Models
- Stage 5:
- Creating Next-Practice Platforms
- Comply with the law.
- Anticipate future legal requirements.
- Think the value chain as an ecosystem.
- Develop responsible products and services.
- Lead the change.
3. Materials and Methods
4. Results and Discussion
4.1. Basic Characteristics of the Responses (Distribution Ratio, Mode)
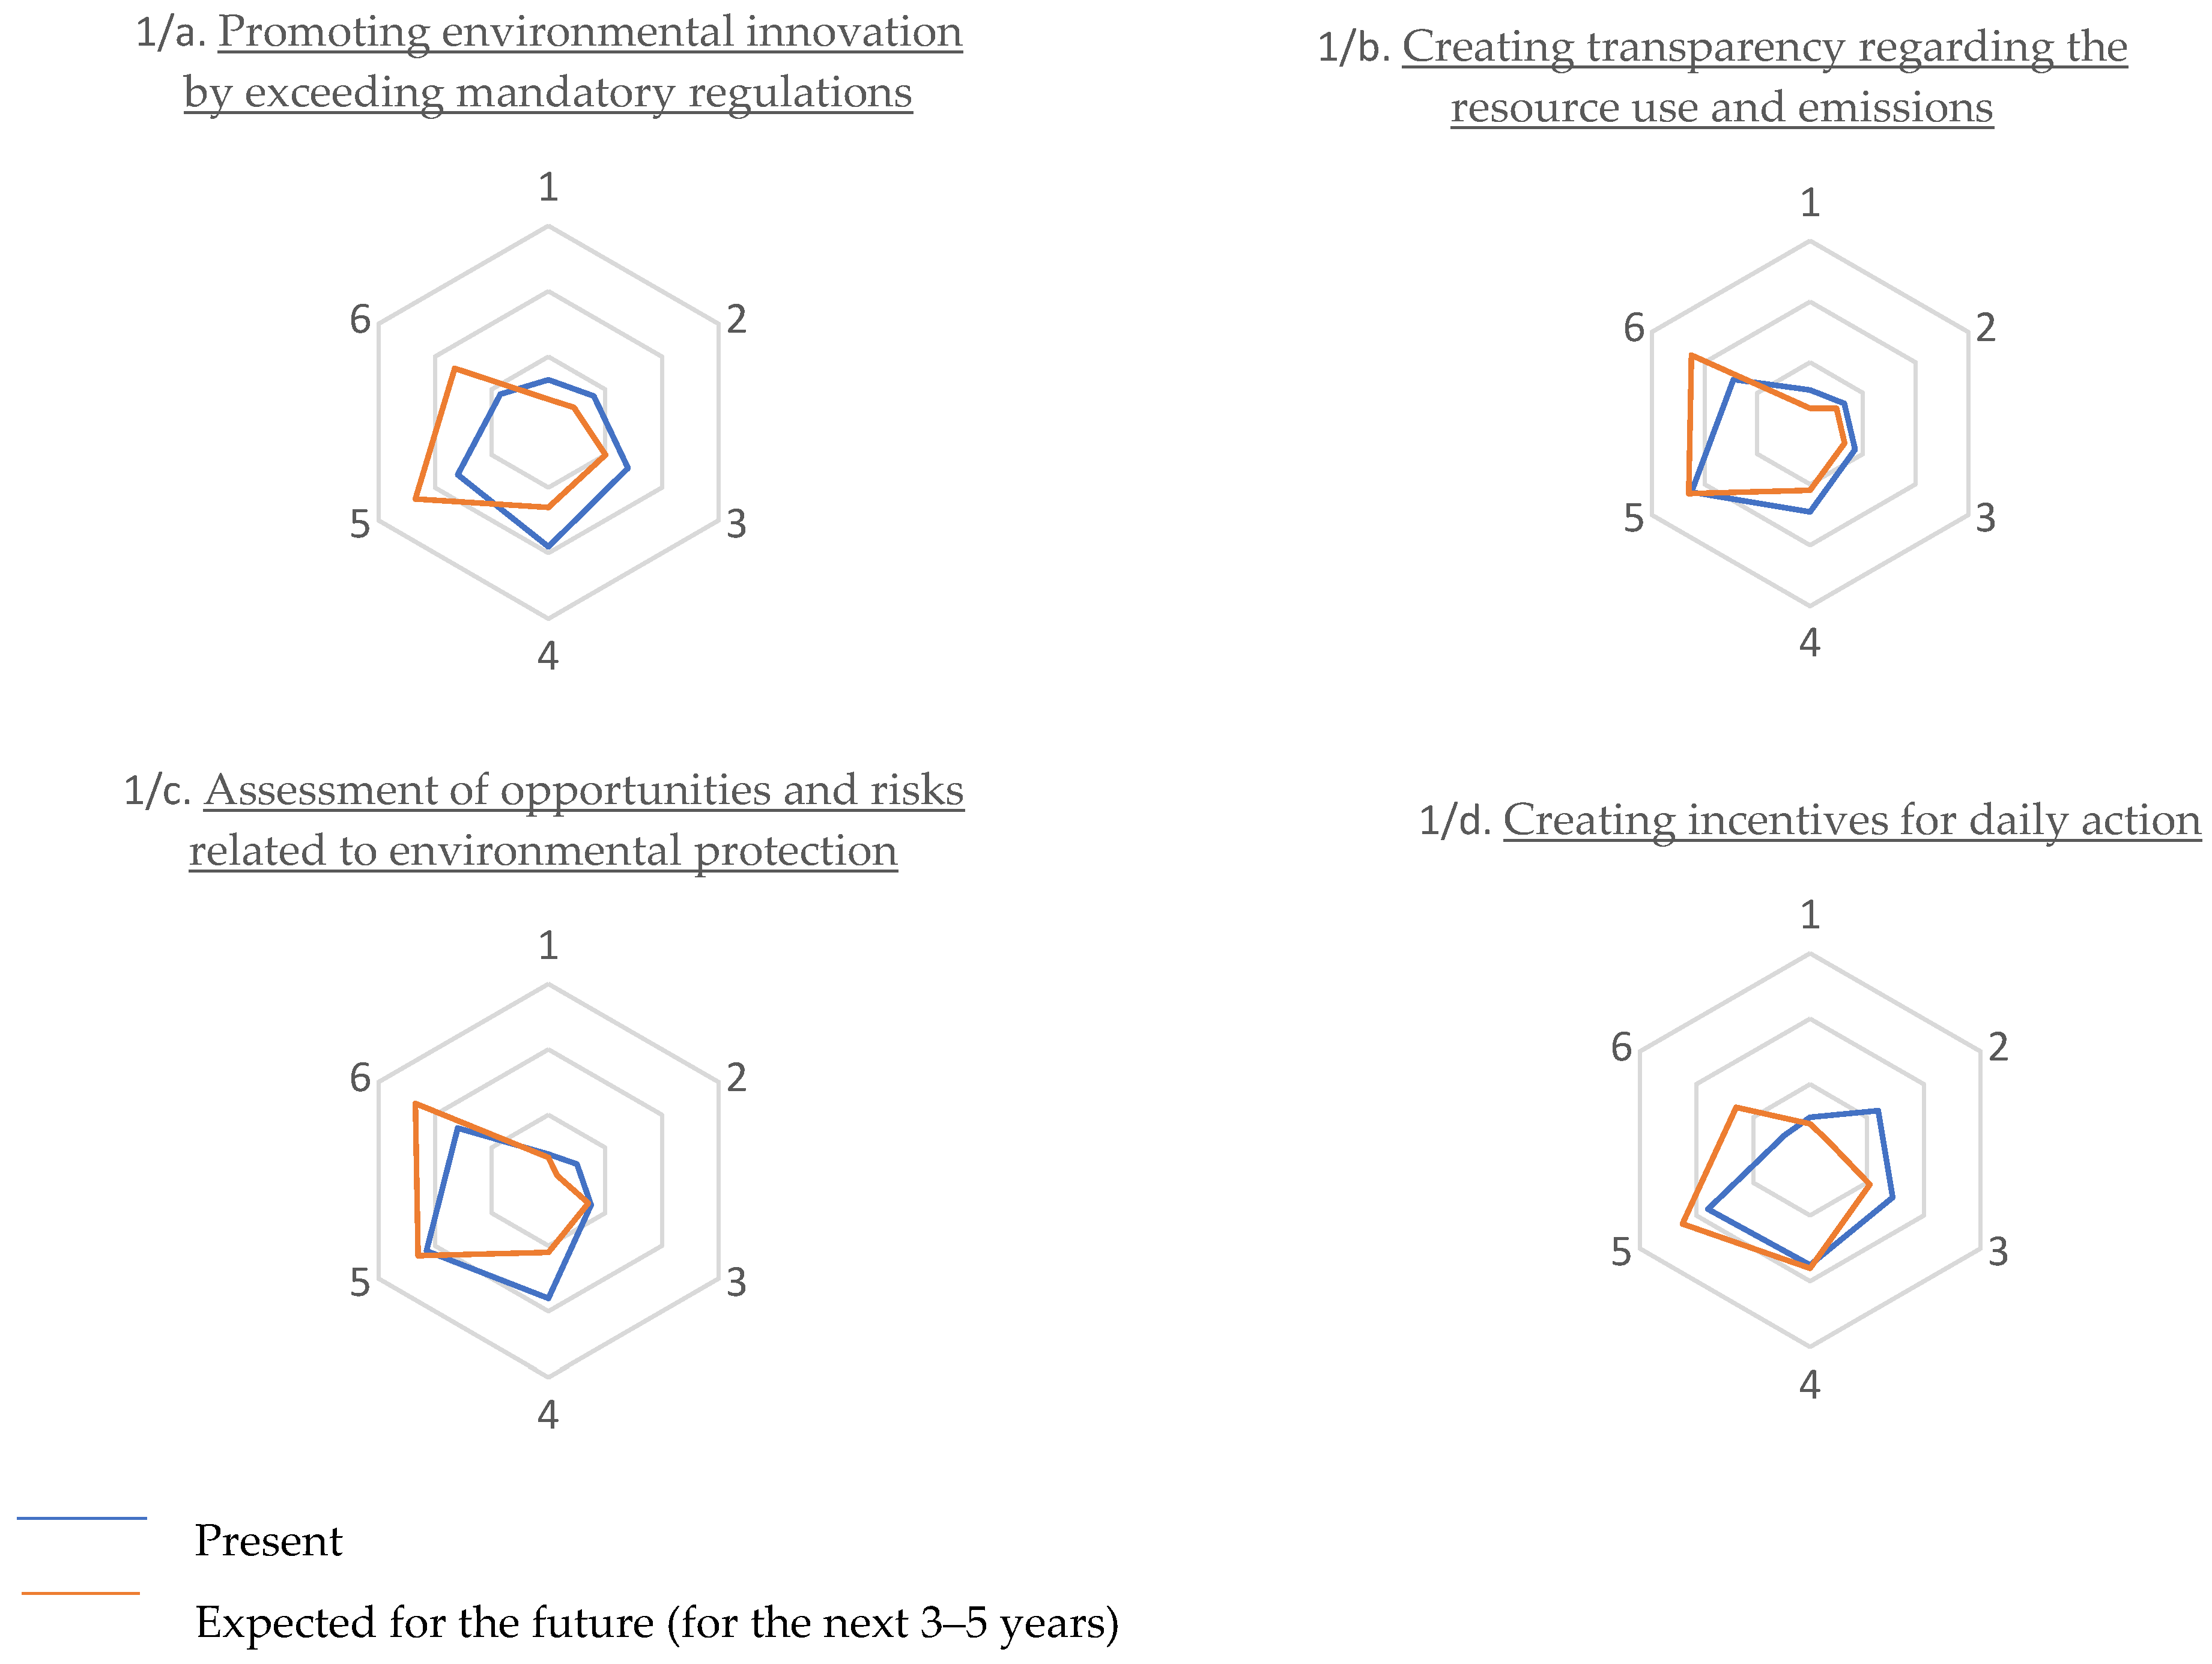
- For the question “1/a. Promoting environmental innovation by exceeding mandatory regulations”, the most frequently given score (mode) for the present was four (26% of the respondents); however, for the future, the highest proportion gave a rating of five (33 %). It can therefore also be seen that the ratio of the most characteristic scores of the present and the future also differs, so the promotion of environmental protection innovation is even more often classified as a management task by enterprises. This is confirmed by the fact that even for the highest possible score (six), the difference between the current score (12%) and the expected future score (23%) is more than double (Figure 4). From the above, it can be concluded that in the future, businesses intend to place a much stronger emphasis on innovation, and it also shows that, at present, innovation is still not among the most important strategic factors in many cases.
- “1/b. Creating transparency regarding the resource use and emissions” is currently a more important factor in the life of businesses compared to the previous variable. Almost a third of the businesses included in the analysis gave a rating of five on this question. For the future, the rating of five appears in a similar proportion, but here too there is a striking increase in the frequency of the highest value (six) (32%). The enterprises therefore consider that their operations are currently transparent in relation to the use and emission of resources, but they still see the opportunity for development in the system, so they shape their strategies in the medium term accordingly.
- The highest proportion of scores for the question on “ 1/c. Assessment of opportunities and risks related to environmental protection” also fall into the 4–6 category (four–25%; five–30%; six–22%). The assessment of this variable is similar to that of the variable “1/a. Promoting environmental innovation”. Businesses are already dealing with the assessment of environmental risks, but at the same time, development is essential. This is not necessarily only due to the need for methodological improvements, but also due to the emergence of new risk factors that are not yet known and are likely to emerge in the future. For this reason, the two highest scores on the Likert scale (5–6) received 64% of the evaluations in the case of future value.
- In the case of “1/d. Incentives for daily action”, there is an even greater difference in the responses regarding the present and the future. For answers concerning the present, the average assessment is also displayed (20%), but almost half of the answers rate this indicator as a four or five. The proportion of the highest value (six) is relatively small (6%); however, companies consider that the development of incentives should play a very important role in the next 3–5 years, as reflected in the more than threefold increase in the share of businesses giving a score of six.
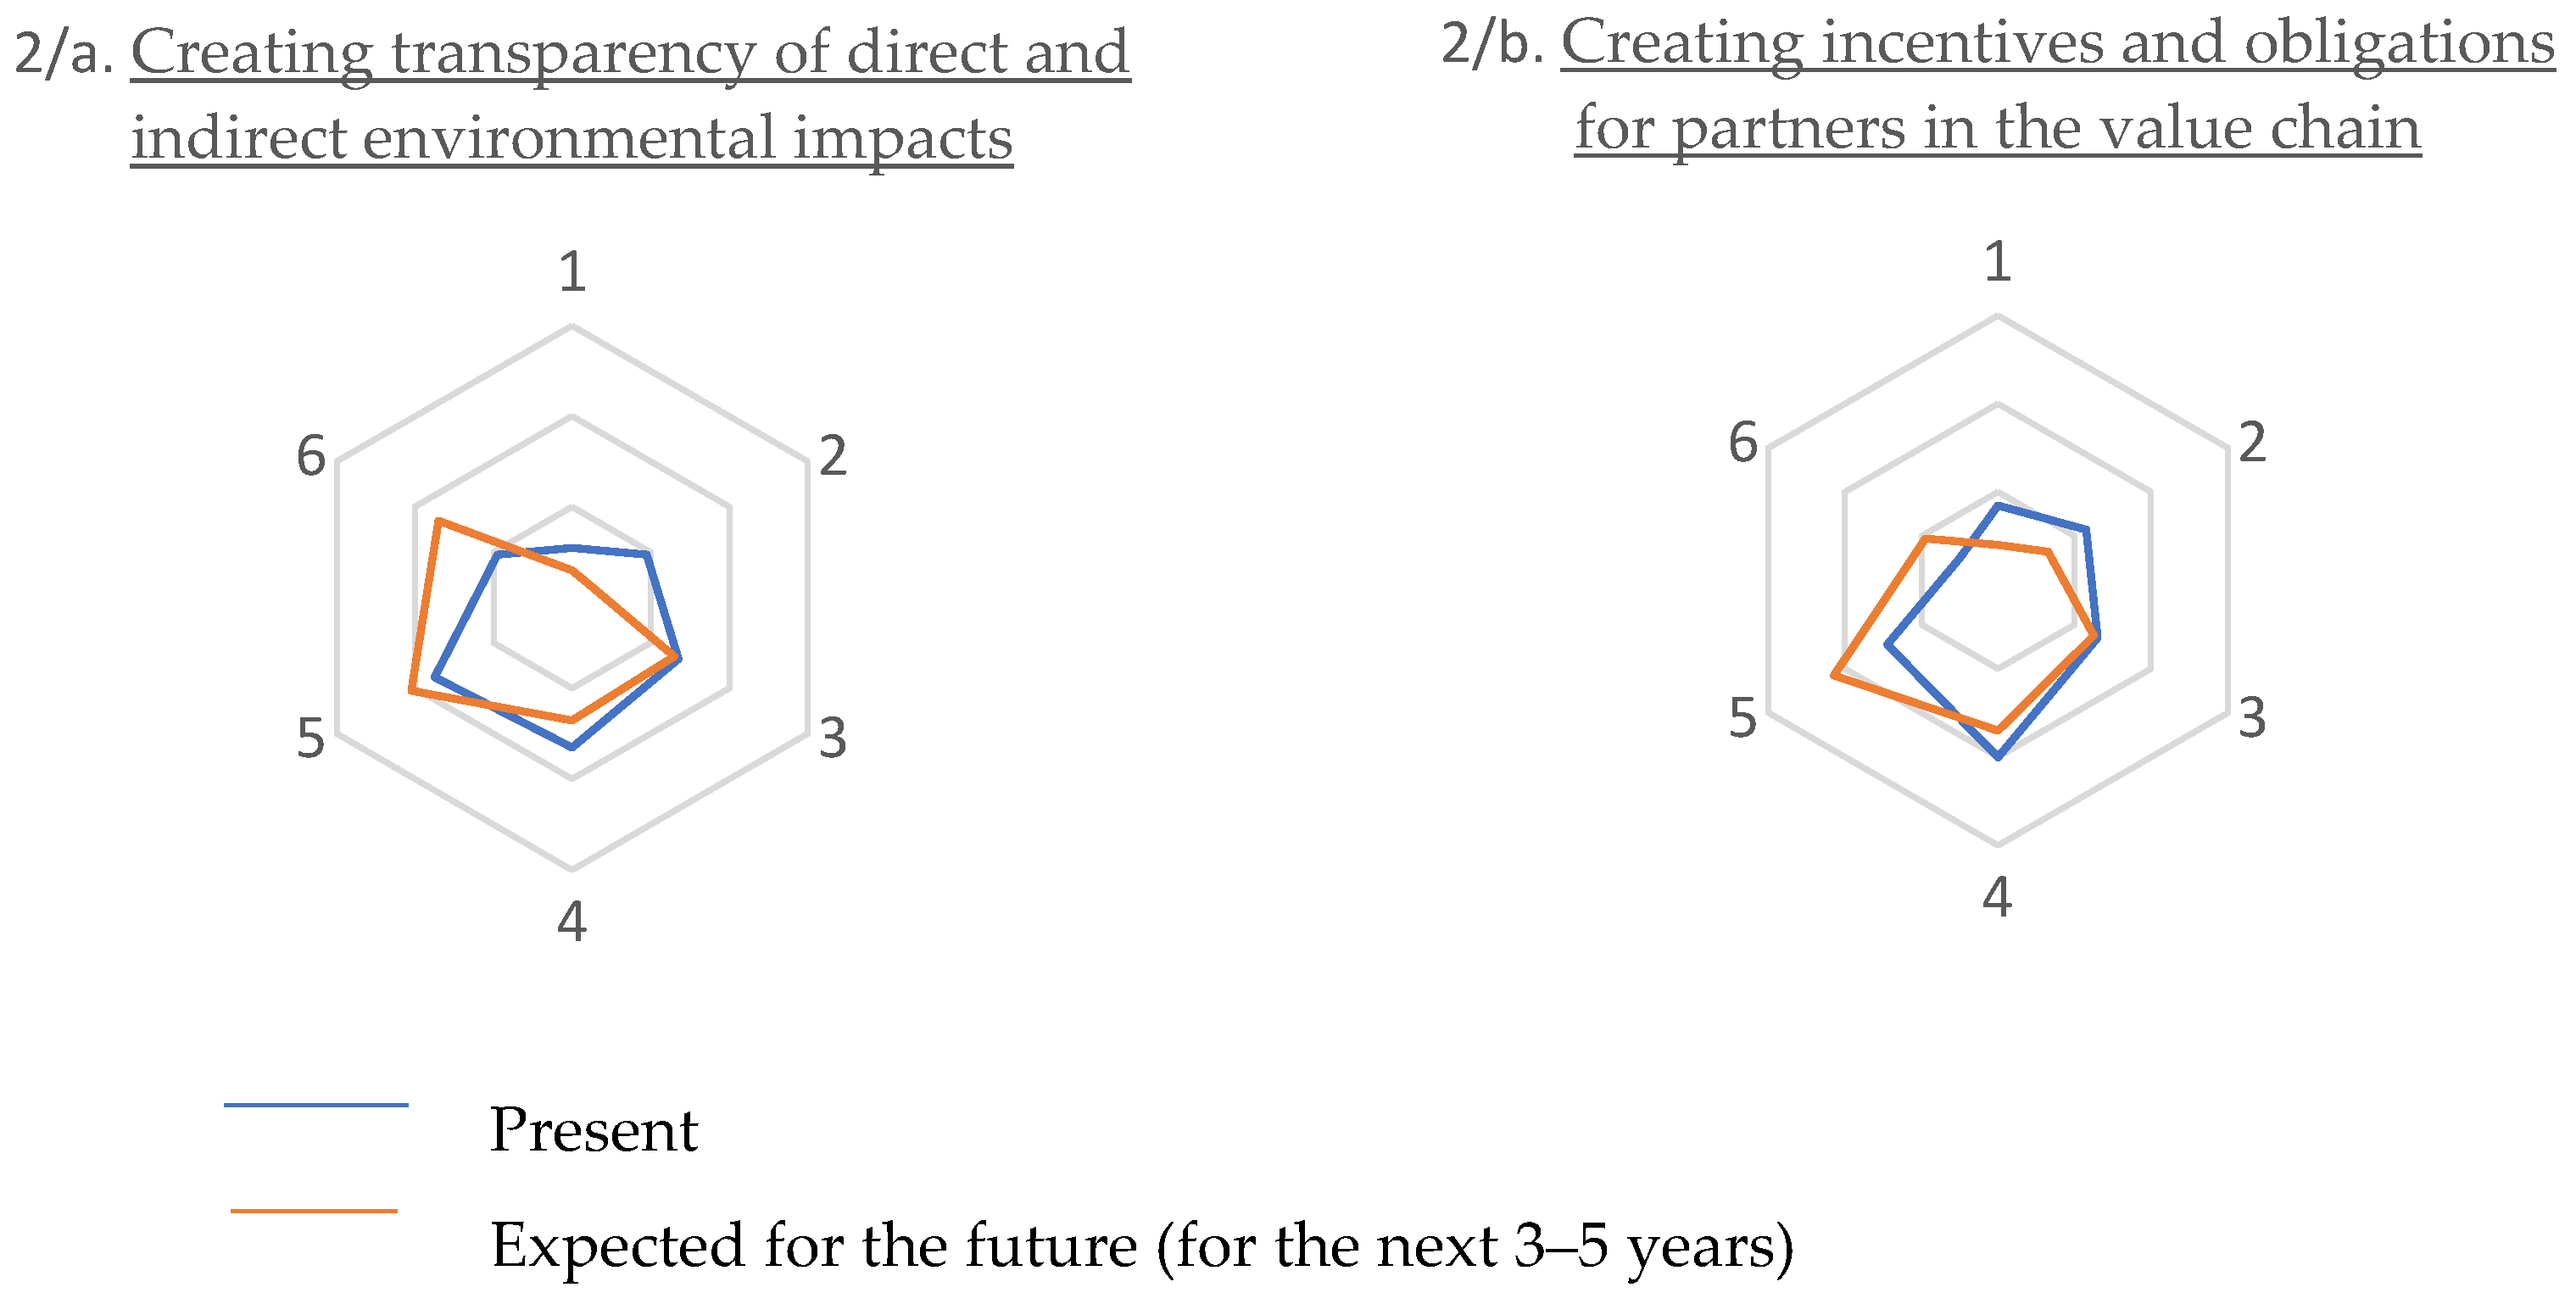
- The highest value was given for the future role of “2/a. Creating transparency of direct and indirect environmental impacts” by nearly 55% of the companies. All of this suggests that companies clearly consider the measurement and management of environmental impacts to be an important strategic factor that should be given even stronger emphasis in the coming years.
- In the case of incentives and obligations created for the partners in the value chain (2/b.), there is also a significant shift towards higher Likert scale values for the future (four: 24%, five: 30% six: 13%).
- However, the assessment can be said to be cautious, as the frequency of the highest score is visibly lower than the one for the previous indicator both in terms of the present and the future (Figure 5).
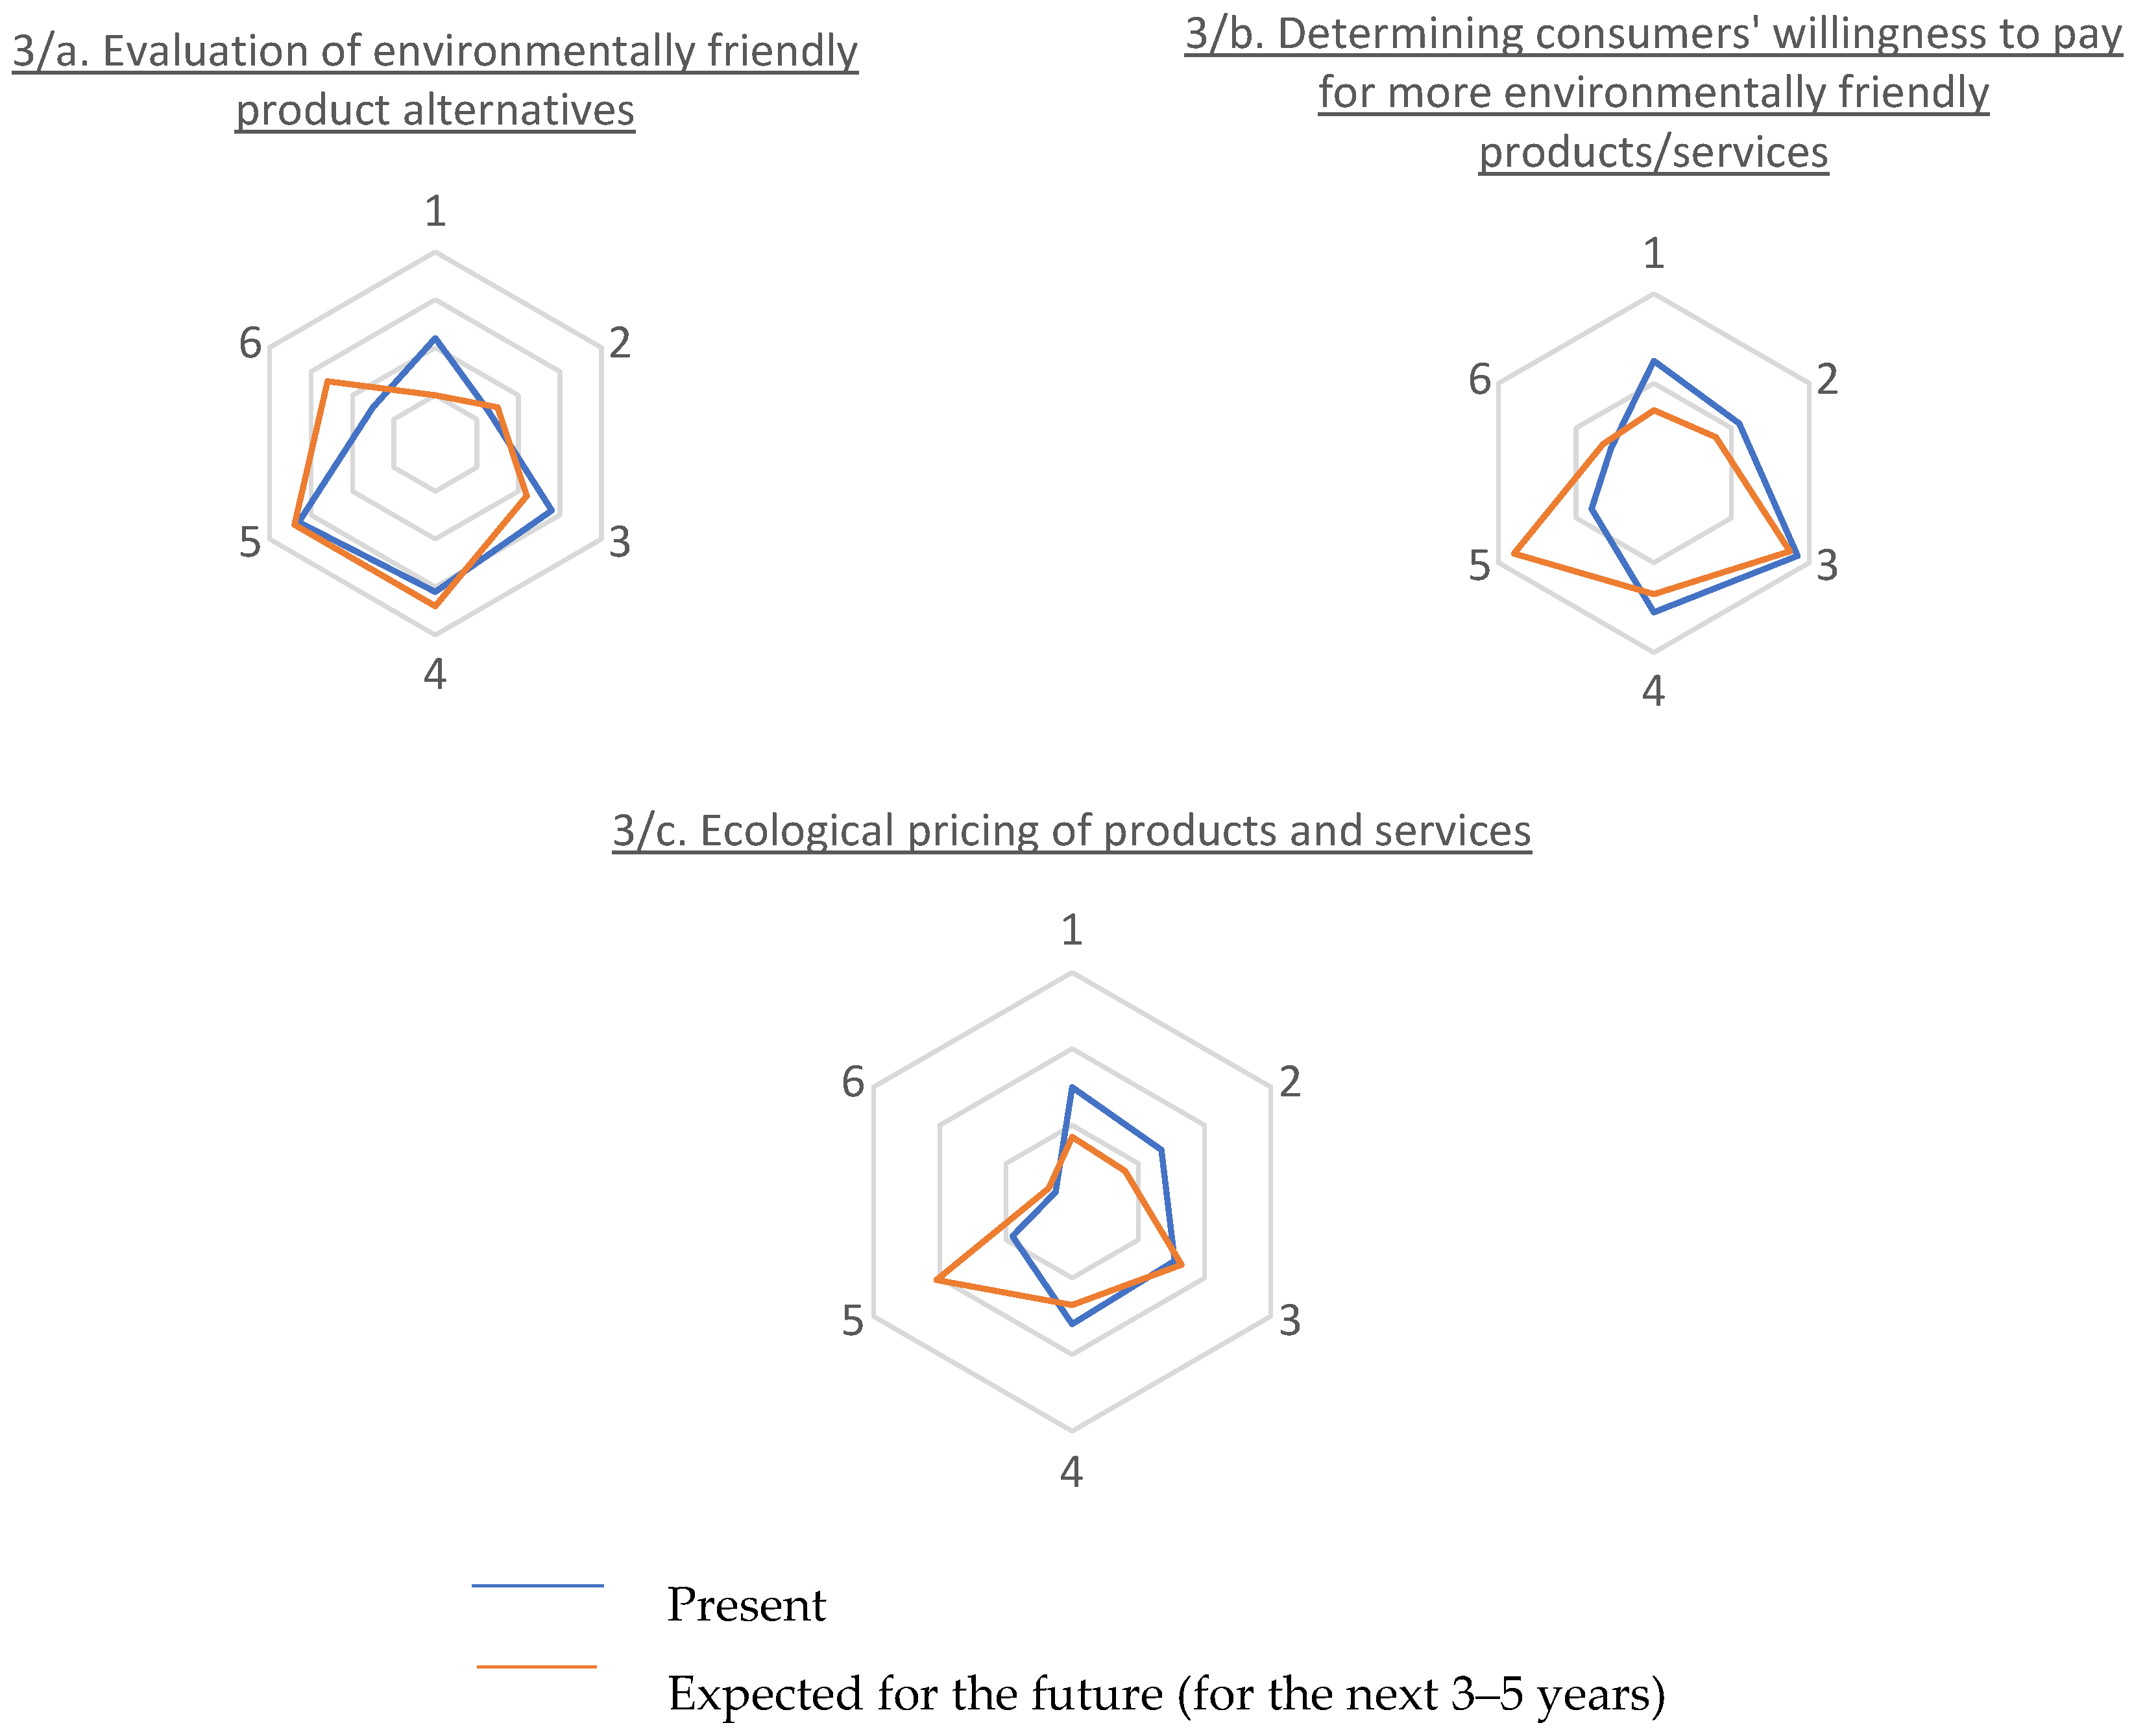
- Nowadays, the role of environmentally friendly product alternatives (3/a.) is indisputable, but half of the economic organizations participating in the research believe that nowadays it does not receive enough emphasis among managerial tasks: most of them rated it as a five (23%) or a four (22%). It is therefore no coincidence that the frequency of both rankings for the future is 24%, while at the same time a significant increase of the value six can be observed (from 11% to 18%).
- Determining consumers’ willingness to pay for more environmentally friendly products/services (3/b.) shows a more diverse picture than the previous ones. Unusually, here the most frequently given scores are not the values 4–5, but 3 (26.1%). All of this means that the majority of businesses have not yet taken systemic steps in this area, however, in a 3–5-year perspective, as can be seen in the spider web diagram (Figure 6), a very strong shift in favor of the value of five can be seen (from 11% to 26%). The lower values also show that this issue will be a significant management focus in the future, considering that the proportion of companies giving a value of one is 18%, while the same proportion will decrease to 10% in the future.
- The ecological pricing of products and services (3/c.) was also evaluated differently by enterprises. The ratio of values one and two currently hovers around 20%, looking into the future; however, the ratio of these values will decrease and the share of enterprises with the two lowest values for this variable is 11–12%. The growing importance of the question is shown by the fact that most respondents gave a value of five for the future (29%), which is also clearly visible on the spider web diagram (Figure 6).
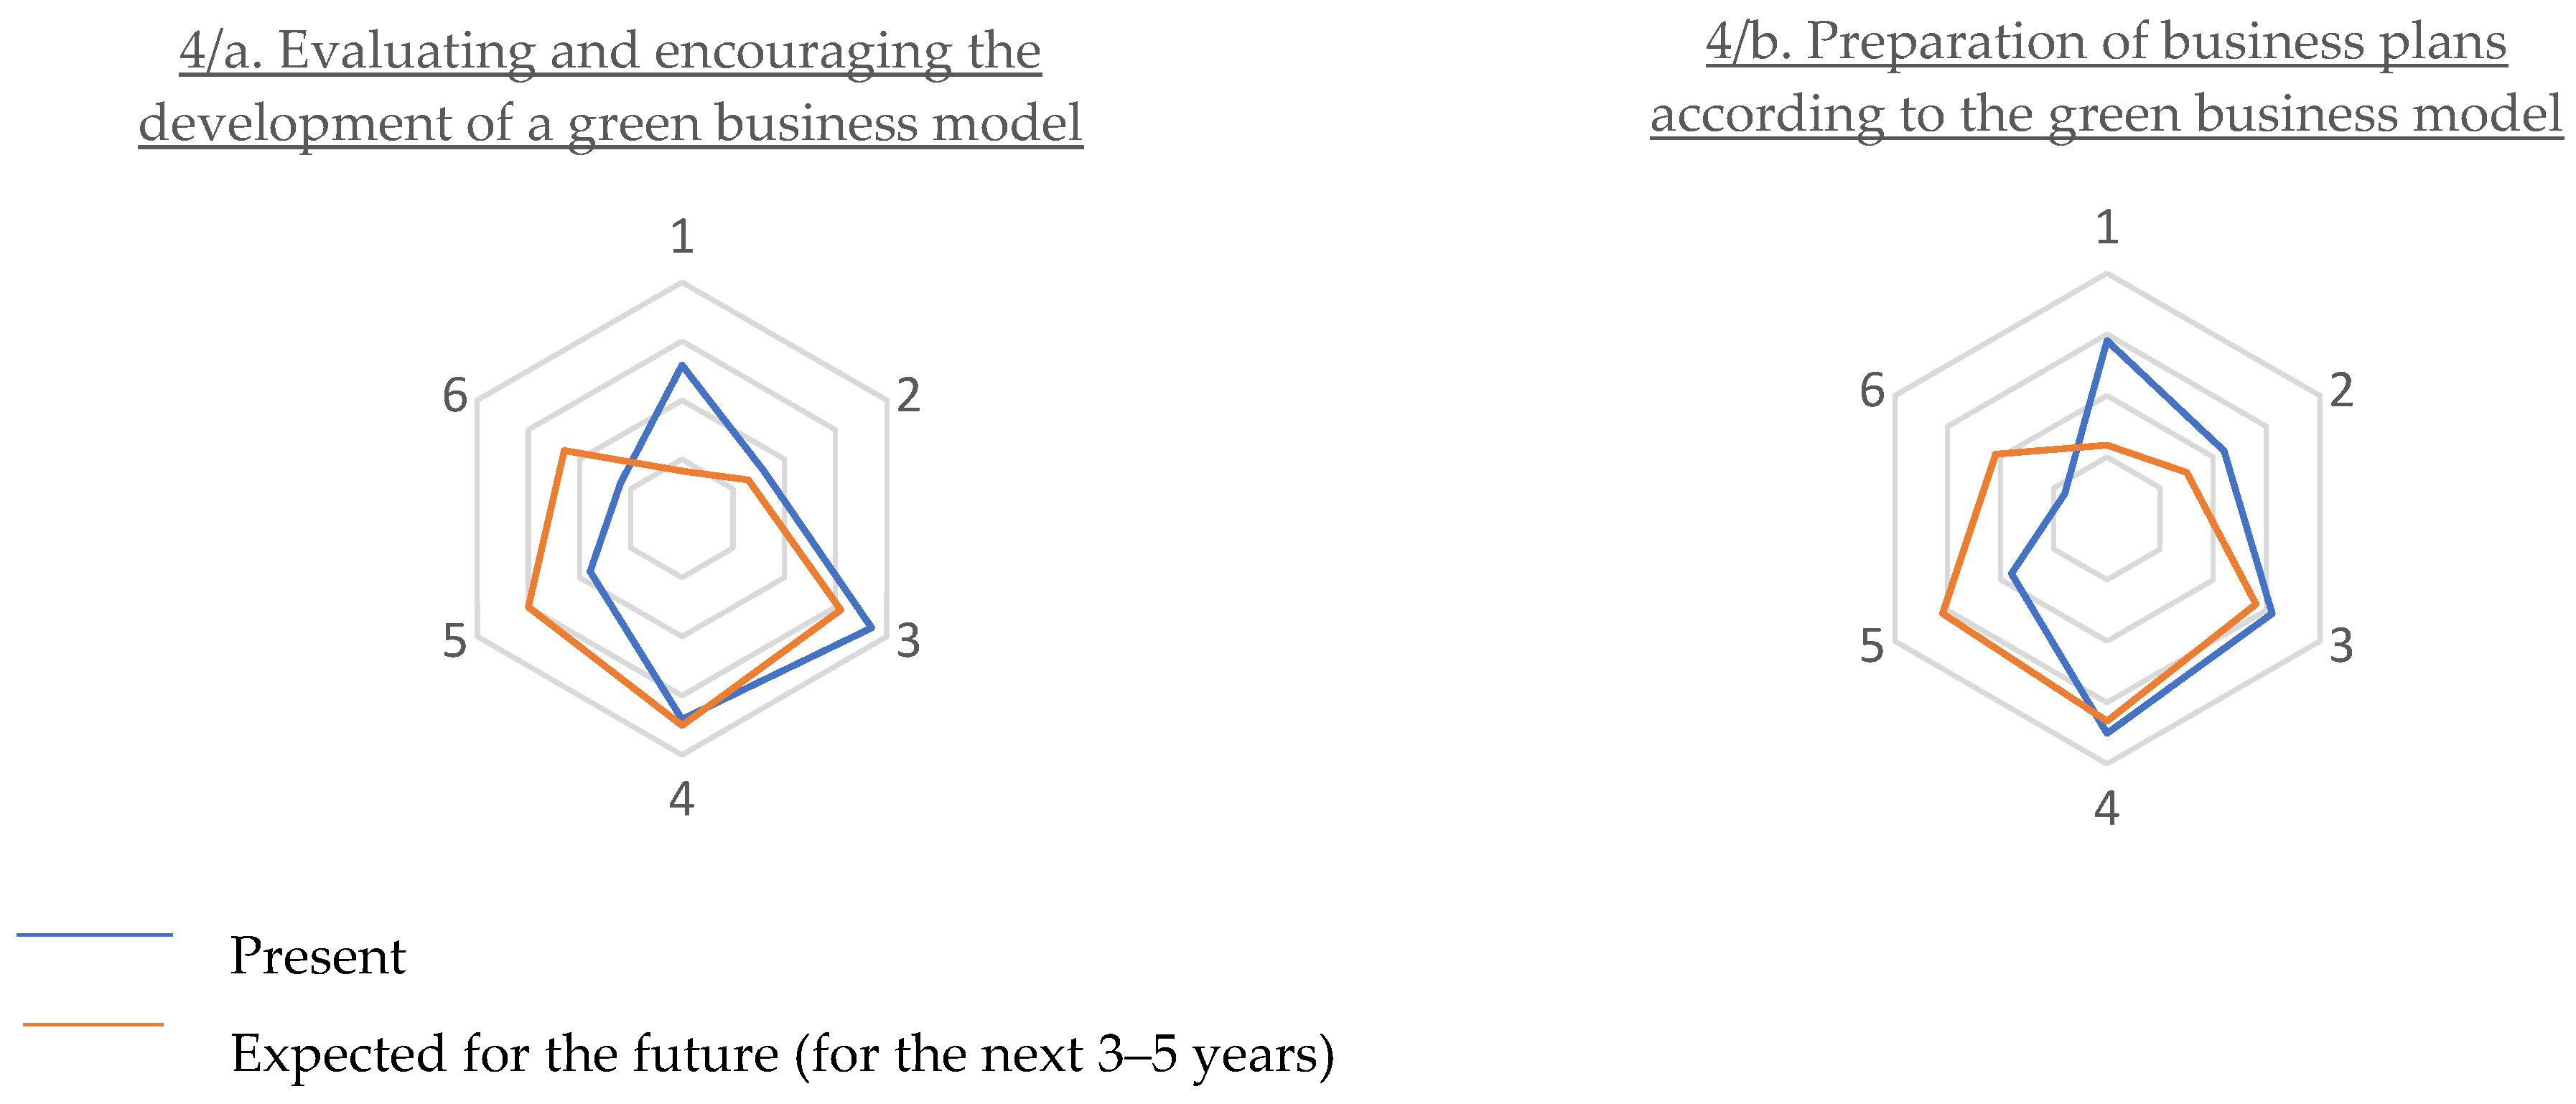
- For the current situation, evaluating and encouraging the development of a green business model (4/a.) was most often rated three and four, so almost half of the enterprises clearly consider the need for development as a strategic factor. This is proven by the fact that for the future the most frequently given ranking is four (25%), but particularly strongly—almost doubling—appear the proportions of score five (from 13% to 21%) and score six (8% from to 16%). This is accompanied by a significant decrease in the proportion of score one (from 18% to 6%).
- A very similar pattern can be seen in the Figure 7 for the preparation of business plans according to the green business model (4/b.).
- Preparation of business plans according to the green business model.
- Evaluating and encouraging the development of a green business model.
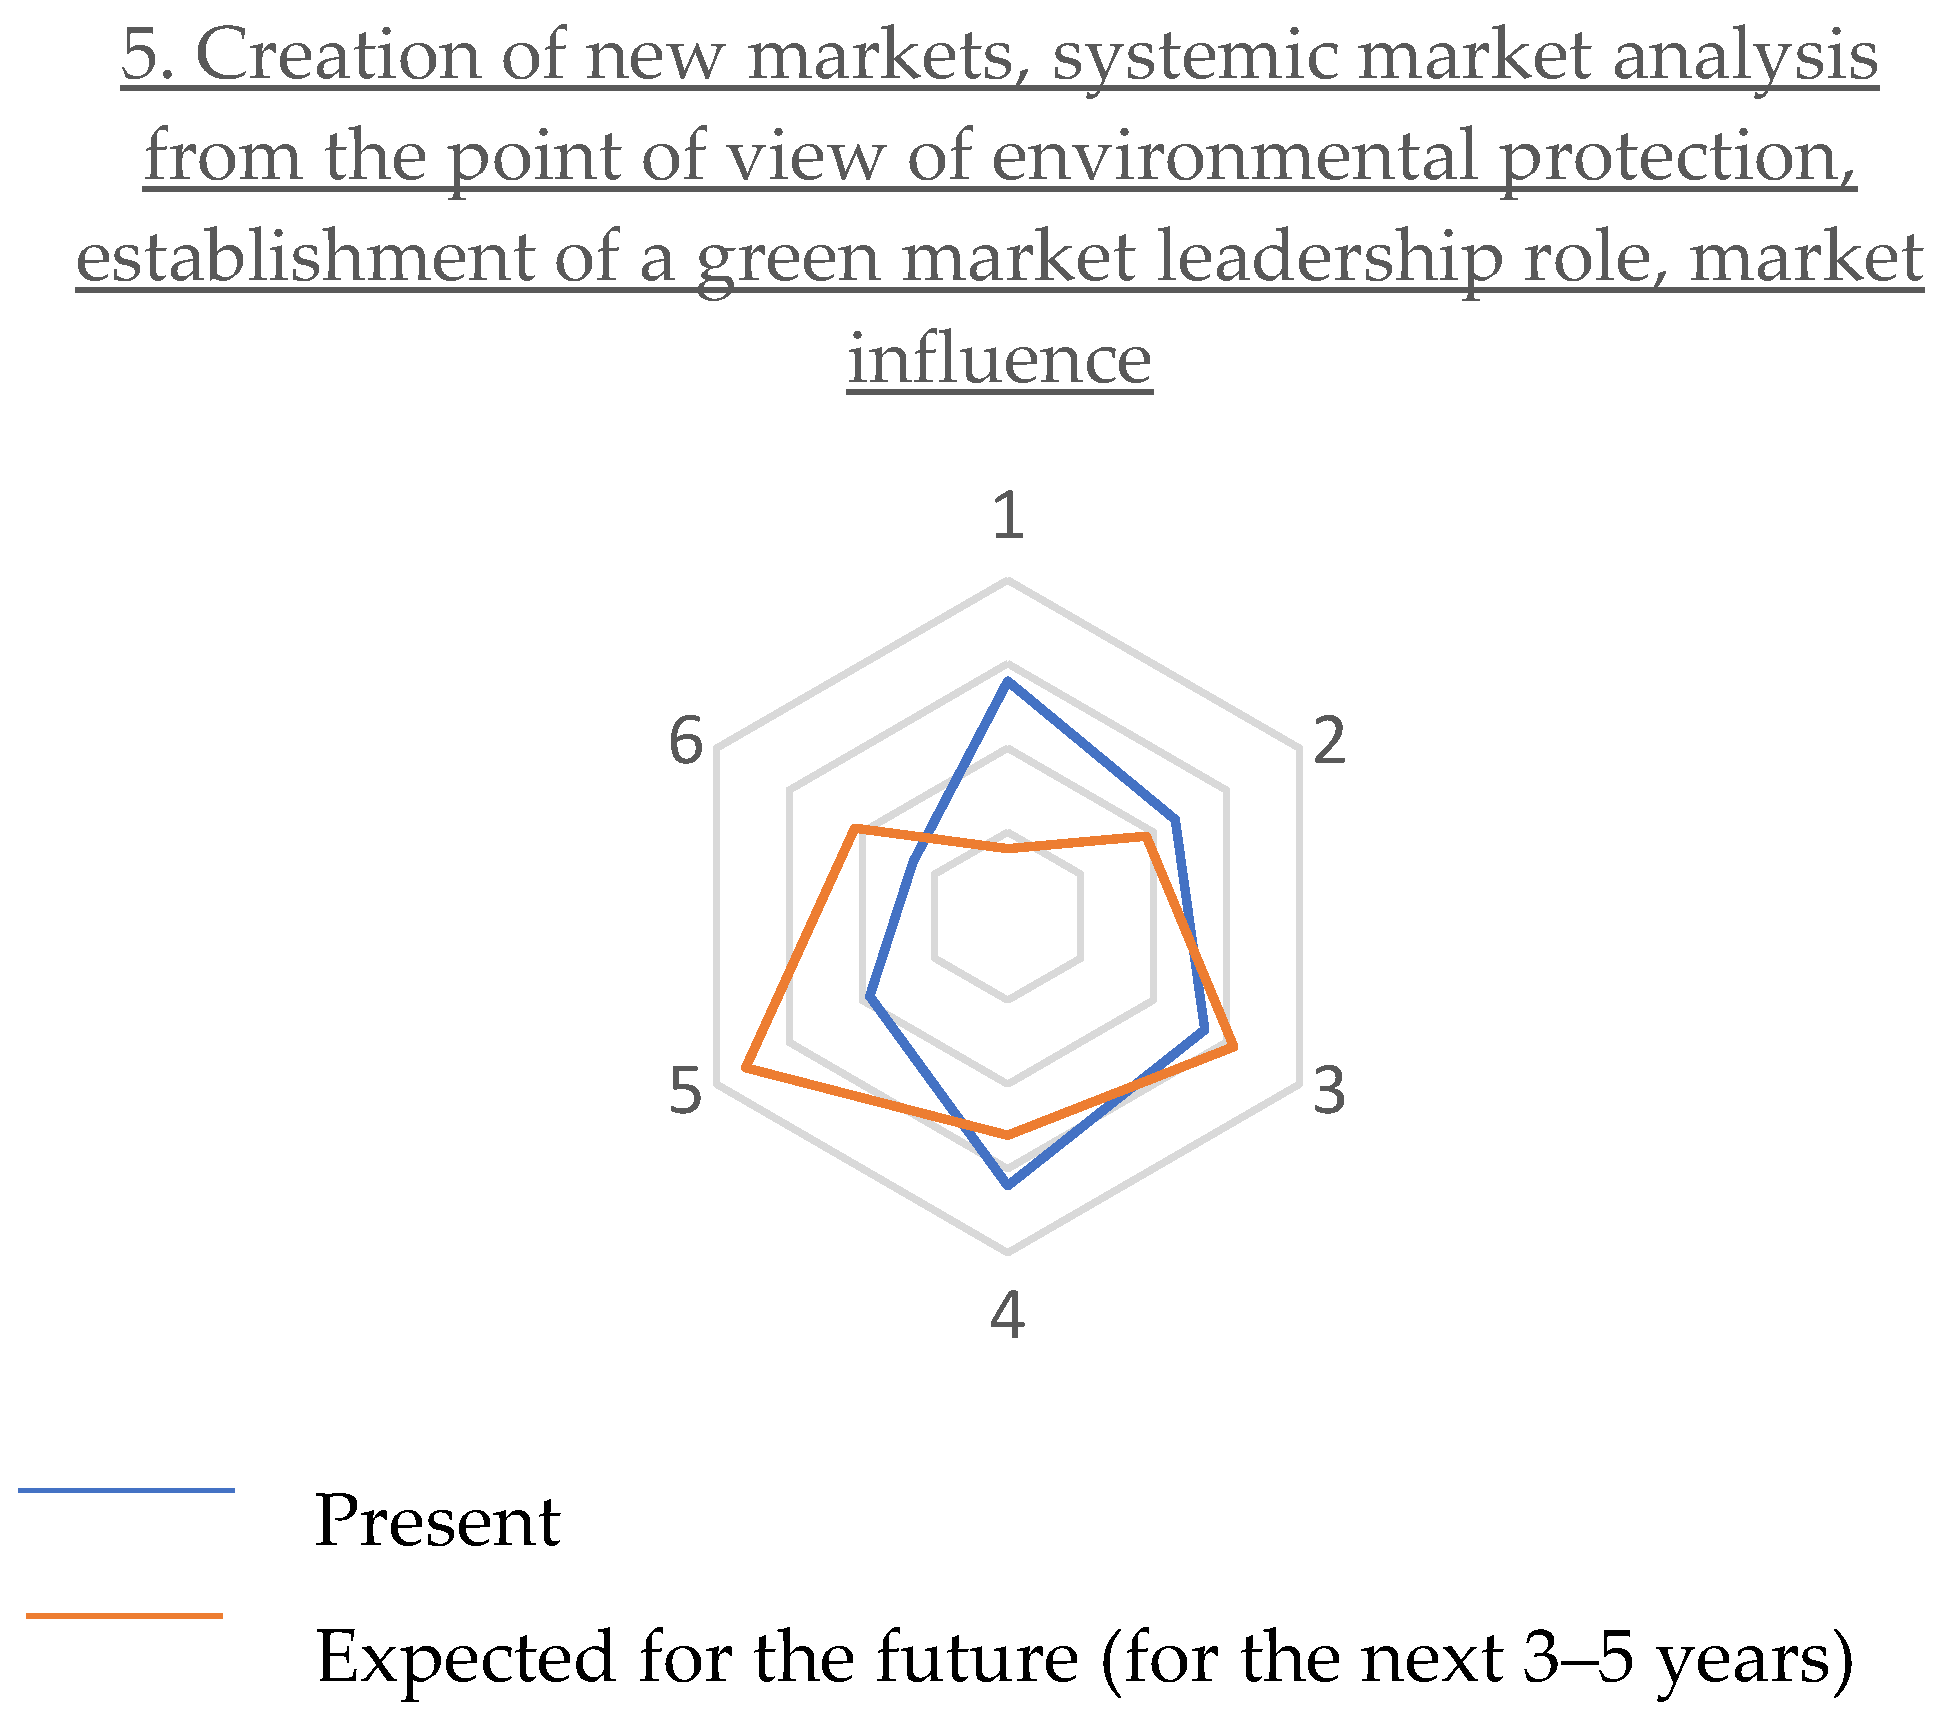
- Creation of new markets, systemic market analysis from the point of view of environmental protection, establishment of a green market leadership role, market influence.
- Creating incentives for daily action.
- Promoting environmental innovation by exceeding mandatory regulations.
- Ecological pricing of products and services.
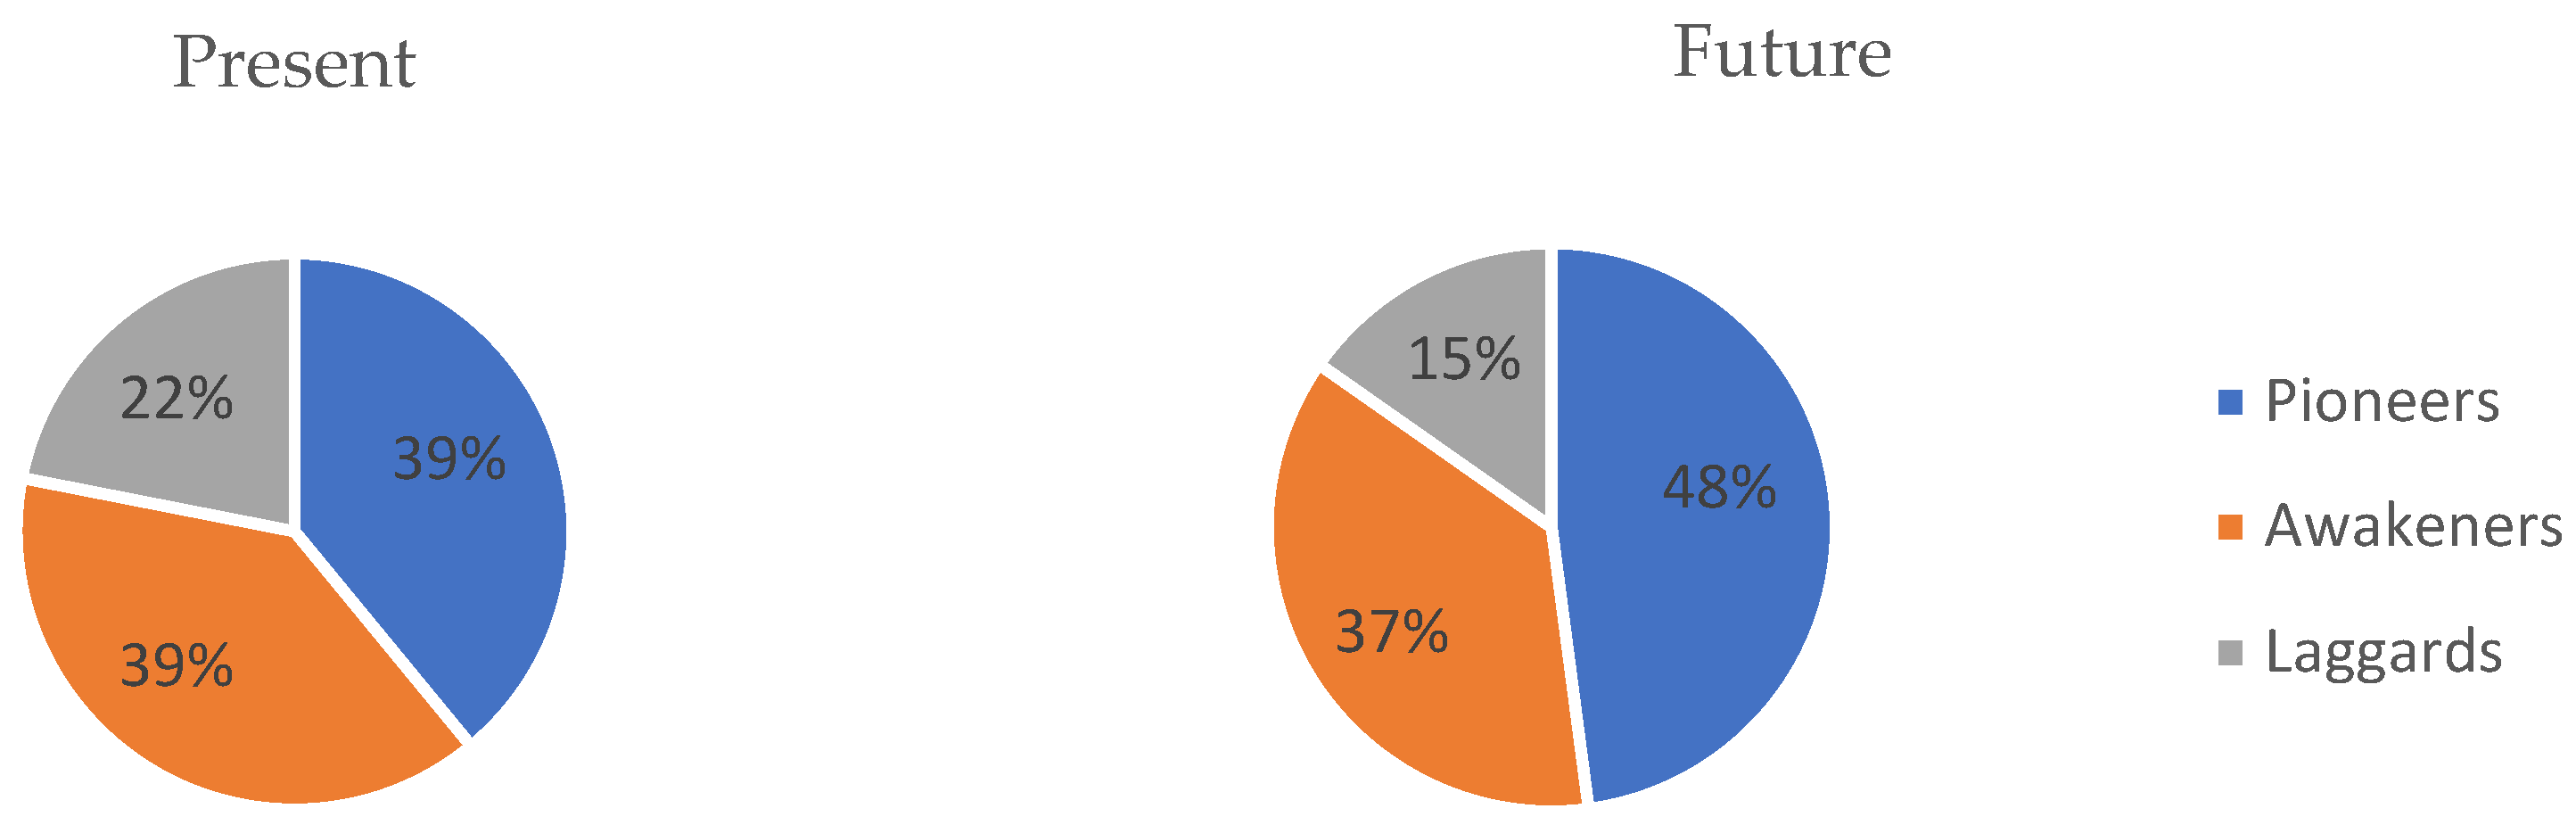
4.2. The Results of the Cluster Analysis for the Present
- Preparation of business plans according to the green business model (F = 154.41).
- Evaluating and encouraging the development of a green business model (F = 151.80).
- Creating incentives and obligations for partners in the value chain (F = 137.17).
- Promoting environmental innovation by exceeding mandatory regulations (F = 134.46).
- Creation of new markets, systemic market analysis from the point of view of environmental protection, establishment of a green market leadership role, market influence (F = 131.68).
- The Return on Assets (RoA) indicator shows the degree of efficiency in the use of assets. In the case of the enterprises included in the research, the enterprises belonging to the Laggards cluster perform best in terms of profitability relative to assets.
- The Return on Sales (RoS) indicator represents the net-profit ratio, so it measures profitability through the proportion of net sales that contributed to the after-tax result. Based on this profitability indicator, the Awakening cluster performed the best.
- In the case of the headcount-related profitability indicators, the cluster of Pioneers performed best, as expected.
4.3. The Results of the Cluster Analysis for the Future
- Seven enterprises from the cluster of Pioneers (1) were classified in a lower sustainability cluster, of which five enterprises fell into the cluster of Laggards (3).
- The greatest movement took place in the Awakeners (2) cluster; there was a shift in both directions, apart from a few enterprises; the range of companies belonging to this group changed significantly. However, 65% of the reclassifications took place in the direction of the lower cluster.
- A significant reorganization also took place in the cluster of Laggards (3); 60% of the group was placed in a higher-level cluster(in the Awakeners cluster), with the exception of three enterprises.
4.4. Limitations of the Research and Further Research Directions
5. Conclusions
Author Contributions
Funding
Data Availability Statement
Conflicts of Interest
References
- Adams, Richard, Sally Jeanrenaud, John Bessant, David Denyer, and Patrick Overy. 2016. Sustainability-oriented innovation: A systematic review. International Journal of Management Reviews 18: 180–205. [Google Scholar] [CrossRef] [Green Version]
- Alexandrescu, Filip, Lucrina Ștefănescu, and Alina Pop. 2022. Penumbras of the planetary mine: Experiencing (post-)mining transformations in the Western Carpathians of Romania. Eurasian Geography and Economics. [Google Scholar] [CrossRef]
- Araújo, Risolene Alves de Macena, Thamirys de Sousa Correia, and Renata Paes de Barros Câmara. 2022. Influence of Environmental Innovation on Corporate Sustainability in Latin American Companies. Organizações & Sociedade 29: 297–322. [Google Scholar] [CrossRef]
- Arbelo, Antonio, Pilar Pérez-Gómez, Felipe Manuel Rosa-González, and Libertad Ramos. 2014. Eco-efficiency: Environmental performance vs. economic performance. Management Studies 2: 239–53. [Google Scholar]
- Bakosné, Böröcz Mária. 2016. A környezeti kockázatok kezelése és a környezeti menedzsment rendszerek jelentősége a gyakorlatban. In Szent István Egyetem Szaktanácsadási és Továbbképzési Központ Tudományos szakmai kiadványok sorozata. Gödöllő: Szent István Egyetem. ISBN 978-963-269-532-7. [Google Scholar]
- Baldarelli, Maria-Gabriella, Mara Del Baldo, and Ninel Nesheva-Kiosseva. 2017. Environmental Accounting and Reporting. In CSR, Sustainability, Ethics & Governance. Berlin/Heidelberg: Springer. [Google Scholar] [CrossRef]
- Bhattacharya, Arindam, Nikolaus Lang, and Jim Hemerling. 2020. Beyond Great: Nine Strategies for Thriving in an Era of Social Tension, Economic Nationalism, and Technological Revolution. New York: Public Affairs. [Google Scholar]
- Biloslavo, Roberto, Carlo Bagnoli, and David Edgar. 2018. An eco-critical perspective on business models: The value triangle as an approach to closing the sustainability gap. Journal of Cleaner Production 174: 746–62. [Google Scholar] [CrossRef] [Green Version]
- Bognár, Ferenc, and Elvira Böcskei. 2022. Potential Model to Support the Achievement of Corporate Carbon Neutrality. Public Finance Quarterly 3: 379–95. [Google Scholar] [CrossRef]
- Bognár, Ferenc, and Petra Benedek. 2022. A novel AHP-PRISM risk assessment method—An empirical case study in a nuclear power plant. Sustainability 14: 11023. [Google Scholar] [CrossRef]
- Cai, Wugan, and Guangpei Li. 2018. The drivers of eco-innovation and its impact on performance: Evidence from China. Journal of Cleaner Production 176: 110–18. [Google Scholar] [CrossRef]
- Christensen, Clayton M. 1997. The Innovator’s Dilemma: When New Technologies Cause Great Firms to Fail. Boston: Harvard Business School Press. [Google Scholar]
- Christensen, Clayton M., Michael E. Raynor, and Rory McDonald. 2015. What is disruptive innovation? Harvard Business Review 93: 44–53. [Google Scholar]
- Christensen, Clayton M., Rory McDonald, Elizabeth J. Altman, and Jonathan E. Palmer. 2018. Disruptive innovation: An intellectual history and directions for future research. Journal of Management Studies 55: 1043–78. [Google Scholar] [CrossRef] [Green Version]
- Crețan, Remus, Liliana Guran-Nica, Dan Platon, and David Turnock. 2017. Foreign Direct Investment and Social Risk in Romania: Progress in Less-Favoured Areas. In Foreign Direct Investment and Regional Development in East Central Europe and the Former Soviet Union. London: Routledge, pp. 305–48. [Google Scholar] [CrossRef]
- Csath, Magdolna. 2019. A versenyképesség puha tényezői—Elméleti megalapozás. In A versenyképesség-mérés változásai és új irányai. Edited by Csath Magdolna. Budapest: Dialóg Campus Kiadó. Available online: https://nkerepo.uni-nke.hu/xmlui/bitstream/handle/123456789/12768/web_PDF_Versenykepesseg_meres.pdf?sequence=1#page=14 (accessed on 20 August 2022).
- Czakó, Sándor. 2016. Környezeti kockázat elemző módszerek alkalmazása. Available online: https://adoc.pub/krnyezeti-kockazat-elemz-modszerek-alkalmazasa.html (accessed on 18 September 2022).
- Eciia.eu. 2020. Available online: https://www.eciia.eu/202transpa0/05/alliance-for-corporate-transparency-2019-research-report/ (accessed on 22 September 2022).
- Ermenc, Anja, Monika Klemenčič, and Adriana Rejc Buhovac. 2017. Sustainability reporting in Slovenia: Does sustainability reporting impact financial performance? In Sustainability Reporting in Central and Eastern European Companies. Cham: Springer, pp. 181–97. [Google Scholar] [CrossRef]
- EU.hu/1. 2022. Available online: https://european-union.europa.eu/priorities-and-actions/actions-topic/environment_hu (accessed on 25 August 2022).
- EU.hu/2. 2022. Available online: https://eur-lex.europa.eu/summary/chapter/environment.html?root_default=SUM_1_CODED=20&locale=hu (accessed on 13 September 2022).
- Eur-lex. 2022. Available online: https://eur-lex.europa.eu/legal-content/EN/TXT/?uri=CELEX%3A32014L0095 (accessed on 10 July 2022).
- Evans, Steve, Doroteya Vladimirova, Maria Holgado, Kirsten Van Fossen, Miying Yang, Elisabete A. Silva, and Claire Y. Barlow. 2017. Towards a unified perspective for creation of sustainable business models. Business Strategy and the Environment 26: 597–608. [Google Scholar] [CrossRef]
- Fekete, Istvan. 2015. Integrált kockázatmenedzsment a gyakorlatban. Vezetéstudomány XLVI: 33–46. Available online: http://unipub.lib.uni-corvinus.hu/1856/1/vt2015n1p33.pdf (accessed on 22 October 2022). [CrossRef]
- Fekete, Istvan. 2022. A döntéshozatal támogatása a kockázatmenedzsment eszközeivel. Pénzügyi Szemle/Public Finance Quarterly 67: 27–46. [Google Scholar] [CrossRef]
- Forcadell, Francisco Javier, Elisa Aracil, and Fernando Úbeda. 2019. The influence of innovation on corporate sustainability in the international banking industry. Sustainability 11: 3210. [Google Scholar] [CrossRef] [Green Version]
- García-Sánchez, IsabelMaría, Isabel Gallego-Álvarez, and José-Luis Zafra-Gómez. 2019. Do the ecoinnovation and ecodesign strategies generate value added in munificent environments? Business Strategy and the Environment 29: 1021–33. [Google Scholar] [CrossRef]
- Geibler, Justus von, Julius Piwowar, and Annika Greven. 2019. The SDG-check: Guiding open innovation towards sustainable development goals. Technology Innovation Management Review 9: 20–37. [Google Scholar] [CrossRef]
- Geissdoerfer, Martin, Nancy M. P. Bocken, and Erik Jan Hultink. 2016. Design thinking to enhance the sustainable business modelling process—A workshop based on a value mapping process. Journal of Cleaner Production 135: 1218–32. [Google Scholar] [CrossRef] [Green Version]
- Geradts, Thijs H. J., and Nancy M. P. Bocken. 2018. Driving Sustainability-Oriented Innovation. MIT Sloan Review. Winter issue. Available online: https://sloanreview.mit.edu/article/driving-sustainability-oriented-innovation/ (accessed on 17 August 2022).
- Hamburg, Ileana. 2020. Learning for sustainable development through innovation in SMEs. Advances in Social Sciences Research Journal 7: 371–81. [Google Scholar] [CrossRef]
- Harvard Business Review Analytic Services. 2022. Reaping Returns on Environmental, Social, and Governance Investments. Available online: https://hbr.org/sponsored/2022/06/reaping-returns-on-environmental-social-and-governance-investments (accessed on 28 September 2022).
- Hermundsdottir, Fanny, and Arild Aspelund. 2020. Sustainability innovations and firm competitiveness: A review. Journal of Cleaner Production 280: 124715. [Google Scholar] [CrossRef]
- Hojnik, Jana, and Mitja Ruzzier. 2016. The driving forces of process eco-innovation and its impact on performance: Insights from Slovenia. Journal of Cleaner Production 133: 812–25. [Google Scholar] [CrossRef]
- Huang, Yinlun. 2021. Technology innovation and sustainability: Challenges and research needs. Technology Innovation and Sustainability: Challenges and Research Needs 23: 1663–64. [Google Scholar] [CrossRef]
- Isensee, Johannes, and Uwe Michel. 2011. Green Controlling–Die Rolle des Controllers und aktuelle Entwicklungen in der Praxis. Controlling 23: 436–42. [Google Scholar] [CrossRef] [Green Version]
- ISO 31000:2018. 2018, Risk Management–Principles and Guidelines by the International Organization for Standardization. Available online: https://www.iso.org/standard/65694.html (accessed on 5 September 2022).
- Joyce, Alexandre, and Raymond L. Paquin. 2016. The triple layered business model canvas: A tool to design more sustainable business models. Journal of cleaner production 135: 1474–86. [Google Scholar] [CrossRef]
- Katona, Andrea, Göllény-Kovács Nikoletta, Németh Kornél, and Péter Erzsébet. 2019. A vállalati stratégia hatása az ipari digitalizációra. In Határterületek. Edited by László Kovács. Szombathely: Savaria University Press, pp. 81–90. [Google Scholar]
- Kennedy, Steve, Gail Whiteman, and Jan van den Ende. 2017. Radical innovation for sustainability: The power of strategy and open innovation. Long Range Planning 50: 712–25. [Google Scholar] [CrossRef] [Green Version]
- Kivimaa, Paula, Senja Laakso, Annika Lonkila, and Minna Kaljonen. 2021. Moving beyond disruptive innovation: A review of disruption in sustainability transitions. Environmental Innovation and Societal Transitions 38: 110–26. [Google Scholar] [CrossRef]
- Kuzma, Edson Luccas Santin Padilha, Simone Sehnem, Dulcimar José Julkovski, and Darlan José Roman. 2020. The relationship between innovation and sustainability: A meta-analytic study. Journal of Cleaner Production 259: 120745. [Google Scholar] [CrossRef]
- Landrum, Nancy E. 2017. Stages of Corporate Sustainability: Integrating the Strong Sustainability Worldview. Organization & Environment 31: 287–313. [Google Scholar] [CrossRef]
- Loredo, Enrique, Nuria Lopez-Mielgo, Gustavo Pineiro-Villaverde, and María Teresa García-Álvarez. 2019. Utilities: Innovation and sustainability. Sustainability 11: 1085. [Google Scholar] [CrossRef] [Green Version]
- Marinova, Dora, Jin Hong, Vladislav Todorov, and Xiumei Guo. 2017. Understanding innovation for sustainability. In Methods for Sustainability Research. Cheltenham: Edward Elgar Publishing, pp. 217–30. [Google Scholar]
- McCausland, Tammy. 2021. Innovating for Sustainability. Research-Technology Management 64: 59–63. [Google Scholar] [CrossRef]
- McDowall, Will. 2018. Disruptive innovation and energy transitions: Is Christensen’s theory helpful? Energy Research & Social Science 37: 243–46. [Google Scholar] [CrossRef]
- Mead, Taryn, Sally Jeanrenaud, and John Bessant. 2022. Sustainability oriented innovation narratives: Learning from nature inspired innovation. Journal of Cleaner Production 344: 130980. [Google Scholar] [CrossRef]
- Michel, Uwe, Johannes Isensee, and Alexander Stehle. 2014. Sustainability Controlling: Planung, Steuerung und Kontrolle der Realisierung der Nachhaltigkeitsstrategie. In CSR und Finance. Berlin/Heidelberg: Springer Gabler, pp. 97–111. [Google Scholar]
- Molnár, Tamás. 2015. Empirikus területi kutatások. Budapest: Akadémiai Kiadó Zrt. ISBN 9789630595988. [Google Scholar]
- Nasiri, Mina, Nina Tura, and Ville Ojanen. 2017. Developing Disruptive Innovations for Sustainability: A Review on Impact of Internet of Things (IOT). Paper presented at Portland International Conference on Management of Engineering and Technology (PICMET), Portland, OR, USA, July 9–13; pp. 1–10. [Google Scholar] [CrossRef]
- Nidumolu, Ram, C. K. Prahalad, and M. R. Rangaswami. 2013. Why Sustainability Is Now the Key Driver of Innovation. IEEE Engineering Management Review 41: 30–37. [Google Scholar] [CrossRef]
- Nosratabadi, Saeed, Amir Mosavi, Shahaboddin Shamshirband, Edmundas Kazimieras Zavadskas, Andry Rakotonirainy, and Kwok Wing Chau. 2019. Sustainable business models: A review. Sustainability 11: 1663. [Google Scholar] [CrossRef] [Green Version]
- OECD. 2017. Economic Policy Reforms 2017. Going for Growth. Paris: OECD Publishing. Available online: https://read.oecd-ilibrary.org/economics/economic-policy-reforms-2017_growth-2017-en#page1 (accessed on 10 July 2022).
- Oskam, Inge, Bart Bossink, and Ard-Pieter de Man. 2018. The interaction between network ties and business modeling: Case studies of sustainability-oriented innovations. Journal of Cleaner Production 177: 555–66. [Google Scholar] [CrossRef] [Green Version]
- Pásztor, Dávid. 2022. Szigorodnak a szabályok Európában az ellátási láncok fenntarthatóvá tételére. Logisztikai Híradó XXXII: 33–36. Available online: https://www.horvath-partners.com/hu/media-center/cikkek/szigorodnak-a-szabalyok-europaban-az-ellatasi-lancok-fenntarthatova-tetelere (accessed on 7 August 2022).
- Pavie, Xavier, Daphné Carthy, and Victor Scholten. 2014. Responsible Innovation: From Concept to Practice. Singapore: World Scientific. [Google Scholar] [CrossRef]
- Project Management Institute. 2019. A Guide to the Project Management Body of Knowledge, 6th ed. Philadelphia: Project Management Institute. [Google Scholar]
- Rasool, Faisal, Pisut Koomsap, Bilal Afsar, and Babrak Ali Panezai. 2018. A framework for disruptive innovation. Foresight 20: 252–70. [Google Scholar] [CrossRef]
- Renner, Marc W. J., Friedemann Salisch, and Maximilian Henkel. 2022. CFO Study 2022—Deep Dive. Sustainability Performance Management. The CFO as Co-Pilot and Performance Manager in the Sustainability Transformation. Stuttgart: Horvath AG. Available online: https://www.horvath-partners.com/en/media-center/studies/cfo-study-2022-deep-dive (accessed on 23 August 2022).
- Rîșteiu, Nicoleta Toader, Remus Creţan, and Thomas O’Brien. 2022. Contesting post-communist economic development: Gold extraction, local community, and rural decline in Romania. Eurasian Geography and Economics 63: 491–513. [Google Scholar]
- Roman, Mona, Jingwei Liu, and Timo Nyberg. 2018. Advancing the open science movement through sustainable business model development. Industry and Higher Education 32: 226–34. [Google Scholar] [CrossRef]
- Sommer, Axel. 2012. Managing Green Business Model Transformations. Berlin: Springer Science & Business Media. [Google Scholar]
- Stanford Graduate School of Business, Ecovais. 2021. Sustainable Procurement Barometer 2021. From Resilience to Opportunity: Sustainability Pays Off Through the Crisis and Beyond. Available online: https://www.gsb.stanford.edu/sites/default/files/publication/pdfs/vcii-white-paper-sustainable-procurement-barometer-2021-aug.pdf (accessed on 2 September 2022).
- Vasileiou, Efi, Nikolaos Georgantzis, Guiseppe Attanasi, and Patrick Llerena. 2022. Green innovation and financial performance: A study on Italian firms. Research Policy 51: 104530. [Google Scholar] [CrossRef]
- Verzuh, Eric. 2021. The Fast Forward MBA in Project Management: The Comprehensive, Easy to Read Handbook for Beginners and Pros. New York: Wiley. ISBN 9781119700760. [Google Scholar]
- Vesalon, Lucian, and Remus Creţan. 2013. Mono-Industrialism and the Struggle for Alternative Development. Tijdschrift voor Economische en Sociale Geografie 104: 539–55. [Google Scholar] [CrossRef]
- Young, David, and Martin Reeves. 2020. The Quest for Sustainable Business Model Innovation. BCG Henderson Institute. Available online: https://web-assets.bcg.com/img-src/BCG-The-Quest-for-Sustainable-Business-Model-Innovation-Mar-2020_tcm9-240570.pdf (accessed on 11 September 2022).


| Sustainability Innovation | Competitive Advantage | ||
|---|---|---|---|
| Product | Quality improvement | Increased value creation | Market share |
| Reduced material and energy use | Profitability | ||
| More environmentally friendly materials | Sales growth | ||
| Environmentally friendly packaging | First mover advantage | ||
| Recycling and reuse | New market opportunities | ||
| Eco-labeling (can increase sales) | Reduced costs | Productivity | |
| Process | Reduced emissions | Efficiency | |
| Reduced waste | Reduced costs | ||
| Recycle and reuse | Non-financial assets | Reputation | |
| Reduced energy and materials consumption | Image | ||
| Reduced resources | Quality | ||
| Lower consumption of water, electricity, gas patrol, coal | Customer satisfaction | ||
| Managerial | Environmental management | ||
| ISO certifications | |||
| Green marketing | |||
| Organizational methods | |||
| Operational Optimization “Eco-Efficiency” | Organizational Transformation “New Market Opportunities” | Systems Building “Societal Change” | |
|---|---|---|---|
| Innovation Objective | Compliance, efficiency “Doing the same things better” | Novel products, service or business models “Doing good by doing new things” | Novel products, service or business models that are impossible to achieve alone “Doing good by doing new things with others” |
| Innovation Outcome | Reduces harm | Creates shared value | Create net-positive impact |
| Innovation’s Relationship to the Firm | Incremental improvements to business as usual | Fundamental shift in firm purpose | Extends beyond the firm to drive institutional change |
| Strategy | Complying with regulations or pursue efficiency gains | Embedding sustainability as a cultural and strategic norm in a shaping logic that goes beyond greening | Logic of wide collaborations and investing in system solutions to drive new, co-created value propositions |
| Process | Focus on internal and incremental innovations | Adopting new values, platforms and new ideation practices (e.g., biomimicry) | Adopting new collaborative process platforms with diverse stakeholders |
| Stage | Green Compliance | Wait-and-See Strategy | Green Products and Services | Completely Green Strategy |
|---|---|---|---|---|
| Goals | Compliance, risks and costs goals | All five stages are of low importance, image and social goals | Focusing on green products and services, innovation, competitive advantage and turnover growth targets | All five stages are above average and balanced in importance |
| Stakeholders | Outside of legislation, there is little external influence | The influence of external stakeholders is still low | Above-average influence of market players | Strong influence of all stakeholders |
| Share among the investigated enterprises | 20% | 27% | 26% | 27% |
| Author | Basis of Grouping | Grouping Criteria | Groups |
|---|---|---|---|
| Adams et al. (2016) | Sustainability-oriented innovation (SOI) SOI practices and processes | based on the examination of 100 scientific publications and 27 gray sources | Operational Optimization—“Eco-Effinciency” |
| Organizational Transformation—“New Market Opportunities” | |||
| Systems Building—“Societal Change” | |||
| Mead et al. (2022) | Types of organizational narratives related to SOI | Using data generated from semi-structured interviews (n = 52) | Ambiguous |
| Accountable | |||
| Aspirational | |||
| Landrum (2017) | Stages of corporate sustainability | Based on the integration of developmental stages of 22 micro- and macro-level models | Compliance |
| Business-centered sustainability | |||
| Systemic sustainability | |||
| Regenerative sustainability | |||
| Coevolutionary sustainability | |||
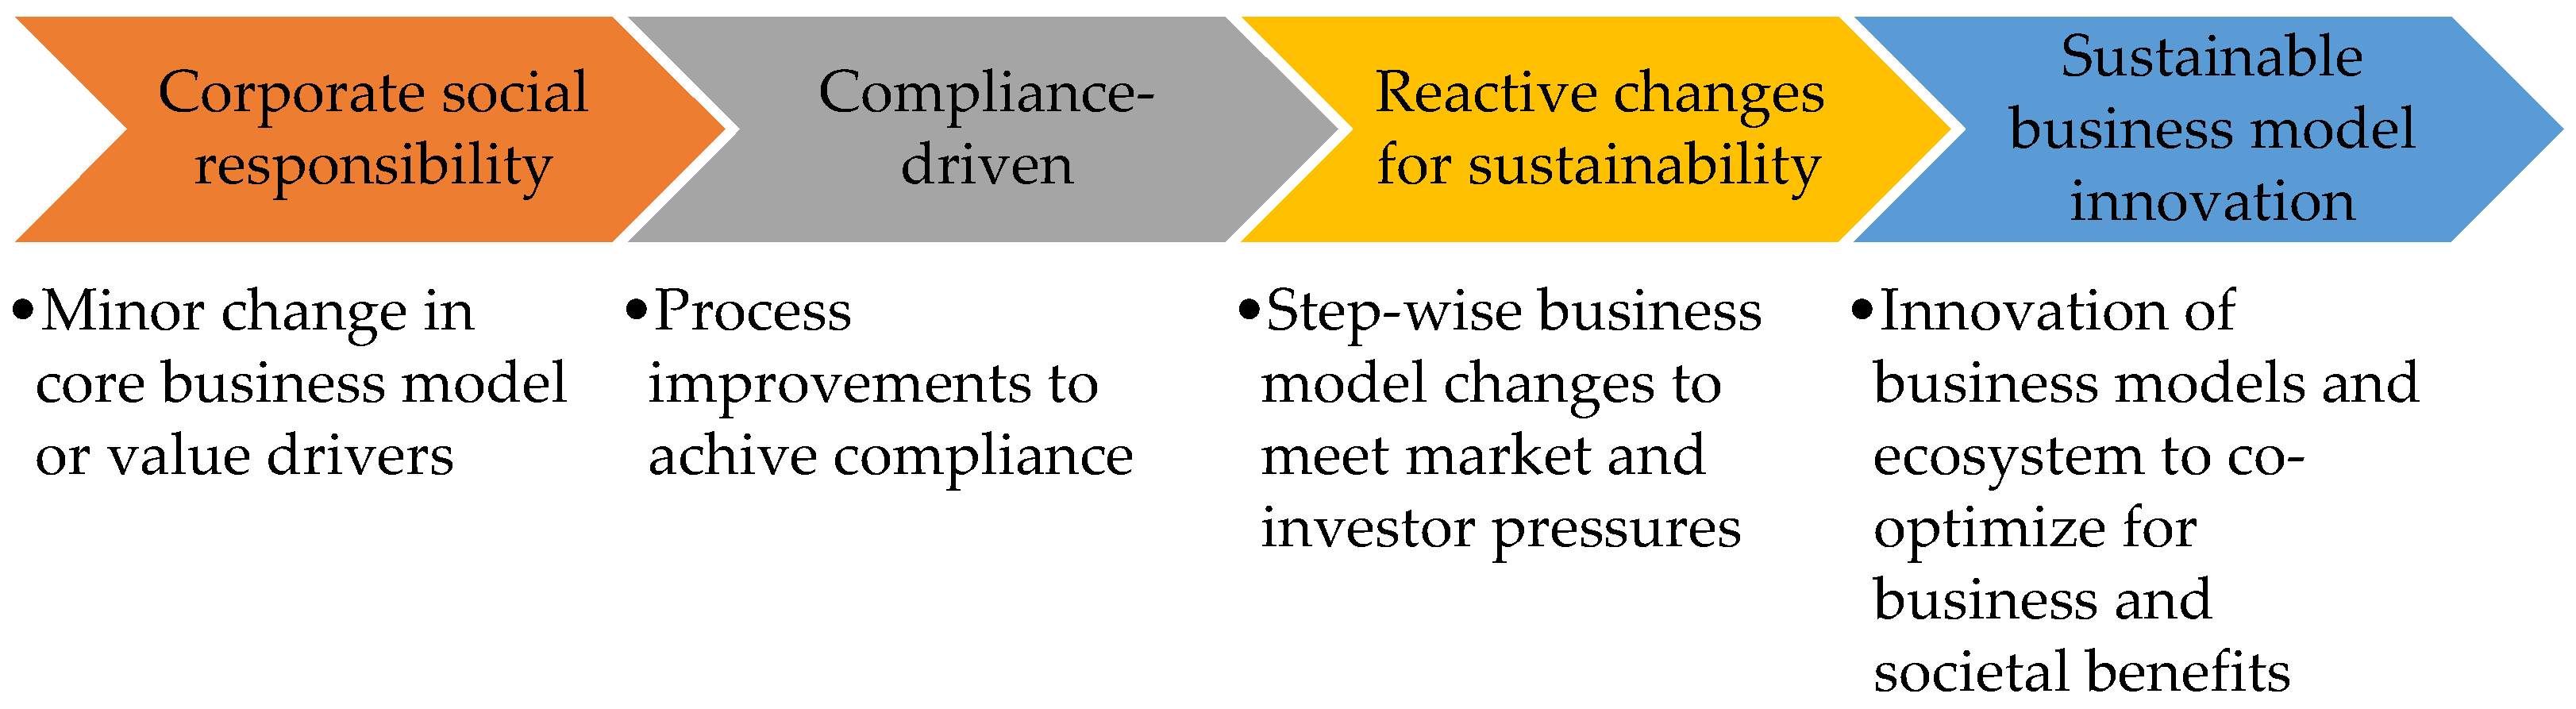
| Young and Reeves (2020) | Spectrum of company maturity from corporate social responsibility (CSR) to “sustainable business model innovation” (S-BMI) | Non applicable | Corporate social responsibility |
| Compliance-driven | |||
| Reactive changes for sustainability | |||
| Sustainable business model innovation | |||
| Nidumolu et al. (2013) | Stage model of becoming sustainable | Studying the sustainability initiatives of 30 large corporations | Green Compliance as Opportunity |
| Making Value Chains Sustainable | |||
| Designing Sustainable Products and Services | |||
| Developing New Business Models | |||
| Creating Next-Practice Platforms | |||
| Isensee and Michel (2011) | Based on the five steps of becoming sustainable by Nidumolu et al. | A survey of 295 medium- and large-sized enterprises in Germany | Green Compliance |
| Wait-and-see Strategy | |||
| Green Products and Services | |||
| Completely green strategy | |||
| Pavie et al. (2014) | Integration of responsibility at all levels of the organization | Via four workshops: ‘theoretical’ approach; Deductive; analyzed by academics; ‘Practical’ approach; Inductive; analyzed by banking- and insurance-sector users and professionals | Comply with the law |
| Anticipate future legal requirements | |||
| Think the value chain as an ecosystem | |||
| Develop responsible products and services | |||
| Lead the change |
| Stage 1 | 1/a. Promoting environmental innovation by exceeding mandatory regulations |
| 1/b. Creating transparency regarding the resource use and emissions | |
| 1/c. Assessment of opportunities and risks related to environmental protection | |
| 1/d. Creating incentives for daily action | |
| Stage 2 | 2/a. Creating transparency of direct and indirect environmental impacts |
| 2/b. Creating incentives and obligations for partners in the value chain | |
| Stage 3 | 3/a. Evaluation of environmentally friendly product alternatives |
| 3/b. Determining consumers’ willingness to pay for more environmentally friendly products/services | |
| 3/c. Ecological pricing of products and services | |
| Stage 4 | 4/a. Evaluating and encouraging the development of a green business model |
| 4/b. Preparation of business plans according to the green business model | |
| Stage 5 | 5. Creation of new markets, systemic market analysis from the point of view of environmental protection, establishment of a green market leadership role, market influence |
| Final Cluster Centers | |||
|---|---|---|---|
| Cluster | |||
| 1 Pioneers | 2 Awakeners | 3 Laggards | |
| 1/a. Promoting environmental innovation by exceeding mandatory regulations | 0.7589 | 0.0491 | −1.3919 |
| 1/b. Creating transparency regarding the resource use and emissions | 0.6941 | 0.1008 | −1.3911 |
| 1/c. Assessment of opportunities and risks related to environmental protection | 0.6146 | 0.0250 | −1.1562 |
| 1/d. Creating incentives for daily action | 0.7869 | −0.0943 | −1.1875 |
| 2/a. Creating transparency of direct and indirect environmental impacts | 0.7864 | −0.0490 | −1.2644 |
| 2/b. Creating incentives and obligations for partners in the value chain | 0.9069 | −0.2169 | −1.2008 |
| 2/a. Evaluation of environmentally friendly product alternatives | 0.7858 | −0.1309 | −1.0969 |
| 3/b. Determining consumers’ willingness to pay for more environmentally friendly products/services | 0.8575 | −0.2457 | −1.0170 |
| 3/c. Ecological pricing of products and services | 0.9430 | −0.2723 | −1.1063 |
| 4/a. Evaluating and encouraging the development of a green business model | 0.9075 | −0.1760 | −1.2519 |
| 4/b. Preparation of business plans according to the green business model | 0.9485 | −0.2234 | −1.2026 |
| 5. Creation of new markets, systemic market analysis from the point of view of environmental protection, establishment of a green market leadership role, market influence | 0.9657 | −0.3251 | −1.0608 |
| Clusters | Return on Assets (%) | Return on Sales (%) | Earnings per Head (Thousand Ft) | Turnover per Head (Thousand Ft) |
|---|---|---|---|---|
| 1—Pioneers | 4.90% | 4.08% | 1521 | 46,569 |
| 2—Awakeners | 3.54% | 4.41% | 1029 | 33,436 |
| 3—Laggards | 6.13% | 3.83% | 1251 | 28,446 |
| Final Cluster Centers | |||
|---|---|---|---|
| Cluster | |||
| 1 Pioneers | 2 Awakeners | 3 Laggards | |
| 1/a. Promoting environmental innovation by exceeding mandatory regulations | 0.6587 | −0.2012 | −1.5996 |
| 1/b. Creating transparency regarding the resource use and emissions | 0.5952 | −0.1390 | −1.6180 |
| 1/c. Assessment of opportunities and risks related to environmental protection | 0.5663 | −0.1865 | −1.4876 |
| 1/d. Creating incentives for daily action | 0.5991 | −0.1366 | −1.5622 |
| 2/a. Creating transparency of direct and indirect environmental impacts | 0.6174 | −0.2321 | −1.4464 |
| 2/b. Creating incentives and obligations for partners in the value chain | 0.6843 | −0.3098 | −1.3831 |
| 3/a. Evaluation of environmentally friendly product alternatives | 0.6926 | −0.3222 | −1.3939 |
| 3/b. Determining consumers’ willingness to pay for more environmentally friendly products/services | 0.5214 | −0.1884 | −1.1748 |
| 3/c. Ecological pricing of products and services | 0.7061 | −0.3927 | −1.2728 |
| 4/a. Evaluating and encouraging the development of a green business model | 0.7443 | −0.3915 | −1.4594 |
| 4/b. Preparation of business plans according to the green business model | 0.7629 | −0.3830 | −1.4875 |
| 5. Creation of new markets, systemic market analysis from the point of view of environmental protection, establishment of a green market leadership role, market influence | 0.7389 | −0.4517 | −1.2368 |
Disclaimer/Publisher’s Note: The statements, opinions and data contained in all publications are solely those of the individual author(s) and contributor(s) and not of MDPI and/or the editor(s). MDPI and/or the editor(s) disclaim responsibility for any injury to people or property resulting from any ideas, methods, instructions or products referred to in the content. |
© 2023 by the authors. Licensee MDPI, Basel, Switzerland. This article is an open access article distributed under the terms and conditions of the Creative Commons Attribution (CC BY) license (https://creativecommons.org/licenses/by/4.0/).
Share and Cite
Fekete-Berzsenyi, H.; Molnárné Barna, K.; Koczor-Keul, M. Current and Expected Development of Corporate Strategies for Managing Environmental Risks in Hungary. Risks 2023, 11, 47. https://doi.org/10.3390/risks11030047
Fekete-Berzsenyi H, Molnárné Barna K, Koczor-Keul M. Current and Expected Development of Corporate Strategies for Managing Environmental Risks in Hungary. Risks. 2023; 11(3):47. https://doi.org/10.3390/risks11030047
Chicago/Turabian StyleFekete-Berzsenyi, Hajnalka, Katalin Molnárné Barna, and Melinda Koczor-Keul. 2023. "Current and Expected Development of Corporate Strategies for Managing Environmental Risks in Hungary" Risks 11, no. 3: 47. https://doi.org/10.3390/risks11030047