
Association between Sleep Quality and Depression Symptoms in Chinese College Students during the COVID-19 Lockdown Period


Abstract
:1. Introduction
2. Methods
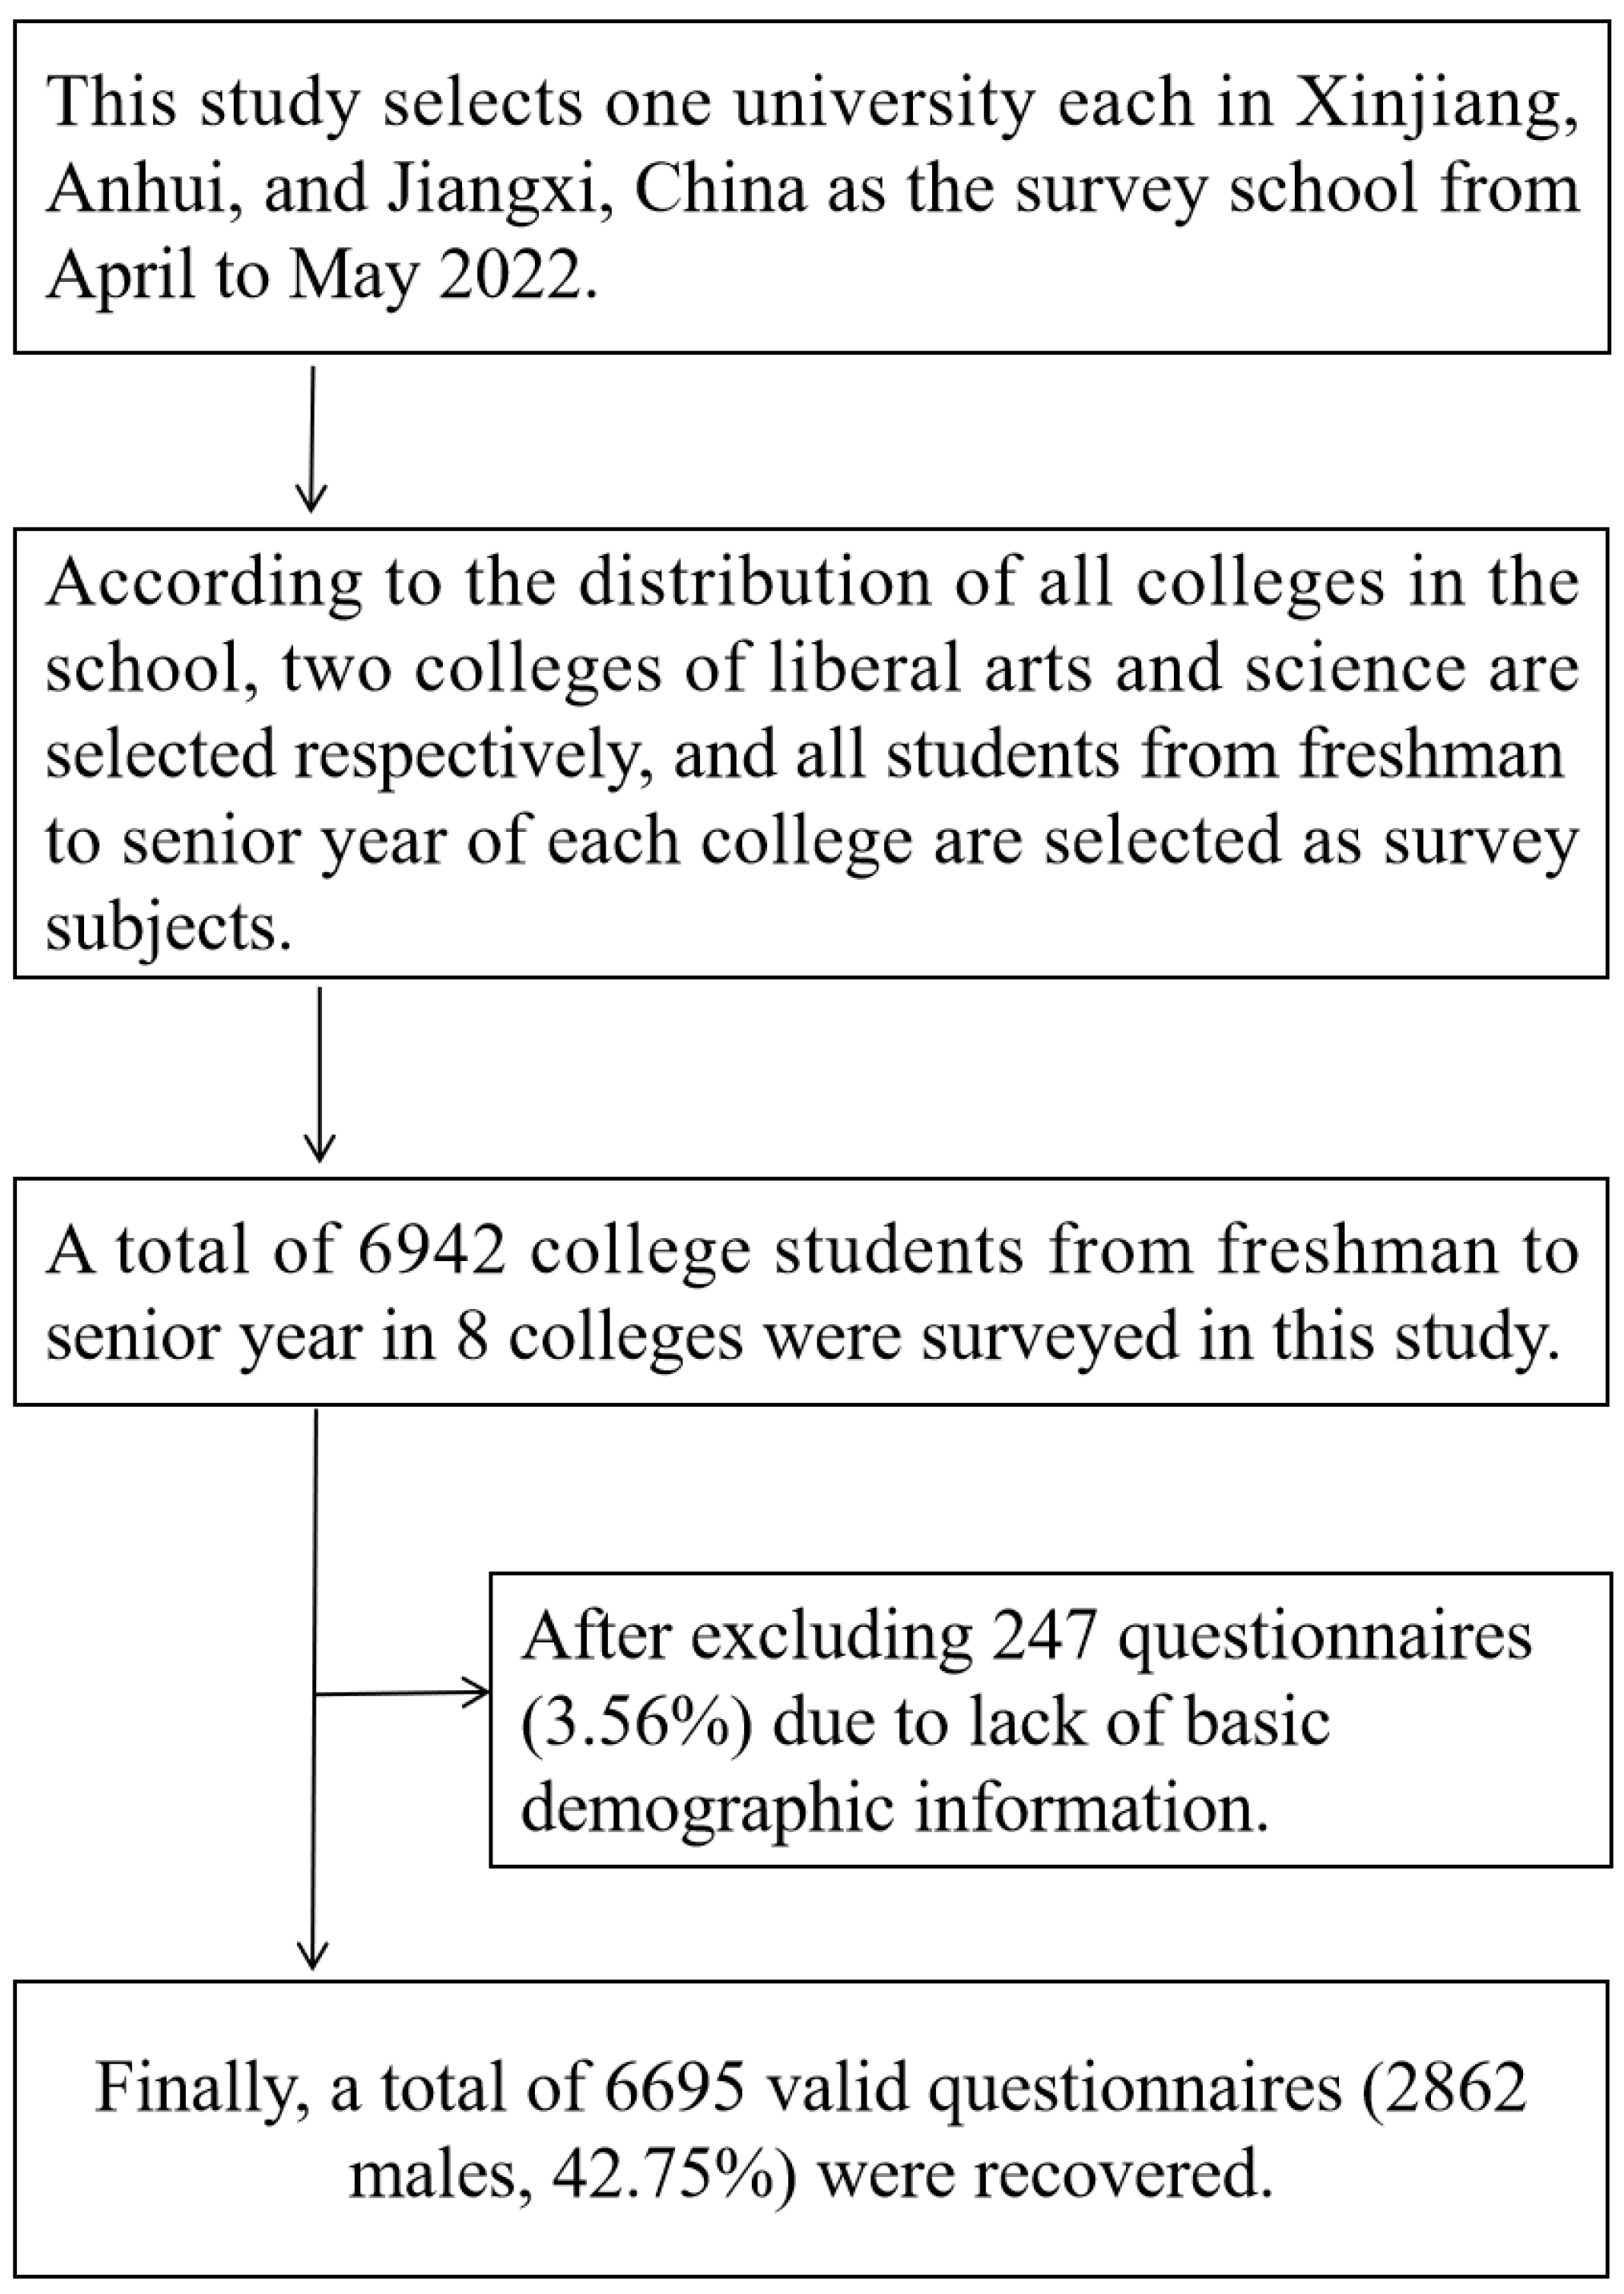
2.1. Data Collection and Participants
2.2. Procedure
2.3. Depressive Symptoms
2.4. Sleep Quality
2.5. Covariates
2.6. Statistical Analysis
3. Results
4. Discussion
5. Conclusions
Author Contributions
Funding
Institutional Review Board Statement
Informed Consent Statement
Data Availability Statement
Acknowledgments
Conflicts of Interest
References
- American Institute of Stress. Stress: An Epidemic among College Students. Available online: https://www.stress.org/stress-an-epidemic-among-college-students (accessed on 12 June 2022).
- Karia, R.; Gupta, I.; Khandait, H.; Yadav, A.; Yadav, A. COVID-19 and its Modes of Transmission. SN Compr. Clin. Med. 2020, 2, 1798–1801. [Google Scholar] [CrossRef] [PubMed]
- Bao, Y.; Sun, Y.; Meng, S.; Shi, J.; Lu, L. 2019-nCoV epidemic: Address mental health care to empower society. Lancet 2020, 395, e37–e38. [Google Scholar] [CrossRef]
- Shigemura, J.; Ursano, R.J.; Morganstein, J.C.; Kurosawa, M.; Benedek, D.M. Public responses to the novel 2019 coronavirus (2019-nCoV) in Japan: Mental health consequences and target populations. Psychiatry Clin. Neurosci. 2020, 74, 281–282. [Google Scholar] [CrossRef] [PubMed]
- Brooks, S.K.; Webster, R.K.; Smith, L.E.; Woodland, L.; Wessely, S.; Greenberg, N.; Rubin, G.J. The psychological impact of quarantine and how to reduce it: Rapid review of the evidence. Lancet 2020, 395, 912–920. [Google Scholar] [CrossRef]
- Holmes, E.A.; O’Connor, R.C.; Perry, V.H.; Tracey, I.; Wessely, S.; Arseneault, L.; Ballard, C.; Christensen, H.; Cohen, S.R.; Everall, I.; et al. Multidisciplinary research priorities for the COVID-19 pandemic: A call for action for mental health Science. Lancet Psychiatry 2020, 7, 547–560. [Google Scholar] [CrossRef]
- Sundarasen, S.; Chinna, K.; Kamaludin, K.; Nurunnabi, M.; Baloch, G.M.; Khoshaim, H.B.; Hossain, S.; Sukayt, A. Psychological Impact of COVID-19 and Lockdown among University Students in Malaysia: Implications and Policy Recommendations. Int. J. Environ. Res. Public Health 2020, 17, 6206. [Google Scholar] [CrossRef]
- Aylie, N.S.; Mekonen, M.A.; Mekuria, R.M. The Psychological Impacts of COVID-19 Pandemic Among University Students in Bench-Sheko Zone, South-west Ethiopia: A Community-based Cross-sectional Study. Psychol. Res. Behav. Manag. 2020, 13, 813–821. [Google Scholar] [CrossRef]
- Huang, Y.; Zhao, N. Generalized anxiety disorder, depressive symptoms and sleep quality during COVID-19 outbreak in China: A web-based cross-sectional survey. Psychiatry Res. 2020, 288, 112954. [Google Scholar] [CrossRef]
- WHO. COVID-19 Pandemic Triggers 25% Increase in Prevalence of Anxiety and Depression Worldwide. Available online: https://www.who.int/news/item/02-03-2022-COVID-19-pandemic-triggers-25-increase-in-prevalence-of-anxiety-and-depression-worldwide (accessed on 15 June 2022).
- Qiu, J.; Shen, B.; Zhao, M.; Wang, Z.; Xie, B.; Xu, Y. A nationwide survey of psychological distress among Chinese people in the COVID-19 epidemic: Implications and policy recommendations. Gen. Psychiatry 2020, 33, e100213. [Google Scholar] [CrossRef]
- Gao, J.; Zheng, P.; Jia, Y.; Chen, H.; Mao, Y.; Chen, S.; Wang, Y.; Fu, H.; Dai, J. Mental health problems and social media exposure during COVID-19 outbreak. PLoS ONE 2020, 15, e231924. [Google Scholar] [CrossRef]
- Magson, N.R.; Freeman, J.; Rapee, R.M.; Richardson, C.E.; Oar, E.L.; Fardouly, J. Risk and Protective Factors for Prospective Changes in Adolescent Mental Health during the COVID-19 Pandemic. J. Youth Adolesc. 2021, 50, 44–57. [Google Scholar] [CrossRef] [PubMed]
- Wang, X.; Hegde, S.; Son, C.; Keller, B.; Smith, A.; Sasangohar, F. Investigating Mental Health of US College Students During the COVID-19 Pandemic: Cross-Sectional Survey Study. J. Med. Internet Res. 2020, 22, e22817. [Google Scholar] [CrossRef] [PubMed]
- Liu, S.; Yang, L.; Zhang, C.; Xiang, Y.T.; Liu, Z.; Hu, S.; Zhang, B. Online mental health services in China during the COVID-19 outbreak. Lancet Psychiatry 2020, 7, e17–e18. [Google Scholar] [CrossRef]
- Cao, W.; Fang, Z.; Hou, G.; Han, M.; Xu, X.; Dong, J.; Zheng, J. The psychological impact of the COVID-19 epidemic on college students in China. Psychiatry Res. 2020, 287, 112934. [Google Scholar] [CrossRef] [PubMed]
- Chang, J.; Yuan, Y.; Wang, D. Mental health status and its influencing factors among college students during the epidemic of COVID-19. Nan Fang Yi Ke Da Xue Xue Bao 2020, 40, 171–176. [Google Scholar] [CrossRef]
- Ei, Z.G.F.; Jian-wen, C.; Heng-jian, X. Analysis on the Status of anxiety and depress of students in a university in Shandong. Mod. Prev. Med. 2014, 41, 2399–2400. [Google Scholar]
- Roth, T.; Jaeger, S.; Jin, R.; Kalsekar, A.; Stang, P.E.; Kessler, R.C. Sleep problems, comorbid mental disorders, and role functioning in the national comorbidity survey replication. Biol. Psychiatry 2006, 60, 1364–1371. [Google Scholar] [CrossRef]
- Cheng, S.H.; Shih, C.C.; Lee, I.H.; Hou, Y.W.; Chen, K.C.; Chen, K.T.; Yang, Y.K.; Yang, Y.C. A study on the sleep quality of incoming university students. Psychiatry Res. 2012, 197, 270–274. [Google Scholar] [CrossRef]
- Lund, H.G.; Reider, B.D.; Whiting, A.B.; Prichard, J.R. Sleep patterns and predictors of disturbed sleep in a large population of college students. J. Adolesc. Health 2010, 46, 124–132. [Google Scholar] [CrossRef]
- Nojomi, M.; Ghalhe, B.M.; Kaffashi, S. Sleep pattern in medical students and residents. Arch. Iran. Med. 2009, 12, 542–549. [Google Scholar]
- Zhou, S.J.; Wang, L.L.; Yang, R.; Yang, X.J.; Zhang, L.G.; Guo, Z.C.; Chen, J.C.; Wang, J.Q.; Chen, J.X. Sleep problems among Chinese adolescents and young adults during the coronavirus-2019 pandemic. Sleep Med. 2020, 74, 39–47. [Google Scholar] [CrossRef] [PubMed]
- Dinis, J.; Braganca, M. Quality of Sleep and Depression in College Students: A Systematic Review. Sleep Sci. 2018, 11, 290–301. [Google Scholar] [CrossRef] [PubMed]
- Peltzer, K.; Pengpid, S. Depressive symptoms and social demographic, stress and health risk behaviour among university students in 26 low-, middle- and high-income countries. Int. J. Psychiatry Clin. Pract. 2015, 19, 259–265. [Google Scholar] [CrossRef]
- Zung, W.W. A Self-Rating Depression Scale. Arch. Gen. Psychiatry 1965, 12, 63–70. [Google Scholar] [CrossRef] [PubMed]
- Meherali, S.; Punjani, N.; Louie-Poon, S.; Abdul, R.K.; Das, J.K.; Salam, R.A.; Lassi, Z.S. Mental Health of Children and Adolescents Amidst COVID-19 and Past Pandemics: A Rapid Systematic Review. Int. J. Environ. Res. Public Health 2021, 18, 3432. [Google Scholar] [CrossRef]
- Dunstan, D.A.; Scott, N.; Todd, A.K. Screening for anxiety and depression: Reassessing the utility of the Zung scales. Bmc Psychiatry 2017, 17, 329. [Google Scholar] [CrossRef]
- Sancho-Domingo, C.; Carballo, J.L.; Coloma-Carmona, A.; Buysse, D.J. Brief version of the Pittsburgh Sleep Quality Index (B-PSQI) and measurement invariance across gender and age in a population-based sample. Psychol. Assess. 2021, 33, 111–121. [Google Scholar] [CrossRef] [PubMed]
- Buysse, D.J.; Reynolds, C.R.; Monk, T.H.; Berman, S.R.; Kupfer, D.J. The Pittsburgh Sleep Quality Index: A new instrument for psychiatric practice and research. Psychiatry Res. 1989, 28, 193–213. [Google Scholar] [CrossRef]
- Zheng, B.; Li, M.; Wang, K.L.; Lv, J. Analysis of the reliability and validity of the Chinese version of Pittsburgh sleep quality index among medical college students. Beijing Da Xue Xue Bao Yi Xue Ban 2016, 48, 424–428. [Google Scholar]
- Liu, X.; Tang, M.; Hu, L.; Wang, A.; Wu, H.; Zhao, G.; Gao, C.; Li, W. Study on the reliability and validity of Pittsburgh sleep quality index. Chin. J. Psychiatry 1996, 29, 103–107. [Google Scholar]
- Tsai, P.S.; Wang, S.Y.; Wang, M.Y.; Su, C.T.; Yang, T.T.; Huang, C.J.; Fang, S.C. Psychometric evaluation of the Chinese version of the Pittsburgh Sleep Quality Index (CPSQI) in primary insomnia and control subjects. Qual. Life Res. 2005, 14, 1943–1952. [Google Scholar] [CrossRef] [PubMed]
- Sun, L.; Li, K.; Zhang, L.; Zhang, Y. Distinguishing the Associations Between Evening Screen Time and Sleep Quality Among Different Age Groups: A Population-Based Cross-Sectional Study. Front. Psychiatry 2022, 13, 865688. [Google Scholar] [CrossRef] [PubMed]
- Guo, S.; Sun, W.; Liu, C.; Wu, S. Structural Validity of the Pittsburgh Sleep Quality Index in Chinese Undergraduate Students. Front. Psychiatry 2016, 7, 1126. [Google Scholar] [CrossRef] [PubMed]
- Joo, H.J.; Joo, J.H.; Kwon, J.; Jang, B.N.; Park, E.C. Association between quality and duration of sleep and subjective cognitive decline: A cross-sectional study in South Korea. Sci. Rep. 2021, 11, 16989. [Google Scholar] [CrossRef] [PubMed]
- Lee, J.E.; Ju, Y.J.; Park, E.C.; Lee, S.Y. Effect of poor sleep quality on subjective cognitive decline (SCD) or SCD-related functional difficulties: Results from 220,000 nationwide general populations without dementia. J. Affect. Disord. 2020, 260, 32–37. [Google Scholar] [CrossRef]
- Kim, A.Y.; Gieng, J.H.; Osako, L.S.; Mauldin, K. Physical activity and sleep quality correlations with anthropometric measurements in young adults. J. Am. Coll. Health 2021, 16, 1–8. [Google Scholar] [CrossRef]
- Wang, F.; Biro, E. Determinants of sleep quality in college students: A literature review. Explore 2021, 17, 170–177. [Google Scholar] [CrossRef]
- Janssen, X.; Martin, A.; Hughes, A.R.; Hill, C.M.; Kotronoulas, G.; Hesketh, K.R. Associations of screen time, sedentary time and physical activity with sleep in under 5s: A systematic review and meta-analysis. Sleep Med. Rev. 2020, 49, 101226. [Google Scholar] [CrossRef]
- Hu, D.; Cheng, L.; Jiang, W. Sugar-sweetened beverages consumption and the risk of depression: A meta-analysis of observational studies. J. Affect. Disord. 2019, 245, 348–355. [Google Scholar] [CrossRef]
- Park, A.L.; Fuhrer, R.; Quesnel-Vallee, A. Parents’ education and the risk of major depression in early adulthood. Soc. Psychiatry Psychiatr. Epidemiol. 2013, 48, 1829–1839. [Google Scholar] [CrossRef]
- Everson, S.A.; Maty, S.C.; Lynch, J.W.; Kaplan, G.A. Epidemiologic evidence for the relation between socioeconomic status and depression, obesity, and diabetes. J. Psychosom. Res. 2002, 53, 891–895. [Google Scholar] [CrossRef]
- Li, W.; Ruan, W.; Peng, Y.; Lu, Z.; Wang, D. Associations of socioeconomic status and sleep disorder with depression among US adults. J. Affect. Disord. 2021, 295, 21–27. [Google Scholar] [CrossRef] [PubMed]
- Mao, Y.; He, Y.; Xia, T.; Xu, H.; Zhou, S.; Zhang, J. Examining the Dose-Response Relationship between Outdoor Jogging and Physical Health of Youths: A Long-Term Experimental Study in Campus Green Space. Int. J. Environ. Res. Public Health 2022, 19, 5648. [Google Scholar] [CrossRef] [PubMed]
- Department of Disease Control, Ministry of Health Republic of China. Guidelines for the Prevention and Control of Overweight and Obesity in Chinese Adults; People’s Medical Publishing House: Beijing, China, 2006. [Google Scholar]
- McGough, K. Pediatric screen time. J. Am. Assoc. Nurse Pract. 2021, 34, 631–638. [Google Scholar] [CrossRef] [PubMed]
- Ganzeboom, H.B.G.; Treiman, D.J. Internationally Comparable Measures of Occupational Status for the 1988 International Standard Classification of Occupations. Soc. Sci. Res. 1996, 25, 201–239. [Google Scholar] [CrossRef]
- Martinez-Lezaun, I.; Santamaria-Vazquez, M.; Del, L.M. Influence of Confinement by COVID-19 on the Quality of Sleep and the Interests of University Students. Nat. Sci. Sleep 2020, 12, 1075–1081. [Google Scholar] [CrossRef] [PubMed]
- Marelli, S.; Castelnuovo, A.; Somma, A.; Castronovo, V.; Mombelli, S.; Bottoni, D.; Leitner, C.; Fossati, A.; Ferini-Strambi, L. Impact of COVID-19 lockdown on sleep quality in university students and administration staff. J. Neurol. 2021, 268, 8–15. [Google Scholar] [CrossRef]
- Tsai, L.L.; Li, S.P. Sleep patterns in college students: Gender and grade differences. J. Psychosom. Res. 2004, 56, 231–237. [Google Scholar] [CrossRef]
- Becker, S.P.; Gregory, A.M. Editorial Perspective: Perils and promise for child and adolescent sleep and associated psychopathology during the COVID-19 pandemic. J. Child Psychol. Psychiatry 2020, 61, 757–759. [Google Scholar] [CrossRef]
- Zawadzki, M.J.; Graham, J.E.; Gerin, W. Rumination and anxiety mediate the effect of loneliness on depressed mood and sleep quality in college students. Health Psychol. 2013, 32, 212–222. [Google Scholar] [CrossRef]
- Zhengyu, W.; Yufen, C. Self-rating Depression Scale (SDS). Shanghai J. Psychiatry 1984, 23, 71–72. [Google Scholar]
- Batra, K.; Sharma, M.; Batra, R.; Singh, T.P.; Schvaneveldt, N. Assessing the Psychological Impact of COVID-19 among College Students: An Evidence of 15 Countries. Healthcare 2021, 9, 222. [Google Scholar] [CrossRef] [PubMed]
- Zhang, Y.; Peters, A.; Bradstreet, J. Relationships among sleep quality, coping styles, and depressive symptoms among college nursing students: A multiple mediator model. J. Prof. Nurs. 2018, 34, 320–325. [Google Scholar] [CrossRef] [PubMed]
- Bjelland, I.; Dahl, A.A.; Haug, T.T.; Neckelmann, D. The validity of the Hospital Anxiety and Depression Scale. An updated literature review. J. Psychosom. Res. 2002, 52, 69–77. [Google Scholar] [CrossRef]
- Hayashino, Y.; Yamazaki, S.; Takegami, M.; Nakayama, T.; Sokejima, S.; Fukuhara, S. Association between number of comorbid conditions, depression, and sleep quality using the Pittsburgh Sleep Quality Index: Results from a population-based survey. Sleep Med. 2010, 11, 366–371. [Google Scholar] [CrossRef] [PubMed]
- Lovato, N.; Gradisar, M. A meta-analysis and model of the relationship between sleep and depression in adolescents: Recommendations for future research and clinical practice. Sleep Med. Rev. 2014, 18, 521–529. [Google Scholar] [CrossRef]
- Landry, G.J.; Best, J.R.; Liu-Ambrose, T. Measuring sleep quality in older adults: A comparison using subjective and objective methods. Front. Aging Neurosci. 2015, 7, 166. [Google Scholar] [CrossRef]
- Cellini, N.; Canale, N.; Mioni, G.; Costa, S. Changes in sleep pattern, sense of time and digital media use during COVID-19 lockdown in Italy. J. Sleep Res. 2020, 29, e13074. [Google Scholar] [CrossRef]
- Xiaolin, H.; Shiqiu, M.; Le, S.; Yanping, B.; Jianyu, Q.; Zhengan, L.; Lin, L. Effects of the COVID-19 epidemic on sleep quality in college students. Chin. Ment. Health J. 2022, 36, 354–360. [Google Scholar]
- Cheng, W.; Rolls, E.T.; Ruan, H.; Feng, J. Functional Connectivities in the Brain That Mediate the Association Between Depressive Problems and Sleep Quality. JAMA Psychiatry 2018, 75, 1052–1061. [Google Scholar] [CrossRef]
- Ringel, B.L.; Szuba, M.P. Potential mechanisms of the sleep therapies for depression. Depress. Anxiety 2001, 14, 29–36. [Google Scholar] [CrossRef] [PubMed]


| Variables | SDS | |||||||
|---|---|---|---|---|---|---|---|---|
| Males (n = 2862) | Females (n = 3833) | |||||||
| Depression | No Depression | Chi-Square | p | Depression | No Depression | Chi-Square | p | |
| Sleep quality (PSQI) | ||||||||
| Good | 31 (3.5) | 856 (96.5) | 840.956 | <0.001 | 168 (16.5) | 849 (83.5) | 542.703 | <0.001 |
| Poor | 1217 (61.6) | 758 (38.4) | 1664 (59.1) | 1152 (40.9) | ||||
| Age (years) | ||||||||
| 19 | 322 (39.0) | 503 (61.0) | 21.498 | <0.001 | 697 (47.4) | 775 (52.6) | 4.595 | 0.204 |
| 20 | 381 (44.1) | 483 (55.9) | 575 (47.8) | 627 (52.2) | ||||
| 21 | 277 (42.3) | 378 (57.7) | 402 (50.4) | 396 (49.6) | ||||
| 22 | 268 (51.7) | 250 (48.3) | 158 (43.8) | 203 (56.2) | ||||
| Urban and rural | ||||||||
| Urban | 256 (38.9) | 402 (61.1) | 7.676 | 0.006 | 441 (46.3) | 511 (53.7) | 1.100 | 0.294 |
| Rural | 992 (45.0) | 1212 (55.0) | 1391 (48.3) | 1490 (51.7) | ||||
| One-child family | ||||||||
| Yes | 319 (34.2) | 615 (65.8) | 50.367 | <0.001 | 275 (37.2) | 464 (62.8) | 41.095 | <0.001 |
| No | 929 (48.2) | 999 (51.8) | 1557 (50.3) | 1537 (49.7) | ||||
| BMI | ||||||||
| Underweight | 126 (41.7) | 176 (58.3) | 2.275 | 0.517 | 380 (48.9) | 397 (51.1) | 3.826 | 0.281 |
| Normal | 672 (44.6) | 834 (55.4) | 982 (47.4) | 1089 (52.6) | ||||
| Overweight | 218 (41.3) | 310 (58.7) | 130 (43.3) | 1270 (56.7) | ||||
| Obese | 232 (44.1) | 294 (55.9) | 340 (49.6) | 345 (50.4) | ||||
| Physical activity | ||||||||
| Yes | 124 (32.0) | 264 (68.0) | 24.760 | <0.001 | 94 (27.1) | 253 (72.9) | 65.561 | <0.001 |
| No | 1124 (45.4) | 1350 (54.6) | 1738 (49.9) | 1748 (50.1) | ||||
| Screen time | ||||||||
| ≤2 h/d | 249 (32.6) | 514 (67.4) | 50.926 | <0.001 | 306 (35.3) | 562 (64.7) | 50.908 | <0.001 |
| >2 h/d | 999 (47.6) | 1100 (52.4) | 1526 (51.5) | 1439 (48.5) | ||||
| Sugar-sweetened beverages | ||||||||
| Yes | 1024 (45.8) | 1210 (54.2) | 20.611 | <0.001 | 1628 (49.2) | 1678 (50.8) | 20.215 | <0.001 |
| No | 224 (35.7) | 404 (64.3) | 204 (38.7) | 323 (61.3) | ||||
| Father’s education | ||||||||
| Elementary school and below | 389 (49.7) | 394 (50.3) | 22.288 | <0.001 | 506 (52.6) | 456 (47.4) | 24.402 | <0.001 |
| Middle school | 767 (42.4) | 1044 (57.6) | 1186 (47.5) | 1313 (52.5) | ||||
| College and above | 92 (34.3) | 176 (65.7) | 140 (37.6) | 232 (62.4) | ||||
| Mother’s education | ||||||||
| Elementary school and below | 621 (46.2) | 723 (53.8) | 16.265 | <0.001 | 861 (50.7) | 837 (49.3) | 59.420 | <0.001 |
| Middle school | 575 (42.7) | 772 (57.3) | 932 (47.8) | 1017 (52.2) | ||||
| College and above | 52 (30.4) | 119 (69.6) | 39 (21.0) | 147 (79.0) | ||||
| SES | ||||||||
| Low | 277 (54.7) | 229 (45.3) | 37.815 | <0.001 | 312 (58.8) | 219 (41.2) | 26.217 | <0.001 |
| Medium | 834 (42.4) | 1133 (57.6) | 1299 (47.0) | 1464 (53.0) | ||||
| High | 137 (35.2) | 252 (64.8) | 221 (41.0) | 318 (59.0) | ||||
| Total | 1248 (43.6)) | 1614 (56.4) | 1832 (47.8) | 2001 (25.2) | ||||
| Variables | Depression Symptoms (SDS ≥ 50) | |||||||
|---|---|---|---|---|---|---|---|---|
| Males | Females | |||||||
| Adjusted OR | 95%CI | p | Adjusted OR | 95%CI | p | |||
| Sleep quality (PSQI) | ||||||||
| Good | 1.00 | 1.00 | ||||||
| Poor | 44.33 | 30.63 | 64.16 | <0.001 | 7.30 | 6.09 | 8.76 | <0.001 |
| Age (years) | ||||||||
| 19 | 1.00 | 1.00 | ||||||
| 20 | 1.23 | 1.02 | 1.50 | 0.035 | 1.02 | 0.88 | 1.19 | 0.802 |
| 21 | 1.15 | 0.93 | 1.41 | 0.205 | 1.13 | 0.95 | 1.34 | 0.169 |
| 22 | 1.68 | 1.34 | 2.09 | <0.001 | 0.87 | 0.69 | 1.09 | 0.222 |
| Urban and rural | ||||||||
| Urban | 1.00 | 1.00 | ||||||
| Rural | 1.29 | 1.08 | 1.54 | 0.006 | 1.08 | 0.93 | 1.25 | 0.294 |
| One-child family | ||||||||
| Yes | 1.00 | 1.00 | ||||||
| No | 1.79 | 1.53 | 2.11 | <0.001 | 1.71 | 1.45 | 2.02 | <0.001 |
| BMI | ||||||||
| Underweight | 1.00 | 1.00 | ||||||
| Normal | 1.13 | 0.88 | 1.45 | 0.355 | 0.94 | 0.80 | 1.11 | 0.479 |
| Overweight | 0.98 | 0.74 | 1.31 | 0.903 | 0.80 | 0.61 | 1.05 | 0.101 |
| Obese | 1.10 | 0.83 | 1.47 | 0.505 | 1.03 | 0.84 | 1.26 | 0.781 |
| Physical activity | ||||||||
| Yes | 1.00 | 1.00 | ||||||
| No | 1.77 | 1.41 | 2.23 | <0.001 | 2.68 | 2.09 | 3.42 | <0.001 |
| Screen time | ||||||||
| ≤2 h/d | 1.00 | 1.00 | ||||||
| >2 h/d | 1.88 | 1.58 | 2.23 | <0.001 | 1.95 | 1.67 | 2.28 | <0.001 |
| Sugar-sweetened beverages | ||||||||
| No | 1.00 | 1.00 | ||||||
| Yes | 1.53 | 1.27 | 1.83 | <0.001 | 1.54 | 1.27 | 1.85 | <0.001 |
| Father’s education | ||||||||
| College and above | 1.00 | 1.00 | ||||||
| Elementary school and below | 1.89 | 1.42 | 2.52 | <0.001 | 1.84 | 1.44 | 2.35 | <0.001 |
| Middle school | 1.41 | 1.07 | 1.84 | 0.013 | 1.50 | 1.20 | 1.87 | <0.001 |
| Mother’s education | ||||||||
| College and above | 1.00 | 1.00 | ||||||
| Elementary school and below | 1.97 | 1.40 | 2.77 | <0.001 | 3.88 | 2.69 | 5.59 | <0.001 |
| Middle school | 1.70 | 1.21 | 2.40 | 0.002 | 3.45 | 2.40 | 4.97 | <0.001 |
| SES | ||||||||
| High | 1.00 | 1.00 | ||||||
| Low | 2.23 | 1.70 | 2.92 | <0.001 | 2.05 | 1.61 | 2.62 | <0.001 |
| Medium | 1.35 | 1.08 | 1.70 | 0.009 | 1.28 | 1.06 | 1.54 | 0.011 |
| Variables | Depression Symptoms (SDS ≥ 50) | |||||||
|---|---|---|---|---|---|---|---|---|
| Males | Females | |||||||
| Adjusted OR | 95%CI | p | Adjusted OR | 95%CI | p | |||
| Subjective sleep quality | ||||||||
| Very good | 1.00 | 1.00 | ||||||
| Fairly good | 13.45 | 8.06 | 22.44 | <0.001 | 6.11 | 4.43 | 8.44 | <0.001 |
| Fairly bad | 113.20 | 66.13 | 193.77 | <0.001 | 52.87 | 37.12 | 75.30 | <0.001 |
| Very bad | 3516.28 | 1278.92 | 9667.67 | <0.001 | 2557.61 | 913.87 | 7157.92 | <0.001 |
| Sleep latency | ||||||||
| ≤15 min | 1.00 | 1.00 | ||||||
| 16–30 min | 1.31 | 1.06 | 1.62 | 0.012 | 0.95 | 0.79 | 1.14 | 0.553 |
| 31–60 min | 4.46 | 3.56 | 5.59 | <0.001 | 3.74 | 3.09 | 4.51 | <0.001 |
| >60 min | 23.66 | 17.35 | 32.26 | <0.001 | 21.26 | 16.11 | 28.05 | <0.001 |
| Sleep duration | ||||||||
| >7 h | 1.00 | 1.00 | ||||||
| 6–7 h | 1.56 | 1.18 | 2.07 | 0.002 | 1.70 | 1.37 | 2.11 | <0.001 |
| 5–6 h | 3.49 | 2.75 | 4.41 | <0.001 | 2.35 | 1.94 | 2.86 | <0.001 |
| <5 h | 6.80 | 5.39 | 8.58 | <0.001 | 3.87 | 3.20 | 4.68 | <0.001 |
| Habitual sleep efficiency | ||||||||
| ≥85% | 1.00 | 1.00 | ||||||
| 75–84% | 2.80 | 2.18 | 3.60 | <0.001 | 2.07 | 1.71 | 2.52 | <0.001 |
| 65–74% | 4.59 | 3.57 | 5.90 | <0.001 | 3.57 | 2.92 | 4.37 | <0.001 |
| <65% | 7.59 | 6.03 | 9.55 | <0.001 | 4.40 | 3.66 | 5.30 | <0.001 |
| Sleep disturbance | ||||||||
| 0 | 1.00 | 1.00 | ||||||
| 1–9 | 2.65 | 2.10 | 3.33 | <0.001 | 0.80 | 0.65 | 0.98 | 0.032 |
| 10–18 | 49.91 | 33.96 | 73.37 | <0.001 | 21.05 | 15.88 | 27.89 | <0.001 |
| 19–27 | 1026.30 | 324.50 | 3245.87 | <0.001 | 805.04 | 255.98 | 2531.78 | <0.001 |
| Use of sleep medication | ||||||||
| Not during the past month | 1.00 | 1.00 | ||||||
| Less than once a week | 1238.22 | 593.09 | 2585.08 | <0.001 | 733.50 | 397.43 | 1353.75 | <0.001 |
| Once or twice a week | 2619.32 | 1101.02 | 6231.35 | <0.001 | 1875.95 | 815.74 | 4314.11 | <0.001 |
| Three or more times a week | 3213.16 | 1428.90 | 7225.40 | <0.001 | 9601.10 | 2358.48 | 39084.97 | <0.001 |
| Daytime dysfunction | ||||||||
| No problem at all | 1.00 | 1.00 | ||||||
| Only a very slight problem | 3.81 | 2.80 | 5.18 | <0.001 | 3.50 | 2.68 | 4.57 | <0.001 |
| Somewhat of a problem | 6.19 | 4.56 | 8.39 | <0.001 | 6.90 | 5.27 | 9.03 | <0.001 |
| A very big problem | 40.16 | 28.51 | 56.57 | <0.001 | 39.20 | 27.83 | 55.22 | <0.001 |
| Variables | Poor Sleep Quality | |||||||||
|---|---|---|---|---|---|---|---|---|---|---|
| Males | Females | |||||||||
| No Depression | Depression | No Depression | Depression | |||||||
| OR | OR | 95%CI | p | OR | OR | 95%CI | p | |||
| Age (years) | ||||||||||
| 19 | 1.00 | 39.03 | 19.67 | 77.46 | <0.001 | 1.00 | 7.34 | 5.51 | 9.77 | <0.001 |
| 20 | 1.00 | 43.98 | 22.89 | 84.51 | <0.001 | 1.00 | 6.65 | 4.86 | 9.11 | <0.001 |
| 21 | 1.00 | 78.33 | 28.60 | 214.56 | <0.001 | 1.00 | 8.29 | 5.34 | 12.88 | <0.001 |
| 22 | 1.00 | 33.02 | 15.66 | 69.63 | <0.001 | 1.00 | 7.71 | 4.17 | 14.27 | <0.001 |
| Urban and rural | ||||||||||
| Urban | 1.00 | 30.02 | 15.01 | 60.05 | <0.001 | 1.00 | 5.81 | 4.18 | 8.08 | <0.001 |
| Rural | 1.00 | 50.32 | 32.50 | 77.93 | <0.001 | 1.00 | 8.03 | 6.45 | 9.99 | <0.001 |
| One-child family | ||||||||||
| Yes | 1.00 | 58.85 | 25.84 | 134.03 | <0.001 | 1.00 | 7.20 | 4.52 | 11.47 | <0.001 |
| No | 1.00 | 40.86 | 26.95 | 61.97 | <0.001 | 1.00 | 7.43 | 6.09 | 9.06 | <0.001 |
| BMI | ||||||||||
| Underweight | 1.00 | 49.62 | 17.51 | 140.58 | <0.001 | 1.00 | 8.29 | 5.51 | 12.47 | <0.001 |
| Normal | 1.00 | 39.32 | 24.43 | 63.28 | <0.001 | 1.00 | 6.19 | 4.89 | 7.85 | <0.001 |
| Overweight | 1.00 | 62.17 | 19.47 | 198.53 | <0.001 | 1.00 | 16.67 | 6.48 | 42.88 | <0.001 |
| Obese | 1.00 | 52.74 | 21.12 | 131.73 | <0.001 | 1.00 | 8.71 | 5.57 | 13.62 | <0.001 |
| Physical activity | ||||||||||
| Yes | —— | —— | —— | —— | —— | 1.00 | 2.33 | 1.42 | 3.82 | 0.001 |
| No | 1.00 | 35.36 | 24.36 | 51.33 | <0.001 | 1.00 | 8.07 | 6.61 | 9.85 | <0.001 |
| Screen time | ||||||||||
| ≤2 h/d | 1.00 | 40.15 | 21.36 | 75.46 | <0.001 | 1.00 | 26.22 | 15.81 | 43.47 | <0.001 |
| >2 h/d | 1.00 | 44.21 | 27.96 | 69.91 | <0.001 | 1.00 | 4.89 | 4.00 | 5.97 | <0.001 |
| Sugar-sweetened beverages | ||||||||||
| Yes | 1.00 | 59.00 | 36.96 | 94.18 | <0.001 | 1.00 | 8.16 | 6.63 | 10.05 | <0.001 |
| No | 1.00 | 20.71 | 11.21 | 38.25 | <0.001 | 1.00 | 4.25 | 2.85 | 6.33 | <0.001 |
| Father’s education | ||||||||||
| Elementary school and below | 1.00 | 27.06 | 15.32 | 47.79 | <0.001 | 1.00 | 8.21 | 5.57 | 12.10 | <0.001 |
| Middle school | 1.00 | 69.75 | 39.78 | 122.30 | <0.001 | 1.00 | 7.10 | 5.70 | 8.84 | <0.001 |
| College and above | 1.00 | 22.00 | 7.74 | 62.53 | <0.001 | 1.00 | 6.20 | 3.42 | 11.25 | <0.001 |
| Mother’s education | ||||||||||
| Elementary school and below | 1.00 | 38.55 | 22.98 | 64.68 | <0.001 | 1.00 | 7.76 | 5.83 | 10.34 | <0.001 |
| Middle school | 1.00 | 53.79 | 30.48 | 94.91 | <0.001 | 1.00 | 6.81 | 5.35 | 8.68 | <0.001 |
| College and above | 1.00 | 28.13 | 6.54 | 120.92 | <0.001 | 1.00 | 9.78 | 2.88 | 33.18 | <0.001 |
| SES | ||||||||||
| Low | 1.00 | 22.14 | 12.37 | 39.62 | <0.001 | 1.00 | 12.49 | 6.84 | 22.81 | <0.001 |
| Medium | 1.00 | 77.11 | 43.10 | 137.96 | <0.001 | 1.00 | 7.52 | 6.05 | 9.35 | <0.001 |
| High | 1.00 | 34.32 | 12.32 | 95.64 | <0.001 | 1.00 | 4.17 | 2.77 | 6.28 | <0.001 |
| Sleep Quality | Odds Ratio (95% Confidence Interval) | ||
|---|---|---|---|
| Crude Model | Model 1 | Model 2 | |
| Males | |||
| Good | 1.00 | 1.00 | 1.00 |
| Poor | 44.33 (30.63, 64.16) a | 42.40 (29.23, 61.51) a | 43.81 (30.15, 63.65) a |
| p for trend | <0.001 | <0.001 | <0.001 |
| Females | |||
| Good | 1.00 | 1.00 | 1.00 |
| Poor | 7.30 (6.09, 8.75) a | 6.82 (5.66, 8.22) a | 6.78 (5.62, 8.18) a |
| p for trend | <0.001 | <0.001 | <0.001 |
| Total | |||
| Good | 1.00 | 1.00 | 1.00 |
| Poor | 12.92 (11.04,15.13) a | 12.04 (10.26,14.13) a | 12.01 (10.23,14.10) a |
| p for trend | <0.001 | <0.001 | <0.001 |
Publisher’s Note: MDPI stays neutral with regard to jurisdictional claims in published maps and institutional affiliations. |
© 2022 by the authors. Licensee MDPI, Basel, Switzerland. This article is an open access article distributed under the terms and conditions of the Creative Commons Attribution (CC BY) license (https://creativecommons.org/licenses/by/4.0/).
Share and Cite
Bi, C.; Lin, H.; Zhang, J.; Zhao, Z. Association between Sleep Quality and Depression Symptoms in Chinese College Students during the COVID-19 Lockdown Period. Children 2022, 9, 1237. https://doi.org/10.3390/children9081237
Bi C, Lin H, Zhang J, Zhao Z. Association between Sleep Quality and Depression Symptoms in Chinese College Students during the COVID-19 Lockdown Period. Children. 2022; 9(8):1237. https://doi.org/10.3390/children9081237
Chicago/Turabian StyleBi, Cunjian, Hongniu Lin, Jie Zhang, and Zhimin Zhao. 2022. "Association between Sleep Quality and Depression Symptoms in Chinese College Students during the COVID-19 Lockdown Period" Children 9, no. 8: 1237. https://doi.org/10.3390/children9081237