
The Role of Exercise on Cardiometabolic Profile and Body Composition in Youth with Type 1 Diabetes
 , , and
Abstract
:1. Introduction
2. Materials and Methods
2.1. Subjects
2.2. Protocol
2.3. Assays
2.4. Ethics
2.5. Statistical Analysis
3. Results
4. Discussion
5. Conclusions
Author Contributions
Funding
Institutional Review Board Statement
Informed Consent Statement
Data Availability Statement
Conflicts of Interest
References
- Plamper, M.; Gohlke, B.; Woelfle, J.; Konrad, K.; Rohrer, T.; Hofer, S.; Bonfig, W.; Fink, K.; Holl, R.W. Interaction of Pubertal Development and Metabolic Control in Adolescents with Type 1 Diabetes Mellitus. J. Diabetes Res. 2017, 2017, 8615769. [Google Scholar] [CrossRef] [PubMed] [Green Version]
- Stehno-Bittel, L. Organ-Based Response to Exercise in Type 1 Diabetes. ISRN Endocrinol. 2012, 2012, 318194. [Google Scholar] [CrossRef] [Green Version]
- Constantini, N.; Harman-Boehm, I.; Dubnov, G. Exercise prescription for diabetics: More than a general recommendation. Harefuah 2005, 144, 717–723, 750. [Google Scholar]
- Giannini, C.; Mohn, A.; Chiarelli, F. Physical Exercise and Diabetes during Childhood. Acta Bio-Med. Atenei Parm. 2006, 77 (Suppl. S1), 18–25. [Google Scholar]
- Quirk, H.; Blake, H.; Tennyson, R.; Randell, T.L.; Glazebrook, C. Physical Activity Interventions in Children and Young People with Type 1 Diabetes Mellitus: A Systematic Review with Meta-Analysis. Diabet. Med. 2014, 31, 1163–1173. [Google Scholar] [CrossRef] [PubMed] [Green Version]
- Jenkins, D.W.; Jenks, A. Exercise and Diabetes: A Narrative Review. J. Foot Ankle Surg. 2017, 56, 968–974. [Google Scholar] [CrossRef] [PubMed]
- Toni, S.; Reali, M.F.; Barni, F.; Lenzi, L.; Festini, F. Managing Insulin Therapy during Exercise in Type 1 Diabetes Mellitus. Acta Bio-Med. Atenei Parm. 2006, 77 (Suppl. S1), 34–40. [Google Scholar]
- Tsalikian, E.; Mauras, N.; Beck, R.W.; Tamborlane, W.V.; Janz, K.F.; Chase, H.P.; Wysocki, T.; Weinzimer, S.A.; Buckingham, B.A.; Kollman, C.; et al. Impact of Exercise on Overnight Glycemic Control in Children with Type 1 Diabetes Mellitus. J. Pediatr. 2005, 147, 528–534. [Google Scholar] [CrossRef] [Green Version]
- Nguyen, T.; Obeid, J.; Walker, R.G.; Krause, M.P.; Hawke, T.J.; McAssey, K.; Vandermeulen, J.; Timmons, B.W. Fitness and Physical Activity in Youth with Type 1 Diabetes Mellitus in Good or Poor Glycemic Control: Fitness and Physical Activity in T1DM. Pediatr. Diabetes 2015, 16, 48–57. [Google Scholar] [CrossRef]
- Maggio, A.B.R.; Rizzoli, R.R.; Marchand, L.M.; Ferrari, S.; Beghetti, M.; Farpour-Lambert, N.J. Physical Activity Increases Bone Mineral Density in Children with Type 1 Diabetes. Med. Sci. Sports Exerc. 2012, 44, 1206–1211. [Google Scholar] [CrossRef]
- Admon, G. Exercise With and Without an Insulin Pump Among Children and Adolescents With Type 1 Diabetes Mellitus. Pediatrics 2005, 116, e348–e355. [Google Scholar] [CrossRef] [PubMed] [Green Version]
- Kornhauser, C.; Malacara, J.-M.; Macías-Cervantes, M.-H.; Rivera-Cisneros, A.-E. Effect of Exercise Intensity on Albuminuria in Adolescents with Type 1 Diabetes Mellitus: Exercise and Albuminuria in Type 1 Diabetes Mellitus. Diabet. Med. 2012, 29, 70–73. [Google Scholar] [CrossRef] [PubMed]
- Faulkner, M.S.; Michaliszyn, S.F.; Hepworth, J.T. A Personalized Approach to Exercise Promotion in Adolescents with Type 1 Diabetes. Pediatr. Diabetes 2009, 11, 166–174. [Google Scholar] [CrossRef] [PubMed]
- Riddell, M.C.; Milliken, J. Preventing Exercise-Induced Hypoglycemia in Type 1 Diabetes Using Real-Time Continuous Glucose Monitoring and a New Carbohydrate Intake Algorithm: An Observational Field Study. Diabetes Technol. Ther. 2011, 13, 819–825. [Google Scholar] [CrossRef] [PubMed]
- The Diabetes Research in Children Network (DirecNet) Study Group The Effects of Aerobic Exercise on Glucose and Counterregulatory Hormone Concentrations in Children With Type 1 Diabetes. Diabetes Care 2006, 29, 20–25. [CrossRef]
- the Diabetes Research in Children Network (DirecNet) Study Group Prevention of Hypoglycemia During Exercise in Children With Type 1 Diabetes by Suspending Basal Insulin. Diabetes Care 2006, 29, 2200–2204. [CrossRef] [PubMed] [Green Version]
- Ruzic, L.; Sporis, G.; Matkovic, B.R. High Volume-Low Intensity Exercise Camp and Glycemic Control in Diabetic Children. J. Paediatr. Child Health 2008, 44, 122–128. [Google Scholar] [CrossRef]
- Taplin, C.E.; Cobry, E.; Messer, L.; McFann, K.; Chase, H.P.; Fiallo-Scharer, R. Preventing Post-Exercise Nocturnal Hypoglycemia in Children with Type 1 Diabetes. J. Pediatr. 2010, 157, 784–788.e1. [Google Scholar] [CrossRef] [Green Version]
- Danne, T.; Tsioli, C.; Kordonouri, O.; Blaesig, S.; Remus, K.; Roy, A.; Keenan, B.; Lee, S.W.; Kaufman, F.R. The PILGRIM Study: In Silico Modeling of a Predictive Low Glucose Management System and Feasibility in Youth with Type 1 Diabetes During Exercise. Diabetes Technol. Ther. 2014, 16, 338–347. [Google Scholar] [CrossRef]
- Beraki, Å.; Magnuson, A.; Särnblad, S.; Åman, J.; Samuelsson, U. Increase in Physical Activity Is Associated with Lower HbA1c Levels in Children and Adolescents with Type 1 Diabetes: Results from a Cross-Sectional Study Based on the Swedish Pediatric Diabetes Quality Registry (SWEDIABKIDS). Diabetes Res. Clin. Pract. 2014, 105, 119–125. [Google Scholar] [CrossRef] [Green Version]
- Edmunds, S.; Roche, D.; Stratton, G. Levels and Patterns of Physical Activity in Children and Adolescents with Type 1 Diabetes and Associated Metabolic and Physiologic Health Outcomes. J. Phys. Act. Health 2010, 7, 68–77. [Google Scholar] [CrossRef] [PubMed] [Green Version]
- Parthasarathy, L.; Chiplonkar, S.; Khadilkar, V.; Khadilkar, A. Association between Metabolic Control and Lipid Parameters in Indian Children with Type 1 Diabetes. Indian Pediatr. 2016, 53, 39–41. [Google Scholar] [CrossRef] [PubMed]
- Bishop, F.K.; Wadwa, R.P.; Snell-Bergeon, J.; Nguyen, N.; Maahs, D.M. Changes in Diet and Physical Activity in Adolescents with and without Type 1 Diabetes over Time. Int. J. Pediatr. Endocrinol. 2014, 2014. [Google Scholar] [CrossRef] [PubMed]
- Schweiger, B.; Klingensmith, G.; Snell-Bergeon, J.K. Physical Activity in Adolescent Females with Type 1 Diabetes. Int. J. Pediatr. 2010, 2010, 1–6. [Google Scholar] [CrossRef] [PubMed] [Green Version]
- Valerio, G.; Spagnuolo, M.I.; Lombardi, F.; Spadaro, R.; Siano, M.; Franzese, A. Physical Activity and Sports Participation in Children and Adolescents with Type 1 Diabetes Mellitus. Nutr. Metab. Cardiovasc. Dis. 2007, 17, 376–382. [Google Scholar] [CrossRef] [PubMed]
- Tadida Meli, I.H.; Tankeu, A.T.; Dehayem, M.Y.; Chelo, D.; Noubiap, J.J.N.; Sobngwi, E. Exercise-Induced Albuminuria vs Circadian Variations in Blood Pressure in Type 1 Diabetes. World J. Diabetes 2017, 8, 74–79. [Google Scholar] [CrossRef]
- Pivovarov, J.A.; Taplin, C.E.; Riddell, M.C. Current Perspectives on Physical Activity and Exercise for Youth with Diabetes. Pediatr. Diabetes 2015, 16, 242–255. [Google Scholar] [CrossRef]
- Wang, Y.; Wu, Y.; Wilson, R.F.; Bleich, S.; Cheskin, L.; Weston, C.; Showell, N.; Fawole, O.; Lau, B.; Segal, J. Childhood Obesity Prevention Programs: Comparative Effectiveness Review and Meta-Analysis; AHRQ Comparative Effectiveness Reviews; Agency for Healthcare Research and Quality (US): Rockville, MD, USA, 2013.
- Wang, Y.; Cai, L.; Wu, Y.; Wilson, R.F.; Weston, C.; Fawole, O.; Bleich, S.N.; Cheskin, L.J.; Showell, N.N.; Lau, B.D.; et al. What Childhood Obesity Prevention Programmes Work? A Systematic Review and Meta-Analysis. Obes. Rev. Off. J. Int. Assoc. Study Obes. 2015, 16, 547–565. [Google Scholar] [CrossRef] [Green Version]
- Allison, R.L. Back to Basics: The Effect of Healthy Diet and Exercise on Chronic Disease Management. S. D. Med. J. S. D. State Med. Assoc. 2017, Spec No, 10–18. [Google Scholar]
- Chillarón, J.J.; Benaiges, D.; Mañé, L.; Pedro-Botet, J.; Flores Le-Roux, J.A. Obesity and Type 1 Diabetes Mellitus Management. Minerva Endocrinol. 2015, 40, 53–60. [Google Scholar]
- Steyrer, E.; Durovic, S.; Frank, S.; Giessauf, W.; Burger, A.; Dieplinger, H.; Zechner, R.; Kostner, G.M. The Role of Lecithin: Cholesterol Acyltransferase for Lipoprotein (a) Assembly. Structural Integrity of Low Density Lipoproteins Is a Prerequisite for Lp(a) Formation in Human Plasma. J. Clin. Investig. 1994, 94, 2330–2340. [Google Scholar] [CrossRef] [PubMed] [Green Version]
- Rosenson, R.S.; Brewer, H.B.; Ansell, B.; Barter, P.; Chapman, M.J.; Heinecke, J.W.; Kontush, A.; Tall, A.R.; Webb, N.R. Translation of High-Density Lipoprotein Function into Clinical Practice: Current Prospects and Future Challenges. Circulation 2013, 128, 1256–1267. [Google Scholar] [CrossRef] [PubMed] [Green Version]
- Rosenson, R.S.; Brewer, H.B.; Davidson, W.S.; Fayad, Z.A.; Fuster, V.; Goldstein, J.; Hellerstein, M.; Jiang, X.-C.; Phillips, M.C.; Rader, D.J.; et al. Cholesterol Efflux and Atheroprotection: Advancing the Concept of Reverse Cholesterol Transport. Circulation 2012, 125, 1905–1919. [Google Scholar] [CrossRef] [PubMed] [Green Version]
- Riddell, M.C.; Gallen, I.W.; Smart, C.E.; Taplin, C.E.; Adolfsson, P.; Lumb, A.N.; Kowalski, A.; Rabasa-Lhoret, R.; McCrimmon, R.J.; Hume, C.; et al. Exercise Management in Type 1 Diabetes: A Consensus Statement. Lancet Diabetes Endocrinol. 2017, 5, 377–390. [Google Scholar] [CrossRef] [Green Version]
- López-Jaramillo, P.; Gómez-Arbeláez, D.; López-López, J.; López-López, C.; Martínez-Ortega, J.; Gómez-Rodríguez, A.; Triana-Cubillos, S. The Role of Leptin/Adiponectin Ratio in Metabolic Syndrome and Diabetes. Horm. Mol. Biol. Clin. Investig. 2014, 18. [Google Scholar] [CrossRef]
- Iikuni, N.; Kwan Lam, Q.; Lu, L.; Matarese, G.; Cava, A. Leptin and Inflammation. Curr. Immunol. Rev. 2008, 4, 70–79. [Google Scholar] [CrossRef]
- La Cava, A. Leptin in Inflammation and Autoimmunity. Cytokine 2017, 98, 51–58. [Google Scholar] [CrossRef]
- Bjornstad, P.; Cree-Green, M.; Baumgartner, A.; Coe, G.; Reyes, Y.G.; Schafer, M.; Pyle, L.; Regensteiner, J.G.; Reusch, J.E.B.; Nadeau, K.J. Leptin Is Associated with Cardiopulmonary Fitness Independent of Body-Mass Index and Insulin Sensitivity in Adolescents with Type 1 Diabetes: A Brief Report from the EMERALD Study. J. Diabetes Complications 2017, 31, 850–853. [Google Scholar] [CrossRef] [Green Version]
- Kaza, M.; Tsentidis, C.; Vlachopapadopoulou, E.; Sakou, I.-I.; Karanasios, S.; Mastorakos, G.; Karavanaki, K. The Effect of Metabolic Profile on Leptin, Adiponectin, and Hs-CRP in Children and Adolescents with Type 1 Diabetes. Children 2022, 9, 1162. [Google Scholar] [CrossRef]
- Chiotis D, Tsiftis G, Hatzisymeon M, Maniati-Christidi M. Dacou-Voutetakis C. Height and Weight of Children of Hellenic Origin Aged 0–18 Years (2000–2001): Comparison with Data Collected during the Period 1978–1979. Ann. Clin. Paediatr. Univ. Atheniensis 2003, 50, 136–155.
- Marshall, W.A.; Tanner, J.M. Variations in the Pattern of Pubertal Changes in Boys. Arch. Dis. Child. 1970, 45, 13–23. [Google Scholar] [CrossRef] [PubMed] [Green Version]
- Marshall, W.A.; Tanner, J.M. Variations in Pattern of Pubertal Changes in Girls. Arch. Dis. Child. 1969, 44, 291–303. [Google Scholar] [CrossRef] [Green Version]
- Prins, M.; Hawkesworth, S.; Wright, A.; Fulford, A.J.C.; Jarjou, L.M.A.; Prentice, A.M.; Moore, S.E. Use of Bioelectrical Impedance Analysis to Assess Body Composition in Rural Gambian Children. Eur. J. Clin. Nutr. 2008, 62, 1065–1074. [Google Scholar] [CrossRef] [PubMed] [Green Version]
- Devakumar, D.; Grijalva-Eternod, C.S.; Roberts, S.; Chaube, S.S.; Saville, N.M.; Manandhar, D.S.; Costello, A.; Osrin, D.; Wells, J.C.K. Body Composition in Nepalese Children Using Isotope Dilution: The Production of Ethnic-Specific Calibration Equations and an Exploration of Methodological Issues. PeerJ 2015, 3, e785. [Google Scholar] [CrossRef] [PubMed] [Green Version]
- McCarthy, H.D.; Samani-Radia, D.; Jebb, S.A.; Prentice, A.M. Skeletal Muscle Mass Reference Curves for Children and Adolescents: Children’s Muscle Mass Curves. Pediatr. Obes. 2014, 9, 249–259. [Google Scholar] [CrossRef]
- Ramírez-Vélez, R.; Correa-Bautista, J.; Martínez-Torres, J.; González-Ruíz, K.; González-Jiménez, E.; Schmidt-RioValle, J.; Garcia-Hermoso, A. Performance of Two Bioelectrical Impedance Analyses in the Diagnosis of Overweight and Obesity in Children and Adolescents: The FUPRECOL Study. Nutrients 2016, 8, 575. [Google Scholar] [CrossRef]
- Guthrie, R.A.; Guthrie, D.W. Pathophysiology of Diabetes Mellitus. Crit. Care Nurs. Q. 2004, 27, 113–125. [Google Scholar] [CrossRef]
- Galassetti, P.; Riddell, M.C. Exercise and Type 1 Diabetes (T1DM). In Comprehensive Physiology; Terjung, R., Ed.; John Wiley & Sons, Inc.: Hoboken, NJ, USA, 2013; ISBN 978-0-470-65071-4. [Google Scholar]
- Farinha, J.B.; Krause, M.; Rodrigues-Krause, J.; Reischak-Oliveira, A. Exercise for Type 1 Diabetes Mellitus Management: General Considerations and New Directions. Med. Hypotheses 2017, 104, 147–153. [Google Scholar] [CrossRef]
- Henderson, M.; Friedrich, M.; Van Hulst, A.; Pelletier, C.; Barnett, T.A.; Benedetti, A.; Bigras, J.-L.; Drapeau, V.; Lavoie, J.-C.; Levy, E.; et al. CARDEA Study Protocol: Investigating Early Markers of Cardiovascular Disease and Their Association with Lifestyle Habits, Inflammation and Oxidative Stress in Adolescence Using a Cross-Sectional Comparison of Adolescents with Type 1 Diabetes and Healthy Controls. BMJ Open 2021, 11, e046585. [Google Scholar] [CrossRef]
- Michaliszyn, S.F.; Faulkner, M.S. Physical Activity and Sedentary Behavior in Adolescents with Type 1 Diabetes. Res. Nurs. Health 2010, 33, 441–449. [Google Scholar] [CrossRef]
- D’hooge, R.; Hellinckx, T.; Van Laethem, C.; Stegen, S.; De Schepper, J.; Van Aken, S.; Dewolf, D.; Calders, P. Influence of Combined Aerobic and Resistance Training on Metabolic Control, Cardiovascular Fitness and Quality of Life in Adolescents with Type 1 Diabetes: A Randomized Controlled Trial. Clin. Rehabil. 2011, 25, 349–359. [Google Scholar] [CrossRef] [Green Version]
- Woo, J.; Yeo, N.; Shin, K.; Lee, H.-J.; Yoo, J.; Kang, S. Antioxidant Enzyme Activities and DNA Damage in Children with Type 1 Diabetes Mellitus after 12 Weeks of Exercise: Exercise Effects in Diabetic Children. Acta Paediatr. 2010, 99, 1263–1268. [Google Scholar] [CrossRef]
- Streisand, R.; Monaghan, M. Young Children with Type 1 Diabetes: Challenges, Research, and Future Directions. Curr. Diab. Rep. 2014, 14, 520. [Google Scholar] [CrossRef] [PubMed]
- Czenczek-Lewandowska, E.; Leszczak, J.; Baran, J.; Weres, A.; Wyszyńska, J.; Lewandowski, B.; Dąbrowski, M.; Mazur, A. Levels of Physical Activity in Children and Adolescents with Type 1 Diabetes in Relation to the Healthy Comparators and to the Method of Insulin Therapy Used. Int. J. Environ. Res. Public. Health 2019, 16, 3498. [Google Scholar] [CrossRef] [PubMed] [Green Version]
- Rigla, M.; Sánchez-Quesada, J.L.; Ordóñez-Llanos, J.; Prat, T.; Caixàs, A.; Jorba, O.; Serra, J.R.; de Leiva, A.; Pérez, A. Effect of Physical Exercise on Lipoprotein(a) and Low-Density Lipoprotein Modifications in Type 1 and Type 2 Diabetic Patients. Metabolism 2000, 49, 640–647. [Google Scholar] [CrossRef] [PubMed]
- Leclair, E.; de Kerdanet, M.; Riddell, M.; Heyman, E. Type 1 Diabetes and Physical Activity in Children and Adolescents. J. Diabetes Metab. 2013, 1. [Google Scholar] [CrossRef]
- Bartfay, W.J.; Bartfay, E.; Axelsson, J.; Sigurdsson, S.B.; Naimark, B. The Relationship of Serum Ferritin with Sex and Exercise in Canadians of Icelandic Descent: Implications for Prevention of Coronary Artery Disease. Can. J. Cardiol. 1995, 11, 305–310. [Google Scholar]
- Mairbäurl, H. Red Blood Cells in Sports: Effects of Exercise and Training on Oxygen Supply by Red Blood Cells. Front. Physiol. 2013, 4. [Google Scholar] [CrossRef] [Green Version]
- McMahon, S.K.; Ferreira, L.D.; Ratnam, N.; Davey, R.J.; Youngs, L.M.; Davis, E.A.; Fournier, P.A.; Jones, T.W. Glucose Requirements to Maintain Euglycemia after Moderate-Intensity Afternoon Exercise in Adolescents with Type 1 Diabetes Are Increased in a Biphasic Manner. J. Clin. Endocrinol. Metab. 2007, 92, 963–968. [Google Scholar] [CrossRef]
- Davey, R.J.; Howe, W.; Paramalingam, N.; Ferreira, L.D.; Davis, E.A.; Fournier, P.A.; Jones, T.W. The Effect of Midday Moderate-Intensity Exercise on Postexercise Hypoglycemia Risk in Individuals with Type 1 Diabetes. J. Clin. Endocrinol. Metab. 2013, 98, 2908–2914. [Google Scholar] [CrossRef] [Green Version]
- Blood Sugar and Exercise|ADA. Available online: https://diabetes.org/healthy-living/fitness/getting-started-safely/blood-glucose-and-exercise (accessed on 14 October 2022).
- Hansen, M.V.; Pedersen-Bjergaard, U.; Heller, S.R.; Wallace, T.M.; Rasmussen, Å.K.; Jørgensen, H.V.; Pramming, S.; Thorsteinsson, B. Frequency and Motives of Blood Glucose Self-Monitoring in Type 1 Diabetes. Diabetes Res. Clin. Pract. 2009, 85, 183–188. [Google Scholar] [CrossRef] [PubMed]
- Wen, L.K.; Shepherd, M.D.; Parchman, M.L. Family Support, Diet, and Exercise Among Older Mexican Americans With Type 2 Diabetes. Diabetes Educ. 2004, 30, 980–993. [Google Scholar] [CrossRef] [PubMed]


| Px | Beta | (95% CI of Beta) | T-Statistic | p-Value |
|---|---|---|---|---|
| Demographic and anthropometric parameters | ||||
| Gender (female) | −0.101 | (−0.420, 0.2185) | −0.63 | 0.531 |
| Chronological age (years) | 0.009 | (−0.0365, 0.0564) | 0.43 | 0.671 |
| Tanner (II–V) | −0.0301 | (−0.172, 0.1126) | −0.42 | 0.675 |
| Height (cm) | 0.0002 | (−0.0068, 0.0073) | 0.08 | 0.939 |
| Weight (kg) | 0.0003 | (−0.01003, 0.0106) | 0.06 | 0.952 |
| Waist circumference (cm) | −0.0008 | (−0.0161, 0.0144) | −0.11 | 0.912 |
| Hip circumference (cm) | 0.0116 | (−0.0063, 0.02961) | 1.29 | 0.202 |
| Waist/hip ratio | −0.50512 | (−1.303594, 0.2933) | −1.26 | 0.212 |
| Waist/height ratio | −0.00003 | (−0.03779, 0.0377) | −0.00 | 0.999 |
| BMI (kg/m2) | −0.0009 | (−0.0443, 0.04245) | −0.04 | 0.966 |
| z-score BMI (SD) | 0.001 | (−0.1706, 0.1728) | 0.01 | 0.990 |
| Muscle mass (kg) | 0.00393 | (−0.0083, 0.0162) | 0.64 | 0.527 |
| Fat mass percentage (%) | −1.6156 | (−3.733711, 0.50237) | −1.52 | 0.133 |
| Mean systolic blood pressure (mm/Hg) | −0.00297 | (−0.018, 0.01207) | −0.39 | 0.695 |
| Mean diastolic blood pressure (mm/Hg) | 0.0015 | (−0.0153, 0.0184) | 0.19 | 0.852 |
| Hba1c (%) | −0.0331 | (−0.141, 0.0747) | −0.61 | 0.543 |
| Average Hba1c% | −0.0343 | (−0.1522, 0.0836) | −0.58 | 0.564 |
| Number of daily glucose measurements | −0.0254 | (−0.06926, 0.01835) | −1.16 | 0.251 |
| Number of weekly hypoglycemic episodes | 0.0108 | (−0.01295, 0.0346) | 0.91 | 0.368 |
| Insulin (units/kg/day) | 0.1097 | (−0.553, 0.773) | 0.33 | 0.743 |
| T1D duration (years) | 0.0321 | (−0.007, 0.0712) | 1.63 | 0.106 |
| Insulin regime ** | −0.1098 | (−0.4431, 0.223) | −0.66 | 0.513 |
| Family situation * | −0.2785 | (−0.4965, −0.0605) | −2.54 | 0.013 |
| Laboratory parameters | ||||
| Hemoglobin (g/dl) | 0.0225 | (−0.1173, 0.1624) | 0.32 | 0.749 |
| White blood cells (/mm3) | −0.00005 | (−0.00017, 0.000057) | −1.01 | 0.315 |
| Neutrophils percentage (%) | 0.0026 | (−0.0138, 0.0191) | 0.32 | 0.750 |
| Leukocytes percentage (%) | 0.00439 | (−0.0134, 0.0222) | 0.49 | 0.625 |
| Platelets (/mm3) | 4.26 × 10⁻⁷ | (−2.00 × 10⁻⁶, 2.85 × 10⁻⁶) | 0.35 | 0.727 |
| Ferritin (ng/mL) | −0.0123 | (−0.0234, −0.0013) | −2.50 | 0.031 |
| Urea (mg/dl) | 0.001 | (−0.0174, 0.0194) | 0.11 | 0.913 |
| Creatinine (mg/dl) | 0.80904 | (−0.1425, 1.760619) | 1.70 | 0.094 |
| Triglycerides (mg/dl) | 0.00121 | (−0.0026, 0.0051) | 0.63 | 0.533 |
| Total cholesterol (mg/dl) | 0.0028 | (−0.0032, 0.0089) | 0.94 | 0.352 |
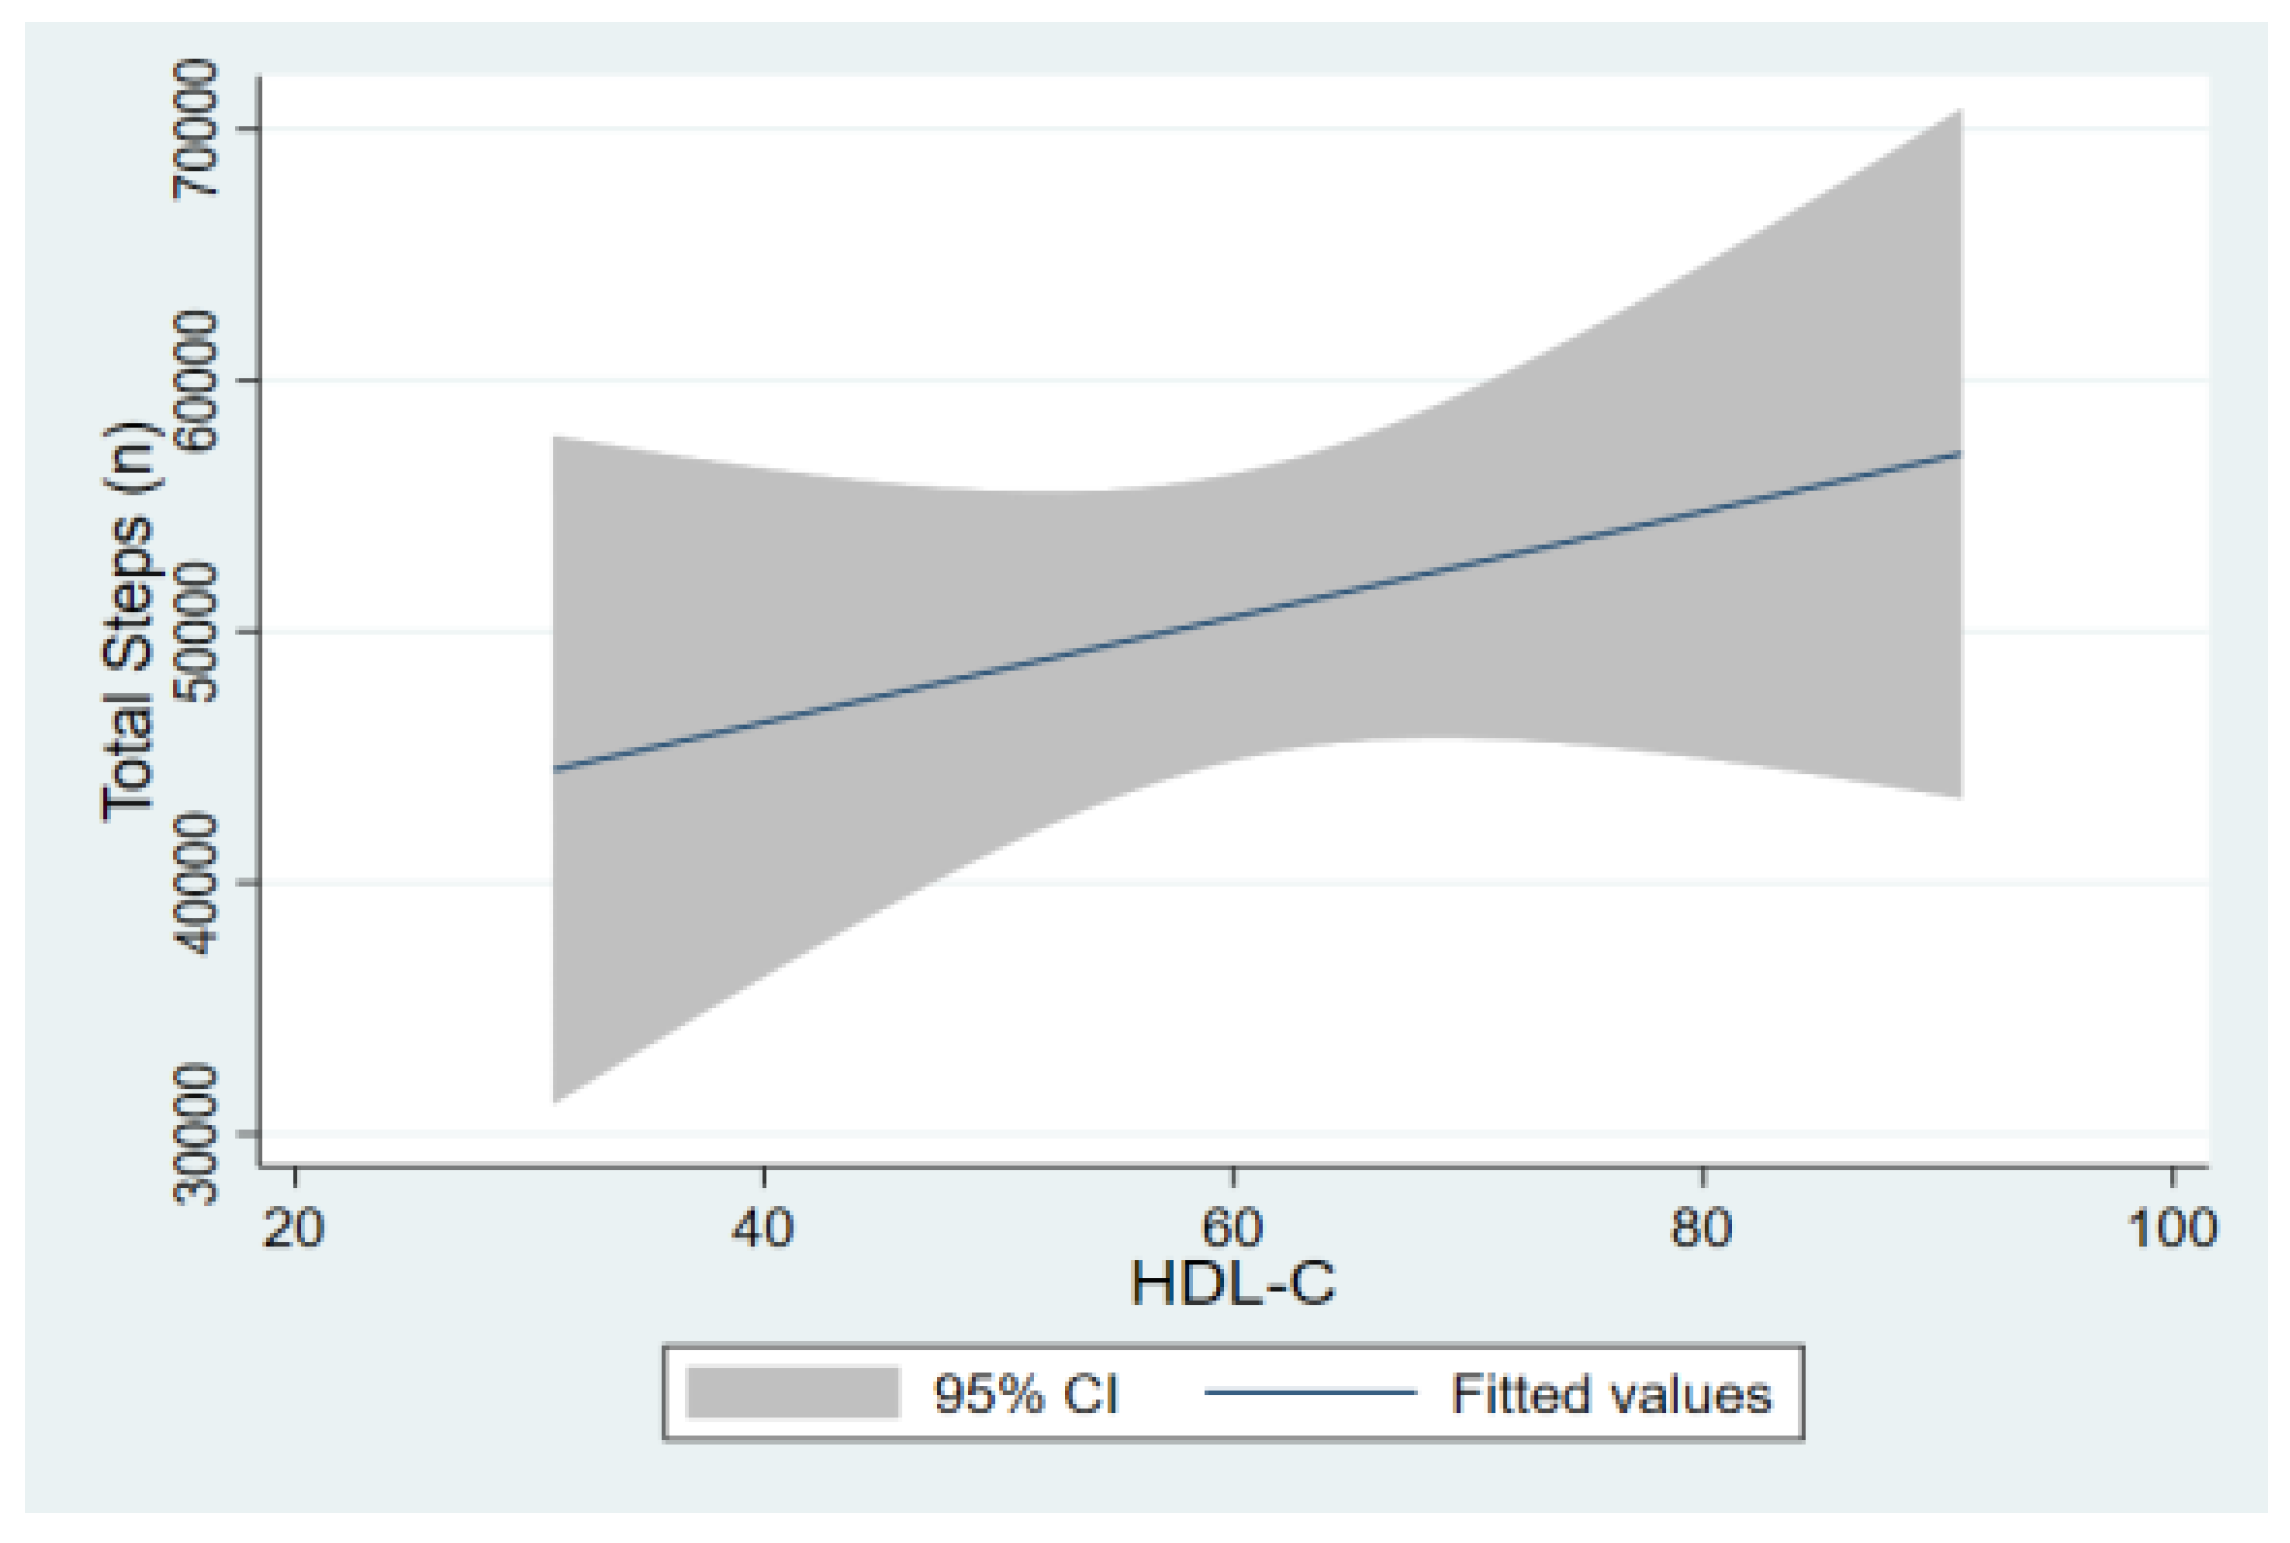
| HDL-c (mg/dl) | 0.00795 | (−0.00412, 0.02002 | 1.31 | 0.193 |
| LDL-c (mg/dl) | −0.0007 | (−0.0081, 0.0066) | −0.19 | 0.849 |
| Lp(a) (mg/dl) | −0.0054 | (−0.0098, −0.001) | −2.50 | 0.016 |
| TSH (mIU/L) | 0.03588 | (−0.04503, 0.11679) | 0.88 | 0.380 |
| Squared leptin | −0.1036 | (−0.2022, −0.005) | −2.09 | 0.040 |
| Log- adiponectin | −0.03921 | (−0.27506, 0.1966) | −0.33 | 0.742 |
| Log-hs-CRP | 0.05243 | (−0.07789, 0.18275) | 0.80 | 0.426 |
| Inverted-IL6 | −0.30806 | (−2.5975, 1.9814) | −0.27 | 0.789 |
| (a). Basic Demographic and Clinical Parameters of the Study Population According to the Extreme Exercise Levels | |||
|---|---|---|---|
| Exercise Levels | |||
| Variables [n (%)] | 1. Low (n = 20) Mean ± SD Median (Range) | 2. High (n = 20) Mean ± SD Median (Range) | p-Value |
| Gender (male/female) | 8/12 | 10/10 | 0.37 * |
| Age (years) | 15.13 ± 3.41, 15.25 (13.4, 17.8) | 15.6 ± 3.63, 16.16 (12.3, 18.4) | 0.67 ** |
| Tanner pubertal stage (2/3/4/5) | 2/2/1/15 | 4/1/0/15 | 0.73 * |
| Height (cm) | 162 ± 12.4, 164 (159, 169.5) | 162.5 ± 14.9, 167 (152.5, 174.5) | 0.90 ** |
| Weight (kg) | 57.2 ± 16.5, 55.5 (48.3, 71.6) | 57.5 ± 15.1, 62.1 (44.2, 69.1) | 0.95 ** |
| Waist circumference (cm) | 74.8 ± 11.3, 73.5 (65.5, 82) | 74.5 ± 9.7, 75.5 (66.2, 82) | 0.91 ** |
| Hip circumference (cm) | 50.3 ± 7.03, 50 (45, 55) | 53.9 ± 13.01, 52 (47, 54.5) | 0.28 ** |
| Waist-to-hip ratio | 1.49 ± 0.17, 1.46 (1.38, 1.64) | 1.41 ± 0.19, 1.49 (1.27, 1.56) | 0.17 ** |
| Waist-to-height ratio | 0.46 ± 0.05, 0.46 (0.43, 0.49) | 0.45 ± 0.05, 0.44 (0.42, 0.48) | 0.89 ** |
| BMI (kg/m2) | 21.3 ± 4.0, 20.8 (18.2, 23.2) | 21.3 ± 3.02, 21.7 (18.9, 23.8) | 0.96 ** |
| SDS-BMI | 0.41 ± 0.93, 0.37 (−0.1, 0.99) | 0.42 ± 0.93, 0.37 (−0.14, 1.04) | 0.98 ** |
| Fat mass percentage | 22.5 ± 5.8, 22.2 (18.1, 26.8) | 18.9 ± 7.4, 18.4 (15.4, 26.3) | 0.10 ** |
| Muscle mass (kg) | 43.9 ± 11.9, 41.7 (37.4, 51.7) | 46.6 ± 13.1, 48.6 (34.9, 56.7) | 0.51 ** |
| Systolic blood pressure (mmHg) | 115 ± 9, 114 (109, 120) | 113 ± 12, 110 (105, 121) | 0.70 ** |
| Diastolic blood pressure (mmHg) | 67 ± 6, 69 (63, 72) | 68 ± 9, 68 (58, 76) | 0.82 ** |
| Mean HbA1c (%) | 8.3 ± 2.03, 7.6 (6.9, 9.3) | 8.05 ± 1.1, 7.7 (7.1, 9.05) | 0.62 ** |
| Daily glucose measurements | 6.3 ± 2.5, 5.5 (5, 8.25) | 4.9 ± 1.4, 5 (4, 7) | 0.047 ** |
| Weekly hypoglycemic episodes | 2.6 ± 1.9, 2 (1.5, 4) | 4.5 ± 11.7, 2 (1.2, 2.7) | 0.47 ** |
| Insulin units/kg/day | 0.78 ± 0.23, 0.8 (0.64, 0.89) | 0.81 ± 0.15, 0.8(0.7, 0.84) | 0.68 ** |
| Diabetes duration (years) | 4.8 ± 2.6, 5.3 (2.2, 6.8) | 6.9 ± 4.3, 6.08 (3.04, 8.62) | 0.078 ** |
| Insulin scheme (conventional/pump) | 13/7 | 15/5 | 0.50 * |
| Family situation (0/1/2/3) | 13/4/2/1 | 17/3/0/0 | 0.06 * |
| (b). Biochemical Parameters of the Study Population According to the Extreme Exercise Levels | |||
| Exercise Levels | |||
| Variables [n (%)] | 1. Low (n = 20) Mean ± SD Median (Range) | 2. High (n = 20) Mean ± SD Median (Range) | p-Value |
| Hemoglobin (g/dl) | 13.9 ± 1.2, 13.9 (12.9, 14.5) | 14 ± 1.06, 14.2 (13, 14.8) | 0.73 ** |
| White blood cells (/mm3) | 6412 ± 1467, 6440 (5250, 6900) | 5954 ± 1451, 5970 (5150, 6400) | 0.32 ** |
| Neutrophils percentage (%) | 45.7 ± 13.6, 47 (40.2, 56) | 46.8 ± 8.9, 47.3 (39.7, 51.4) | 0.76 ** |
| Leucocyte percentage (%) | 38.9 ± 8.3, 40.5 (33.5, 46.5) | 40.4 ± 9.4, 40 (34, 49) | 0.66 ** |
| Platelets (X1000) | 245 ± 83, 255 (200, 287) | 253 ± 78, 257 (209, 290) | 0.76 ** |
| Ferritin (ng/mL) | 104 ± 17, 104 (92, 117) | 31 ± 18, 35 (11, 48) | 0.022 ** |
| Urea (mg/dl) | 27.7 ± 8.4, 26 (20, 32) | 28 ± 10.4, 29.3 (22, 36) | 0.92 ** |
| Creatinine (mg/dl) | 0.61 ± 0.17, 0.66 (0.49, 0.7) | 0.71 ± 0.16, 0.71 (0.64, 0.8) | 0.084 ** |
| Triglycerides (mg/dl) | 62 ± 21, 66 (45, 74) | 72 ± 68, 51(42, 78) | 0.9 ** |
| Total cholesterol (mg/dl) | 149 ± 31, 144 (130, 169) | 158 ± 30, 159 (146, 174) | 0.41 ** |
| HDL-C (mg/dl) | 60 ± 15, 57 (48, 72) | 65 ± 15, 63 (52, 78) | 0.26 ** |
| LDL-C (mg/dl) | 86 ± 27, 81 (69, 105) | 85 ± 20, 84 (72, 93) | 0.84 ** |
| Lp(a) (mg/dl) | 51 ± 66, 16.2 (13, 79) | 10 ± 7.4, 7 (5.8, 13.5) | |
| Log [Lp(a)] | 3.23 ± 1.21, 2.78 (2.56, 4.36) | 2.07 ± 0.75, 1.94 (1.75, 2.6) | 0.007 ** |
| TSH (mIU/L) | 3.17 ± 1.91, 2.58 (1.8, 3.86) | 3.73 ± 3.07, 3.08 (2.09, 3.95) | 0.48 ** |
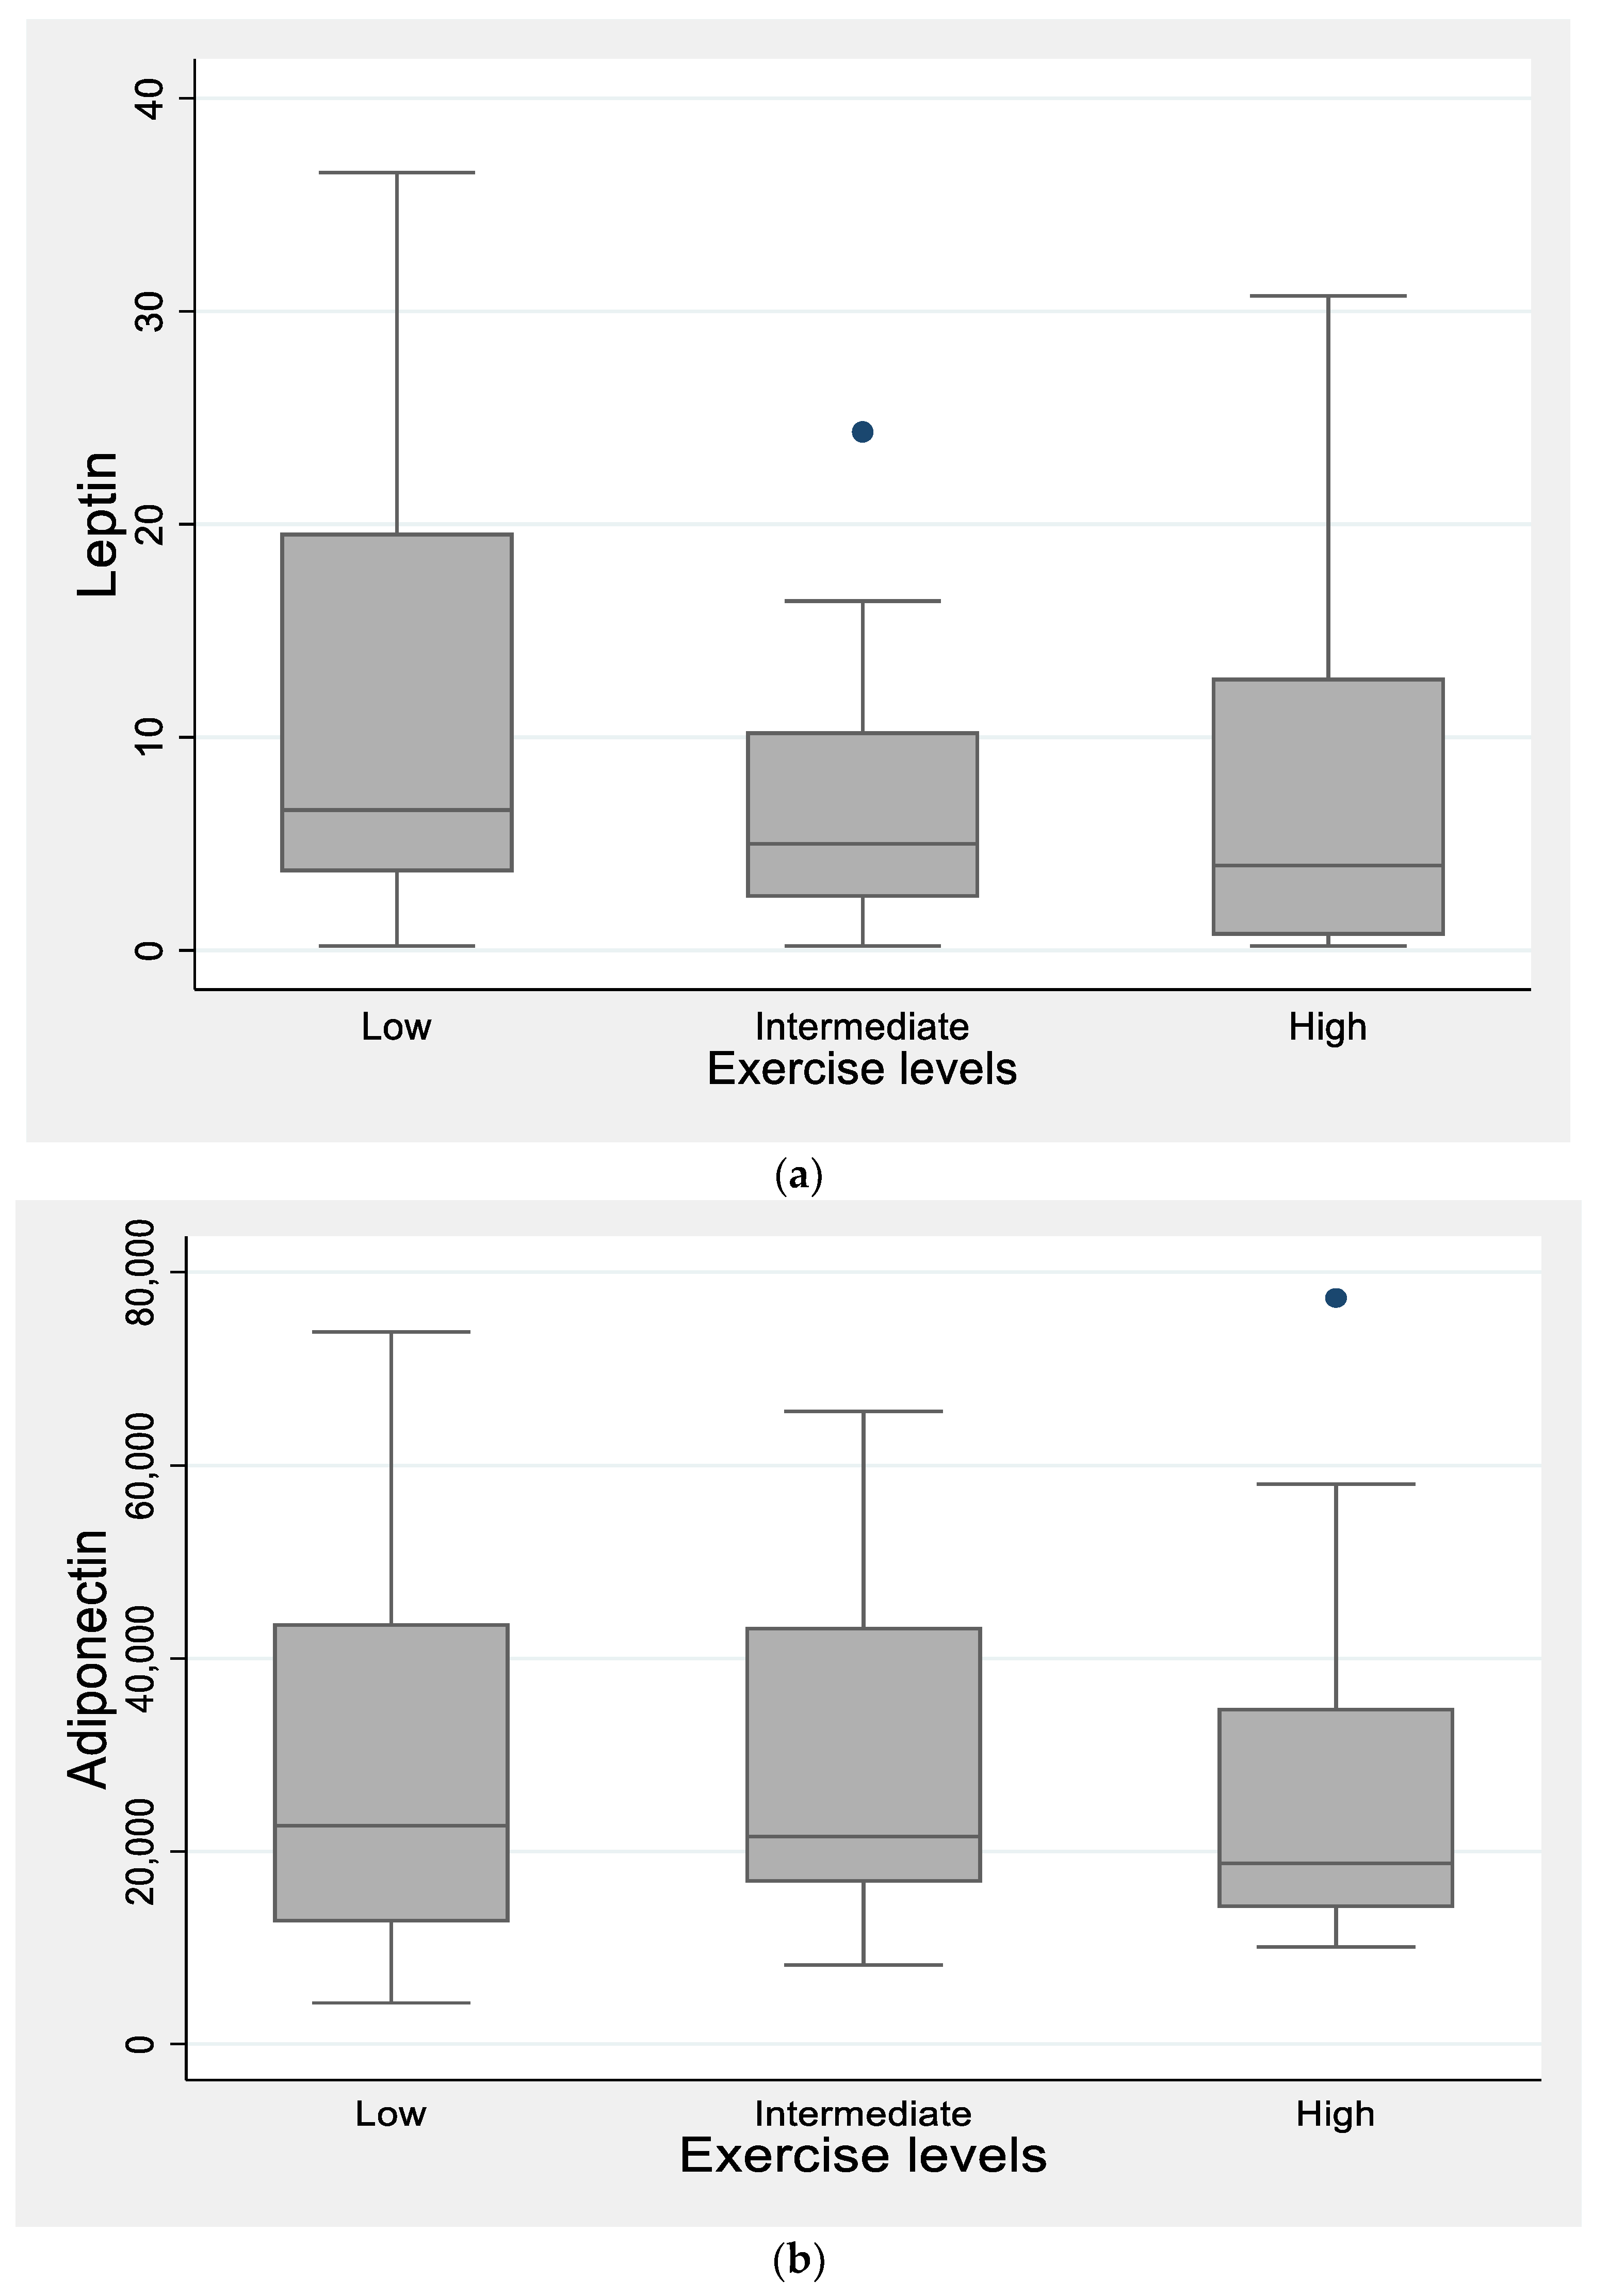
| Leptin (ng/mL) | 13.51 ± 13.09, 7.9 (3.8, 19.7) | 7.52 ± 8.92, 3.97 (0.69, 12.7) | |
| SqR(Leptin) | 3.26 ± 1.72, 2.8 (1.95, 4.44) | 2.24 ± 1.62, 1.98 (0.83, 3.57) | 0.059 ** |
| Adiponectin (ng/mL) | 31,223 ± 22,808, 22,647 (12,660, 43,664) | 26,858 ± 18,405, 18,758 (14,165, 34,860) | |
| Log (Adiponectin) | 10.08 ± 0.76, 10.02 (9.4, 10.67) | 10.01 ± 0.58, 9.83 (9.55, 10.45) | 0.74 * |
| hs-CRP (mg/dl) | 1653 ± 2635, 993 (300, 1799) | 2101 ± 3382, 1107 (732, 1738) | |
| Log(hs-CRP) | 6.61 ± 1.34, 6.9 (5.7, 7.48) | 6.92 ± 1.25, 7.0 (6.59, 7.46) | 0.45 ** |
| IL-6 (pg/mL) | 11.4 ± 15.1, 6.6 (5.2, 9.6) | 27.9 ± 59.5, 6.3 (4.9, 13.5) | |
| 1/IL-6 | 0.14 ± 0.06, 0.15 (0.1, 0.19) | 0.13 ± 0.08, 0.15 (0.07, 0.2) | 0.79 ** |
Publisher’s Note: MDPI stays neutral with regard to jurisdictional claims in published maps and institutional affiliations. |
© 2022 by the authors. Licensee MDPI, Basel, Switzerland. This article is an open access article distributed under the terms and conditions of the Creative Commons Attribution (CC BY) license (https://creativecommons.org/licenses/by/4.0/).
Share and Cite
Kaza, M.; Tsentidis, C.; Vlachopapadopoulou, E.; Karanasios, S.; Sakou, I.-I.; Mastorakos, G.; Karavanaki, K. The Role of Exercise on Cardiometabolic Profile and Body Composition in Youth with Type 1 Diabetes. Children 2022, 9, 1840. https://doi.org/10.3390/children9121840
Kaza M, Tsentidis C, Vlachopapadopoulou E, Karanasios S, Sakou I-I, Mastorakos G, Karavanaki K. The Role of Exercise on Cardiometabolic Profile and Body Composition in Youth with Type 1 Diabetes. Children. 2022; 9(12):1840. https://doi.org/10.3390/children9121840
Chicago/Turabian StyleKaza, Maria, Charalampos Tsentidis, Elpis Vlachopapadopoulou, Spyridon Karanasios, Irine-Ikbale Sakou, George Mastorakos, and Kyriaki Karavanaki. 2022. "The Role of Exercise on Cardiometabolic Profile and Body Composition in Youth with Type 1 Diabetes" Children 9, no. 12: 1840. https://doi.org/10.3390/children9121840