
Lipopolysaccharides Enhance Epithelial Hyperplasia and Tubular Adenoma in Intestine-Specific Expression of krasV12 in Transgenic Zebrafish

 , , and
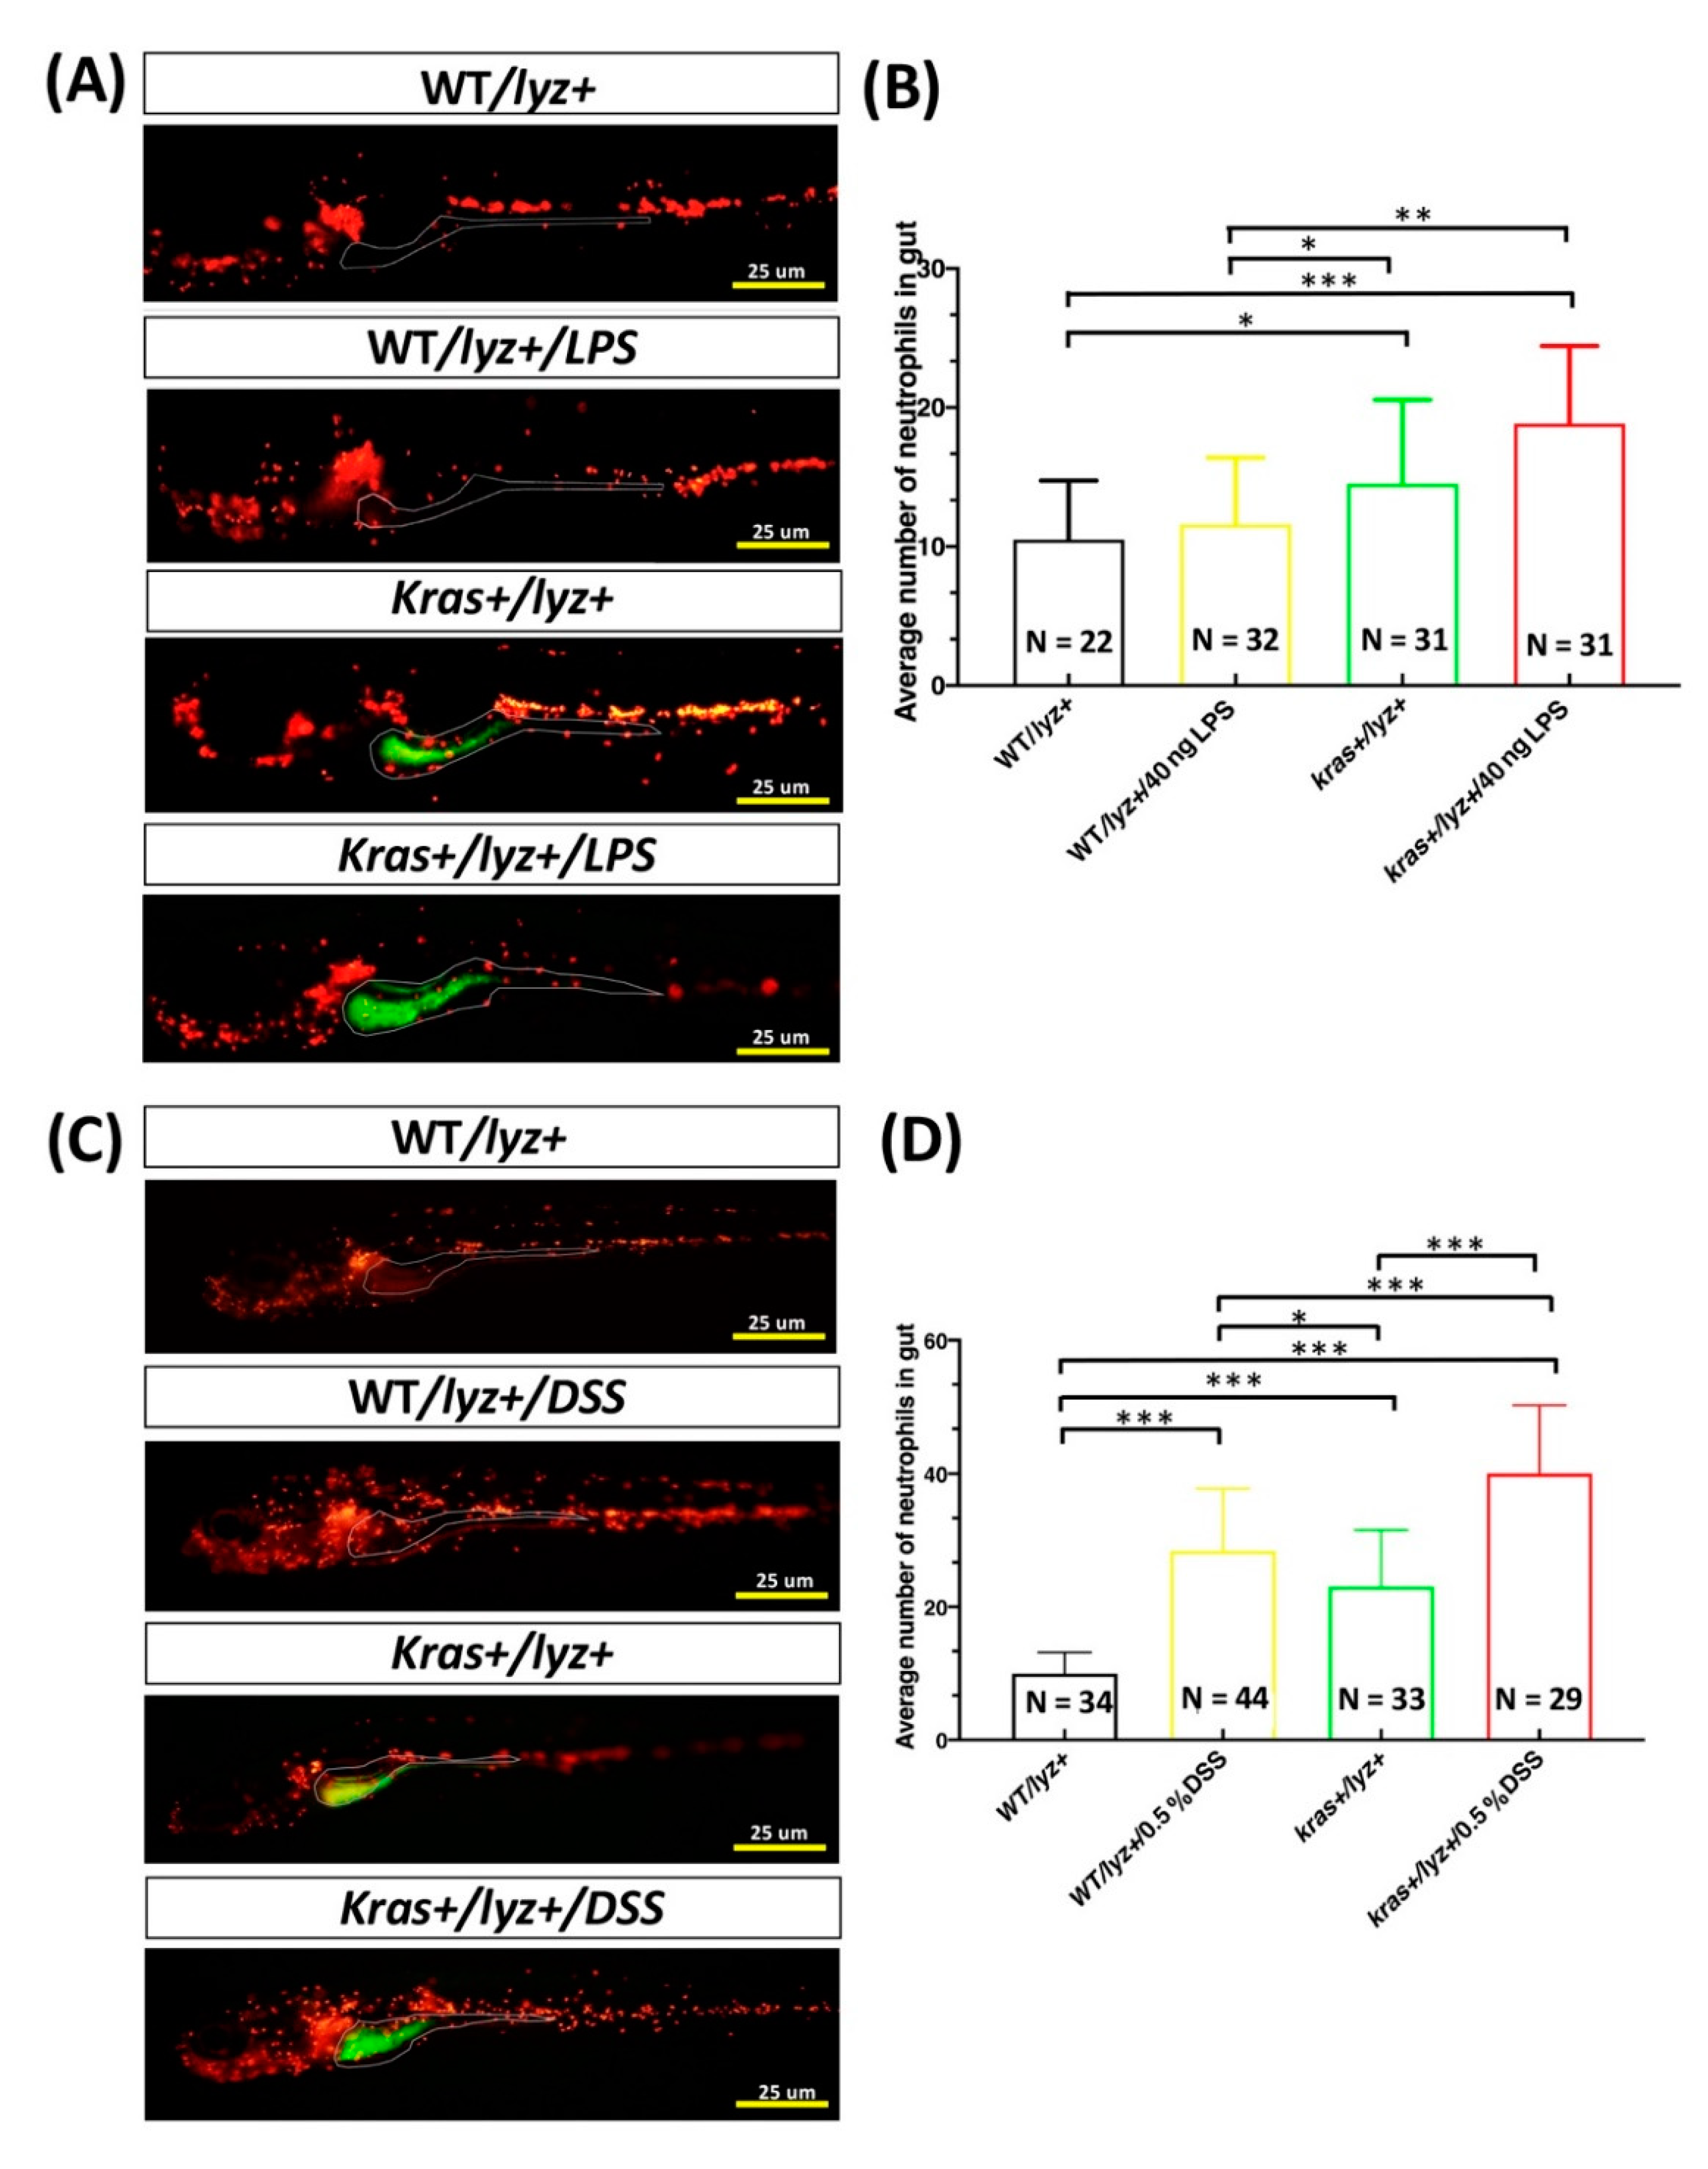
Abstract
:1. Introduction
2. Materials and methods
2.1. Zebrafish Husbandry
2.2. Mifepristone and Chemical Treatments of Zebrafish
2.3. Tissue Collection and Histopathology of Zebrafish Intestines
2.4. Immunofluorescence (IF) and Periodic Acid–Schiff (PAS) Staining
2.5. Statistical Analysis
3. Results
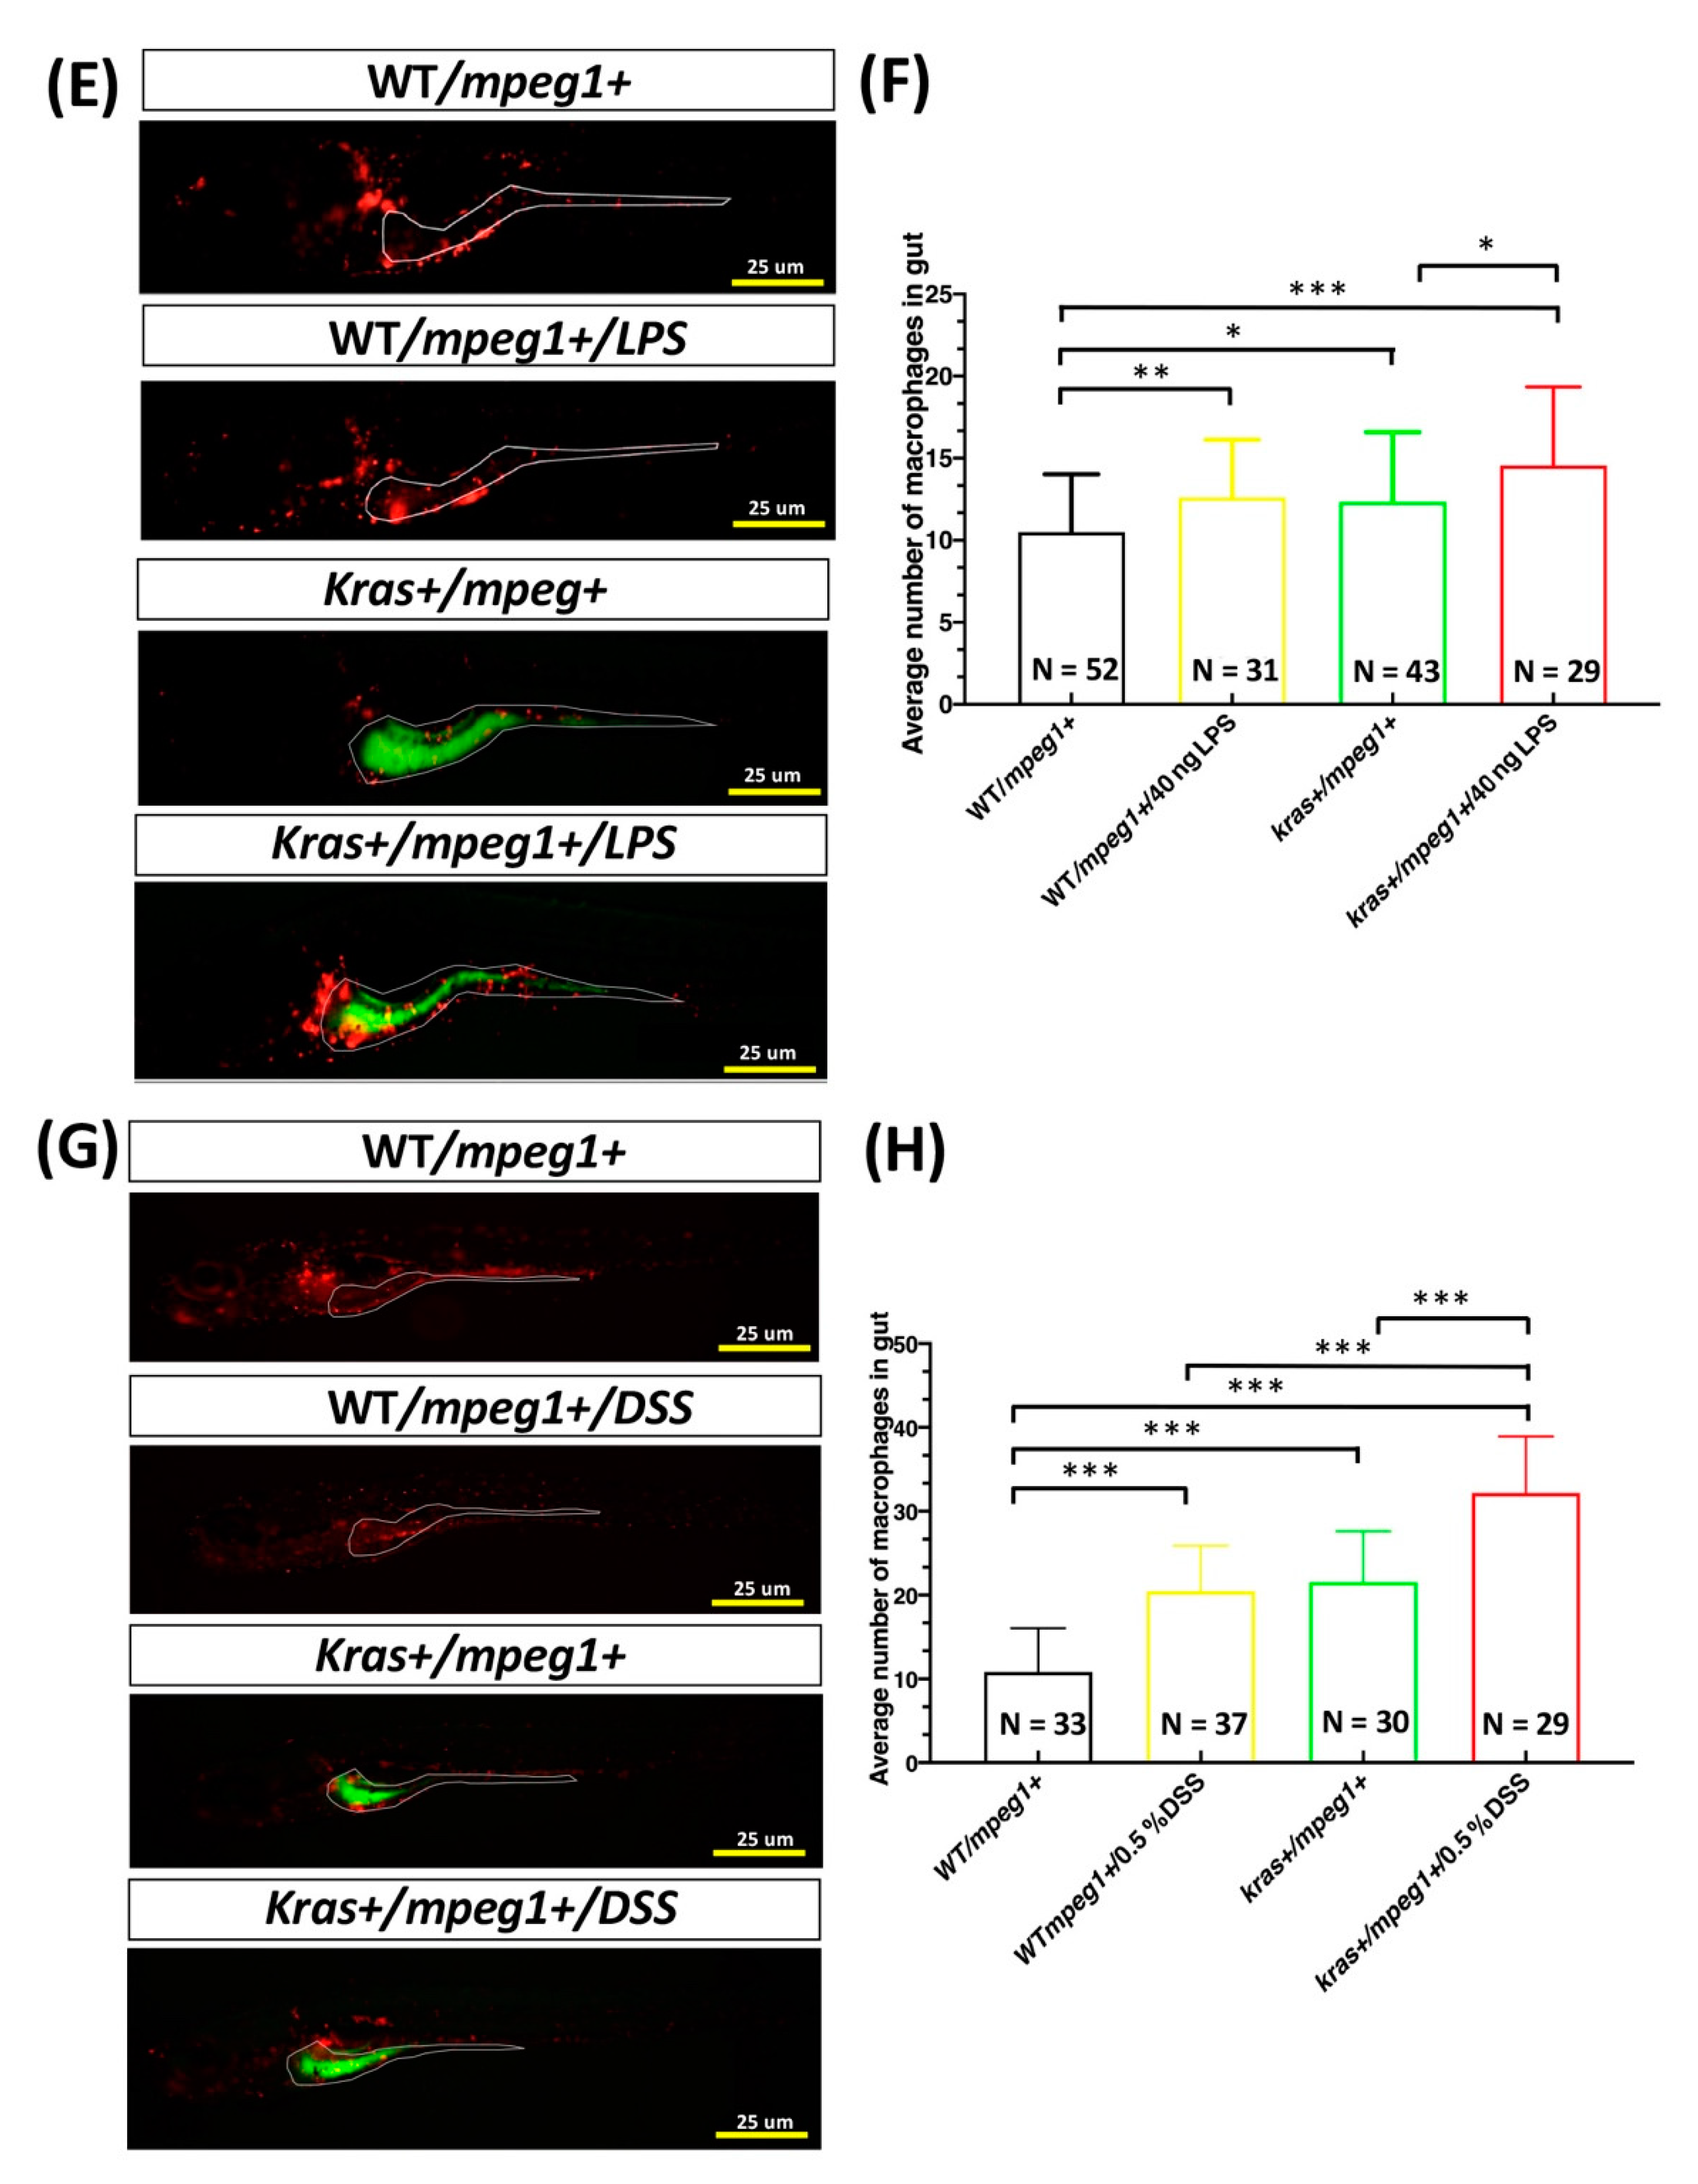
3.1. Effects of LPS or DSS Treatment on Intestinal Inflammation in krasV12 Transgenic Zebrafish Larvae
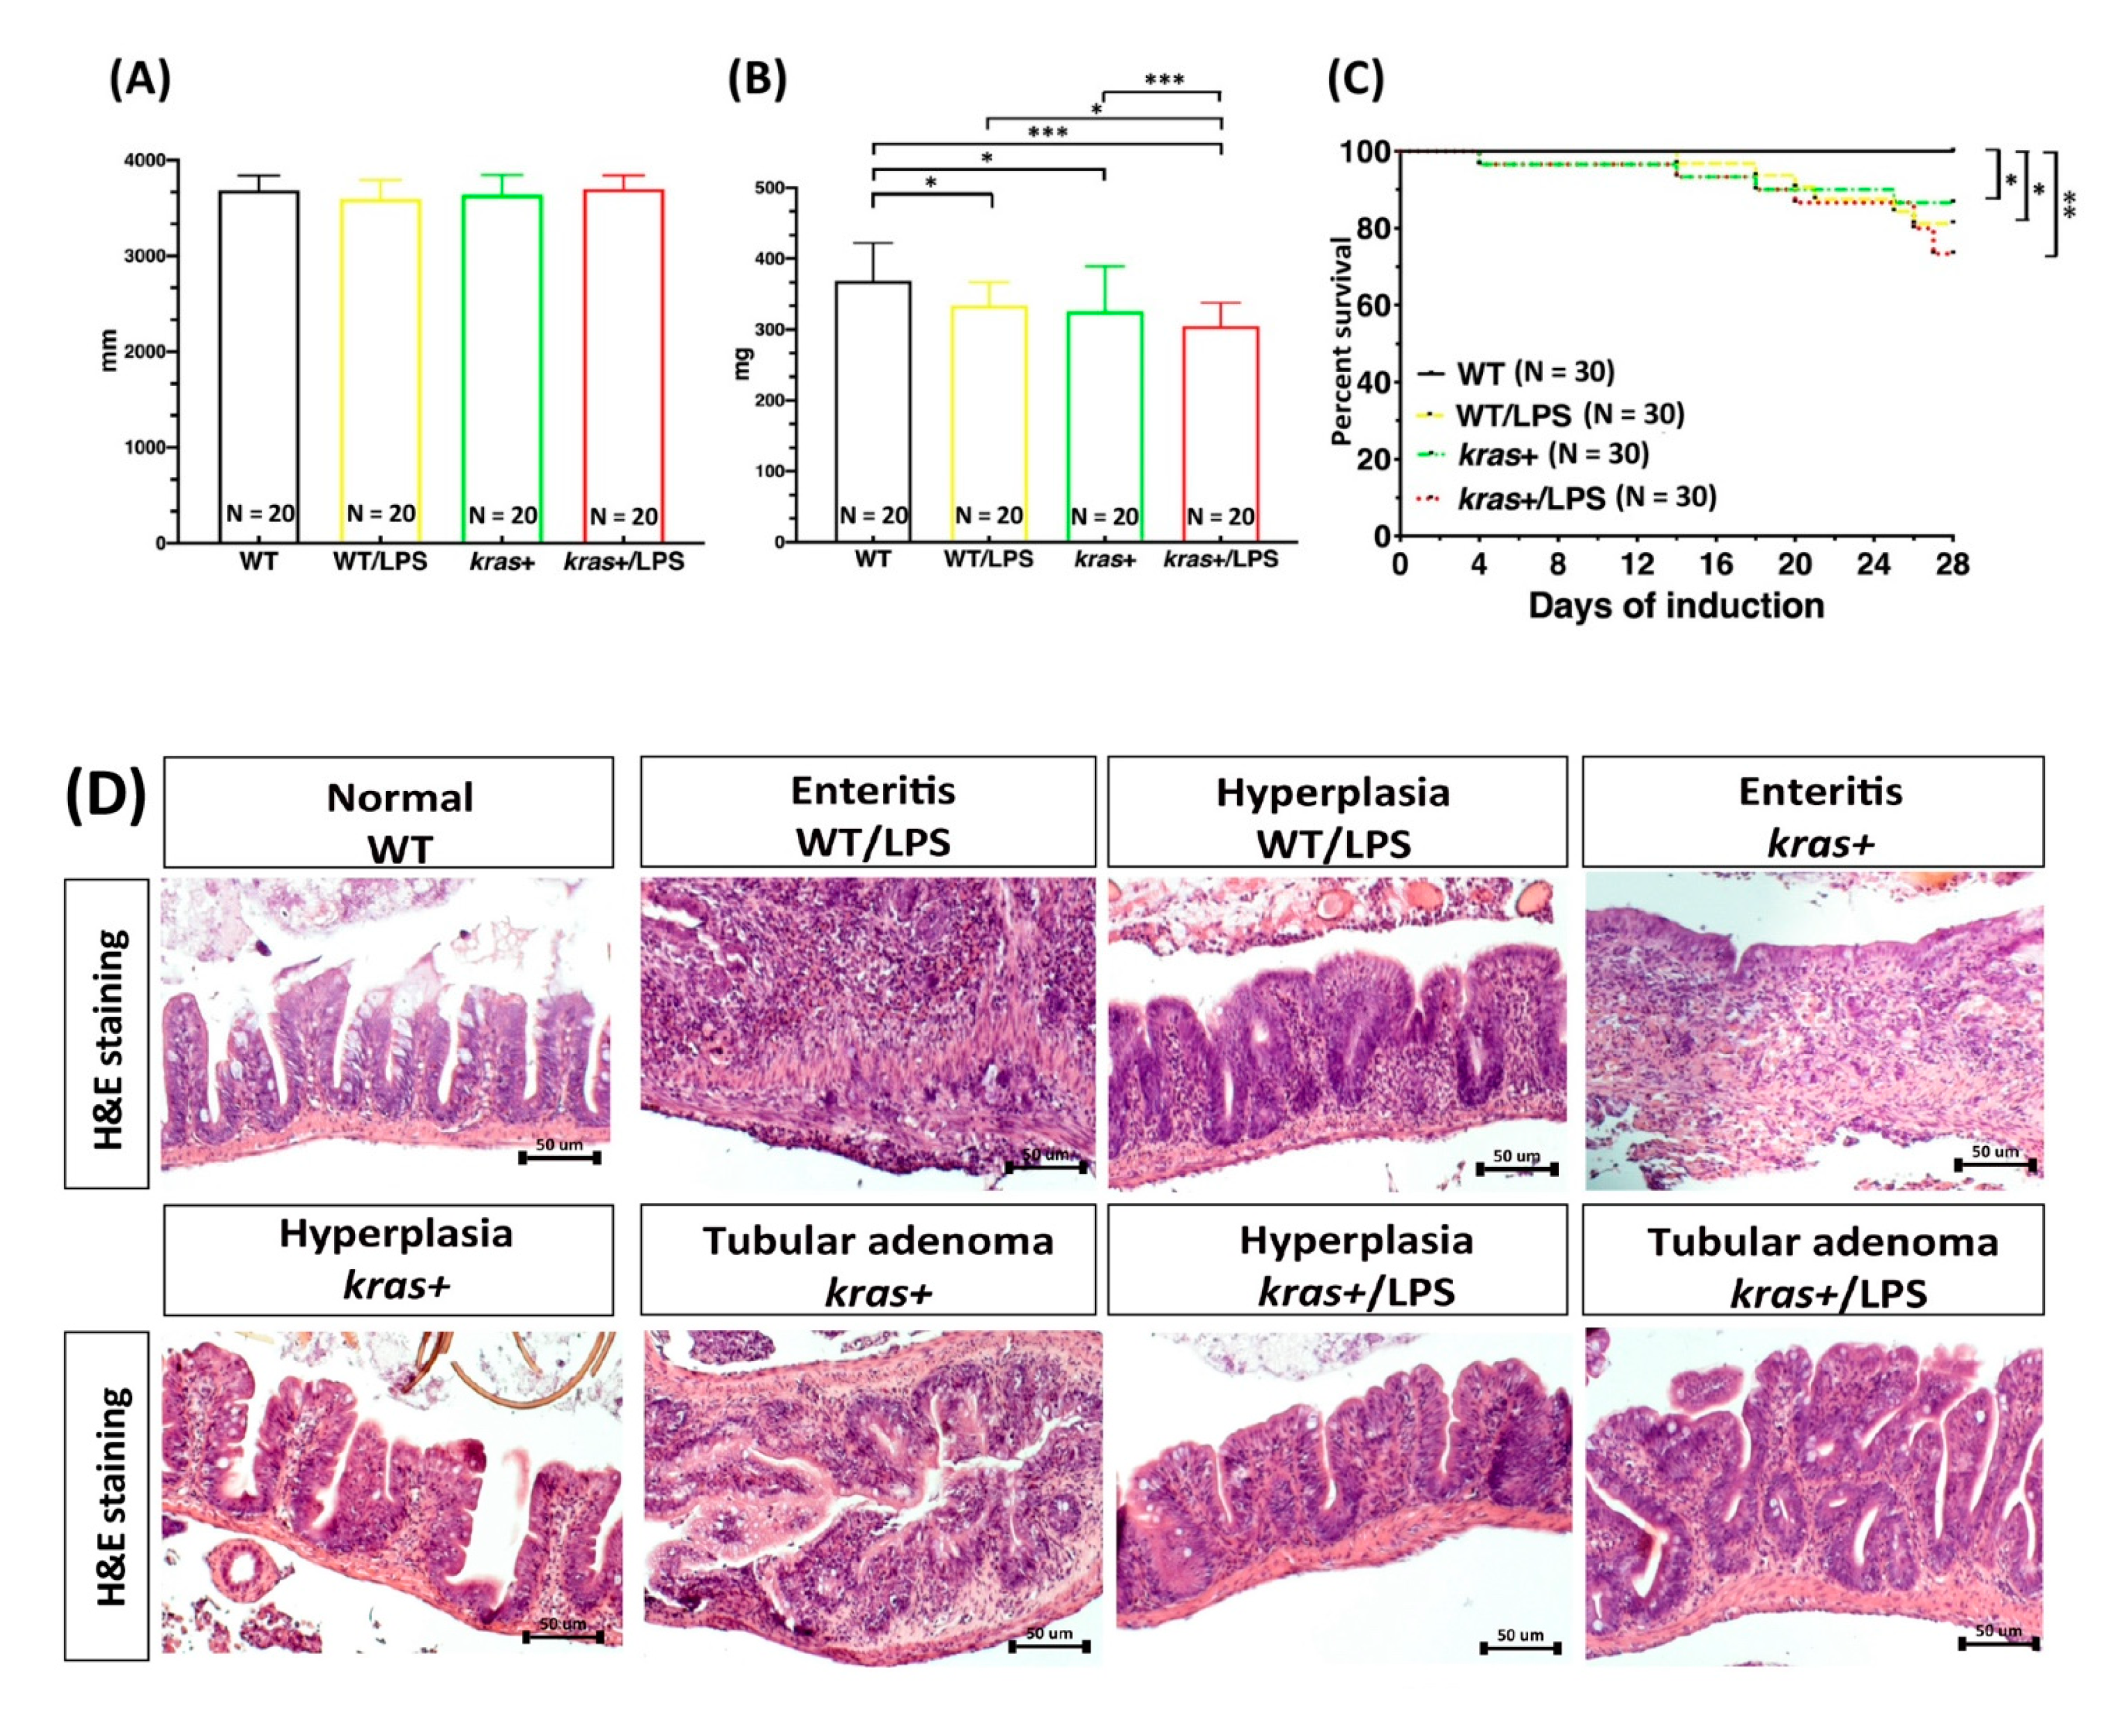
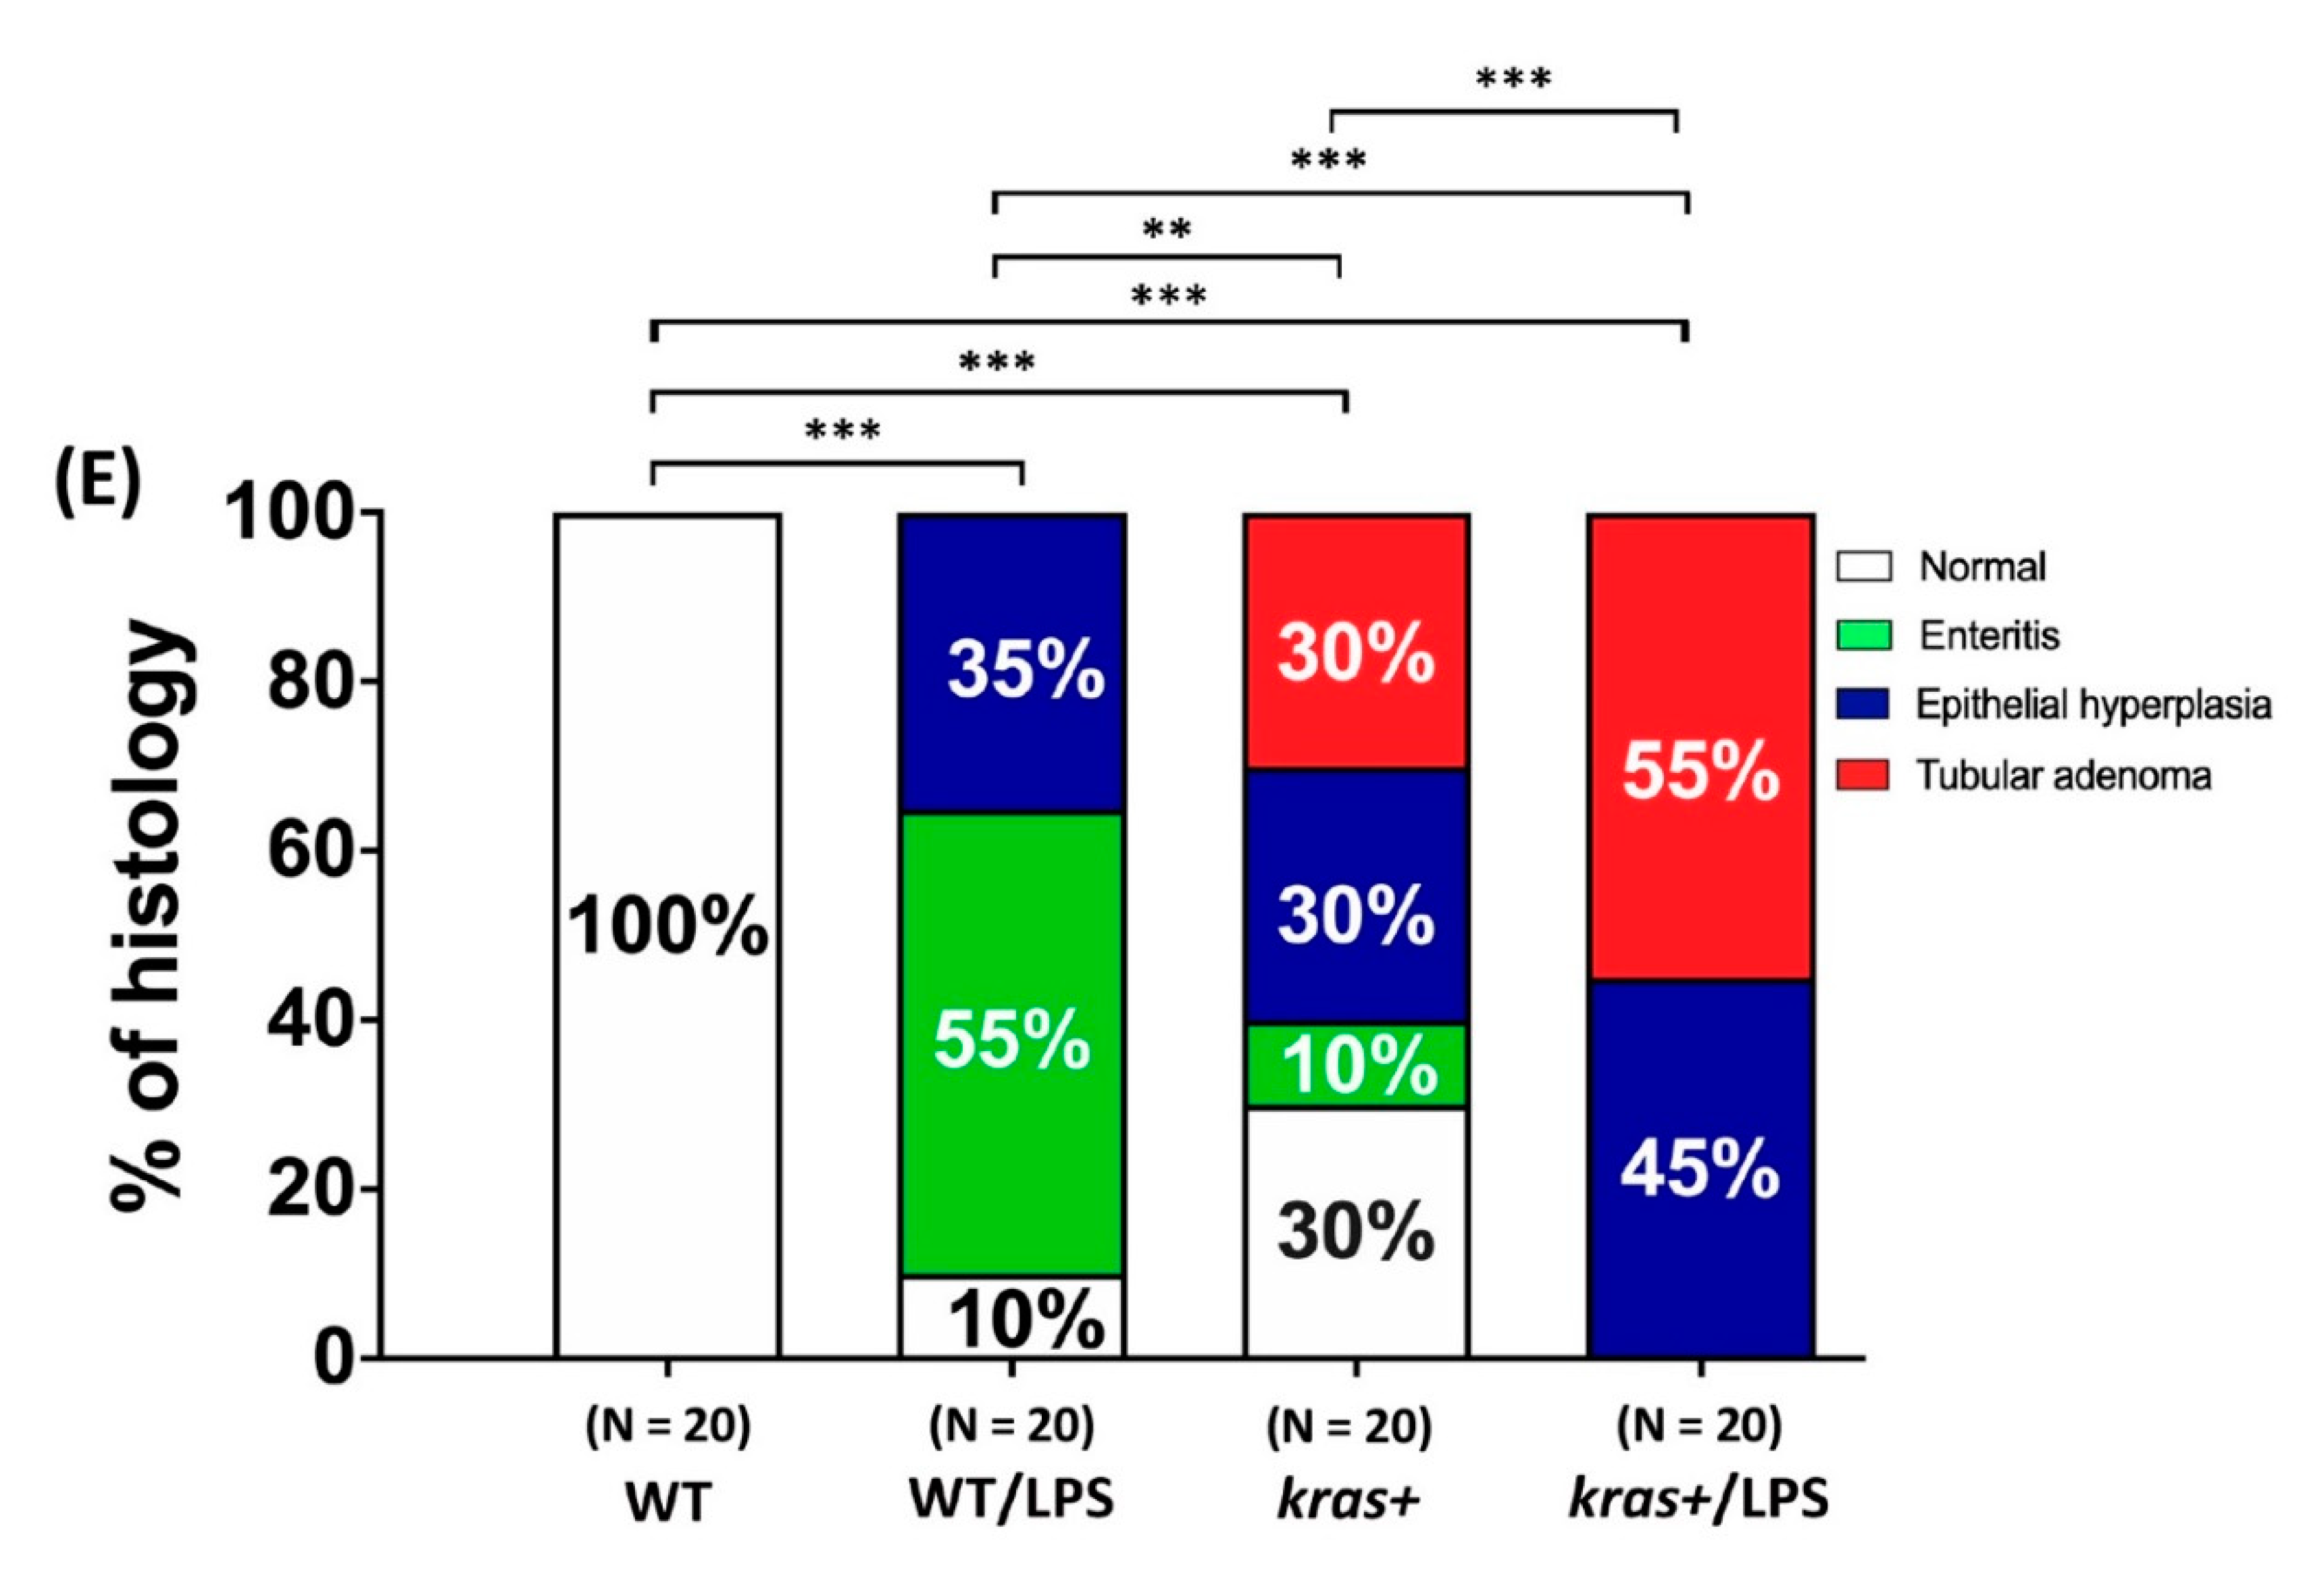
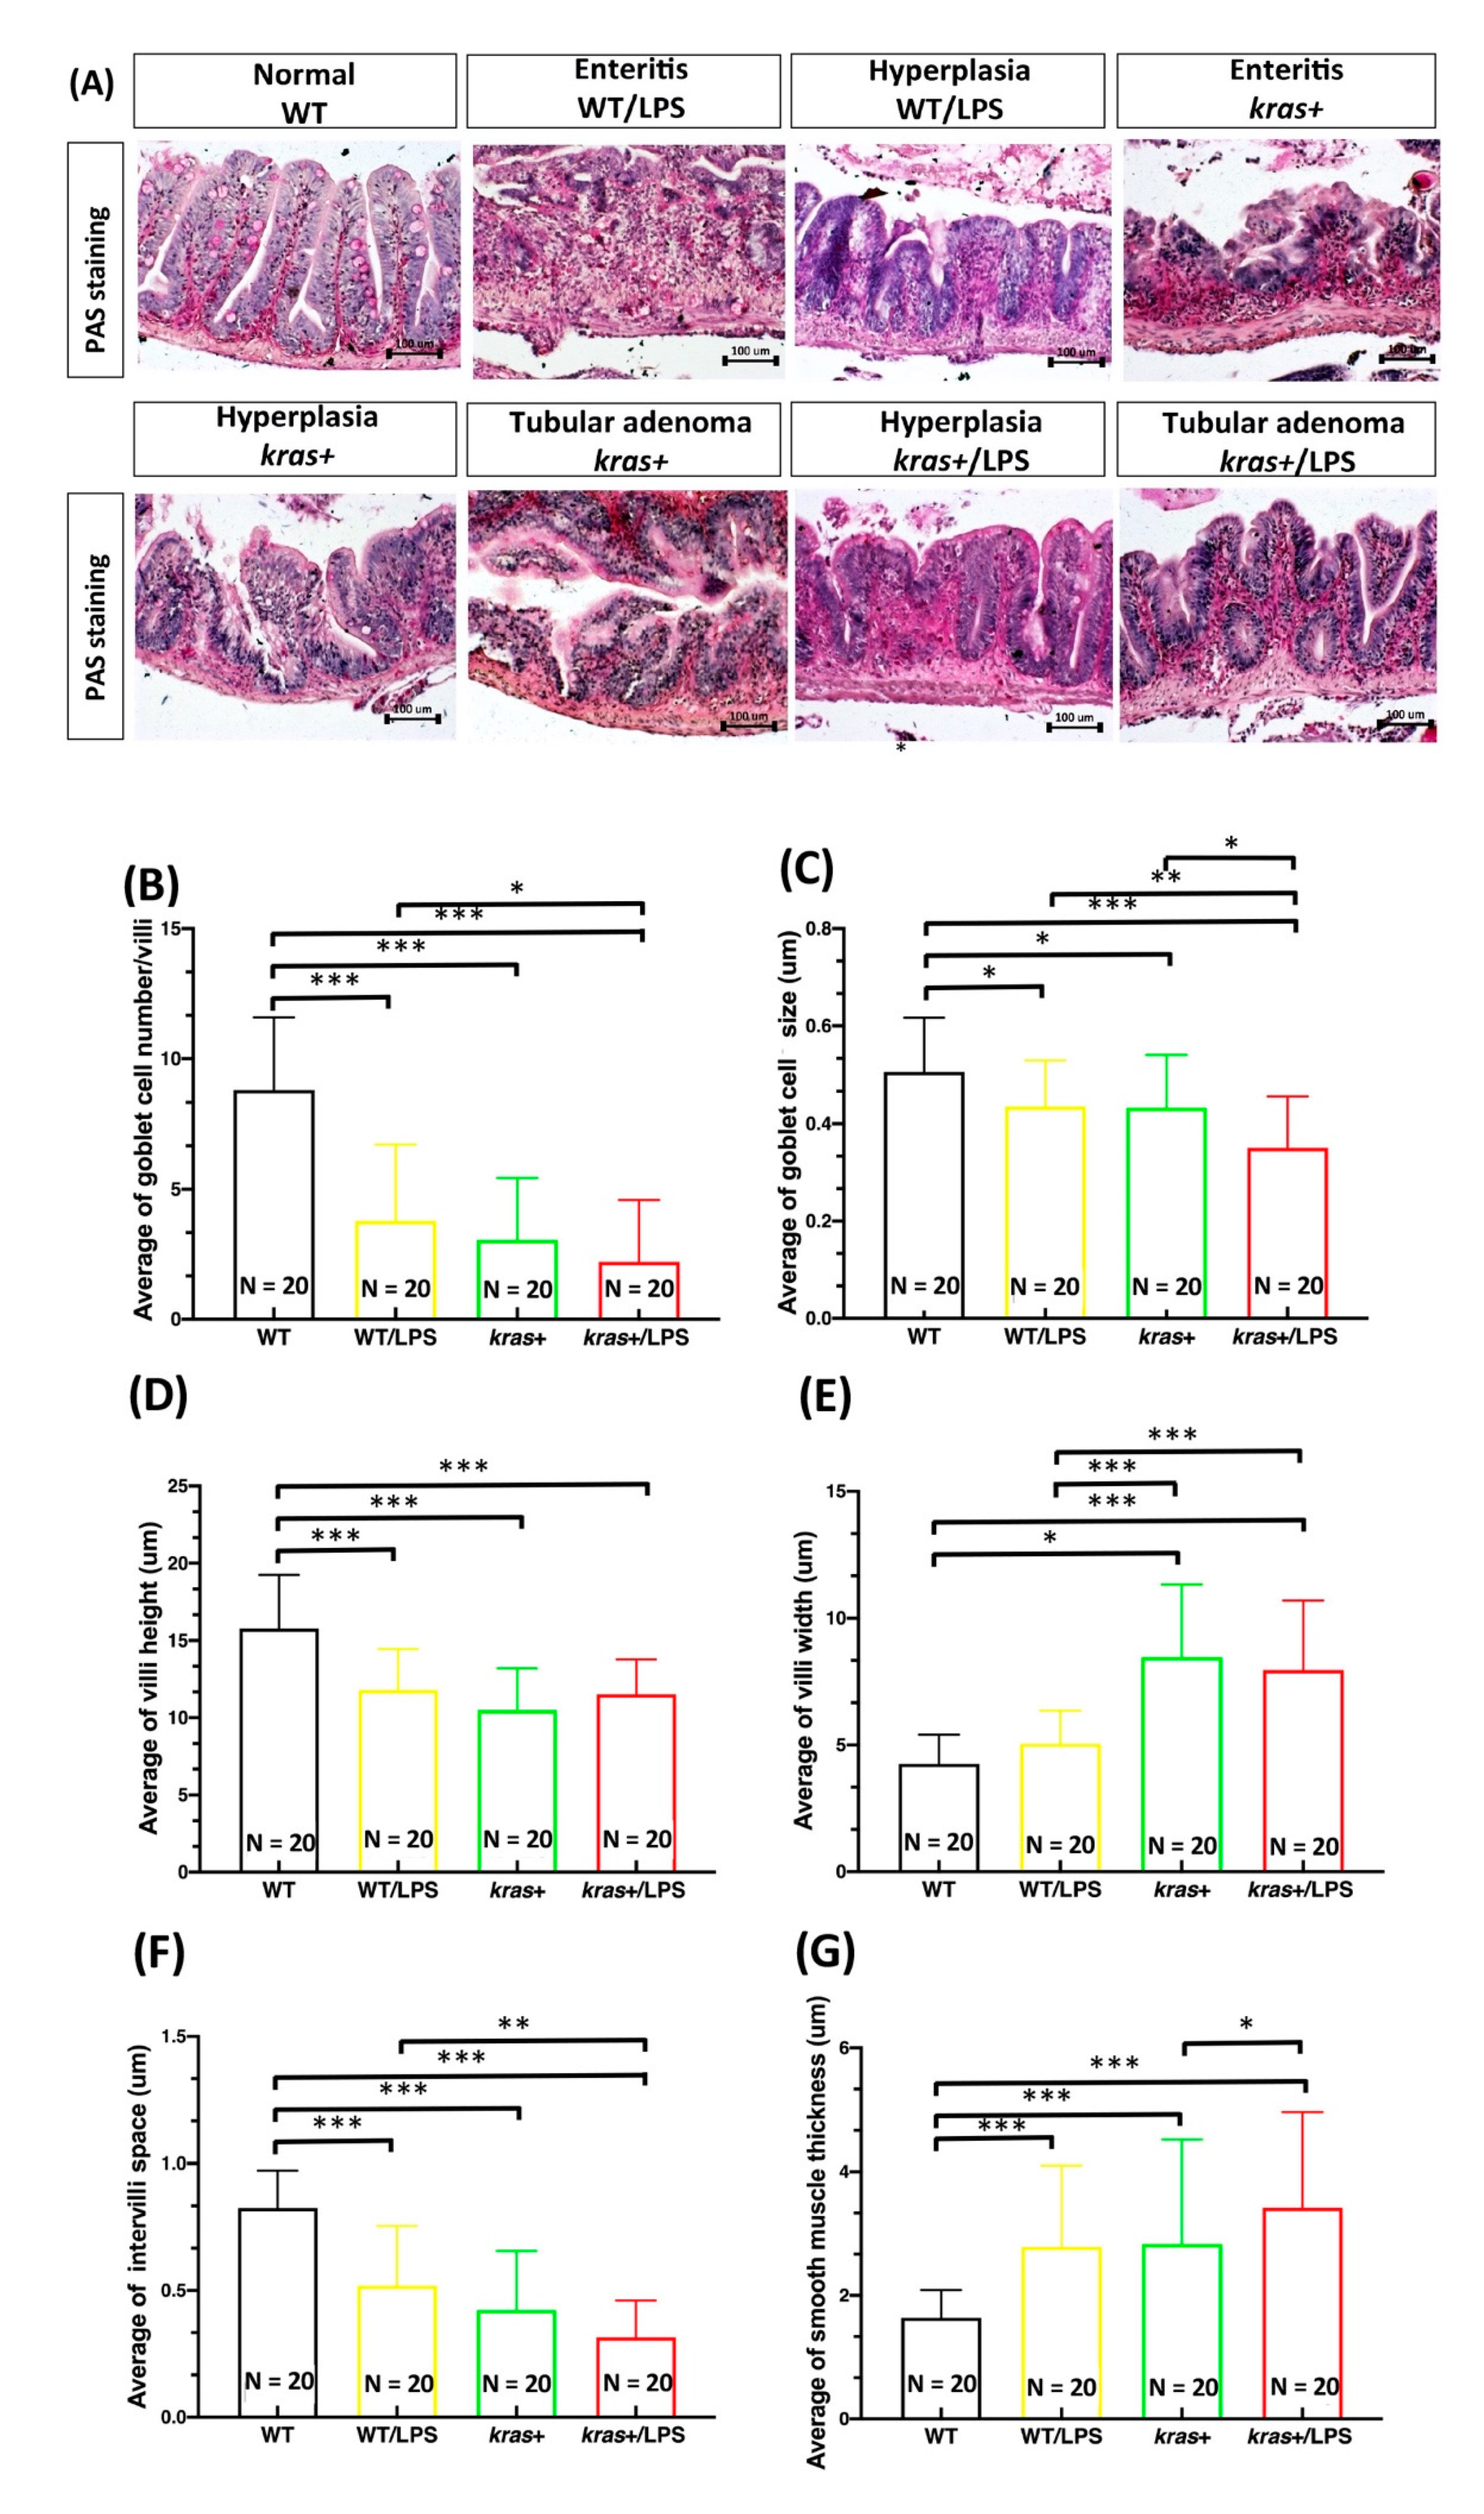
3.2. Phenotype of Intestinal Tumors Induced by Sustained Expression of krasV12 with LPS Treatment in Transgenic Zebrafish
3.3. Induction of krasV12 Expression with LPS Treatment Decreased the Number of Goblet Cells, Goblet Cell Size, Villi Height, and Intervilli Space and Increased Villi Width and Smooth Muscle Thickness in Fish Intestines
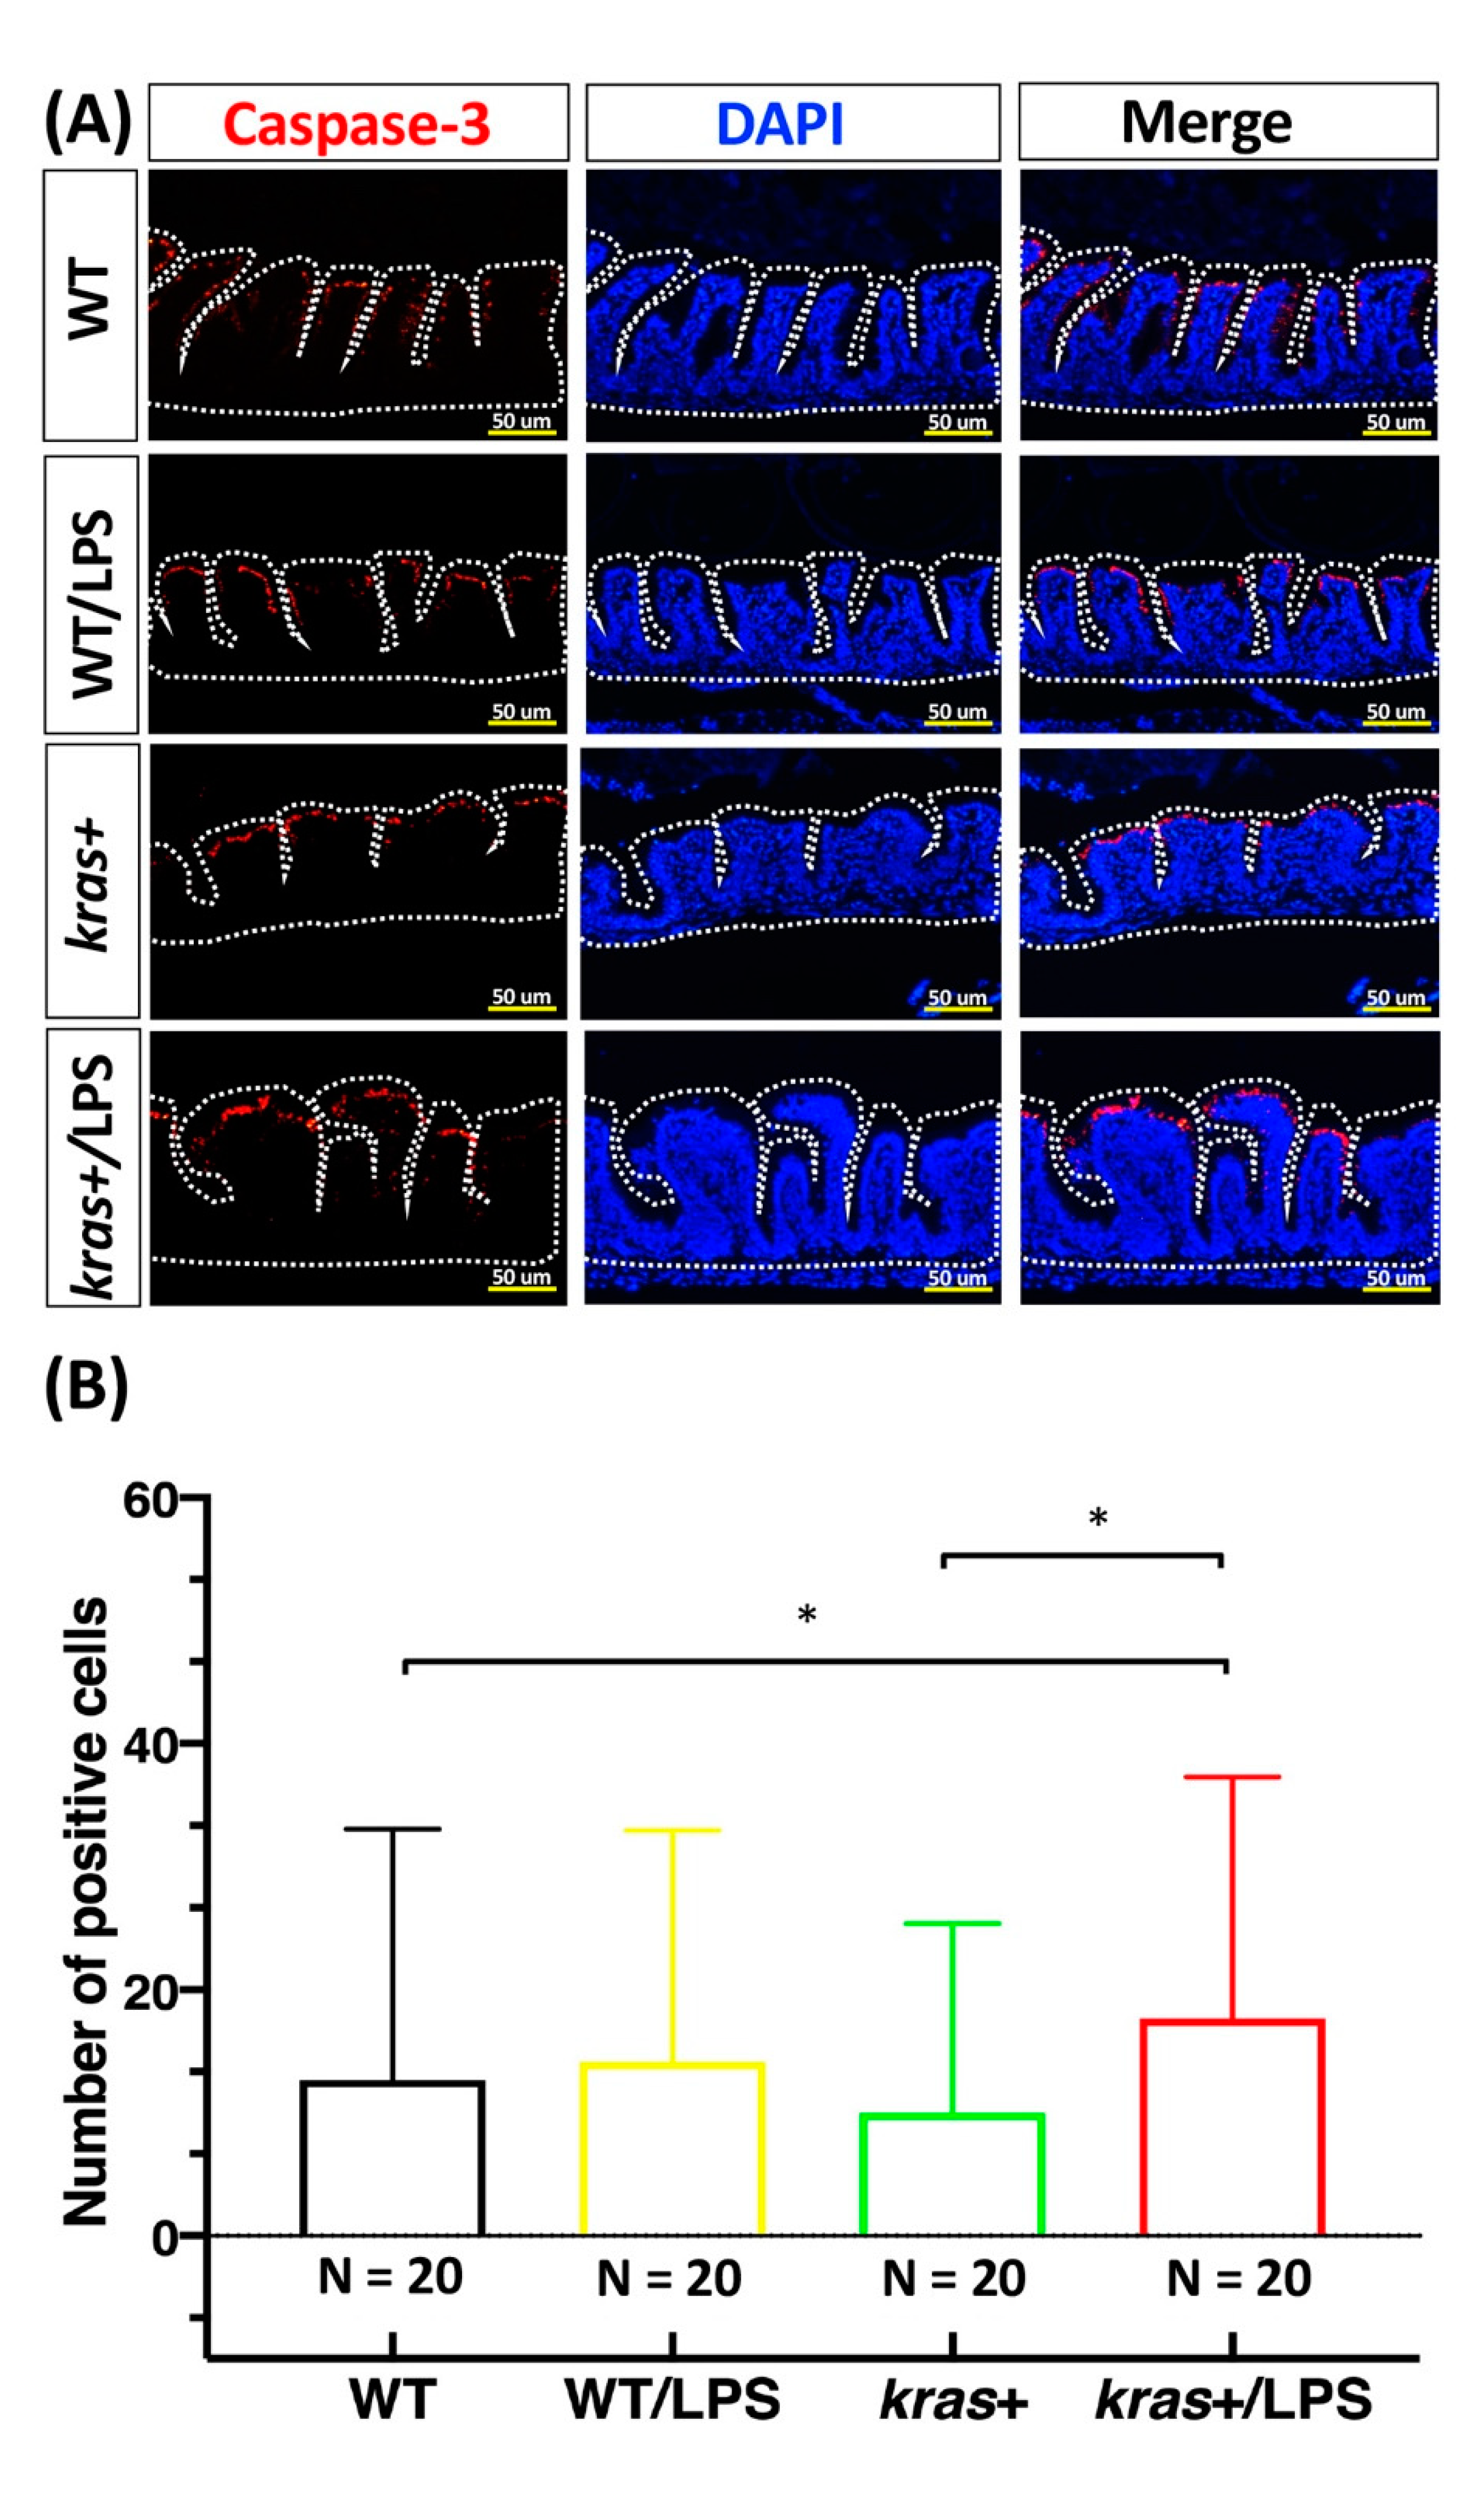
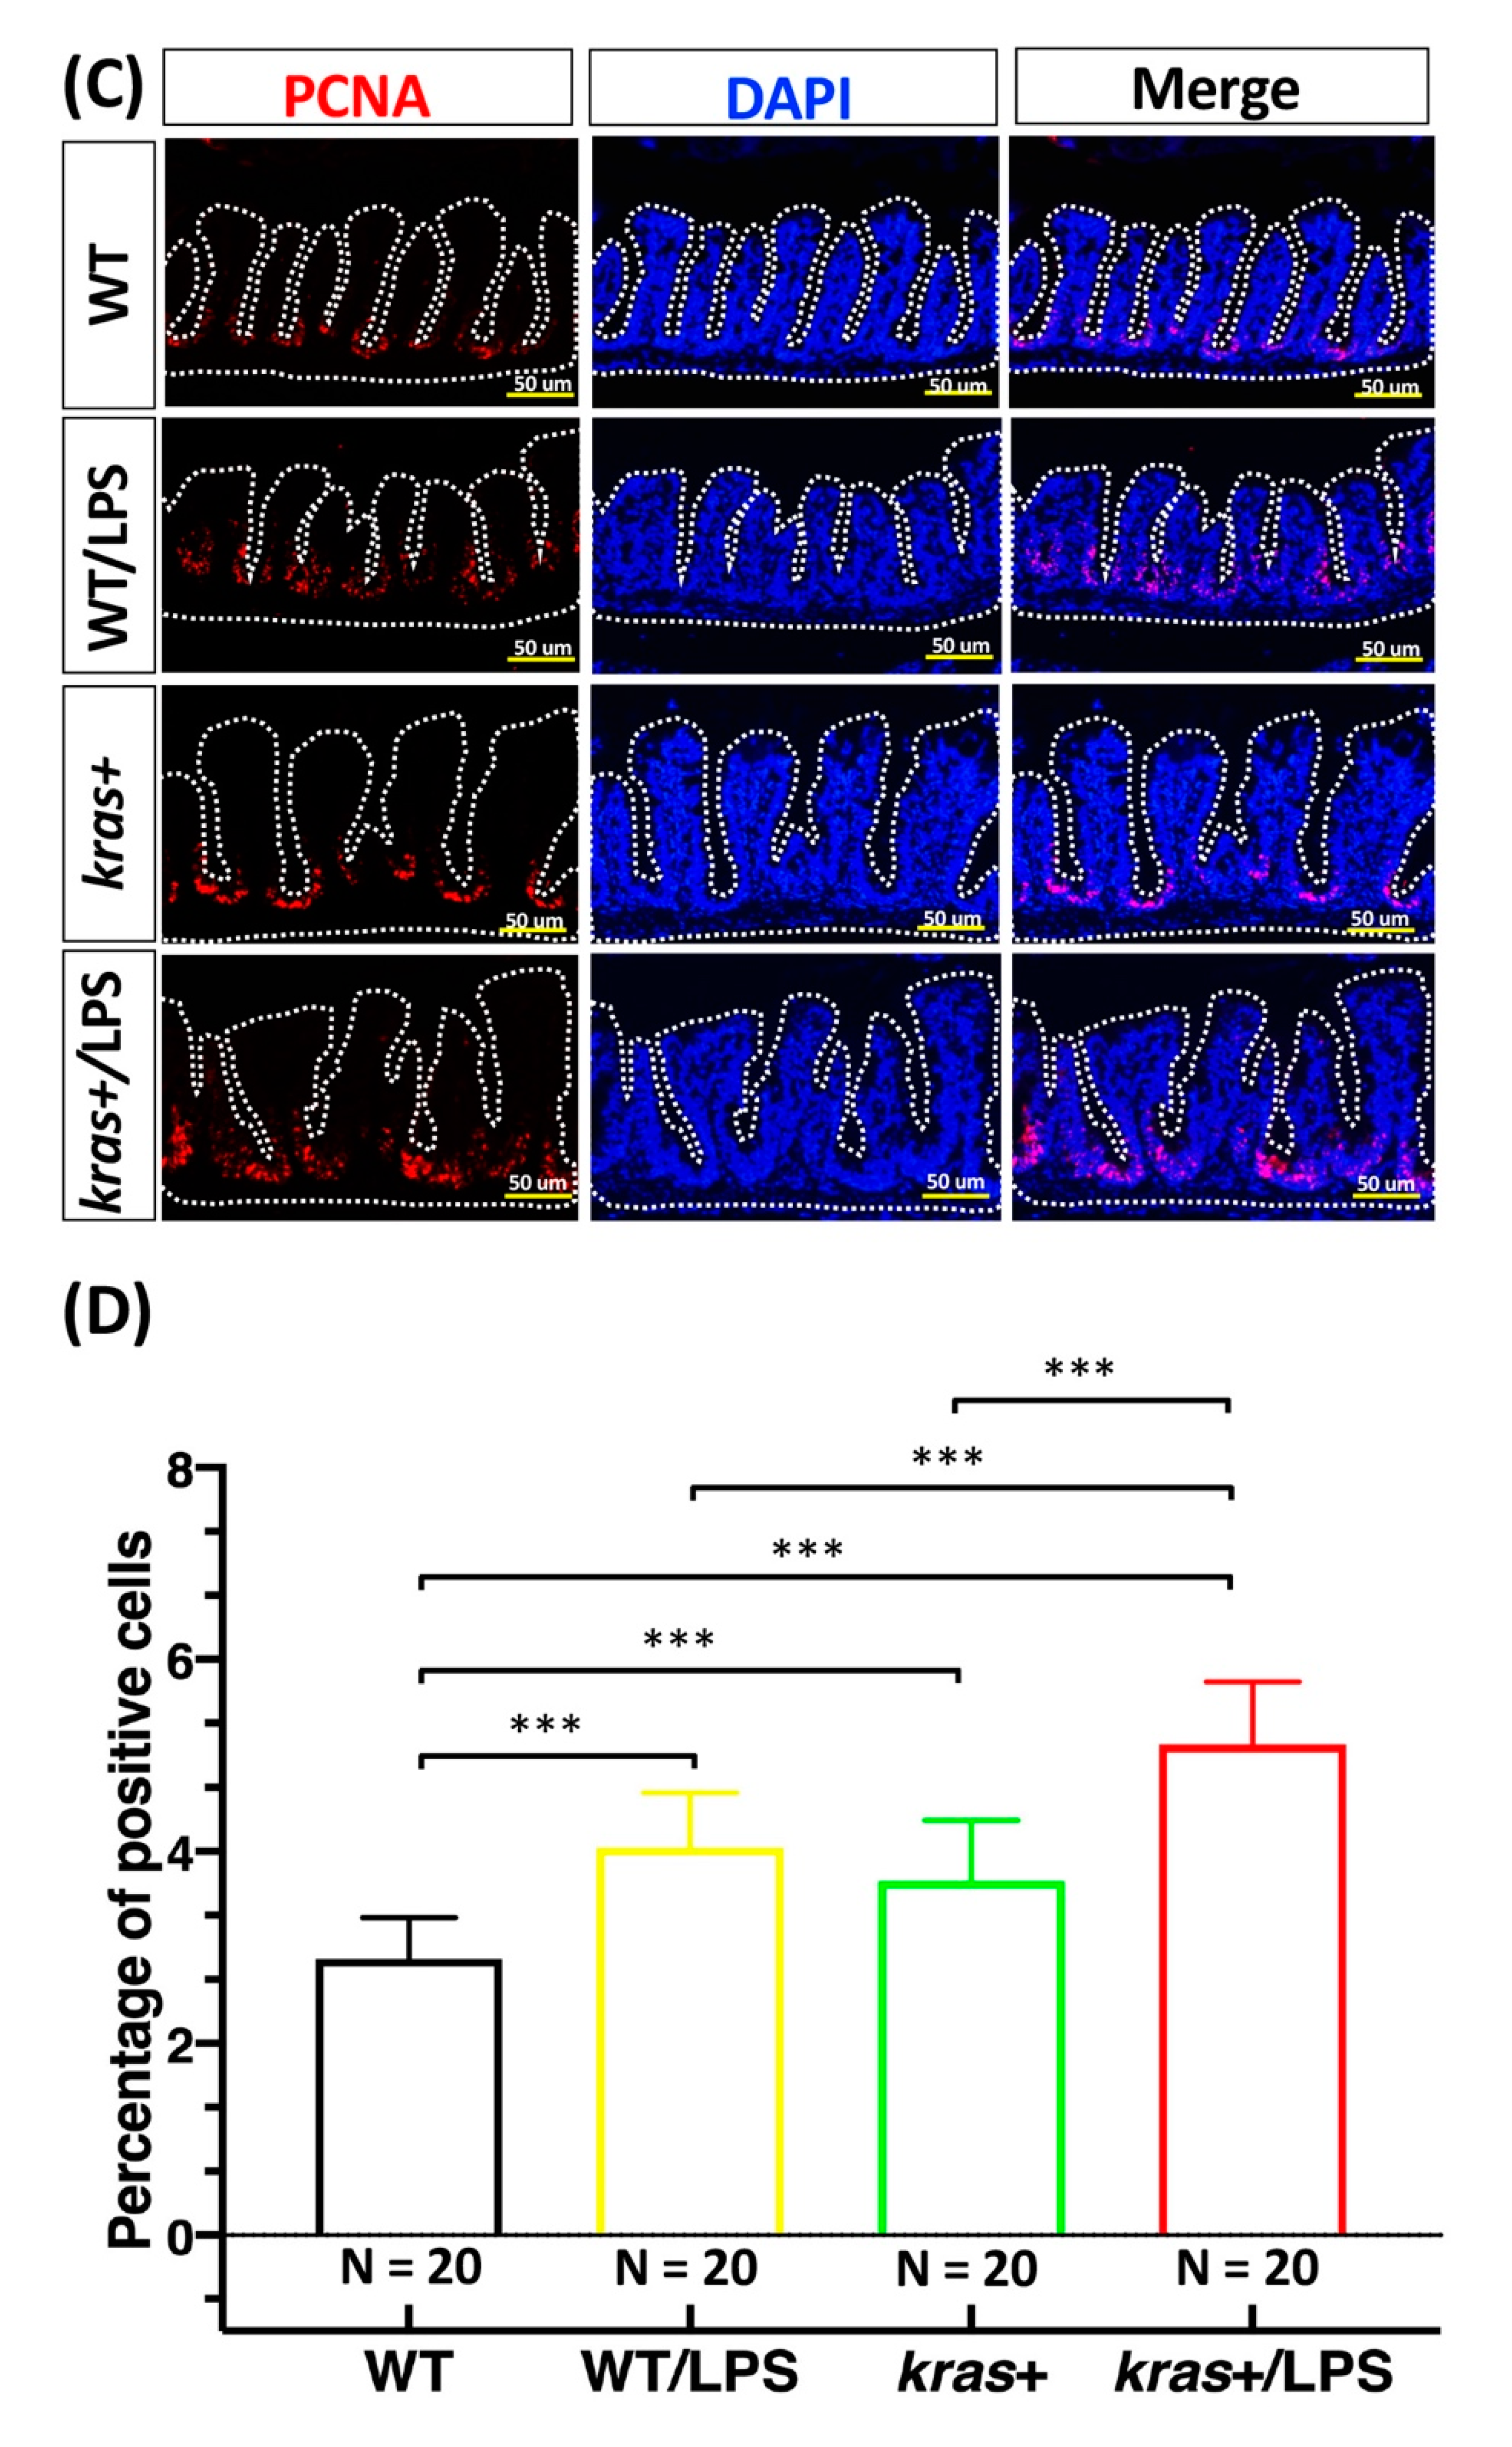
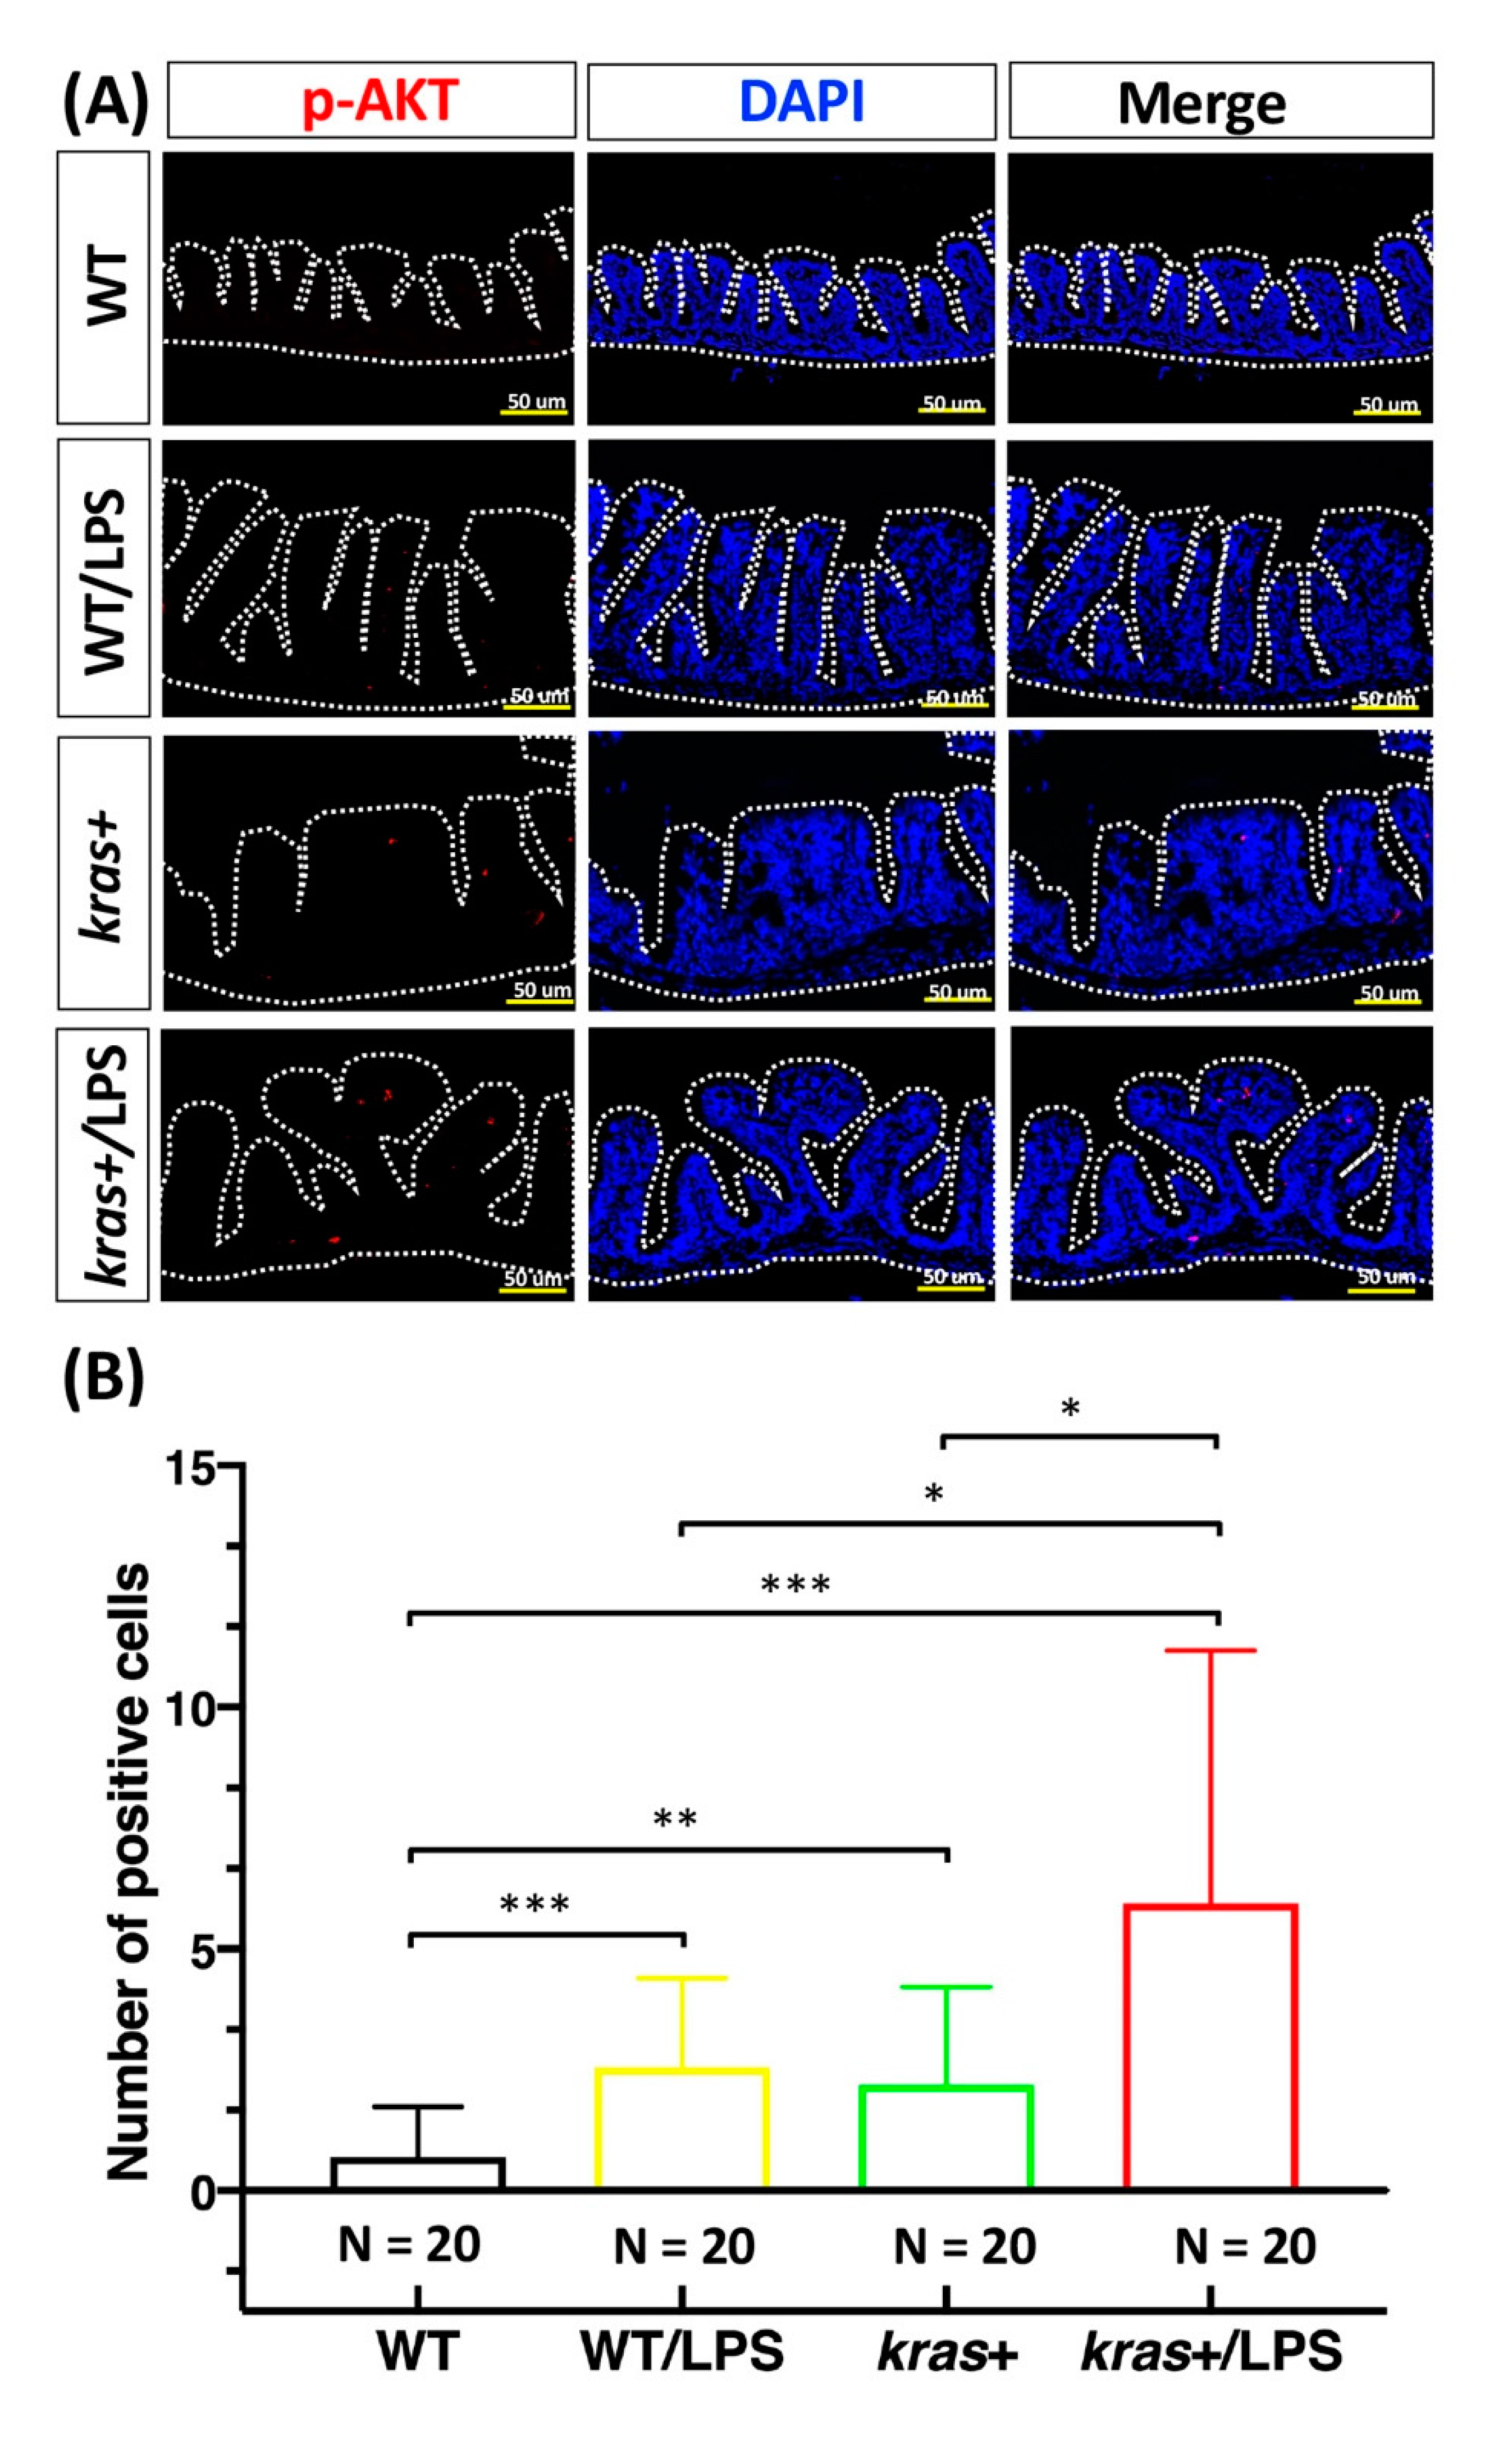
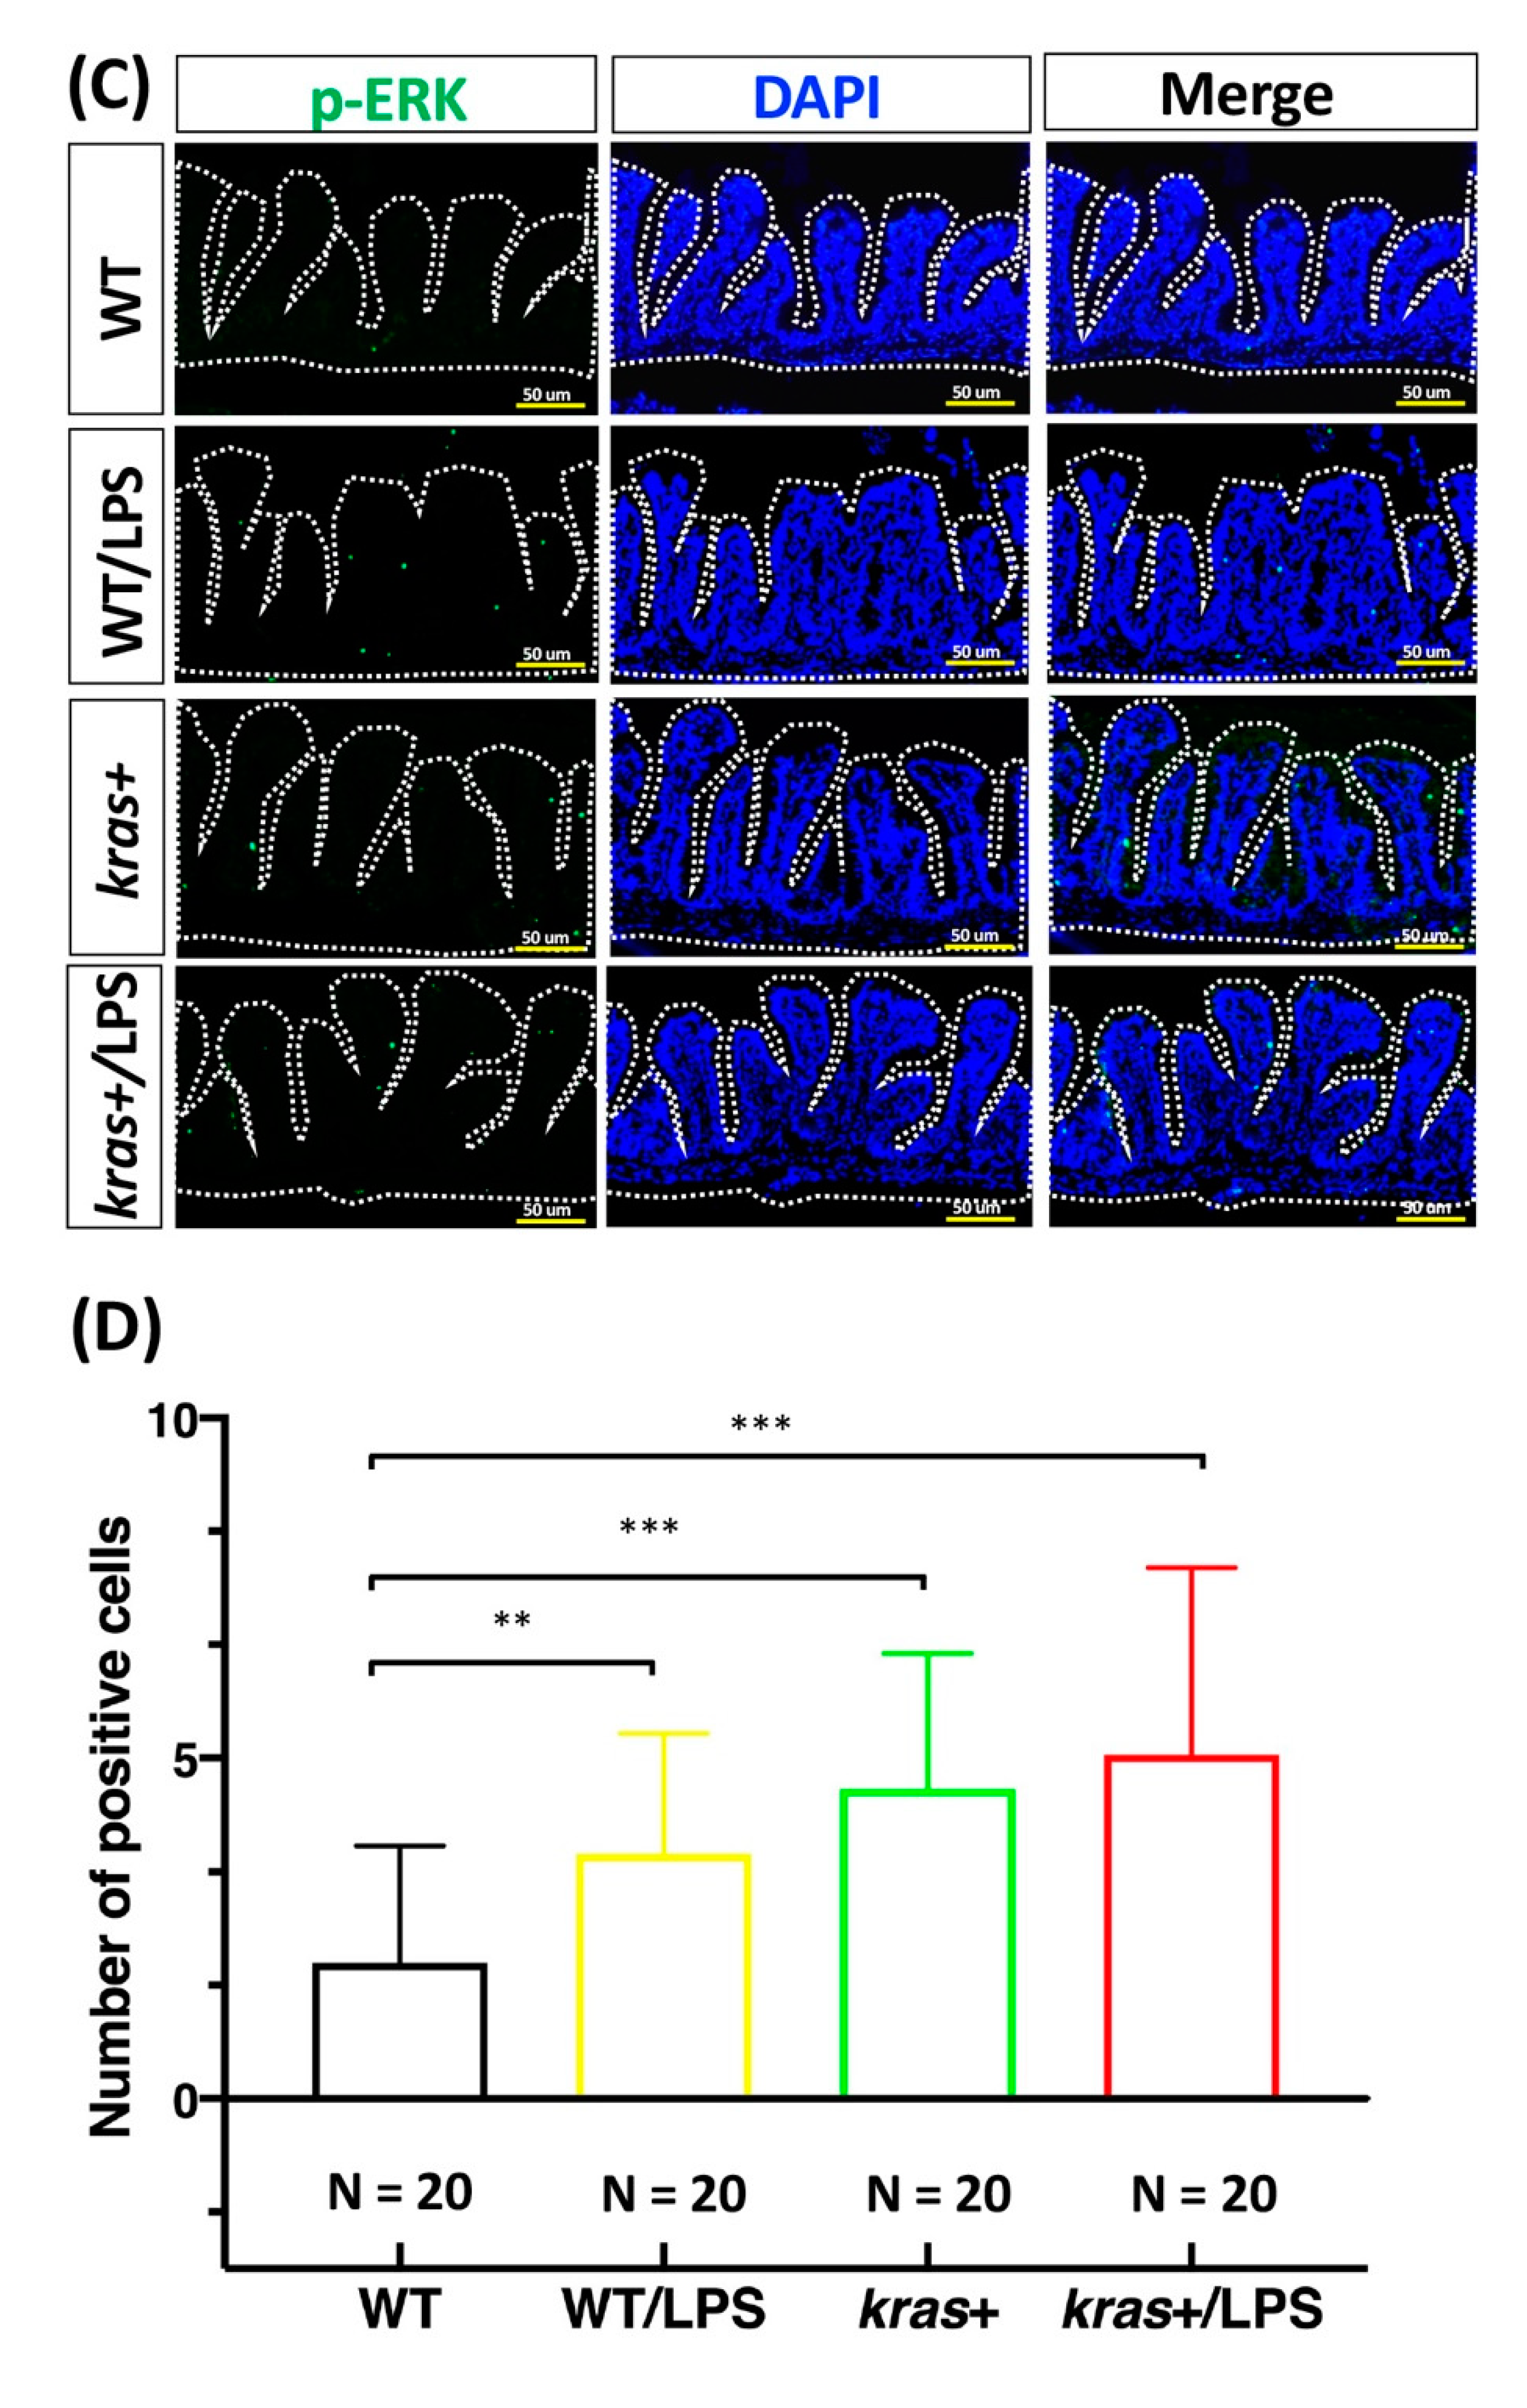
3.4. Increases in Cell Apoptosis, Proliferation, and Downstream Signaling of Phosphorylated AKT and ERK Induced by Sustained Expression of krasV12 with LPS Treatment in Transgenic Zebrafish
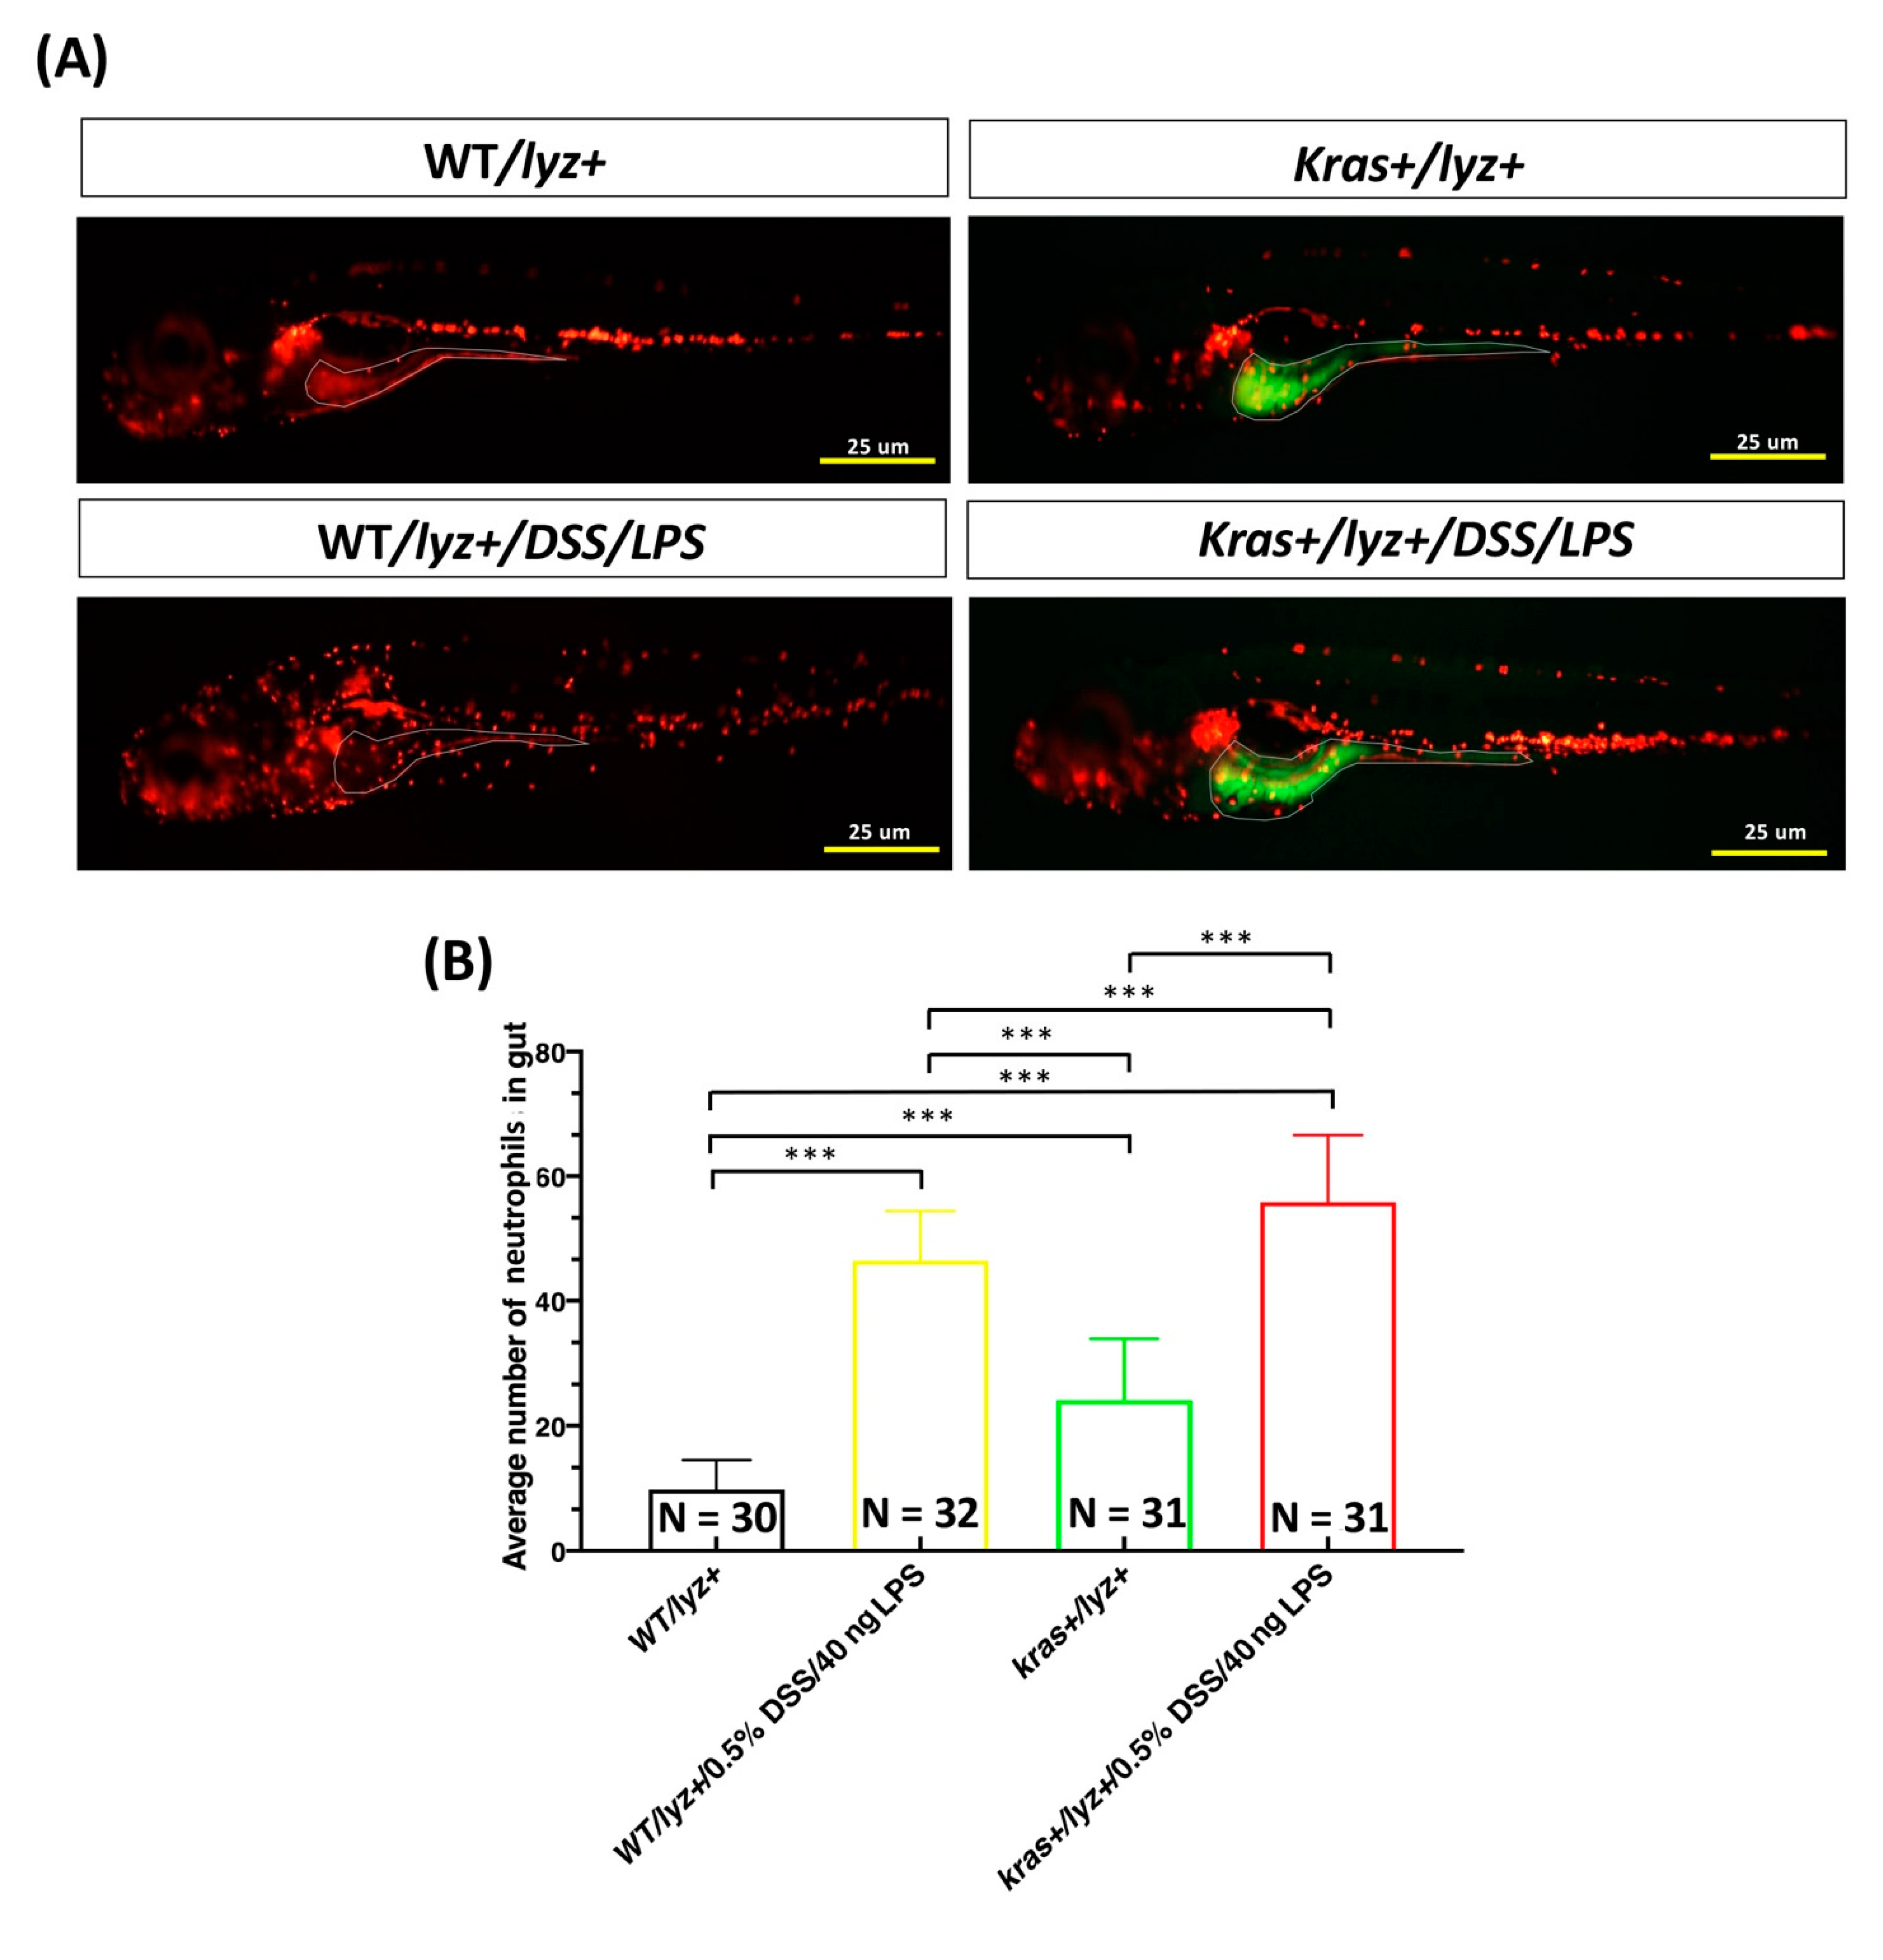
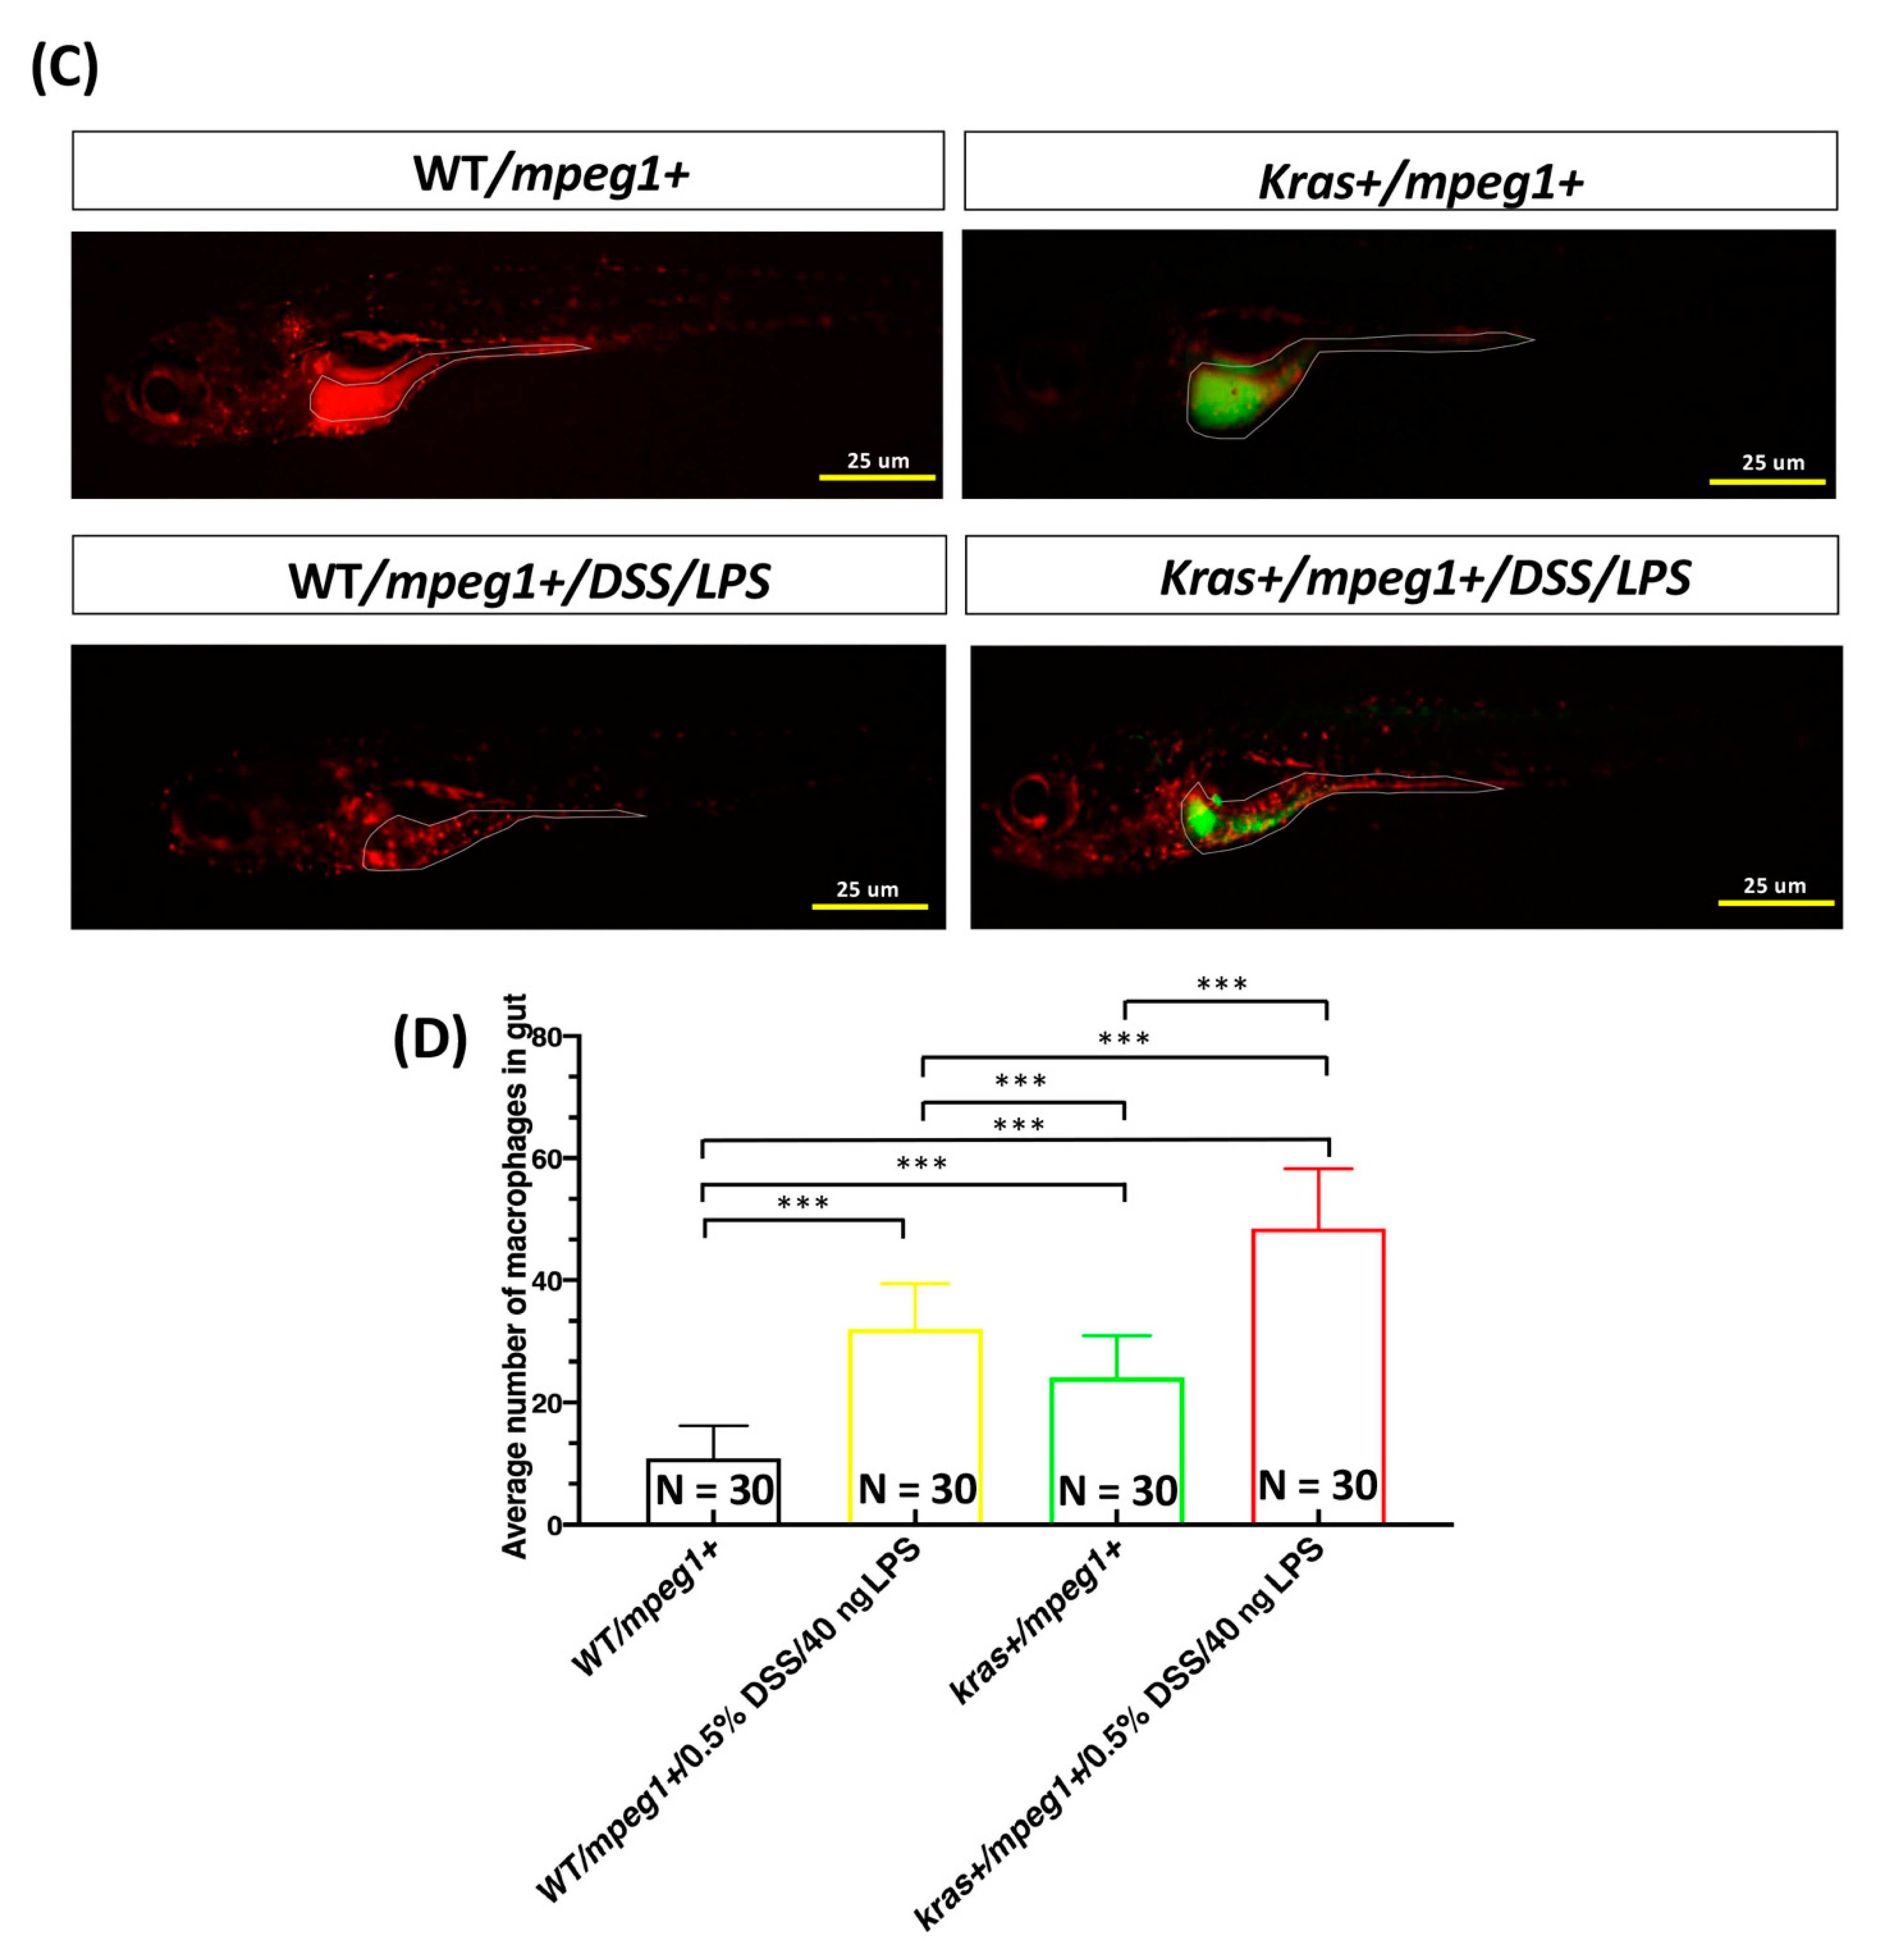
3.5. Cotreatment with DSS and LPS Enhanced Intestinal Inflammation in krasV12 Transgenic Zebrafish Larvae
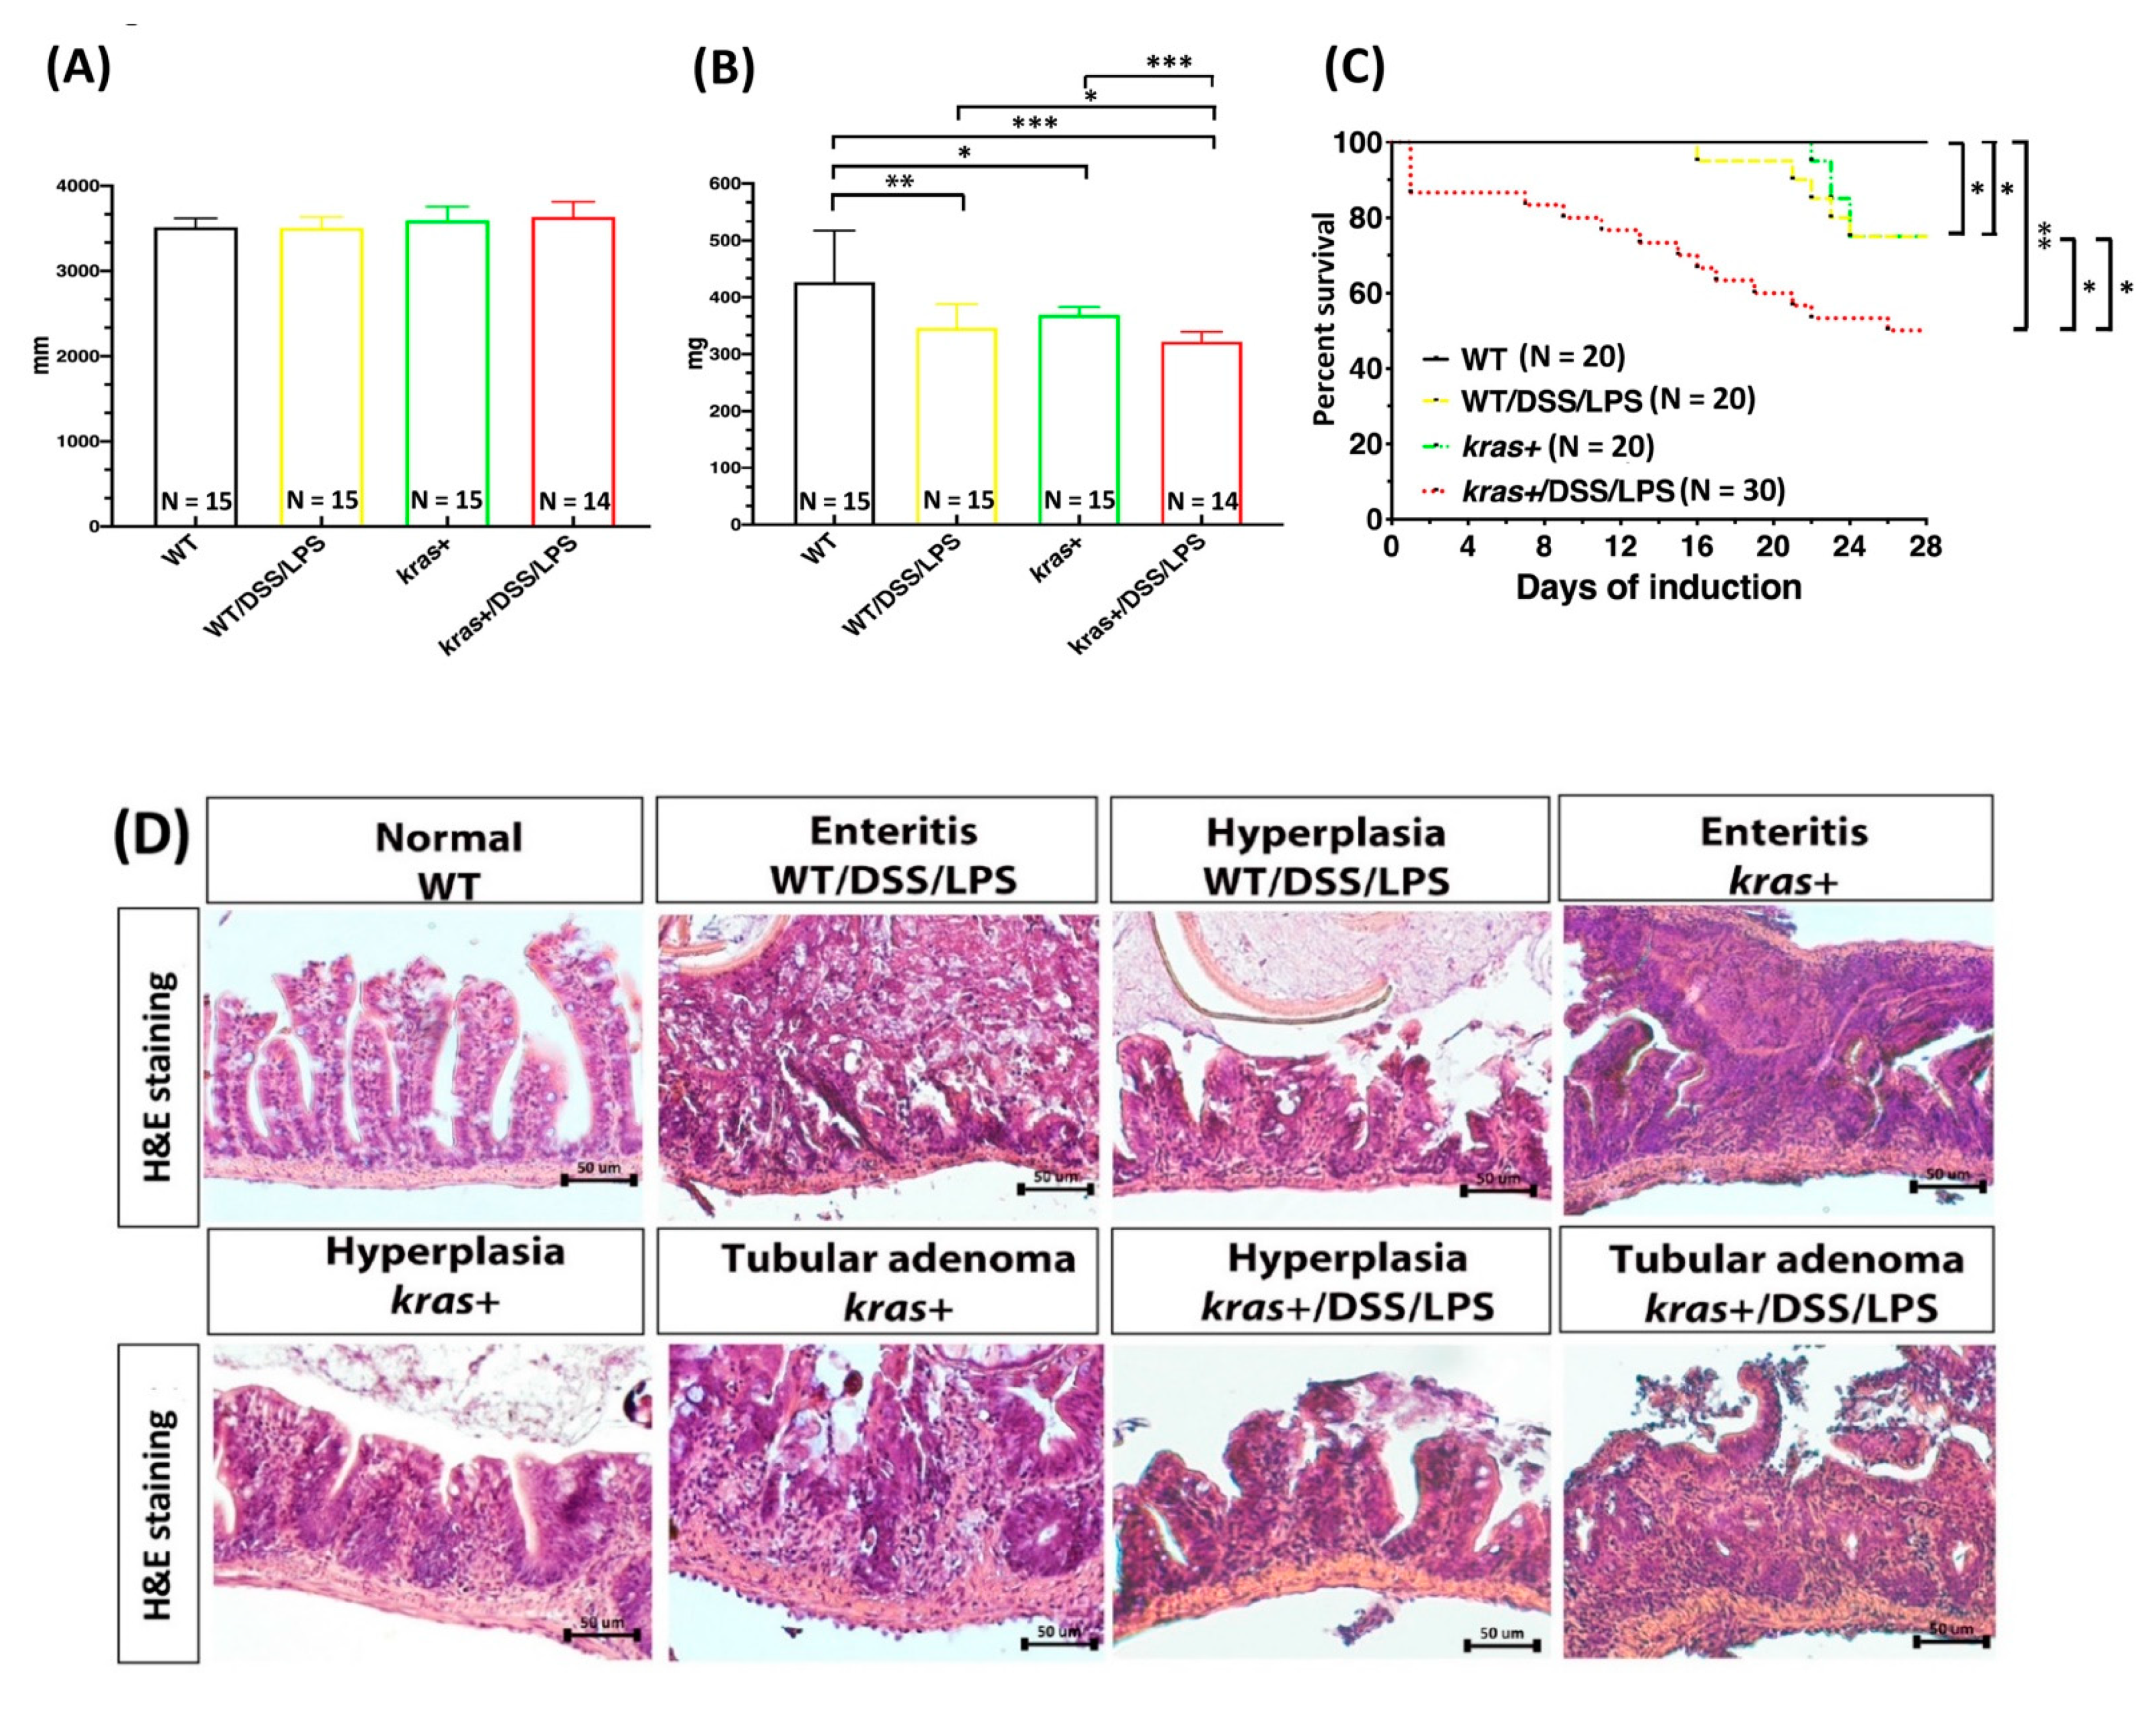
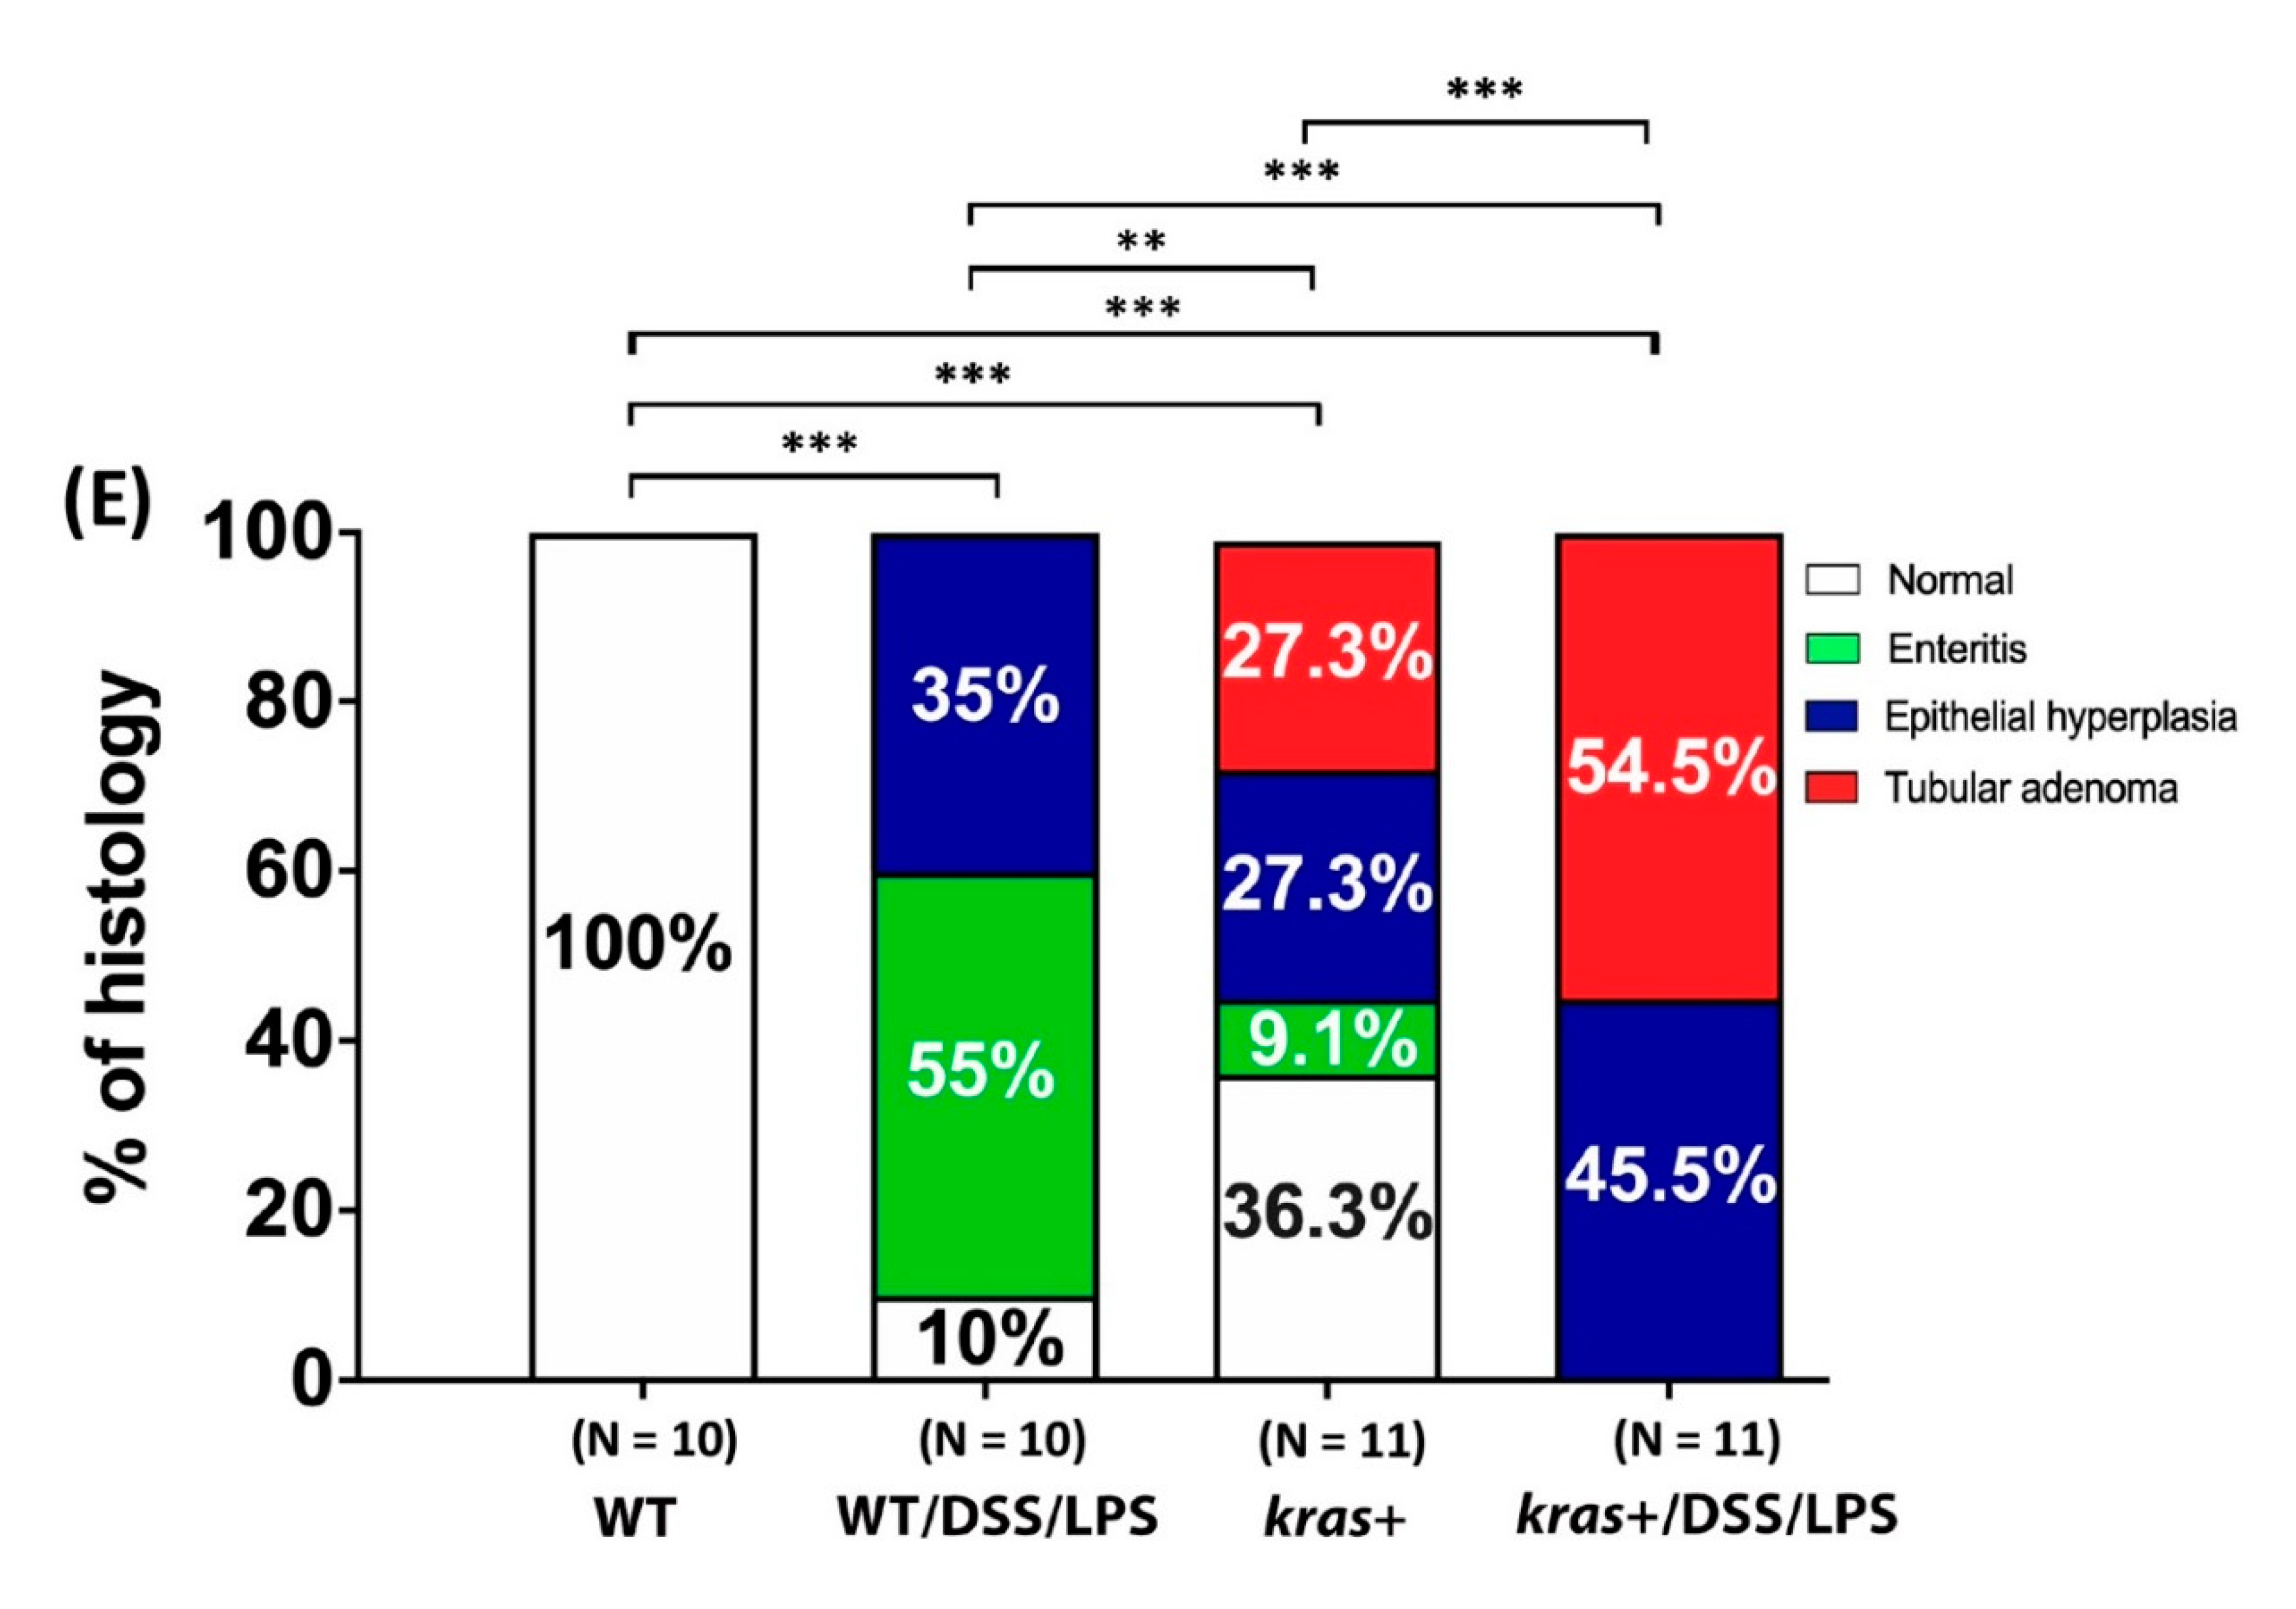
3.6. Phenotype of Intestinal Tumors Induced by Sustained Expression of krasV12 with DSS and LPS Cotreatment in Transgenic Zebrafish
4. Discussion
5. Conclusions
Supplementary Materials
Author Contributions
Funding
Institutional Review Board Statement
Informed Consent Statement
Data Availability Statement
Conflicts of Interest
References
- Brenner, H.; Kloor, M.; Pox, C.P. Colorectal cancer. Lancet 2014, 383, 1490–1502. [Google Scholar] [CrossRef]
- Kuipers, E.J.; Grady, W.M.; Lieberman, D.; Seufferlein, T.; Sung, J.J.; Boelens, P.G.; van de Velde, C.J.; Watanabe, T. Colorectal cancer. Nat. Rev. Dis. Primers 2015, 1, 15065. [Google Scholar] [CrossRef] [PubMed] [Green Version]
- Mármol, I.; Sánchez-De-Diego, C.; Dieste, A.P.; Cerrada, E.; Yoldi, M.J.R. Colorectal Carcinoma: A General Overview and Future Perspectives in Colorectal Cancer. Int. J. Mol. Sci. 2017, 18, 197. [Google Scholar] [CrossRef] [PubMed] [Green Version]
- Bray, F.; Ferlay, J.; Soerjomataram, I.; Siegel, R.L.; Torre, L.A.; Jemal, A. Global cancer statistics 2018: GLOBOCAN estimates of incidence and mortality worldwide for 36 cancers in 185 countries. CA Cancer J. Clin. 2018, 68, 394–424. [Google Scholar] [CrossRef] [Green Version]
- Siegel, R.L.; Miller, K.D.; Jemal, A. Cancer statistics, 2019. CA Cancer J. Clin. 2019, 69, 7–34. [Google Scholar] [CrossRef] [PubMed] [Green Version]
- Zhang, Z.; Tao, Y.; Hua, Q.; Cai, J.; Ye, X.; Li, H. SNORA71A Promotes Colorectal Cancer Cell Proliferation, Migration, and Invasion. BioMed Res. Int. 2020, 2020, 1–11. [Google Scholar] [CrossRef]
- Rawla, P.; Sunkara, T.; Barsouk, A. Epidemiology of colorectal cancer: Incidence, mortality, survival, and risk factors. Prz. Gastroenterol. 2019, 14, 89–103. [Google Scholar] [CrossRef]
- Jančík, S.; Drabek, J.; Radzioch, D.; Hajdúch, M. Clinical Relevance of KRAS in Human Cancers. J. Biomed. Biotechnol. 2010, 2010, 1–13. [Google Scholar] [CrossRef] [Green Version]
- Marley, A.R.; Nan, H. Epidemiology of colorectal cancer. Int. J. Mol. Epidemiol. Genet. 2016, 7, 105–114. [Google Scholar]
- Zenonos, K.; Kyprianou, K. RAS signaling pathways, mutations and their role in colorectal cancer. World J. Gastrointest. Oncol. 2013, 5, 97–101. [Google Scholar] [CrossRef]
- Vakiani, E.; Solit, D.B. KRAS and BRAF: Drug targets and predictive biomarkers. J. Pathol. 2010, 223, 220–230. [Google Scholar] [CrossRef] [PubMed]
- Saud, S.M.; Li, W.; Morris, N.L.; Matter, M.; Colburn, N.H.; Kim, Y.S.; Young, M.R. Resveratrol prevents tumorigenesis in mouse model of Kras activated sporadic colorectal cancer by suppressing oncogenic Kras expression. Carcinogenesis 2014, 35, 2778–2786. [Google Scholar] [CrossRef] [PubMed] [Green Version]
- Gagnière, J.; Raisch, J.; Veziant, J.; Barnich, N.; Bonnet, R.; Buc, E.; Bringer, M.-A.; Pezet, D.; Bonnet, M. Gut microbiota imbalance and colorectal cancer. World J. Gastroenterol. 2016, 22, 501–518. [Google Scholar] [CrossRef] [PubMed]
- Brennan, C.A.; Garrett, W.S. Gut Microbiota, Inflammation, and Colorectal Cancer. Annu. Rev. Microbiol. 2016, 70, 395–411. [Google Scholar] [CrossRef] [Green Version]
- Flemer, B.; Lynch, D.B.; Brown, J.M.R.; Jeffery, I.; Ryan, F.; Claesson, M.; O’Riordain, M.; Shanahan, F.; O’Toole, P.W. Tumour-associated and non-tumour-associated microbiota in colorectal cancer. Gut 2017, 66, 633–643. [Google Scholar] [CrossRef] [PubMed]
- Song, M.; Chan, A.T. Environmental Factors, Gut Microbiota, and Colorectal Cancer Prevention. Clin. Gastroenterol. Hepatol. 2019, 17, 275–289. [Google Scholar] [CrossRef]
- Hsu, R.Y.; Chan, C.H.; Spicer, J.D.; Rousseau, M.C.; Giannias, B.; Rousseau, S.; Ferri, L.E. LPS-induced TLR4 signaling in human colorectal cancer cells increases beta1 integrin-mediated cell adhesion and liver metastasis. Cancer Res. 2011, 71, 1989–1998. [Google Scholar] [CrossRef] [Green Version]
- Pastorelli, L.; De Salvo, C.; Mercado, J.R.; Vecchi, M.; Pizarro, T.T. Central Role of the Gut Epithelial Barrier in the Pathogenesis of Chronic Intestinal Inflammation: Lessons Learned from Animal Models and Human Genetics. Front. Immunol. 2013, 4, 280. [Google Scholar] [CrossRef] [Green Version]
- Yesudhas, D.; Gosu, V.; Anwar, M.A.; Choi, S. Multiple Roles of Toll-Like Receptor 4 in Colorectal Cancer. Front. Immunol. 2014, 5, 334. [Google Scholar] [CrossRef] [Green Version]
- Simiantonaki, N.; Kurzik-Dumke, U.; Karyofylli, G.; Jayasinghe, C.; Michel-Schmidt, R.; Kirkpatrick, C.J. Reduced expression of TLR4 is associated with the metastatic status of human colorectal cancer. Int. J. Mol. Med. 2007, 20, 21–29. [Google Scholar] [CrossRef] [PubMed] [Green Version]
- Fazio, V.M.; De Robertis, M.; Massi, E.; Poeta, M.L.; Carotti, S.; Morini, S.; Cecchetelli, L.; Signori, E. The AOM/DSS murine model for the study of colon carcinogenesis: From pathways to diagnosis and therapy studies. J. Carcinog. 2011, 10, 9. [Google Scholar] [CrossRef]
- Lu, J.-W.; Ho, Y.-J.; Yang, Y.-J.; Liao, H.-A.; Ciou, S.-C.; Lin, L.-I.; Ou, D.-L. Zebrafish as a disease model for studying human hepatocellular carcinoma. World J. Gastroenterol. 2015, 21, 12042–12058. [Google Scholar] [CrossRef]
- Lu, J.-W.; Ho, Y.-J.; Ciou, S.-C.; Gong, Z. Innovative Disease Model: Zebrafish as an In Vivo Platform for Intestinal Disorder and Tumors. Biomedicines 2017, 5, 58. [Google Scholar] [CrossRef] [PubMed] [Green Version]
- Haramis, A.G.; Hurlstone, A.; Van Der Velden, Y.; Begthel, H.; Born, M.V.D.; Offerhaus, G.J.A.; Clevers, H.C. Adenomatous polyposis coli-deficient zebrafish are susceptible to digestive tract neoplasia. EMBO Rep. 2006, 7, 444–449. [Google Scholar] [CrossRef] [PubMed] [Green Version]
- Le, X.; Langenau, D.M.; Keefe, M.D.; Kutok, J.L.; Neuberg, D.S.; Zon, L.I. Heat shock-inducible Cre/Lox approaches to induce diverse types of tumors and hyperplasia in transgenic zebrafish. Proc. Natl. Acad. Sci. USA 2007, 104, 9410–9415. [Google Scholar] [CrossRef] [PubMed] [Green Version]
- Neal, J.; Peterson, T.S.; Kent, M.L.; Guillemin, K.H. pylori virulence factor CagA increases intestinal cell proliferation by Wnt pathway activation in a transgenic zebrafish model. Dis. Model. Mech. 2013, 6, 802–810. [Google Scholar] [CrossRef] [Green Version]
- Lu, J.W.; Raghuram, D.; Fong, P.A.; Gong, Z. Inducible Intestine-Specific Expression of kras(V12) Triggers Intestinal Tumorigenesis in Transgenic Zebrafish. Neoplasia 2018, 20, 1187–1197. [Google Scholar] [CrossRef] [PubMed]
- Enya, S.; Kawakami, K.; Suzuki, Y.; Kawaoka, S. A novel zebrafish intestinal tumor model reveals a role for cyp7a1-dependent tumor-liver crosstalk in causing adverse effects on the host. Dis. Models Mech. 2018, 11. [Google Scholar] [CrossRef] [Green Version]
- Topi, G.; Satapathy, S.R.; Dash, P.; Fred Mehrabi, S.; Ehrnstrom, R.; Olsson, R.; Lydrup, M.L.; Sjolander, A. Tumour-suppressive effect of oestrogen receptor beta in colorectal cancer patients, colon cancer cells, and a zebrafish model. J. Pathol. 2020, 251, 297–309. [Google Scholar] [CrossRef]
- Fior, R.; Póvoa, V.; Mendes, R.V.; Carvalho, T.; Gomes, A.; Figueiredo, N.; Ferreira, M.G. Single-cell functional and chemosensitive profiling of combinatorial colorectal therapy in zebrafish xenografts. Proc. Natl. Acad. Sci. USA 2017, 114, E8234–E8243. [Google Scholar] [CrossRef] [Green Version]
- De Almeida, C.R.; Mendes, R.V.; Pezzarossa, A.; Gago, J.; Carvalho, C.; Alves, A.; Nunes, V.; Brito, M.J.; Cardoso, M.J.; Ribeiro, J.; et al. Zebrafish xenografts as a fast screening platform for bevacizumab cancer therapy. Commun. Biol. 2020, 3, 299. [Google Scholar] [CrossRef] [PubMed]
- Li, H.; Lu, J.-W.; Huo, X.; Li, Y.; Li, Z.; Gong, Z. Effects of sex hormones on liver tumor progression and regression in Myc/xmrk double oncogene transgenic zebrafish. Gen. Comp. Endocrinol. 2019, 277, 112–121. [Google Scholar] [CrossRef] [PubMed]
- Lu, J.-W.; Hsieh, M.-S.; Hou, H.-A.; Chen, C.-Y.; Tien, H.-F.; Lin, L.-I. Overexpression of SOX4 correlates with poor prognosis of acute myeloid leukemia and is leukemogenic in zebrafish. Blood Cancer J. 2017, 7, e593. [Google Scholar] [CrossRef] [PubMed] [Green Version]
- Lu, J.-W.; Hou, H.-A.; Hsieh, M.-S.; Tien, H.-F.; Lin, L.-I. Overexpression of FLT3-ITD driven by spi-1 results in expanded myelopoiesis with leukemic phenotype in zebrafish. Leukemia 2016, 30, 2098–2101. [Google Scholar] [CrossRef] [PubMed]
- Balch, C.; Ramapuram, J.B.; Tiwari, A.K. The Epigenomics of Embryonic Pathway Signaling in Colorectal Cancer. Front. Pharmacol. 2017, 8, 267. [Google Scholar] [CrossRef] [PubMed] [Green Version]
- Fearon, E.R.; Vogelstein, B. A genetic model for colorectal tumorigenesis. Cell 1990, 61, 759–767. [Google Scholar] [CrossRef]
- Zhao, L.; Yang, R.; Cheng, L.; Wang, M.; Jiang, Y.; Wang, S. LPS-Induced Epithelial-Mesenchymal Transition of Intrahepatic Biliary Epithelial Cells. J. Surg. Res. 2011, 171, 819–825. [Google Scholar] [CrossRef]
- Zhu, G.; Huang, Q.; Huang, Y.; Zheng, W.; Hua, J.; Yang, S.; Zhuang, J.; Wang, J.; Ye, J. Lipopolysaccharide increases the release of VEGF-C that enhances cell motility and promotes lymphangiogenesis and lymphatic metastasis through the TLR4- NF-kappaB/JNK pathways in colorectal cancer. Oncotarget 2016, 7, 73711–73724. [Google Scholar] [CrossRef] [Green Version]
- Liu, W.-T.; Jing, Y.-Y.; Yan, F.; Han, Z.-P.; Lai, F.-B.; Zeng, J.-X.; Yu, G.-F.; Fan, Q.-M.; Li, R.; Zhao, Q.-D.; et al. LPS-induced CXCR4-dependent migratory properties and a mesenchymal-like phenotype of colorectal cancer cells. Cell Adhes. Migr. 2016, 11, 13–23. [Google Scholar] [CrossRef] [Green Version]
- Chassaing, B.; Aitken, J.D.; Malleshappa, M.; Vijay-Kumar, M. Dextran Sulfate Sodium (DSS)-Induced Colitis in Mice. Curr. Protoc. Immunol. 2014, 104, 15.25.1–15.25.14. [Google Scholar] [CrossRef] [PubMed]
- Mizuno, R.; Kawada, K.; Itatani, Y.; Ogawa, R.; Kiyasu, Y.; Sakai, Y. The Role of Tumor-Associated Neutrophils in Colorectal Cancer. Int. J. Mol. Sci. 2019, 20, 529. [Google Scholar] [CrossRef] [PubMed] [Green Version]
- Zhong, X.; Chen, B.; Yang, Z. The Role of Tumor-Associated Macrophages in Colorectal Carcinoma Progression. Cell. Physiol. Biochem. 2018, 45, 356–365. [Google Scholar] [CrossRef] [PubMed]
- Yan, C.; Huo, X.; Wang, S.; Feng, Y.; Gong, Z. Stimulation of hepatocarcinogenesis by neutrophils upon induction of oncogenic kras expression in transgenic zebrafish. J. Hepatol. 2015, 63, 420–428. [Google Scholar] [CrossRef] [PubMed] [Green Version]
- Tytgat, K.M.; Büller, H.A.; Opdam, F.J.; Kim, Y.S.; Einerhand, A.W.; Dekker, J. Biosynthesis of human colonic mucin: Muc2 is the prominent secretory mucin. Gastroenterology 1994, 107, 1352–1363. [Google Scholar] [CrossRef]
- Pelaseyed, T.; Bergström, J.H.; Gustafsson, J.K.; Ermund, A.; Birchenough, G.M.H.; Schütte, A.; van der Post, S.; Svensson, F.; Rodríguez-Piñeiro, A.M.; Nyström, E.E.L.; et al. The mucus and mucins of the goblet cells and enterocytes provide the first defense line of the gastrointestinal tract and interact with the immune system. Immunol. Rev. 2014, 260, 8–20. [Google Scholar] [CrossRef] [Green Version]
- Li, G.; Yang, S.; Shen, P.; Wu, B.; Sun, T.; Sun, H.; Ji, F.; Zhou, D. SCF/c-KIT signaling promotes mucus secretion of colonic goblet cells and development of mucinous colorectal adenocarcinoma. Am. J. Cancer Res. 2018, 8, 1064–1073. [Google Scholar]
- Miller, S.A.; Ghobashi, A.H.; O’Hagan, H.M. Consensus molecular subtyping of colorectal cancers is influenced by goblet cell content. Cancer Genet. 2021, 254–255, 34–39. [Google Scholar] [CrossRef] [PubMed]
- Kim, Y.S.; Ho, S.B. Intestinal Goblet Cells and Mucins in Health and Disease: Recent Insights and Progress. Curr. Gastroenterol. Rep. 2010, 12, 319–330. [Google Scholar] [CrossRef] [Green Version]
- Yu, L.C.-H.; Flynn, A.N.; Turner, J.R.; Buret, A.G. SGLT-1-mediated glucose uptake protects intestinal epithelial cells against LPS-induced apoptosis and barrier defects: A novel cellular rescue mechanism? FASEB J. 2005, 19, 1822–1835. [Google Scholar] [CrossRef] [Green Version]
- Forsythe, R.M.; Xu, D.; Lu, Q.; Deitch, E.A. Lipopolysaccharide-Induced Enterocyte-Derived Nitric Oxide Induces Intestinal Monolayer Permeability in an Autocrine Fashion. Shock 2002, 17, 180–184. [Google Scholar] [CrossRef]
- Liu, C.; Li, A.; Weng, Y.B.; Duan, M.L.; Wang, B.E.; Zhang, S.W. Changes in intestinal mucosal immune barrier in rats with endotoxemia. World J. Gastroenterol. 2009, 15, 5843–5850. [Google Scholar] [CrossRef]
- Franke, T.F.; Hornik, C.P.; Segev, L.; Shostak, G.A.; Sugimoto, C. PI3K/Akt and apoptosis: Size matters. Oncogene 2003, 22, 8983–8998. [Google Scholar] [CrossRef] [PubMed] [Green Version]
- Lu, J.-W.; Liao, C.-Y.; Yang, W.-Y.; Lin, Y.-M.; Jin, S.-L.C.; Wang, H.-D.; Yuh, C.-H. Overexpression of Endothelin 1 Triggers Hepatocarcinogenesis in Zebrafish and Promotes Cell Proliferation and Migration through the AKT Pathway. PLoS ONE 2014, 9, e85318. [Google Scholar] [CrossRef] [Green Version]
- Somanath, P.R.; Razorenova, O.V.; Chen, J.; Byzova, T.V. Akt1 in endothelial cell and angiogenesis. Cell Cycle 2006, 5, 512–518. [Google Scholar] [CrossRef] [Green Version]
- Coloff, J.L.; Rathmell, J.C. Metabolic regulation of Akt: Roles reversed. J. Cell Biol. 2006, 175, 845–847. [Google Scholar] [CrossRef] [Green Version]
- Munkholm, P. Review article: The incidence and prevalence of colorectal cancer in inflammatory bowel disease. Aliment. Pharmacol. Ther. 2003, 18, 1–5. [Google Scholar] [CrossRef] [PubMed]
- Van Der Woude, C.J.; Kleibeuker, J.H.; Jansen, P.L.M.; Moshage, H. Chronic inflammation, apoptosis and (pre-)malignant lesions in the gastro-intestinal tract. Apoptosis 2004, 9, 123–130. [Google Scholar] [CrossRef]
- Seril, D.N.; Liao, J.; Yang, G.-Y.; Yang, C.S. Oxidative stress and ulcerative colitis-associated carcinogenesis: Studies in humans and animal models. Carcinogenesis 2003, 24, 353–362. [Google Scholar] [CrossRef] [Green Version]
- Okayasu, I.; Hatakeyama, S.; Yamada, M.; Ohkusa, T.; Inagaki, Y.; Nakaya, R. A novel method in the induction of reliable experimental acute and chronic ulcerative colitis in mice. Gastroenterology 1990, 98, 694–702. [Google Scholar] [CrossRef]
- Oehlers, S.; Flores, M.V.; Hall, C.; Okuda, K.S.; Sison, J.O.; Crosier, K.E.; Crosier, P.S. Chemically Induced Intestinal Damage Models in Zebrafish Larvae. Zebrafish 2013, 10, 184–193. [Google Scholar] [CrossRef] [PubMed]
- Parang, B.; Barrett, C.W.; Williams, C.S. AOM/DSS Model of Colitis-Associated Cancer. Methods Mol. Biol. 2016, 1422, 297–307. [Google Scholar] [CrossRef] [PubMed] [Green Version]
- Jin, B.-R.; Chung, K.-S.; Lee, M.; An, H.-J. High-Fat Diet Propelled AOM/DSS-Induced Colitis-Associated Colon Cancer Alleviated by Administration of Aster glehni via STAT3 Signaling Pathway. Biology 2020, 9, 24. [Google Scholar] [CrossRef] [PubMed] [Green Version]
- Tanaka, T.; Kohno, H.; Suzuki, R.; Hata, K.; Sugie, S.; Niho, N.; Sakano, K.; Takahashi, M.; Wakabayashi, K. Dextran sodium sulfate strongly promotes colorectal carcinogenesis inApcMin/+ mice: Inflammatory stimuli by dextran sodium sulfate results in development of multiple colonic neoplasms. Int. J. Cancer 2005, 118, 25–34. [Google Scholar] [CrossRef]
- Cooper, H.S.; Everley, L.; Chang, W.; Pfeiffer, G.; Lee, B.; Murthy, S.; Clapper, M.L. The role of mutant Apc in the development of dysplasia and cancer in the mouse model of dextran sulfate sodium-induced colitis. Gastroenterology 2001, 121, 1407–1416. [Google Scholar] [CrossRef] [PubMed]
- Dubois, R.N. Role of Inflammation and Inflammatory Mediators in Colorectal Cancer. Trans. Am. Clin. Clim. Assoc. 2014, 125, 358–373. [Google Scholar]
- Park, C.H.; Eun, C.S.; Han, D.S. Intestinal microbiota, chronic inflammation, and colorectal cancer. Intest. Res. 2018, 16, 338–345. [Google Scholar] [CrossRef] [Green Version]


Publisher’s Note: MDPI stays neutral with regard to jurisdictional claims in published maps and institutional affiliations. |
© 2021 by the authors. Licensee MDPI, Basel, Switzerland. This article is an open access article distributed under the terms and conditions of the Creative Commons Attribution (CC BY) license (https://creativecommons.org/licenses/by/4.0/).
Share and Cite
Lu, J.-W.; Sun, Y.; Fong, P.-S.A.; Lin, L.-I.; Liu, D.; Gong, Z. Lipopolysaccharides Enhance Epithelial Hyperplasia and Tubular Adenoma in Intestine-Specific Expression of krasV12 in Transgenic Zebrafish. Biomedicines 2021, 9, 974. https://doi.org/10.3390/biomedicines9080974
Lu J-W, Sun Y, Fong P-SA, Lin L-I, Liu D, Gong Z. Lipopolysaccharides Enhance Epithelial Hyperplasia and Tubular Adenoma in Intestine-Specific Expression of krasV12 in Transgenic Zebrafish. Biomedicines. 2021; 9(8):974. https://doi.org/10.3390/biomedicines9080974
Chicago/Turabian StyleLu, Jeng-Wei, Yuxi Sun, Pei-Shi Angelina Fong, Liang-In Lin, Dong Liu, and Zhiyuan Gong. 2021. "Lipopolysaccharides Enhance Epithelial Hyperplasia and Tubular Adenoma in Intestine-Specific Expression of krasV12 in Transgenic Zebrafish" Biomedicines 9, no. 8: 974. https://doi.org/10.3390/biomedicines9080974