
Synergistic AHR Binding Pathway with EMT Effects on Serous Ovarian Tumors Recognized by Multidisciplinary Integrated Analysis

 ,
,  , , and
Abstract
:1. Introduction
2. Materials and Methods
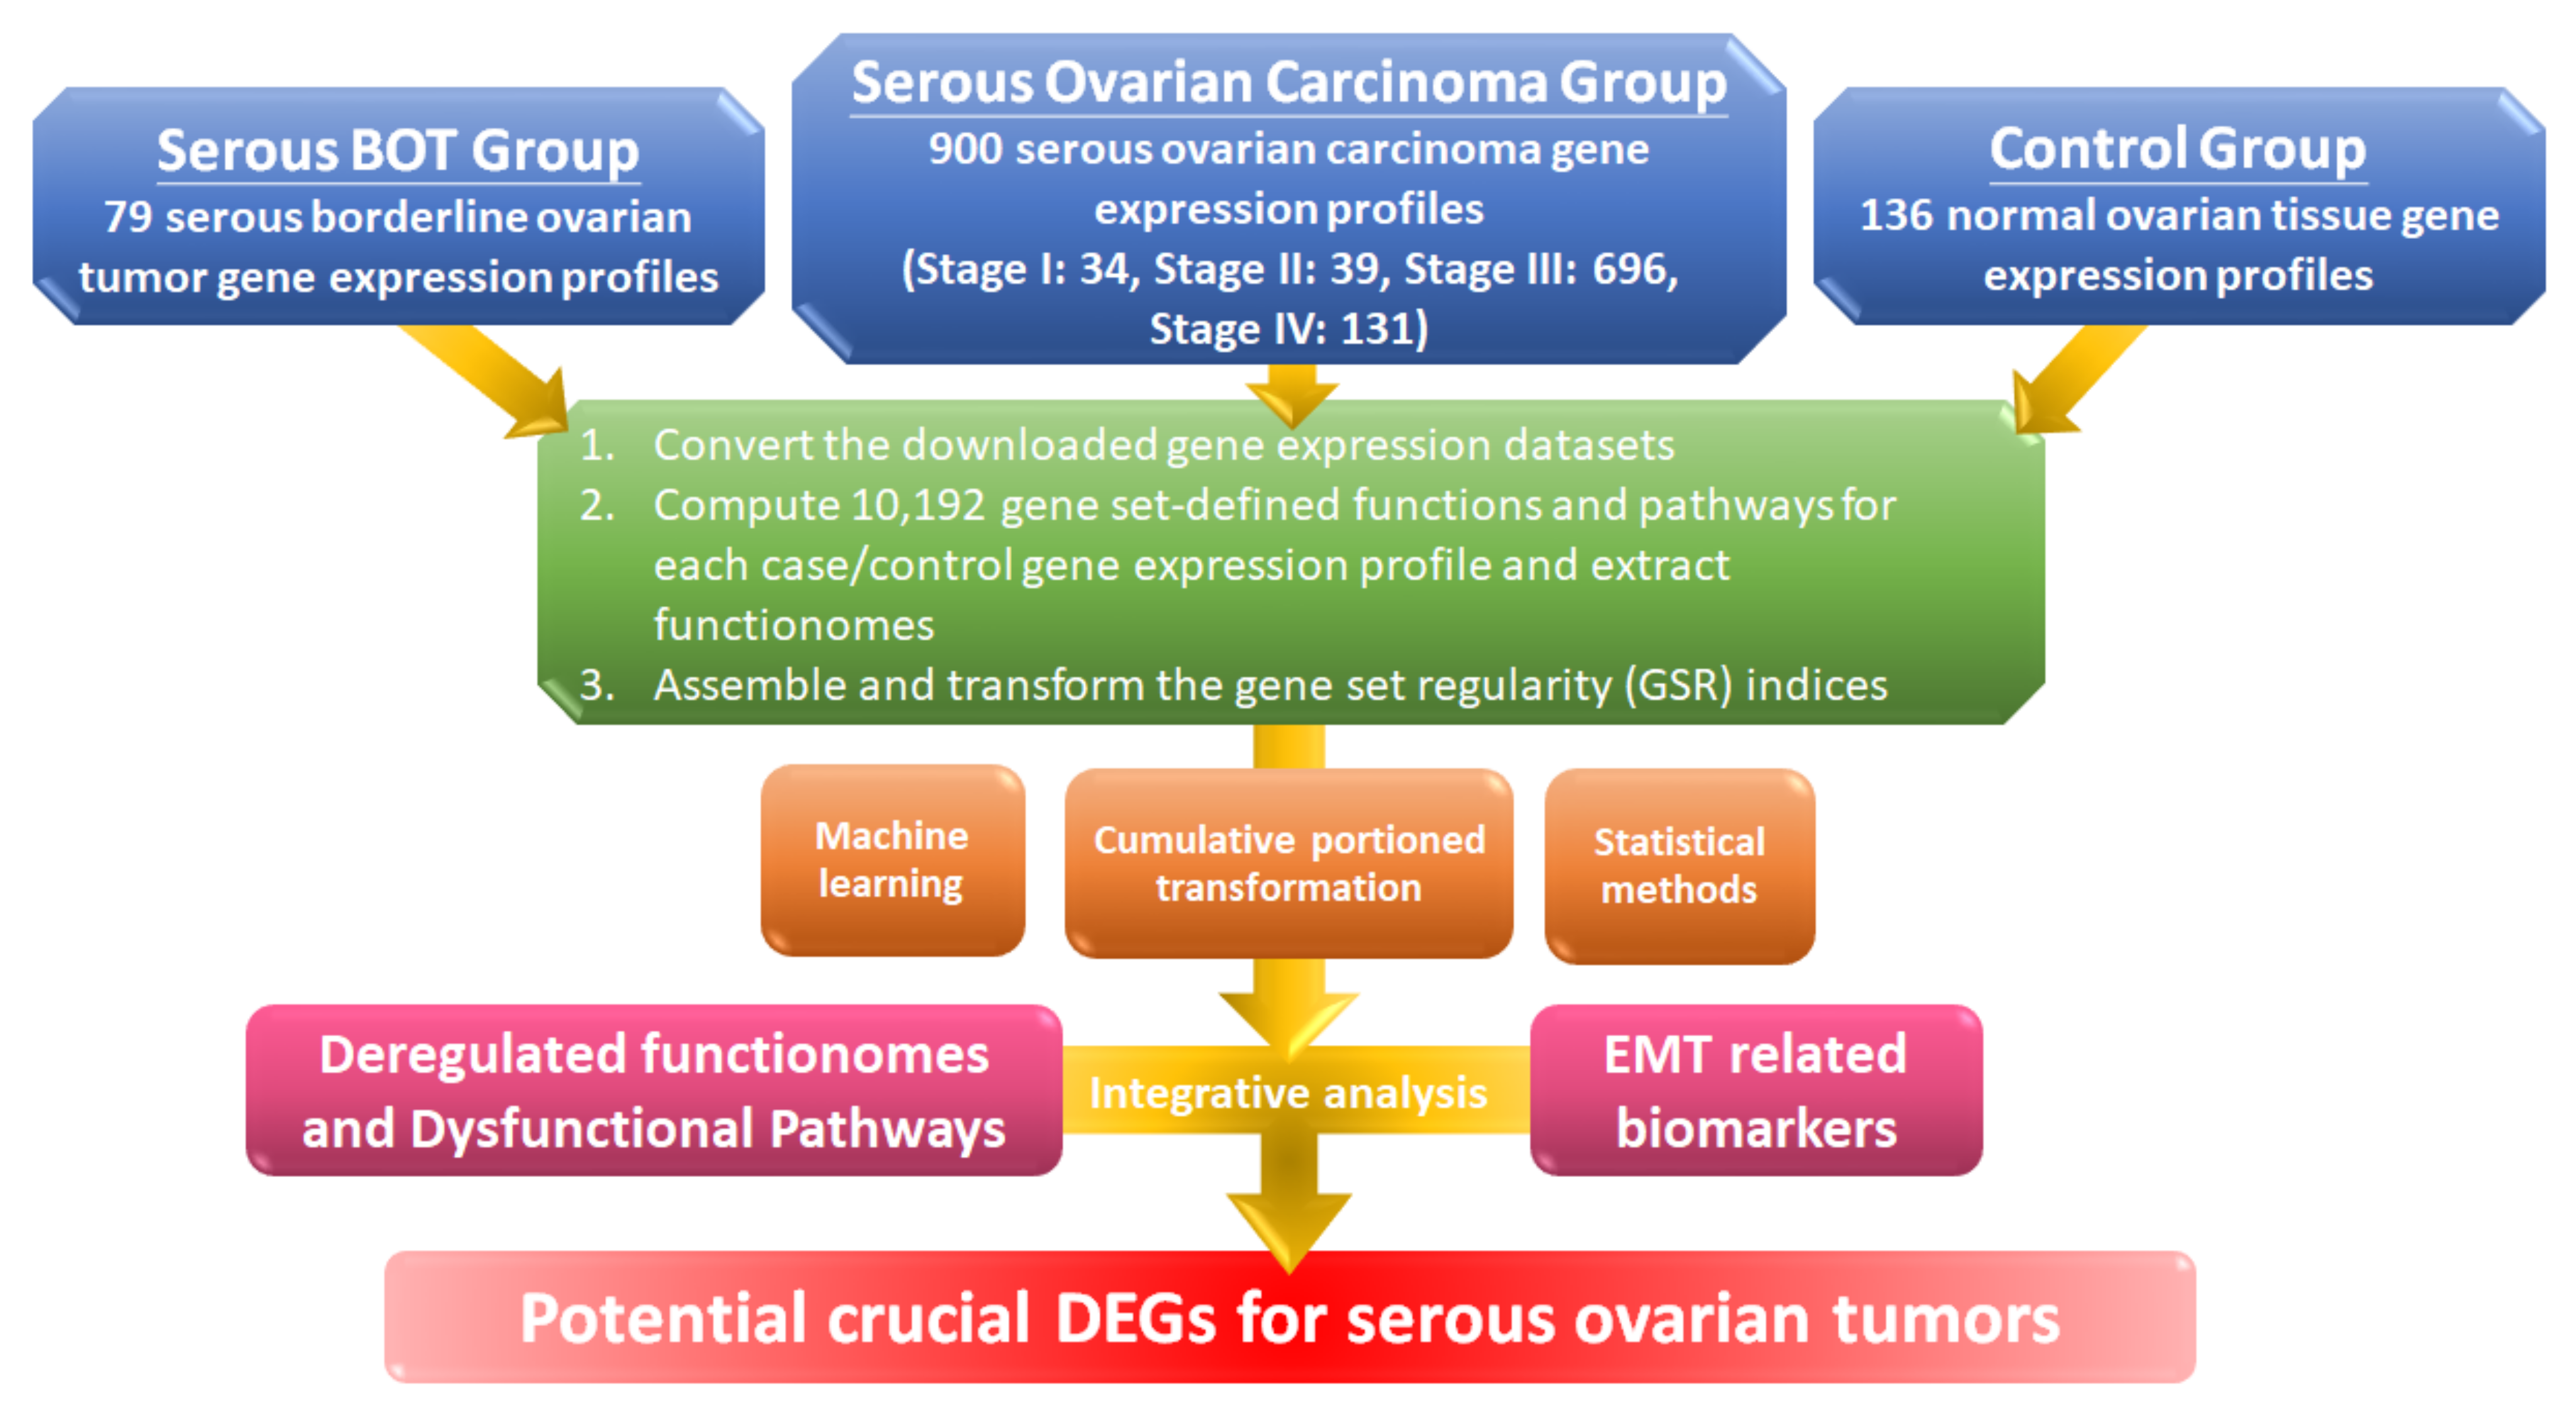
2.1. Workflow for the Integrative Analytic Model
2.2. Microarray Dataset Collections and the Selection Criteria
2.3. Computing the GSR Indices and Rebuilding the Functionomes
2.4. Statistical Analysis
2.5. Classification and Prediction by Machine Learning with Set Analysis
2.6. Verification of Clinical Samples Using Immunohistochemical (IHC) Staining Method
3. Results
3.1. Microarrays of Sample Groups for Gene Expression Profiles and Definition for Gene Set Analysis
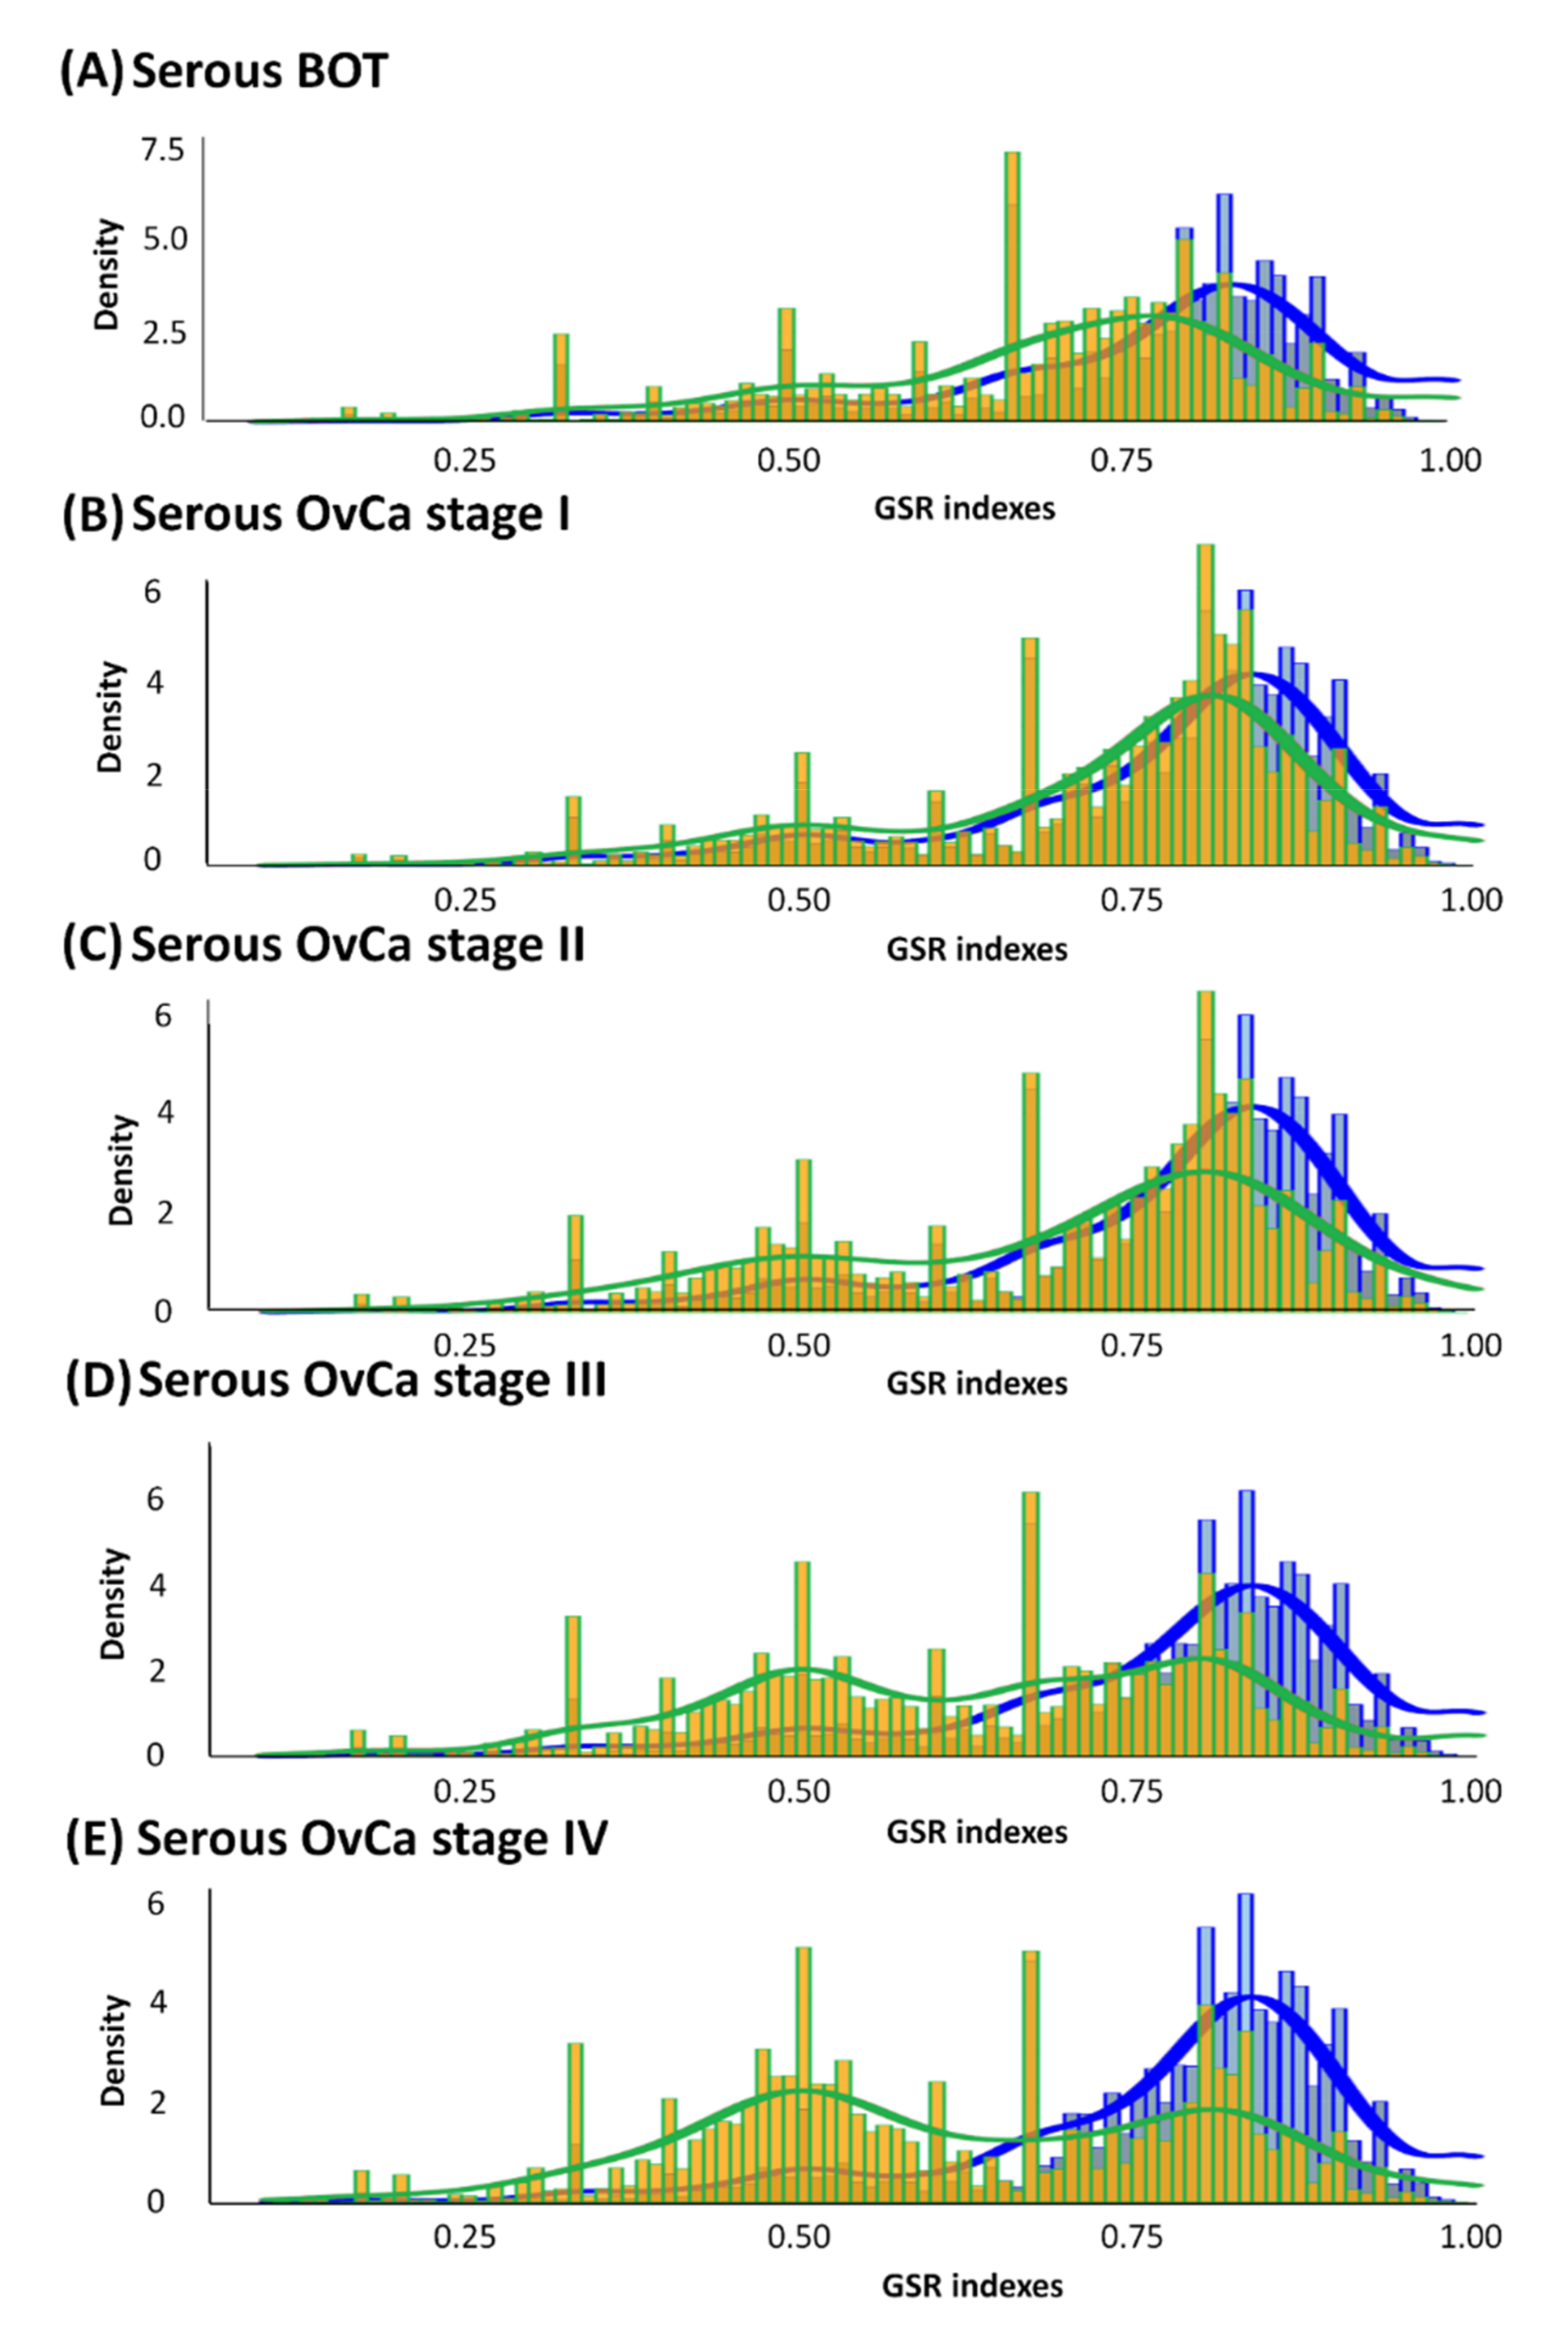
3.2. Histograms of GSR Indices of Functionomes among Each Group with Diverse Differences
3.3. Regularity Patterns of Functionomes Classified and Predicted by Supervised Machine Learning with High Sensitivity, Specificity, and Accuracy
3.4. The Most Dysregulated and Common GO Terms among Serous Ovarian Tumors
3.5. Three Reclassified Categories of the Top 25 Common Dysregulated GO Terms and the Most Relevant Corresponding DEGs
3.6. The Significant Common Dysfunctional GO-Defined Pathways and Corresponding DEGs
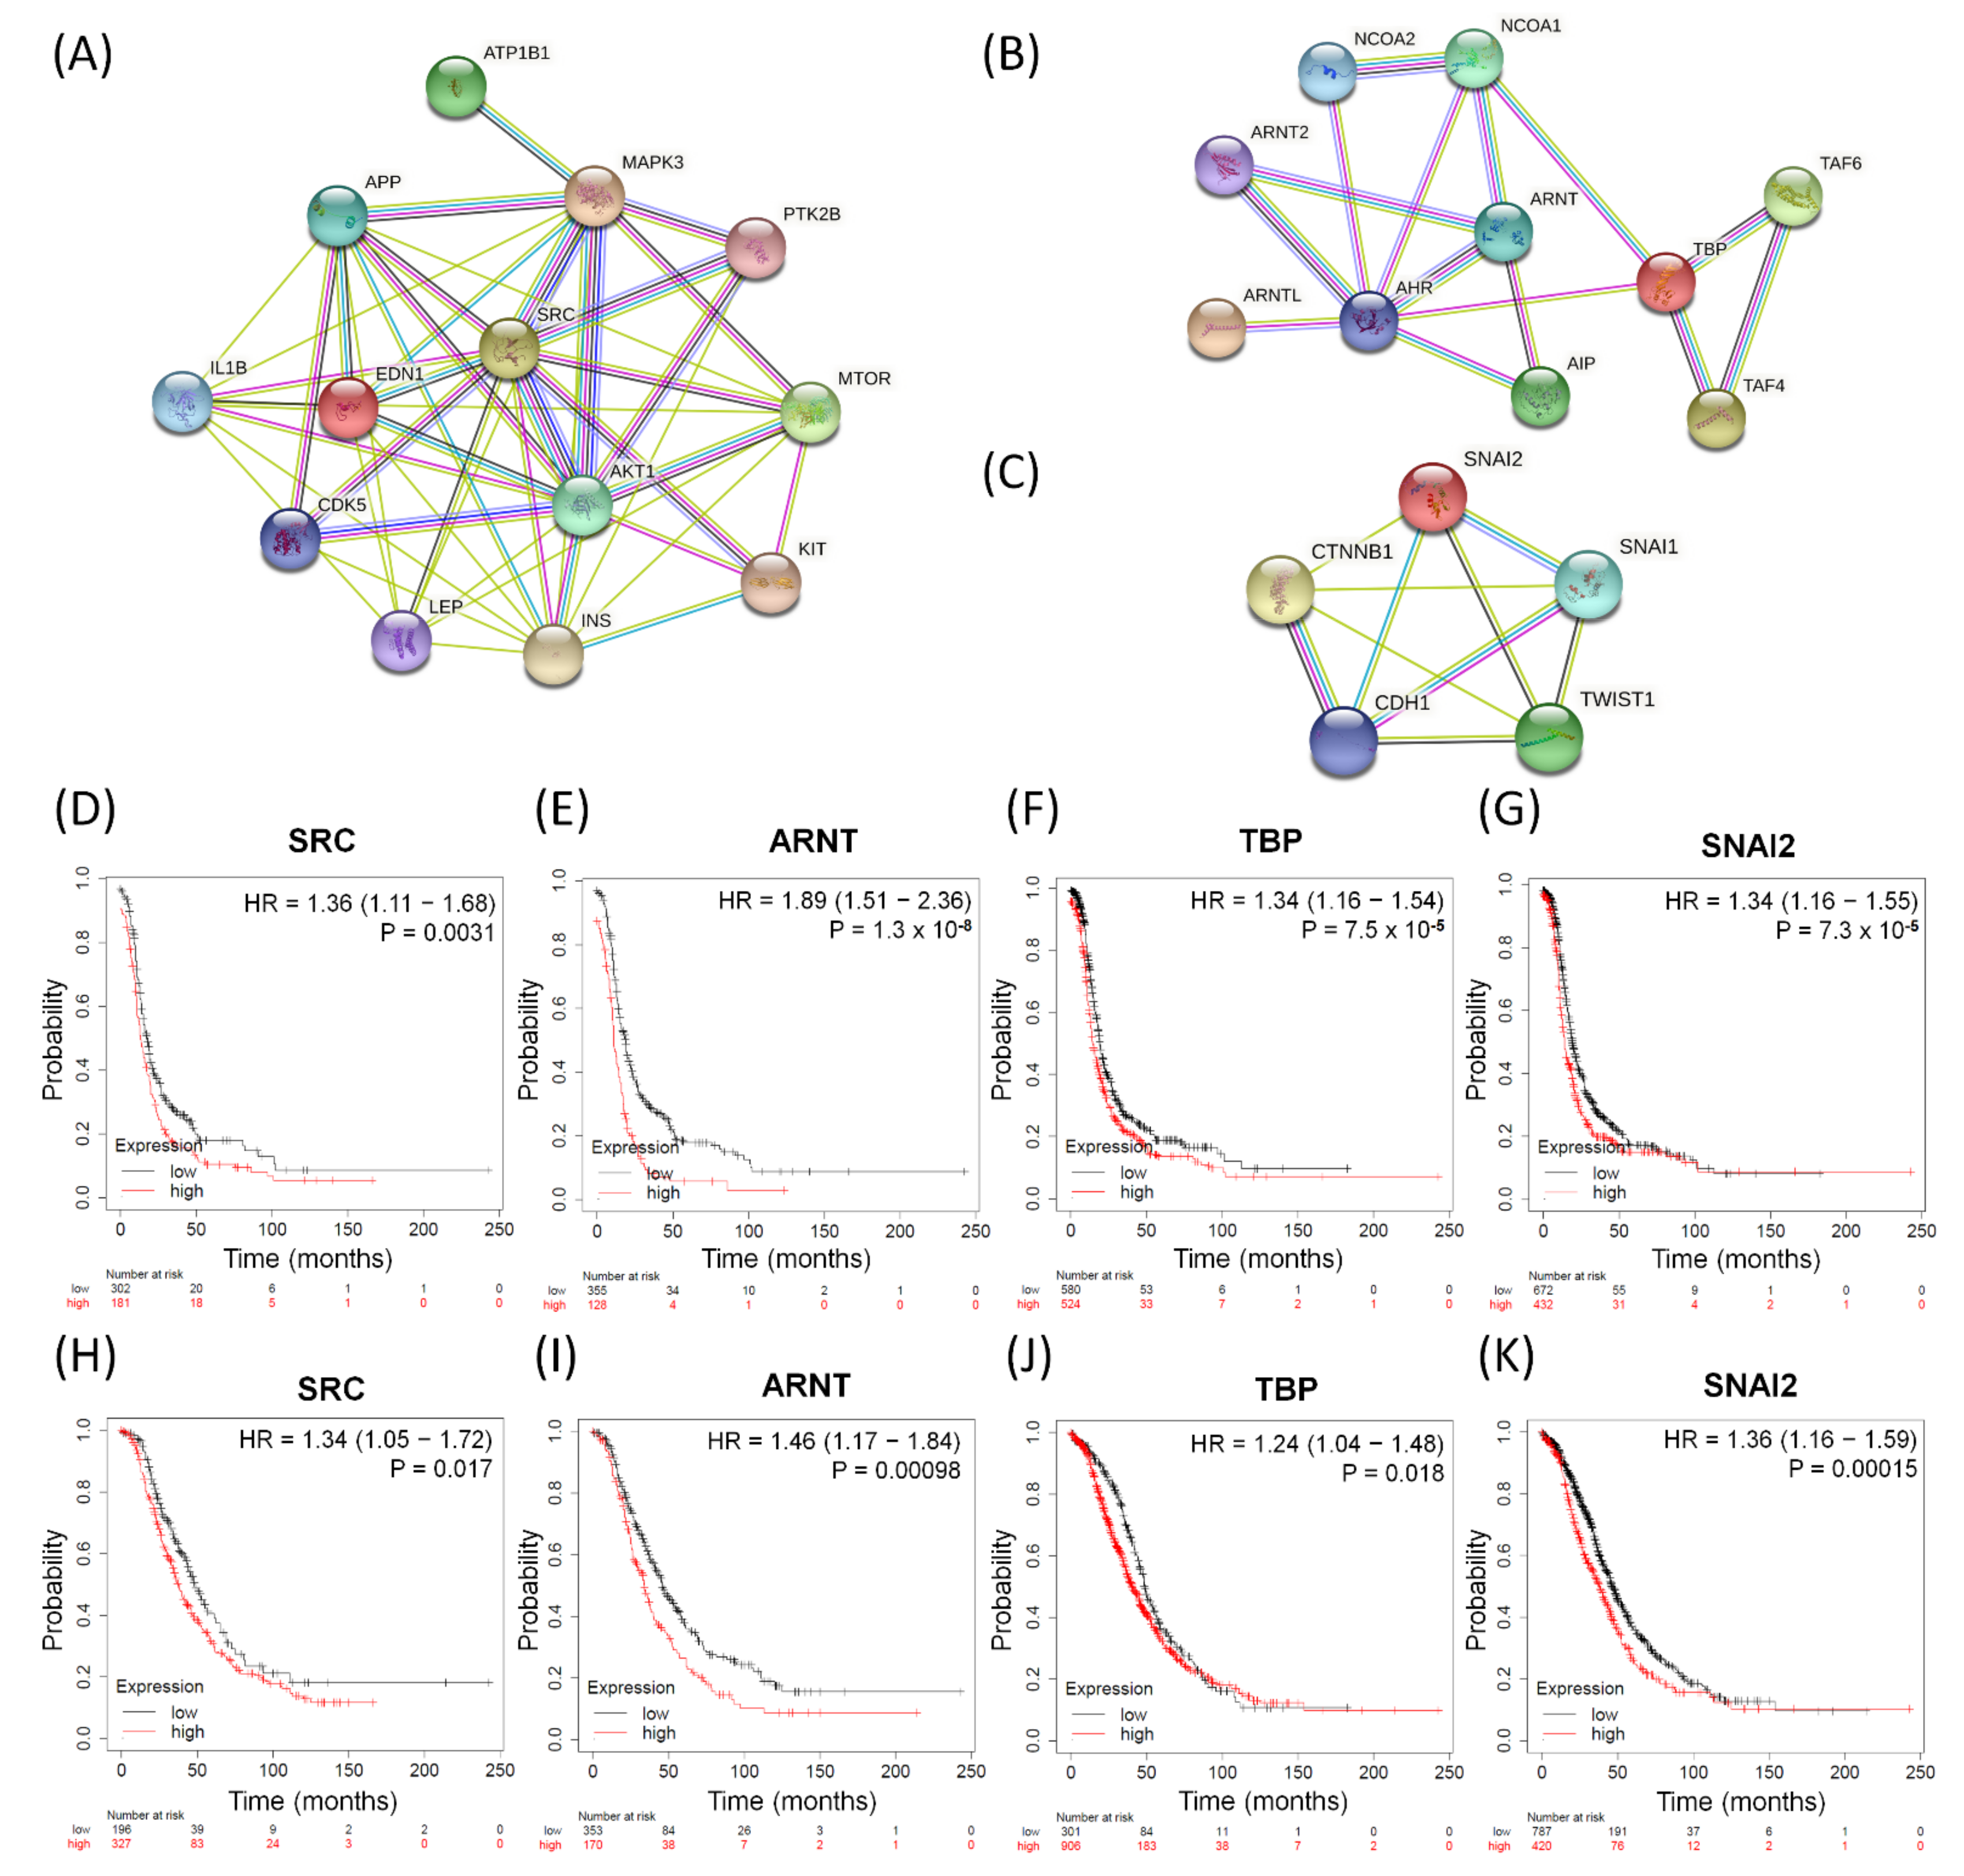
3.7. The Influences of Distinct Valuable DEGs with Corresponding Biomarkers Expressed in Serous Ovarian Tumors
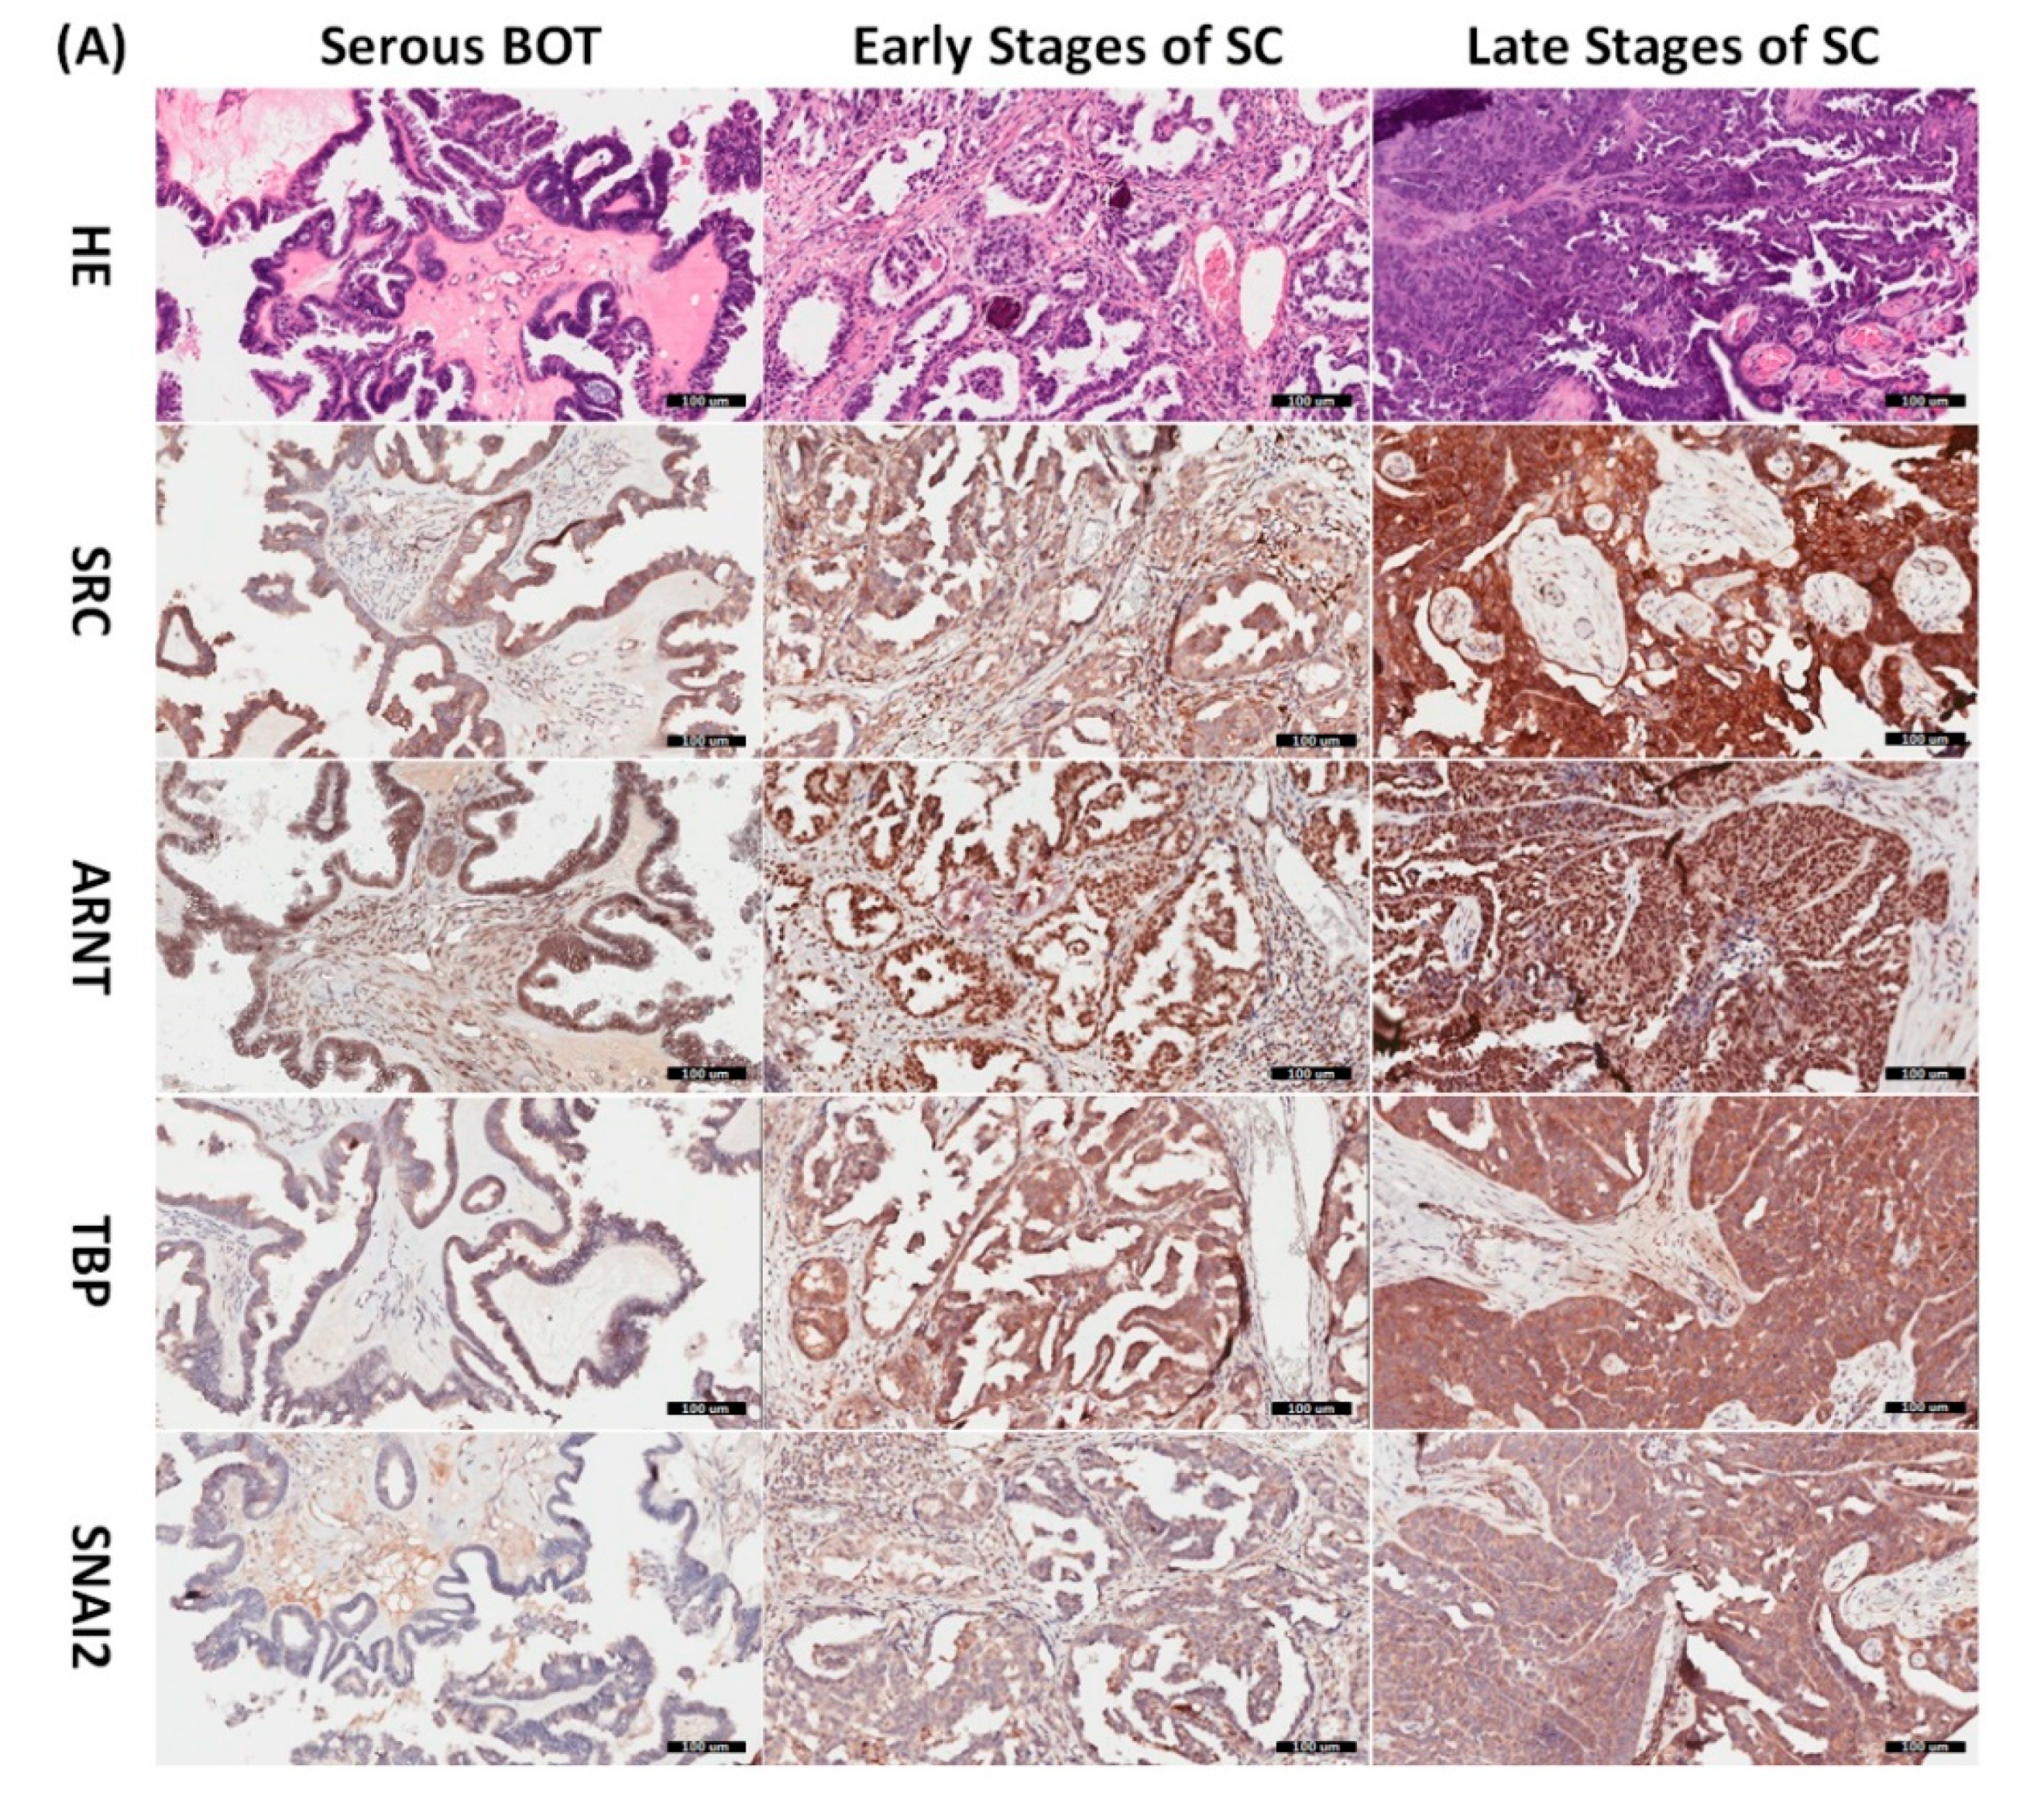
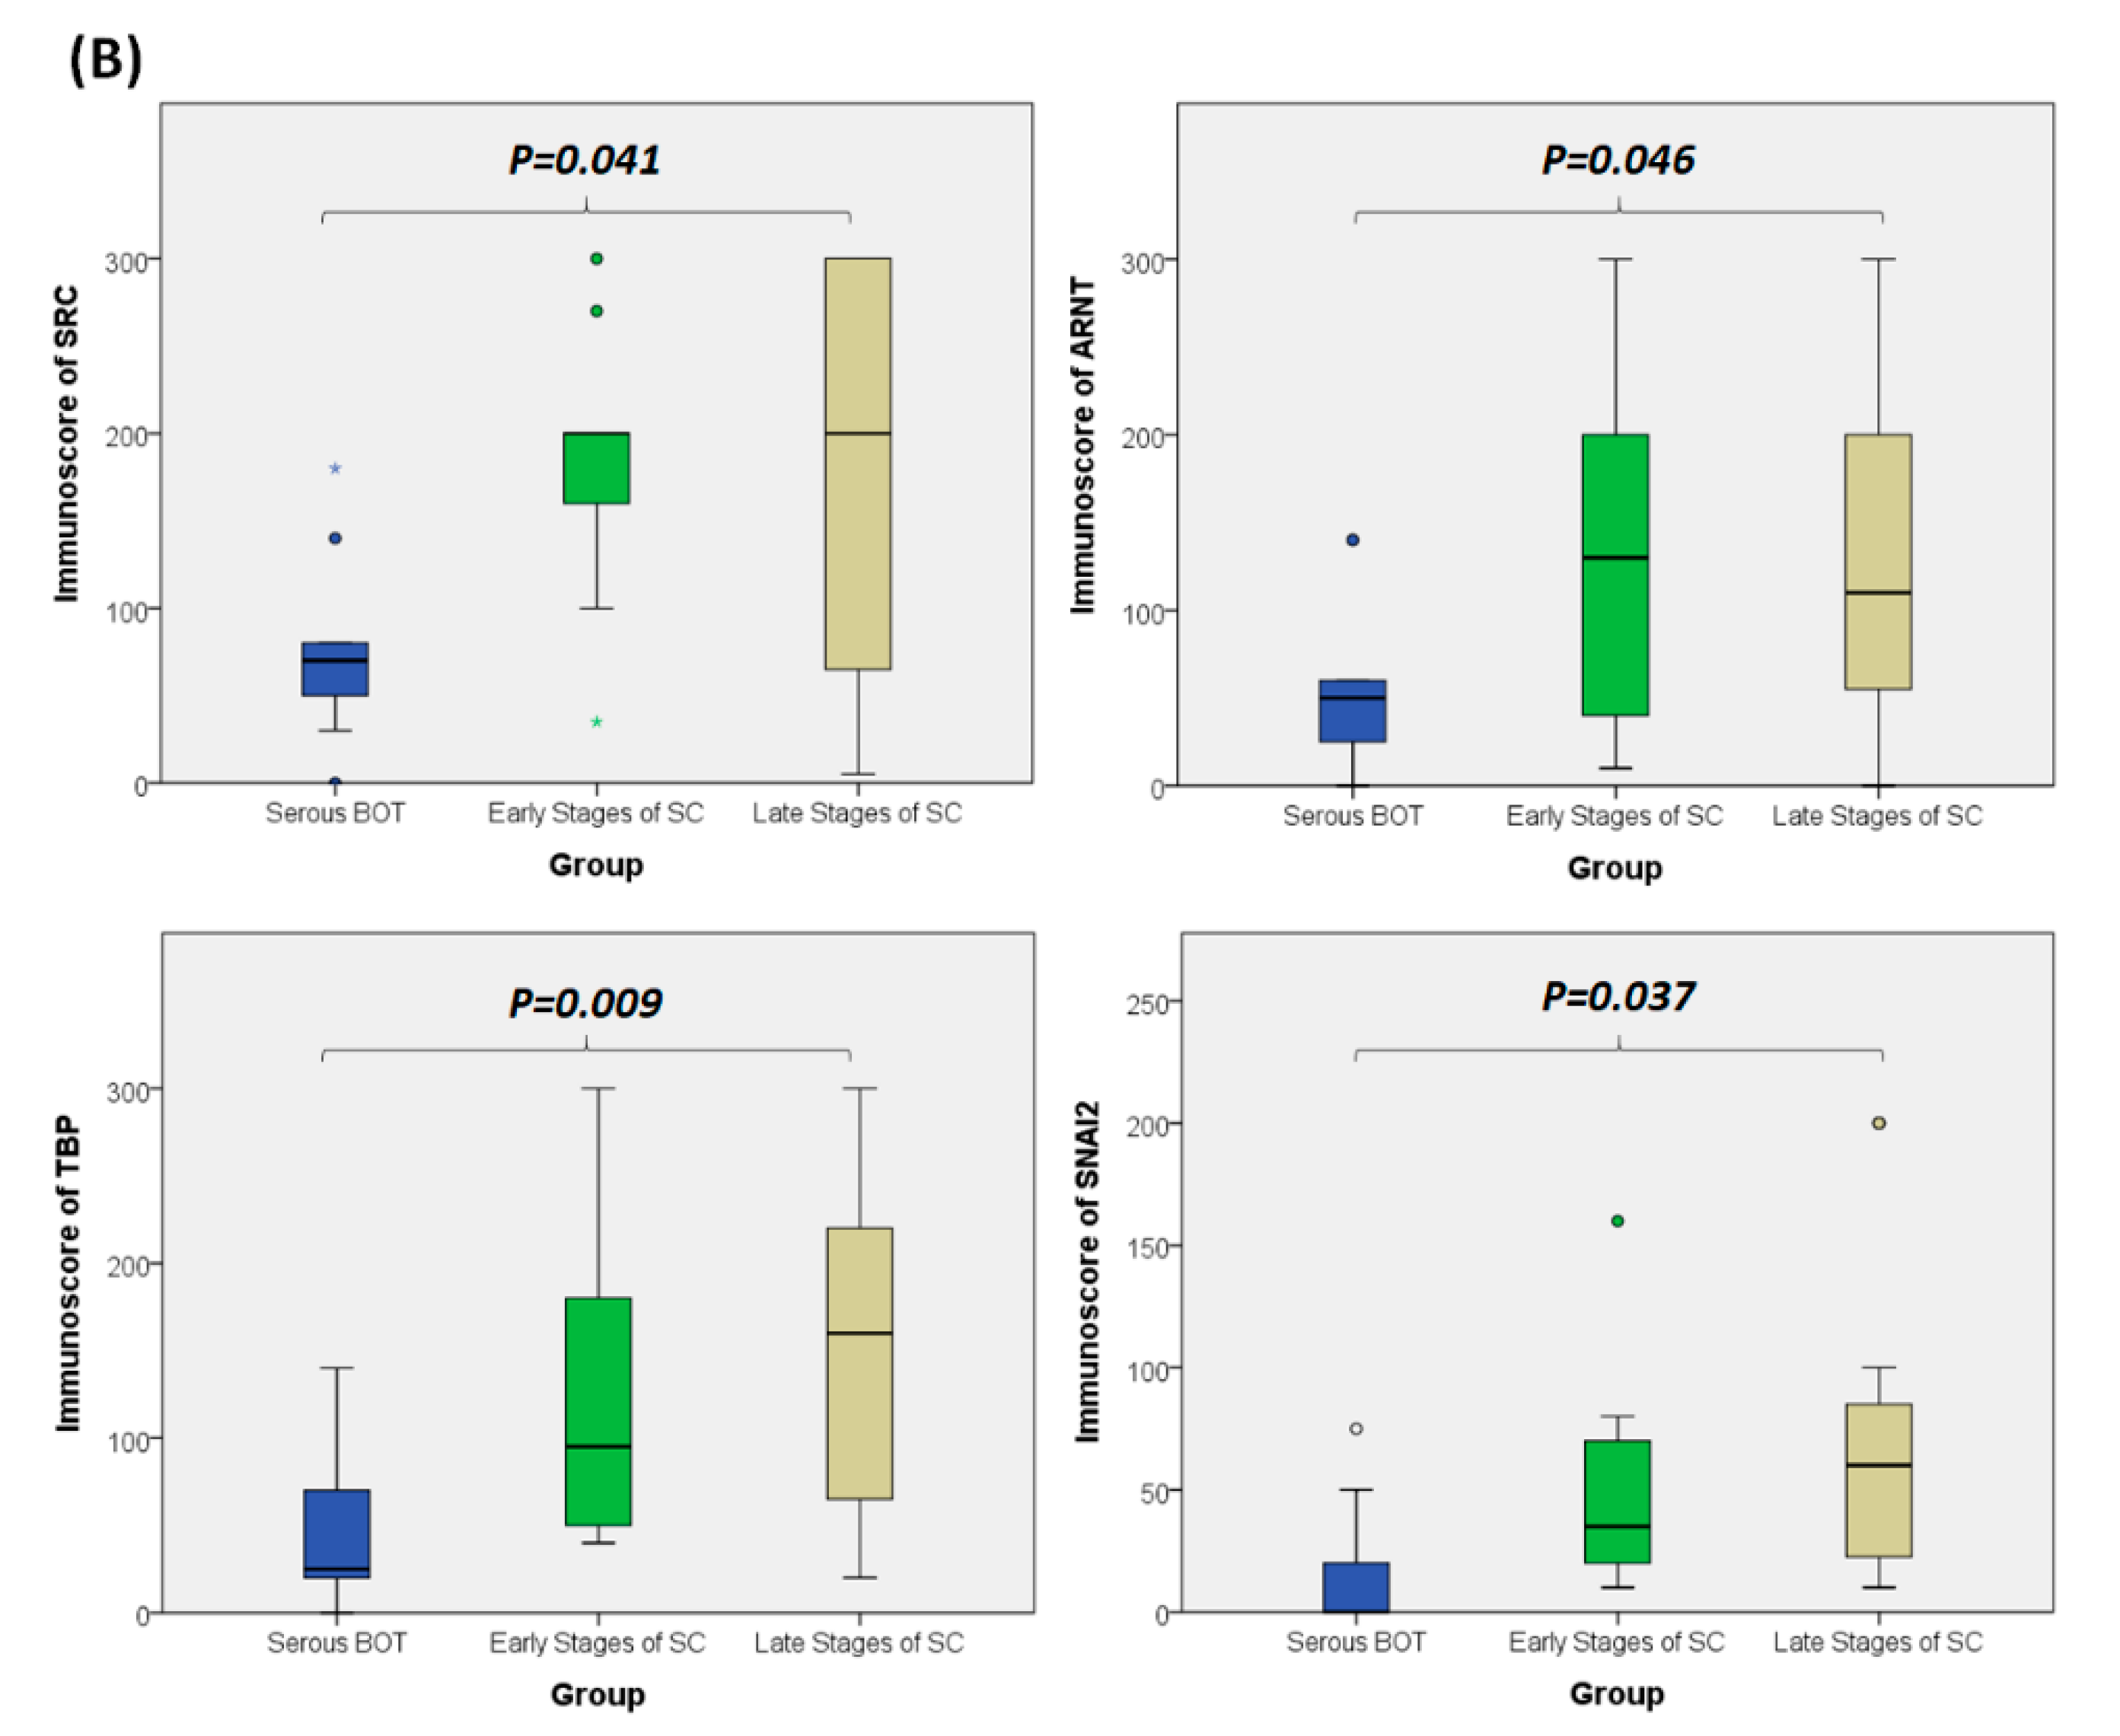
3.8. Immunohistochemical Validation of Expression Levels for SRC, ARNT, TBP, and SNAI2 among Serous Ovarian Tumors
4. Discussion
5. Conclusions
Supplementary Materials
Author Contributions
Funding
Institutional Review Board Statement
Informed Consent Statement
Data Availability Statement
Acknowledgments
Conflicts of Interest
References
- Russell, P. The pathological assessment of ovarian neoplasms. I: Introduction to the common ‘epithelial’tumours and analysis of benign ‘epithelial’tumours. Pathology 1979, 11, 5–26. [Google Scholar] [CrossRef] [PubMed]
- Iwabuchi, H.; Sakamoto, M.; Sakunaga, H.; Ma, Y.-Y.; Carcangiu, M.L.; Pinkel, D.; Yang-Feng, T.L.; Gray, J.W. Genetic analysis of benign, low-grade, and high-grade ovarian tumors. Cancer Res. 1995, 55, 6172–6180. [Google Scholar]
- Allemani, C.; Weir, H.K.; Carreira, H.; Harewood, R.; Spika, D.; Wang, X.-S.; Bannon, F.; Ahn, J.V.; Johnson, C.J. Bonaventure, A. Global surveillance of cancer survival 1995–2009: Analysis of individual data for 25,676,887 patients from 279 population-based registries in 67 countries (CONCORD-2). Lancet 2015, 385, 977–1010. [Google Scholar] [CrossRef] [Green Version]
- Runnebaum, I.B.; Stickeler, E. Epidemiological and molecular aspects of ovarian cancer risk. J. Cancer Res. Clin. Oncol. 2001, 127, 73–79. [Google Scholar] [CrossRef]
- Karnezis, A.N.; Cho, K.R.; Gilks, C.B.; Pearce, C.L.; Huntsman, D.G. The disparate origins of ovarian cancers: Pathogenesis and prevention strategies. Nat. Rev. Cancer 2017, 17, 65. [Google Scholar] [CrossRef] [PubMed]
- Jayson, G.C.; Kohn, E.C.; Kitchener, H.C.; Ledermann, J.A. Ovarian cancer. Lancet 2014, 384, 1376–1388. [Google Scholar] [CrossRef]
- Vargas, A.N. Natural history of ovarian cancer. Ecancermedicalscience 2014, 8, 1–10. [Google Scholar]
- Chien, J.; Poole, E.M. Ovarian cancer prevention, screening, and early detection: Report from the 11th biennial ovarian cancer research symposium. Int. J. Gynecol. Cancer 2017, 27. [Google Scholar] [CrossRef]
- Santillan, A.; Kim, Y.; Zahurak, M.; Gardner, G.; Giuntoli, R.; Shih, I.; Bristow, R. Differences of chemoresistance assay between invasive micropapillary/low-grade serous ovarian carcinoma and high-grade serous ovarian carcinoma. Int. J. Gynecol. Cancer 2007, 17, 601–606. [Google Scholar] [CrossRef]
- Song, T.; Lee, Y.-Y.; Choi, C.H.; Kim, T.-J.; Lee, J.-W.; Bae, D.-S.; Kim, B.-G. Histologic distribution of borderline ovarian tumors worldwide: A systematic review. J. Gynecol. Oncol. 2013, 24, 44–51. [Google Scholar] [CrossRef] [Green Version]
- Yasmeen, S.; Hannan, A.; Sheikh, F.; Syed, A.A.; Siddiqui, N. Borderline tumors of the ovary: A clinicopathological study. Pak. J. Med Sci. 2017, 33, 369. [Google Scholar] [CrossRef]
- Silverberg, S.G.; Bell, D.A.; Kurman, R.J.; Seidman, J.D.; Prat, J.; Ronnett, B.M.; Copeland, L.; Silva, E.; Gorstein, F.; Young, R.H. Borderline ovarian tumors: Key points and workshop summary. Hum. Pathol. 2004, 35, 910–917. [Google Scholar] [CrossRef]
- Hauptmann, S.; Friedrich, K.; Redline, R.; Avril, S. Ovarian borderline tumors in the 2014 WHO classification: Evolving concepts and diagnostic criteria. Virchows Arch. 2017, 470, 125–142. [Google Scholar] [CrossRef] [PubMed] [Green Version]
- Sun, Y.; Xu, J.; Jia, X. The Diagnosis, Treatment, Prognosis and Molecular Pathology of Borderline Ovarian Tumors: Current Status and Perspectives. Cancer Manag. Res. 2020, 12, 3651–3659. [Google Scholar] [CrossRef] [PubMed]
- Lalwani, N.; Shanbhogue, A.K.; Vikram, R.; Nagar, A.; Jagirdar, J.; Prasad, S.R. Current update on borderline ovarian neoplasms. Am. J. Roentgenol. 2010, 194, 330–336. [Google Scholar] [CrossRef] [PubMed]
- Trillsch, F.; Mahner, S.; Ruetzel, J.; Harter, P.; Ewald-Riegler, N.; Jaenicke, F.; Du Bois, A. Clinical management of borderline ovarian tumors. Expert Rev. Anticancer Ther. 2010, 10, 1115–1124. [Google Scholar] [CrossRef] [PubMed]
- Fathalla, M. Incessant ovulation—A factor in ovarian neoplasia. Lancet 1971, 2, 163. [Google Scholar] [CrossRef]
- Van Leeuwen, F.; Klip, H.; Mooij, T.M.; Van De Swaluw, A.; Lambalk, C.B.; Kortman, M.; Laven, J.; Jansen, C.; Helmerhorst, F.; Cohlen, B. Risk of borderline and invasive ovarian tumours after ovarian stimulation for in vitro fertilization in a large Dutch cohort. Hum. Reprod. 2011, 26, 3456–3465. [Google Scholar] [CrossRef]
- Riman, T.; Dickman, P.W.; Nilsson, S.; Correia, N.; Nordlinder, H.; Magnusson, C.M.; Persson, I.R. Risk factors for epithelial borderline ovarian tumors: Results of a Swedish case–control study. Gynecol. Oncol. 2001, 83, 575–585. [Google Scholar] [CrossRef] [PubMed] [Green Version]
- Mayr, D.; Hirschmann, A.; Löhrs, U.; Diebold, J. KRAS and BRAF mutations in ovarian tumors: A comprehensive study of invasive carcinomas, borderline tumors and extraovarian implants. Gynecol. Oncol. 2006, 103, 883–887. [Google Scholar] [CrossRef] [PubMed]
- Ho, C.-L.; Kurman, R.J.; Dehari, R.; Wang, T.-L.; Shih, I.-M. Mutations of BRAF and KRAS precede the development of ovarian serous borderline tumors. Cancer Res. 2004, 64, 6915–6918. [Google Scholar] [CrossRef] [Green Version]
- Anglesio, M.S.; Arnold, J.M.; George, J.; Tinker, A.V.; Tothill, R.; Waddell, N.; Simms, L.; Locandro, B.; Fereday, S.; Traficante, N. Mutation of ERBB2 provides a novel alternative mechanism for the ubiquitous activation of RAS-MAPK in ovarian serous low malignant potential tumors. Mol. Cancer Res. 2008, 6, 1678–1690. [Google Scholar] [CrossRef] [PubMed] [Green Version]
- El-Balat, A.; Schmeil, I.; Gasimli, K.; Sänger, N.; Karn, T.; Ahr, A.; Becker, S.; Arsenic, R.; Holtrich, U.; Engels, K. Claudin-1 is linked to presence of implants and micropapillary pattern in serous borderline epithelial tumours of the ovary. J. Clin. Pathol. 2018, 71, 1060–1064. [Google Scholar] [CrossRef]
- Malpica, A.; Wong, K.-K. The molecular pathology of ovarian serous borderline tumors. Ann. Oncol. 2016, 27 (Suppl. S1), i16–i19. [Google Scholar] [CrossRef] [PubMed]
- Ozretić, P.; Trnski, D.; Musani, V.; Maurac, I.; Kalafatić, D.; Orešković, S.; Levanat, S.; Sabol, M. Non-canonical Hedgehog signaling activation in ovarian borderline tumors and ovarian carcinomas. Int. J. Oncol. 2017, 51, 1869–1877. [Google Scholar] [CrossRef] [Green Version]
- Hirst, J.; Crow, J.; Godwin, A. Ovarian cancer genetics: Subtypes and risk factors. In Ovarian Cancer—From Pathogenesis to Treatment; Devaja, O., Ed.; IntechOpen: London, UK, 2018. [Google Scholar]
- Verhaak, R.G.; Tamayo, P.; Yang, J.-Y.; Hubbard, D.; Zhang, H.; Creighton, C.J.; Fereday, S.; Lawrence, M.; Carter, S.L.; Mermel, C.H. Prognostically relevant gene signatures of high-grade serous ovarian carcinoma. J. Clin. Investig. 2012, 123, 517–525. [Google Scholar] [CrossRef]
- Ducie, J.; Dao, F.; Considine, M.; Olvera, N.; Shaw, P.A.; Kurman, R.J.; Shih, I.-M.; Soslow, R.A.; Cope, L.; Levine, D.A. Molecular analysis of high-grade serous ovarian carcinoma with and without associated serous tubal intra-epithelial carcinoma. Nat. Commun. 2017, 8, 1–9. [Google Scholar] [CrossRef] [PubMed]
- Network, C.G.A.R. Integrated genomic analyses of ovarian carcinoma. Nature 2011, 474, 609. [Google Scholar] [CrossRef]
- Cooke, S.L.; Ng, C.K.; Melnyk, N.; Garcia, M.J.; Hardcastle, T.; Temple, J.; Langdon, S.; Huntsman, D.; Brenton, J.D. Genomic analysis of genetic heterogeneity and evolution in high-grade serous ovarian carcinoma. Oncogene 2010, 29, 4905–4913. [Google Scholar] [CrossRef] [Green Version]
- Javadi, S.; Ganeshan, D.M.; Qayyum, A.; Iyer, R.B.; Bhosale, P. Ovarian cancer, the revised FIGO staging system, and the role of imaging. Am. J. Roentgenol. 2016, 206, 1351–1360. [Google Scholar] [CrossRef]
- Zeppernick, F.; Meinhold-Heerlein, I. The new FIGO staging system for ovarian, fallopian tube, and primary peritoneal cancer. Arch. Gynecol. Obstet. 2014, 290, 839–842. [Google Scholar] [CrossRef] [PubMed]
- Yemelyanova, A.; Vang, R.; Kshirsagar, M.; Lu, D.; Marks, M.A.; Shih, I.M.; Kurman, R.J. Immunohistochemical staining patterns of p53 can serve as a surrogate marker for TP53 mutations in ovarian carcinoma: An immunohistochemical and nucleotide sequencing analysis. Mod. Pathol. 2011, 24, 1248–1253. [Google Scholar] [CrossRef]
- Mota, A.; Triviño, J.C.; Rojo-Sebastian, A.; Martínez-Ramírez, Á.; Chiva, L.; González-Martín, A.; Garcia, J.F.; Garcia-Sanz, P.; Moreno-Bueno, G. Intra-tumor heterogeneity in TP53 null high grade serous ovarian carcinoma progression. BMC Cancer 2015, 15, 1–11. [Google Scholar] [CrossRef] [PubMed] [Green Version]
- McAlpine, J.N.; Porter, H.; Köbel, M.; Nelson, B.H.; Prentice, L.M.; Kalloger, S.E.; Senz, J.; Milne, K.; Ding, J.; Shah, S.P. BRCA1 and BRCA2 mutations correlate with TP53 abnormalities and presence of immune cell infiltrates in ovarian high-grade serous carcinoma. Mod. Pathol. 2012, 25, 740–750. [Google Scholar] [CrossRef] [Green Version]
- Brachova, P.; Thiel, K.W.; Leslie, K.K. The consequence of oncomorphic TP53 mutations in ovarian cancer. Int. J. Mol. Sci. 2013, 14, 19257–19275. [Google Scholar] [CrossRef] [Green Version]
- Moschetta, M.; George, A.; Kaye, S.; Banerjee, S. BRCA somatic mutations and epigenetic BRCA modifications in serous ovarian cancer. Ann. Oncol. 2016, 27, 1449–1455. [Google Scholar] [CrossRef]
- Pal, T.; Permuth-Wey, J.; Betts, J.A.; Krischer, J.P.; Fiorica, J.; Arango, H.; LaPolla, J.; Hoffman, M.; Martino, M.A.; Wakeley, K. BRCA1 and BRCA2 mutations account for a large proportion of ovarian carcinoma cases. Cancer Interdiscip. Int. J. Am. Cancer Soc. 2005, 104, 2807–2816. [Google Scholar]
- Bai, H.; Cao, D.; Yang, J.; Li, M.; Zhang, Z.; Shen, K. Genetic and epigenetic heterogeneity of epithelial ovarian cancer and the clinical implications for molecular targeted therapy. J. Cell. Mol. Med. 2016, 20, 581–593. [Google Scholar] [CrossRef]
- Tew, W.P.; Lacchetti, C.; Ellis, A.; Maxian, K.; Banerjee, S.; Bookman, M.; Jones, M.B.; Lee, J.-M.; Lheureux, S.; Liu, J.F. PARP inhibitors in the management of ovarian cancer: ASCO guideline. Obstet. Gynecol. Surv. 2020, 75, 739–741. [Google Scholar] [CrossRef]
- Franzese, E.; Centonze, S.; Diana, A.; Carlino, F.; Guerrera, L.P.; Di Napoli, M.; De Vita, F.; Pignata, S.; Ciardiello, F.; Orditura, M. PARP inhibitors in ovarian cancer. Cancer Treat. Rev. 2019, 73, 1–9. [Google Scholar] [CrossRef] [PubMed] [Green Version]
- Gadducci, A.; Guerrieri, M.E. PARP inhibitors in epithelial ovarian cancer: State of art and perspectives of clinical research. Anticancer. Res. 2016, 36, 2055–2064. [Google Scholar]
- Gomez, M.K.; Illuzzi, G.; Colomer, C.; Churchman, M.; Hollis, R.L.; O’Connor, M.J.; Gourley, C.; Leo, E.; Melton, D.W. Identifying and Overcoming Mechanisms of PARP Inhibitor Resistance in Homologous Recombination Repair-Deficient and Repair-Proficient High Grade Serous Ovarian Cancer Cells. Cancers 2020, 12, 1503. [Google Scholar] [CrossRef]
- Xie, H.; Wang, W.; Xia, B.; Jin, W.; Lou, G. Therapeutic applications of PARP inhibitors in ovarian cancer. Biomed. Pharmacother. 2020, 127, 110204. [Google Scholar] [CrossRef] [PubMed]
- Takaya, H.; Nakai, H.; Takamatsu, S.; Mandai, M.; Matsumura, N. Homologous recombination deficiency status-based classification of high-grade serous ovarian carcinoma. Sci. Rep. 2020, 10, 1–8. [Google Scholar] [CrossRef] [PubMed] [Green Version]
- Ahmed, N.; Kadife, E.; Raza, A.; Short, M.; Jubinsky, P.T.; Kannourakis, G. Ovarian cancer, cancer stem cells and current treatment strategies: A potential role of magmas in the current treatment methods. Cells 2020, 9, 719. [Google Scholar] [CrossRef] [PubMed] [Green Version]
- Rose, M.; Burgess, J.T.; O’Byrne, K.; Richard, D.J.; Bolderson, E. PARP inhibitors: Clinical relevance, mechanisms of action and tumor resistance. Front. Cell Dev. Biol. 2020, 8, 8. [Google Scholar] [CrossRef] [PubMed]
- Bonneau, C.; Rouzier, R.; Geyl, C.; Cortez, A.; Castela, M.; Lis, R.; Daraï, E.; Touboul, C. Predictive markers of chemoresistance in advanced stages epithelial ovarian carcinoma. Gynecol. Oncol. 2015, 136, 112–120. [Google Scholar] [CrossRef]
- Roy, L.; Cowden Dahl, K.D. Can stemness and chemoresistance be therapeutically targeted via signaling pathways in ovarian cancer? Cancers 2018, 10, 241. [Google Scholar] [CrossRef] [Green Version]
- Davidson, B.; Trope, C.G.; Reich, R. Epithelial–mesenchymal transition in ovarian carcinoma. Front. Oncol. 2012, 2, 33. [Google Scholar] [CrossRef] [Green Version]
- Ashrafizadeh, M.; Zarrabi, A.; Hushmandi, K.; Kalantari, M.; Mohammadinejad, R.; Javaheri, T.; Sethi, G. Association of the epithelial–mesenchymal transition (EMT) with cisplatin resistance. Int. J. Mol. Sci. 2020, 21, 4002. [Google Scholar] [CrossRef]
- Iwatsuki, M.; Mimori, K.; Yokobori, T.; Ishi, H.; Beppu, T.; Nakamori, S.; Baba, H.; Mori, M. Epithelial–mesenchymal transition in cancer development and its clinical significance. Cancer Sci. 2010, 101, 293–299. [Google Scholar] [CrossRef]
- Haslehurst, A.M.; Koti, M.; Dharsee, M.; Nuin, P.; Evans, K.; Geraci, J.; Childs, T.; Chen, J.; Li, J.; Weberpals, J. EMT transcription factors snail and slug directly contribute to cisplatin resistance in ovarian cancer. BMC Cancer 2012, 12, 1–10. [Google Scholar] [CrossRef] [Green Version]
- Ribatti, D.; Tamma, R.; Annese, T. Epithelial-mesenchymal transition in cancer: A historical overview. Transl. Oncol. 2020, 13, 100773. [Google Scholar] [CrossRef]
- Voulgari, A.; Pintzas, A. Epithelial–mesenchymal transition in cancer metastasis: Mechanisms, markers and strategies to overcome drug resistance in the clinic. Biochim. Biophys. Acta (BBA) Rev. Cancer 2009, 1796, 75–90. [Google Scholar] [CrossRef]
- Rohnalter, V.; Roth, K.; Finkernagel, F.; Adhikary, T.; Obert, J.; Dorzweiler, K.; Bensberg, M.; Müller-Brüsselbach, S.; Müller, R. A multi-stage process including transient polyploidization and EMT precedes the emergence of chemoresistent ovarian carcinoma cells with a dedifferentiated and pro-inflammatory secretory phenotype. Oncotarget 2015, 6, 40005. [Google Scholar] [CrossRef]
- Loret, N.; Denys, H.; Tummers, P.; Berx, G. The role of epithelial-to-mesenchymal plasticity in ovarian cancer progression and therapy resistance. Cancers 2019, 11, 838. [Google Scholar] [CrossRef] [PubMed] [Green Version]
- Chang, C.-M.; Chuang, C.-M.; Wang, M.-L.; Yang, Y.-P.; Chuang, J.-H.; Yang, M.-J.; Yen, M.-S.; Chiou, S.-H.; Chang, C.-C. Gene set− based integrative analysis revealing two distinct functional regulation patterns in four common subtypes of epithelial ovarian cancer. Int. J. Mol. Sci. 2016, 17, 1272. [Google Scholar] [CrossRef] [PubMed] [Green Version]
- Chang, C.-M.; Chuang, C.-M.; Wang, M.-L.; Yang, M.-J.; Chang, C.-C.; Yen, M.-S.; Chiou, S.-H. Gene set-based functionome analysis of pathogenesis in epithelial ovarian serous carcinoma and the molecular features in different FIGO stages. Int. J. Mol. Sci. 2016, 17, 886. [Google Scholar] [CrossRef] [PubMed] [Green Version]
- Chang, C.-M.; Wang, M.-L.; Lu, K.-H.; Yang, Y.-P.; Juang, C.-M.; Wang, P.-H.; Hsu, R.-J.; Yu, M.-H.; Chang, C.-C. Integrating the dysregulated inflammasome-based molecular functionome in the malignant transformation of endometriosis-associated ovarian carcinoma. Oncotarget 2018, 9, 3704. [Google Scholar] [CrossRef] [Green Version]
- Chang, C.-M.; Yang, Y.-P.; Chuang, J.-H.; Chuang, C.-M.; Lin, T.-W.; Wang, P.-H.; Yu, M.-H.; Chang, C.-C. Discovering the deregulated molecular functions involved in malignant transformation of endometriosis to endometriosis-associated ovarian carcinoma using a data-driven, function-based analysis. Int. J. Mol. Sci. 2017, 18, 2345. [Google Scholar] [CrossRef] [Green Version]
- Chang, C.-C.; Su, K.-M.; Lu, K.-H.; Lin, C.-K.; Wang, P.-H.; Li, H.-Y.; Wang, M.-L.; Lin, C.-K.; Yu, M.-H.; Chang, C.-M. Key immunological functions involved in the progression of epithelial ovarian serous carcinoma discovered by the gene ontology-based immunofunctionome analysis. Int. J. Mol. Sci. 2018, 19, 3311. [Google Scholar] [CrossRef] [PubMed] [Green Version]
- Su, K.-M.; Lin, T.-W.; Liu, L.-C.; Yang, Y.-P.; Wang, M.-L.; Tsai, P.-H.; Wang, P.-H.; Yu, M.-H.; Chang, C.-M.; Chang, C.-C. The Potential Role of Complement System in the Progression of Ovarian Clear Cell Carcinoma Inferred from the Gene Ontology-Based Immunofunctionome Analysis. Int. J. Mol. Sci. 2020, 21, 2824. [Google Scholar] [CrossRef] [Green Version]
- Chang, C.-M.; Li, Y.-F.; Lin, H.-C.; Lu, K.-H.; Lin, T.-W.; Liu, L.-C.; Su, K.-M.; Chang, C.-C. Dysregulated Immunological Functionome and Dysfunctional Metabolic Pathway Recognized for the Pathogenesis of Borderline Ovarian Tumors by Integrative Polygenic Analytics. Int. J. Mol. Sci. 2021, 22, 4105. [Google Scholar] [CrossRef]
- Eddy, J.A.; Hood, L.; Price, N.D.; Geman, D. Identifying tightly regulated and variably expressed networks by Differential Rank Conservation (DIRAC). PLoS Comput. Biol. 2010, 6, e1000792. [Google Scholar] [CrossRef]
- Benjamini, Y.; Hochberg, Y. Controlling the false discovery rate: A practical and powerful approach to multiple testing. J. R. Stat. Soc. Ser. B (Methodol.) 1995, 57, 289–300. [Google Scholar] [CrossRef]
- Robin, X.; Turck, N.; Hainard, A.; Tiberti, N.; Lisacek, F.; Sanchez, J.-C.; Müller, M. pROC: An open-source package for R and S+ to analyze and compare ROC curves. BMC Bioinform. 2011, 12, 1–8. [Google Scholar] [CrossRef] [PubMed]
- Van Diest, P.J.; van Dam, P.; Henzen-Logmans, S.C.; Berns, E.; Van der Burg, M.; Green, J.; Vergote, I. A scoring system for immunohistochemical staining: Consensus report of the task force for basic research of the EORTC-GCCG. European Organization for Research and Treatment of Cancer-Gynaecological Cancer Cooperative Group. J. Clin. Pathol. 1997, 50, 801. [Google Scholar] [CrossRef] [Green Version]
- Charafe-Jauffret, E.; Tarpin, C.; Bardou, V.J.; Bertucci, F.; Ginestier, C.; Braud, A.C.; Puig, B.; Geneix, J.; Hassoun, J.; Birnbaum, D. Immunophenotypic analysis of inflammatory breast cancers: Identification of an ‘inflammatory signature’. J. Pathol. 2004, 202, 265–273. [Google Scholar] [CrossRef]
- Dessimoz, C.; Škunca, N. The Gene Ontology Handbook; Springer: Basingstoke, UK, 2017. [Google Scholar]
- Liberzon, A.; Birger, C.; Thorvaldsdóttir, H.; Ghandi, M.; Mesirov, J.P.; Tamayo, P. The molecular signatures database hallmark gene set collection. Cell Syst. 2015, 1, 417–425. [Google Scholar] [CrossRef] [Green Version]
- Zeisberg, M.; Neilson, E.G. Biomarkers for epithelial-mesenchymal transitions. J. Clin. Investig. 2009, 119, 1429–1437. [Google Scholar] [CrossRef] [Green Version]
- Győrffy, B.; Lánczky, A.; Szállási, Z. Implementing an online tool for genome-wide validation of survival-associated biomarkers in ovarian-cancer using microarray data from 1287 patients. Endocr. Relat. Cancer 2012, 19, 197–208. [Google Scholar] [CrossRef] [Green Version]
- Song, G.; Chen, L.; Zhang, B.; Song, Q.; Yu, Y.; Moore, C.; Wang, T.-L.; Shih, I.-M.; Zhang, H.; Chan, D.W. Proteome-wide tyrosine phosphorylation analysis reveals dysregulated signaling pathways in ovarian tumors*[S]. Mol. Cell. Proteom. 2019, 18, 448–460. [Google Scholar] [CrossRef] [PubMed] [Green Version]
- Cheng, L.; Zheng, X.; Ling, R.; Gao, J.; Leung, K.-S.; Wong, M.-H.; Yang, S.; Liu, Y.; Dong, M.; Bai, H. Whole Transcriptome Analyses Identify Pairwise Gene Circuit Motif in Serous Ovarian Cancer. 2021. PREPRINT (Version 1). Available online: https://doi.org/10.21203/rs.3 (accessed on 20 July 2021).
- Lassus, H.; Sihto, H.; Leminen, A.; Nordling, S.; Joensuu, H.; Nupponen, N.; Butzow, R. Genetic alterations and protein expression of KIT and PDGFRA in serous ovarian carcinoma. Br. J. Cancer 2004, 91, 2048–2055. [Google Scholar] [CrossRef] [Green Version]
- Lee, Y.J.; Kim, D.; Shim, J.E.; Bae, S.J.; Jung, Y.J.; Kim, S.; Lee, H.; Kim, S.H.; Jo, S.B.; Lee, J.Y. Genomic profiling of the residual disease of advanced high-grade serous ovarian cancer after neoadjuvant chemotherapy. Int. J. Cancer 2020, 146, 1851–1861. [Google Scholar] [CrossRef] [PubMed]
- Hanrahan, A.J.; Schultz, N.; Westfal, M.L.; Sakr, R.A.; Giri, D.D.; Scarperi, S.; Janikariman, M.; Olvera, N.; Stevens, E.V.; She, Q.-B. Genomic complexity and AKT dependence in serous ovarian cancer. Cancer Discov. 2012, 2, 56–67. [Google Scholar] [CrossRef] [Green Version]
- Mabuchi, S.; Kuroda, H.; Takahashi, R.; Sasano, T. The PI3K/AKT/mTOR pathway as a therapeutic target in ovarian cancer. Gynecol. Oncol. 2015, 137, 173–179. [Google Scholar] [CrossRef] [PubMed]
- Yu, T.; Wang, C.; Tong, R. ERBB2 gene expression silencing involved in ovarian cancer cell migration and invasion through mediating MAPK1/MAPK3 signaling pathway. Eur. Rev. Med. Pharmacol. Sci. 2020, 24, 5267–5280. [Google Scholar] [PubMed]
- Schaner, M.E.; Ross, D.T.; Ciaravino, G.; Sørlie, T.; Troyanskaya, O.; Diehn, M.; Wang, Y.C.; Duran, G.E.; Sikic, T.L.; Caldeira, S. Gene expression patterns in ovarian carcinomas. Mol. Biol. Cell 2003, 14, 4376–4386. [Google Scholar] [CrossRef] [Green Version]
- Tocci, P.; Cianfrocca, R.; Rosanò, L.; Sestito, R.; Di Castro, V.; Blandino, G.; Bagnato, A. Endothelin-1 receptor/β-arrestin1 is an actionable node that regulates YAP/TAZ signaling and chemoresistance in high-grade ovarian cancer. In Proceedings of the American Association for Cancer Research (AACR) Meeting, Washington, DC, USA, 1–5 April 2017. [Google Scholar]
- Wu, M.; Sun, Y.; Wu, J.; Liu, G. Identification of Hub Genes in High-Grade Serous Ovarian Cancer Using Weighted Gene Co-Expression Network Analysis. Med. Sci. Monit. Int. Med. J. Exp. Clin. Res. 2020, 26, e922107. [Google Scholar] [CrossRef]
- Nam, E.J.; Yoon, H.; Kim, S.W.; Kim, H.; Kim, Y.T.; Kim, J.H.; Kim, J.W.; Kim, S. MicroRNA expression profiles in serous ovarian carcinoma. Clin. Cancer Res. 2008, 14, 2690–2695. [Google Scholar] [CrossRef] [Green Version]
- Hu, Y.; Pan, J.; Shah, P.; Ao, M.; Thomas, S.N.; Liu, Y.; Chen, L.; Schnaubelt, M.; Clark, D.J.; Rodriguez, H. Integrated proteomic and glycoproteomic characterization of human high-grade serous ovarian carcinoma. Cell Rep. 2020, 33, 108276. [Google Scholar] [CrossRef]
- Ray, A.; Fornsaglio, J.; Dogan, S.; Hedau, S.; Naik, S.D.; De, A. Gynaecological cancers and leptin: A focus on the endometrium and ovary. Facts Views Vis. ObGyn 2018, 10, 5. [Google Scholar]
- Zhang, S.; Lu, Z.; Mao, W.; Ahmed, A.A.; Yang, H.; Zhou, J.; Jennings, N.; Rodriguez-Aguayo, C.; Lopez-Berestein, G.; Miranda, R. CDK5 regulates paclitaxel sensitivity in ovarian cancer cells by modulating AKT activation, p21Cip1-and p27Kip1-mediated G1 cell cycle arrest and apoptosis. PLoS ONE 2015, 10, e0131833. [Google Scholar] [CrossRef] [PubMed] [Green Version]
- Ouellet, V.; Provencher, D.M.; Maugard, C.M.; Le Page, C.; Ren, F.; Lussier, C.; Novak, J.; Ge, B.; Hudson, T.J.; Tonin, P.N. Discrimination between serous low malignant potential and invasive epithelial ovarian tumors using molecular profiling. Oncogene 2005, 24, 4672–4687. [Google Scholar] [CrossRef] [PubMed] [Green Version]
- Xu, J.; Wu, R.-C.; O’malley, B.W. Normal and cancer-related functions of the p160 steroid receptor co-activator (SRC) family. Nat. Rev. Cancer 2009, 9, 615–630. [Google Scholar] [CrossRef] [PubMed] [Green Version]
- Wiener, J.R.; Windham, T.C.; Estrella, V.C.; Parikh, N.U.; Thall, P.F.; Deavers, M.T.; Bast, R.C., Jr.; Mills, G.B.; Gallick, G.E. Activated SRC protein tyrosine kinase is overexpressed in late-stage human ovarian cancers. Gynecol. Oncol. 2003, 88, 73–79. [Google Scholar] [CrossRef] [PubMed] [Green Version]
- Lui, G.Y.; Shaw, R.; Schaub, F.X.; Stork, I.N.; Gurley, K.E.; Bridgwater, C.; Diaz, R.L.; Rosati, R.; Swan, H.A.; Ince, T.A. BET, SRC, and BCL2 family inhibitors are synergistic drug combinations with PARP inhibitors in ovarian cancer. EBioMedicine 2020, 60, 102988. [Google Scholar] [CrossRef]
- Beischlag, T.V.; Morales, J.L.; Hollingshead, B.D.; Perdew, G.H. The aryl hydrocarbon receptor complex and the control of gene expression. Crit. Rev. ™ Eukaryot. Gene Expr. 2008, 18, 207–250. [Google Scholar] [CrossRef] [PubMed] [Green Version]
- Abel, J.; Haarmann-Stemmann, T. An introduction to the molecular basics of aryl hydrocarbon receptor biology. Biol. Chem. 2010, 391, 1235–1248. [Google Scholar] [CrossRef]
- Larigot, L.; Juricek, L.; Dairou, J.; Coumoul, X. AhR signaling pathways and regulatory functions. Biochim. Open 2018, 7, 1–9. [Google Scholar] [CrossRef]
- Wang, Z.; Snyder, M.; Kenison, J.E.; Yang, K.; Lara, B.; Lydell, E.; Bennani, K.; Novikov, O.; Federico, A.; Monti, S. How the AHR Became Important in Cancer: The Role of Chronically Active AHR in Cancer Aggression. Int. J. Mol. Sci. 2021, 22, 387. [Google Scholar] [CrossRef]
- Paris, A.; Tardif, N.; Galibert, M.-D.; Corre, S. AhR and Cancer: From Gene Profiling to Targeted Therapy. Int. J. Mol. Sci. 2021, 22, 752. [Google Scholar] [CrossRef]
- Kumar, M.B.; Perdew, G.H. Nuclear receptor coactivator SRC-1 interacts with the Q-rich subdomain of the AhR and modulates its transactivation potential. Gene Expr. J. Liver Res. 1999, 8, 273–286. [Google Scholar]
- Beischlag, T.V.; Wang, S.; Rose, D.W.; Torchia, J.; Reisz-Porszasz, S.; Muhammad, K.; Nelson, W.E.; Probst, M.R.; Rosenfeld, M.G.; Hankinson, O. Recruitment of the NCoA/SRC-1/p160 family of transcriptional coactivators by the aryl hydrocarbon receptor/aryl hydrocarbon receptor nuclear translocator complex. Mol. Cell. Biol. 2002, 22, 4319. [Google Scholar] [CrossRef] [Green Version]
- Tomkiewicz, C.; Herry, L.; Bui, L.; Metayer, C.; Bourdeloux, M.; Barouki, R.; Coumoul, X. The aryl hydrocarbon receptor regulates focal adhesion sites through a non-genomic FAK/Src pathway. Oncogene 2013, 32, 1811–1820. [Google Scholar] [CrossRef] [Green Version]
- Choudhary, M.; Malek, G. The aryl hydrocarbon receptor: A mediator and potential therapeutic target for ocular and non-ocular neurodegenerative diseases. Int. J. Mol. Sci. 2020, 21, 6777. [Google Scholar] [CrossRef]
- Feng, S.; Cao, Z.; Wang, X. Role of aryl hydrocarbon receptor in cancer. Biochim. Biophys. Acta (BBA) Rev. Cancer 2013, 1836, 197–210. [Google Scholar] [CrossRef] [PubMed]
- Mulero-Navarro, S.; Fernandez-Salguero, P.M. New trends in aryl hydrocarbon receptor biology. Front. Cell Dev. Biol. 2016, 4, 45. [Google Scholar] [CrossRef] [Green Version]
- Piotrowska, H.; Kucinska, M.; Murias, M. Expression of CYP1A1, CYP1B1 and MnSOD in a panel of human cancer cell lines. Mol. Cell. Biochem. 2013, 383, 95–102. [Google Scholar] [CrossRef] [PubMed] [Green Version]
- Akhtar, S.; Hourani, S.; Therachiyil, L.; Al-Dhfyan, A.; Agouni, A.; Zeidan, A.; Uddin, S.; Korashy, H.M. Epigenetic Regulation of Cancer Stem Cells by the Aryl Hydrocarbon Receptor Pathway. Semin. Cancer Biol. 2020. [Google Scholar] [CrossRef] [PubMed]
- Safe, S.; Lee, S.-O.; Jin, U.-H. Role of the aryl hydrocarbon receptor in carcinogenesis and potential as a drug target. Toxicol. Sci. 2013, 135, 1–16. [Google Scholar] [CrossRef] [Green Version]
- Khorram, O.; Garthwaite, M.; Golos, T. Uterine and ovarian aryl hydrocarbon receptor (AHR) and aryl hydrocarbon receptor nuclear translocator (ARNT) mRNA expression in benign and malignant gynaecological conditions. Mol. Hum. Reprod. 2002, 8, 75–80. [Google Scholar] [CrossRef] [PubMed] [Green Version]
- Tsuchiya, M.; Katoh, T.; Motoyama, H.; Sasaki, H.; Tsugane, S.; Ikenoue, T. Analysis of the AhR, ARNT, and AhRR gene polymorphisms: Genetic contribution to endometriosis susceptibility and severity. Fertil. Steril. 2005, 84, 454–458. [Google Scholar] [CrossRef] [PubMed]
- Beedanagari, S.R.; Taylor, R.T.; Bui, P.; Wang, F.; Nickerson, D.W.; Hankinson, O. Role of epigenetic mechanisms in differential regulation of the dioxin-inducible human CYP1A1 and CYP1B1 genes. Mol. Pharmacol. 2010, 78, 608–616. [Google Scholar] [CrossRef] [PubMed] [Green Version]
- Salani, R.; Backes, F.J.; Fung, M.F.K.; Holschneider, C.H.; Parker, L.P.; Bristow, R.E.; Goff, B.A. Posttreatment surveillance and diagnosis of recurrence in women with gynecologic malignancies: Society of Gynecologic Oncologists recommendations. Am. J. Obstet. Gynecol. 2011, 204, 466–478. [Google Scholar] [CrossRef] [PubMed]
- Pokhriyal, R.; Hariprasad, R.; Kumar, L.; Hariprasad, G. Chemotherapy resistance in advanced ovarian cancer patients. Biomark. Cancer 2019, 11, 1179299X19860815. [Google Scholar] [CrossRef]
- Jing, Y.; Han, Z.; Zhang, S.; Liu, Y.; Wei, L. Epithelial-Mesenchymal Transition in tumor microenvironment. Cell Biosci. 2011, 1, 1–7. [Google Scholar] [CrossRef] [Green Version]
- Gao, D.; Vahdat, L.T.; Wong, S.; Chang, J.C.; Mittal, V. Microenvironmental regulation of epithelial–mesenchymal transitions in cancer. Cancer Res. 2012, 72, 4883–4889. [Google Scholar] [CrossRef] [Green Version]
- Jung, H.-Y.; Fattet, L.; Yang, J. Molecular pathways: Linking tumor microenvironment to epithelial–mesenchymal transition in metastasis. Clin. Cancer Res. 2015, 21, 962–968. [Google Scholar] [CrossRef] [Green Version]
- Mladinich, M.; Ruan, D.; Chan, C.-H. Tackling cancer stem cells via inhibition of EMT transcription factors. Stem Cells Int. 2016, 2016, 1–10. [Google Scholar] [CrossRef] [Green Version]
- Kurrey, N.; Amit, K.; Bapat, S. Snail and Slug are major determinants of ovarian cancer invasiveness at the transcription level. Gynecol. Oncol. 2005, 97, 155–165. [Google Scholar] [CrossRef]
- Ganesan, R.; Mallets, E.; Gomez-Cambronero, J. The transcription factors Slug (SNAI2) and Snail (SNAI1) regulate phospholipase D (PLD) promoter in opposite ways towards cancer cell invasion. Mol. Oncol. 2016, 10, 663–676. [Google Scholar] [CrossRef] [PubMed] [Green Version]
- Kim, Y.-S.; Hwang, K.-A.; Hyun, S.-H.; Nam, K.-H.; Lee, C.-K.; Choi, K.-C. Bisphenol A and nonylphenol have the potential to stimulate the migration of ovarian cancer cells by inducing epithelial–mesenchymal transition via an estrogen receptor dependent pathway. Chem. Res. Toxicol. 2015, 28, 662–671. [Google Scholar] [CrossRef]
- Oral, D.; Erkekoglu, P.; Kocer-Gumusel, B.; Chao, M.-W. Epithelial-mesenchymal transition: A special focus on phthalates and bisphenol a. J. Environ. Pathol. Toxicol. Oncol. 2016, 35, 43–58. [Google Scholar] [CrossRef]
- Xu, Z.; Ding, W.; Deng, X. PM2. 5, fine particulate matter: A novel player in the epithelial-mesenchymal transition? Front. Physiol. 2019, 10, 1404. [Google Scholar] [CrossRef] [PubMed]
- Lee, G.-A.; Hwang, K.-A.; Choi, K.-C. Roles of dietary phytoestrogens on the regulation of epithelial-mesenchymal transition in diverse cancer metastasis. Toxins 2016, 8, 162. [Google Scholar] [CrossRef] [PubMed] [Green Version]
- Moretti, S.; Nucci, N.; Menicali, E.; Morelli, S.; Bini, V.; Colella, R.; Mandarano, M.; Sidoni, A.; Puxeddu, E. The aryl hydrocarbon receptor is expressed in thyroid carcinoma and appears to mediate epithelial-mesenchymal-transition. Cancers 2020, 12, 145. [Google Scholar] [CrossRef] [Green Version]


| Groups | Sample | Control | Total | Sample Mean (SD 1) | Control Mean (SD 1) | p-Value |
|---|---|---|---|---|---|---|
| Serous BOT 2 | 79 | 136 | 215 | 0.7036 (0.1772) | 0.7732 (0.1646) | <0.05 |
| Serous ovarian carcinoma stage I | 34 | 136 | 170 | 0.7298 (0.1672) | 0.7715 (0.1551) | <0.05 |
| Serous ovarian carcinoma stage II | 39 | 136 | 175 | 0.6976 (0.1838) | 0.7713 (0.1552) | <0.05 |
| Serous ovarian carcinoma stage III | 696 | 136 | 832 | 0.6355 (0.1940) | 0.7705 (0.1606) | <0.05 |
| Serous ovarian carcinoma stage IV | 131 | 136 | 267 | 0.6147 (0.1969) | 0.7706 (0.1565) | <0.05 |
| Groups | Serous BOT | Serous Ovarian Carcinoma Stage I | Serous Ovarian Carcinoma Stage II | Serous Ovarian Carcinoma Stage III | Serous Ovarian Carcinoma Stage IV | |||||
|---|---|---|---|---|---|---|---|---|---|---|
| Ranking | GO ID | GO Term | GO ID | GO Term | GO ID | GO Term | GO ID | GO Term | GO ID | GO Term |
| 1 | GO:0002682 | Regulation of immune system process | GO:0005215 | Transporter activity | GO:0044281 | Small molecule metabolic process | GO:0002682 | Regulation of immune system process | GO:0044281 | Small molecule metabolic process |
| 2 | GO:0005215 | Transporter activity | GO:0044281 | Small molecule metabolic process | GO:0005215 | Transporter activity | GO:0044281 | Small molecule metabolic process | GO:0002682 | Regulation of immune system process |
| 3 | GO:0001775 | Cell activation | GO:0006811 | Ion transport | GO:0002682 | Regulation of immune system process | GO:0005215 | Transporter activity | GO:0005215 | Transporter activity |
| 4 | GO:0006811 | Ion transport | GO:0006629 | Lipid metabolic process | GO:0006811 | Ion transport | GO:0001775 | Cell activation | GO:0051049 | Regulation of transport |
| 5 | GO:0044281 | Small molecule metabolic process | GO:0051049 | Regulation of transport | GO:0006629 | Lipid metabolic process | GO:0051049 | Regulation of transport | GO:0006811 | Ion transport |
| 6 | GO:0051049 | Regulation of transport | GO:0007267 | Cell-cell signaling | GO:0051049 | Regulation of transport | GO:0006811 | Ion transport | GO:0006629 | Lipid metabolic process |
| 7 | GO:0002252 | Immune effector process | GO:0046649 | Lymphocyte activation | GO:0001775 | Cell activation | GO:0016070 | RNA metabolic process | GO:0001775 | Cell activation |
| 8 | GO:0002520 | Immune system development | GO:0040011 | Locomotion | GO:0007267 | Cell-cell signaling | GO:0045595 | Regulation of cell differentiation | GO:0016070 | RNA metabolic process |
| 9 | GO:0001816 | Cytokine production | GO:0055085 | Transmembrane transport | GO:0016070 | RNA metabolic process | GO:0006629 | Lipid metabolic process | GO:0045595 | Regulation of cell differentiation |
| 10 | GO:0045595 | Regulation of cell differentiation | GO:0042592 | Homeostatic process | GO:0045595 | Regulation of cell differentiation | GO:0040011 | Locomotion | GO:0007267 | Cell-cell signaling |
| 11 | GO:0031399 | Regulation of protein modification process | GO:0045595 | Regulation of cell differentiation | GO:0046903 | Secretion | GO:0001816 | Cytokine production | GO:0022008 | Neurogenesis |
| 12 | GO:0006629 | Lipid metabolic process | GO:0051174 | Regulation of phosphorus metabolic process | GO:0040011 | Locomotion | GO:0002252 | Immune effector process | GO:0046903 | Secretion |
| 13 | GO:0048585 | Negative regulation of response to stimulus | GO:0016491 | Oxidoreductase activity | GO:0042592 | Homeostatic process | GO:0022008 | Neurogenesis | GO:0040011 | Locomotion |
| 14 | GO:0042592 | Homeostatic process | GO:0022008 | Neurogenesis | GO:0022008 | Neurogenesis | GO:0007267 | Cell-cell signaling | GO:0042592 | Homeostatic process |
| 15 | GO:0022610 | Biological adhesion | GO:0098772 | Molecular function regulator | GO:0007049 | Cell cycle | GO:0046903 | Secretion | GO:0019219 | Regulation of nucleobase-containing compound metabolic process |
| 16 | GO:0055085 | Transmembrane transport | GO:0031399 | Regulation of protein modification process | GO:0060429 | Epithelium development | GO:0070727 | Cellular macromolecule localization | GO:0002520 | Immune system development |
| 17 | GO:0051240 | Positive regulation of multicellular organismal process | GO:0048585 | Negative regulation of response to stimulus | GO:0048585 | Negative regulation of response to stimulus | GO:0002520 | Immune system development | GO:0051276 | Chromosome organization |
| 18 | GO:0006915 | Apoptotic process | GO:0050865 | Regulation of cell activation | GO:0051174 | Regulation of phosphorus metabolic process | GO:0051276 | Chromosome organization | GO:0060429 | Epithelium development |
| 19 | GO:0046903 | Secretion | GO:0070727 | Cellular macromolecule localization | GO:0033043 | Regulation of organelle organization | GO:0042592 | Homeostatic process | GO:0007049 | Cell cycle |
| 20 | GO:0060429 | Epithelium development | GO:0010817 | Regulation of hormone levels | GO:0019219 | Regulation of nucleobase-containing compound metabolic process | GO:0007049 | Cell cycle | GO:0001816 | Cytokine production |
| 21 | GO:0051174 | Regulation of phosphorus metabolic process | GO:0023056 | Positive regulation of signaling | GO:0055085 | Transmembrane transport | GO:0051240 | Positive regulation of multicellular organismal process | GO:0048585 | Negative regulation of response to stimulus |
| 22 | GO:0051276 | Chromosome organization | GO:0007049 | Cell cycle | GO:0002520 | Immune system development | GO:0019219 | Regulation of nucleobase-containing compound metabolic process | GO:0002252 | Immune effector process |
| 23 | GO:0007267 | Cell-cell signaling | GO:0002520 | Immune system development | GO:0051276 | Chromosome organization | GO:0033043 | Regulation of organelle organization | GO:0051174 | Regulation of phosphorus metabolic process |
| 24 | GO:0007049 | Cell cycle | GO:0015849 | Organic acid transport | GO:0031399 | Regulation of protein modification process | GO:0031399 | Regulation of protein modification process | GO:0031399 | Regulation of protein modification process |
| 25 | GO:0070727 | Cellular macromolecule localization | GO:0007017 | Microtubule-based process | GO:0002252 | Immune effector process | GO:0060429 | Epithelium development | GO:0033043 | Regulation of organelle organization |
| 26 | GO:0016070 | RNA metabolic process | GO:0000003 | Reproduction | GO:0070727 | Cellular macromolecule localization | GO:0048585 | Negative regulation of response to stimulus | GO:0009719 | Response to endogenous stimulus |
| 27 | GO:0040011 | Locomotion | GO:0060089 | Molecular transducer activity | GO:0023056 | Positive regulation of signaling | GO:0046907 | Intracellular transport | GO:0019637 | Organophosphate metabolic process |
| 28 | GO:0033043 | Regulation of organelle organization | GO:0033043 | Regulation of organelle organization | GO:0010817 | Regulation of hormone levels | GO:0006915 | Apoptotic process | GO:0051240 | Positive regulation of multicellular organismal process |
| 29 | GO:0046907 | Intracellular transport | GO:0019219 | Regulation of nucleobase-containing compound metabolic process | GO:0016491 | Oxidoreductase activity | GO:0051174 | Regulation of phosphorus metabolic process | GO:0070727 | Cellular macromolecule localization |
| 30 | GO:0023056 | Positive regulation of signaling | GO:0051240 | Positive regulation of multicellular organismal process | GO:0009719 | Response to endogenous stimulus | GO:0023056 | Positive regulation of signaling | GO:0000003 | Reproduction |
| 31 | GO:0019219 | Regulation of nucleobase-containing compound metabolic process | GO:0046907 | Intracellular transport | GO:0098772 | Molecular function regulator | GO:0006259 | DNA metabolic process | GO:0006915 | Apoptotic process |
| 32 | GO:0006468 | Protein phosphorylation | GO:0022610 | Biological adhesion | GO:0006915 | Apoptotic process | GO:0055085 | Transmembrane transport | GO:0006259 | DNA metabolic process |
| 33 | GO:0051241 | Negative regulation of multicellular organismal process | GO:0050877 | Nervous system process | GO:0007010 | Cytoskeleton organization | GO:0000003 | Reproduction | GO:0007417 | Central nervous system development |
| 34 | GO:0006259 | DNA metabolic process | GO:0030054 | Cell junction | GO:0001816 | Cytokine production | GO:0044419 | Interspecies interaction between organisms | GO:0055085 | Transmembrane transport |
| 35 | GO:0005102 | Signaling receptor binding | GO:0002683 | Negative regulation of immune system process | GO:0051240 | Positive regulation of multicellular organismal process | GO:0007417 | Central nervous system development | GO:0023056 | Positive regulation of signaling |
| 36 | GO:0098772 | Molecular function regulator | GO:0030030 | Cell projection organization | GO:0019637 | Organophosphate metabolic process | GO:0030030 | Cell projection organization | GO:0051241 | Negative regulation of multicellular organismal process |
| 37 | GO:0080134 | Regulation of response to stress | GO:0042127 | Regulation of cell proliferation | GO:0046907 | Intracellular transport | GO:0065003 | Protein-containing complex assembly | GO:0046907 | Intracellular transport |
| 38 | GO:0022008 | Neurogenesis | GO:0042493 | Response to drug | GO:0022610 | Biological adhesion | GO:0022610 | Biological adhesion | GO:0030030 | Cell projection organization |
| 39 | GO:0015849 | Organic acid transport | GO:0023057 | Negative regulation of signaling | GO:0000003 | Reproduction | GO:0009607 | Response to biotic stimulus | GO:0007010 | Cytoskeleton organization |
| 40 | GO:0044419 | Interspecies interaction between organisms | GO:0071495 | Cellular response to endogenous stimulus | GO:0030030 | Cell projection organization | GO:0007010 | Cytoskeleton organization | GO:0098772 | Molecular function regulator |
| 41 | GO:0023057 | Negative regulation of signaling | GO:0051270 | Regulation of cellular component movement | GO:0051241 | Negative regulation of multicellular organismal process | GO:0009719 | Response to endogenous stimulus | GO:0065003 | Protein-containing complex assembly |
| 42 | GO:0010941 | Regulation of cell death | GO:0051338 | Regulation of transferase activity | GO:0007417 | Central nervous system development | GO:0080134 | Regulation of response to stress | GO:0022610 | Biological adhesion |
| 43 | GO:0042127 | Regulation of cell population proliferation | GO:0022603 | Regulation of anatomical structure morphogenesis | GO:0007017 | Microtubule-based process | GO:0006468 | Protein phosphorylation | GO:0009790 | Embryo development |
| 44 | GO:0009790 | Embryo development | GO:0009057 | Macromolecule catabolic process | GO:0014070 | Response to organic cyclic compound | GO:0032101 | Regulation of response to external stimulus | GO:0006468 | Protein phosphorylation |
| 45 | GO:0002250 | Adaptive immune response | GO:0009790 | Embryo development | GO:0023057 | Negative regulation of signaling | GO:0098772 | Molecular function regulator | GO:0016491 | Oxidoreductase activity |
| 46 | GO:0019637 | Organophosphate metabolic process | GO:0051093 | Negative regulation of developmental process | GO:0006259 | DNA metabolic process | GO:0018193 | Peptidyl-amino acid modification | GO:0018193 | Peptidyl-amino acid modification |
| 47 | GO:0018193 | Peptidyl amino acid modification | GO:0043603 | Cellular amide metabolic process | GO:0098796 | Membrane protein complex | GO:0006952 | Defense response | GO:0010817 | Regulation of hormone levels |
| 48 | GO:0009628 | Response to abiotic stimulus | GO:0030855 | Epithelial cell differentiation | GO:0042493 | Response to drug | GO:0051241 | Negative regulation of multicellular organismal process | GO:0080134 | Regulation of response to stress |
| 49 | GO:0000003 | Reproduction | GO:0010876 | Lipid localization | GO:0015849 | Organic acid transport | GO:0019637 | Organophosphate metabolic process | GO:0014070 | Response to organic cyclic compound |
| 50 | GO:0009719 | Response to endogenous stimulus | GO:0051094 | Positive regulation of developmental process | GO:0006468 | Protein phosphorylation | GO:0044093 | Positive regulation of molecular function | GO:0023057 | Negative regulation of signaling |
| Cellular Cycle and Signaling Related Effects | ||
| GO ID | GO Term | Most Relevant DEGs |
| GO:0045595 | Regulation of cell differentiation | EDN1, AKT1, IL1B, INS |
| GO:0007267 | Cell-cell signaling | |
| GO:0042592 | Homeostatic process | |
| GO:0048585 | Negative regulation of response to stimulus | |
| GO:0007049 | Cell cycle | |
| GO:0033043 | Regulation of organelle organization | |
| GO:0051240 | Positive regulation of multicellular organismal process | |
| GO:0023056 | Positive regulation of signaling | |
| GO:0098772 | Molecular function regulator | |
| Membrane and Transport Related Effects | ||
| GO ID | GO Term | Most Relevant DEGs |
| GO:0005215 | Transporter activity | CDK5, ATP1B1 |
| GO:0006811 | Ion transport | |
| GO:0051049 | Regulation of transport | |
| GO:0040011 | Locomotion | |
| GO:0055085 | Transmembrane transport | |
| GO:0070727 | Cellular macromolecule localization | |
| GO:0046907 | Intracellular transport | |
| GO:0022610 | Biological adhesion | |
| Metabolic, Immunological, and Other Effects | ||
| GO ID | GO Term | Most Relevant DEGs |
| GO:0044281 | Small molecule metabolic process | PTK2B, MTOR, APP, KIT, LEP, MAPK3, SRC |
| GO:0006629 | Lipid metabolic process | |
| GO:0031399 | Regulation of protein modification process | |
| GO:0051174 | Regulation of phosphorus metabolic process | |
| GO:0019219 | Regulation of nucleobase containing compound metabolic process | |
| GO:0002520 | Immune system development | |
| GO:0022008 | Neurogenesis | |
| GO:0000003 | Reproduction | |
| Groups | Serous BOT | Serous Ovarian Carcinoma Stage I | Serous Ovarian Carcinoma Stage II | Serous Ovarian Carcinoma Stage III | Serous Ovarian Carcinoma Stage IV | |||||
|---|---|---|---|---|---|---|---|---|---|---|
| Ranking | GO ID | GO Term | GO ID | GO Term | GO ID | GO Term | GO ID | GO Term | GO ID | GO Term |
| 1 | GO:0045829 | Negative regulation of isotype switching | GO:0072349 | Modified amino acid transmembrane transporter activity | GO:0010792 | DNA double-strand break processing involved in repair via single-strand annealing | GO:2001269 | Positive regulation of cysteine-type endopeptidase activity involved in apoptotic signaling pathway | GO:0017162 | Aryl hydrocarbon receptor binding |
| 2 | GO:0008395 | Steroid hydroxylase activity | GO:0017162 | Aryl hydrocarbon receptor binding | GO:0017162 | Aryl hydrocarbon receptor binding | GO:0042908 | Xenobiotic transport | GO:0072349 | Modified amino acid transmembrane transporter activity |
| 3 | GO:0016578 | Histone deubiquitination | GO:0097501 | Stress response to metal ion | GO:0045002 | Double-strand break repair via single-strand annealing | GO:2001267 | Regulation of cysteine-type endopeptidase activity involved in apoptotic signaling pathway | GO:0036507 | Protein demannosylation |
| 4 | GO:0090482 | Vitamin transmembrane transporter activity | GO:0016589 | NURF complex | GO:0070162 | Adiponectin secretion | GO:0015701 | Bicarbonate transport | GO:0045618 | Positive regulation of keratinocyte differentiation |
| 5 | GO:0033499 | Galactose catabolic process via UDP-galactose | GO:0055059 | Asymmetric neuroblast division | GO:0046643 | Regulation of gamma-delta T cell activation | GO:0046007 | Negative regulation of activated T cell proliferation | GO:0015106 | Bicarbonate transmembrane transporter activity |
| 6 | GO:0005347 | ATP transmembrane transporter activity | GO:0004865 | Protein serine/threonine phosphatase inhibitor activity | GO:0010957 | Negative regulation of vitamin D biosynthetic process | GO:0010957 | Negative regulation of vitamin D biosynthetic process | GO:0045002 | Double-strand break repair via single-strand annealing |
| 7 | GO:0015867 | ATP transport | GO:0008628 | Hormone-mediated apoptotic signaling pathway | GO:0036507 | Protein demannosylation | GO:0072608 | Interleukin-10 secretion | GO:0045793 | Positive regulation of cell size |
| 8 | GO:0006825 | Copper ion transport | GO:0036507 | Protein demannosylation | GO:0046137 | Negative regulation of vitamin metabolic process | GO:0090482 | Vitamin transmembrane transporter activity | GO:0004016 | Adenylate cyclase activity |
| 9 | GO:0046007 | Negative regulation of activated T cell proliferation | GO:0015106 | Bicarbonate transmembrane transporter activity | GO:1990239 | Steroid hormone binding | GO:0072350 | Tricarboxylic acid metabolic process | GO:0006171 | cAMP biosynthetic process |
| 10 | GO:0044743 | Protein transmembrane import into intracellular organelle | GO:0046643 | Regulation of gamma-delta T cell activation | GO:0071360 | Cellular response to exogenous dsRNA | GO:0033617 | Mitochondrial respiratory chain complex IV assembly | GO:0006517 | Protein deglycosylation |
| 11 | GO:0050859 | Negative regulation of B cell receptor signaling pathway | GO:0005078 | MAP-kinase scaffold activity | GO:0044854 | Plasma membrane raft assembly | GO:0016409 | Palmitoyltransferase activity | GO:0010957 | Negative regulation of vitamin D biosynthetic process |
| 12 | GO:0099132 | ATP hydrolysis coupled cation transmembrane transport | GO:0045618 | Positive regulation of keratinocyte differentiation | GO:0016589 | NURF complex | GO:0005451 | Monovalent cation:proton antiporter activity | GO:0015701 | Bicarbonate transport |
| 13 | GO:0000244 | Spliceosomal tri-snRNP complex assembly | GO:0045793 | Positive regulation of cell size | GO:0097501 | Stress response to metal ion | GO:0018345 | Protein palmitoylation | GO:0036065 | Fucosylation |
| 14 | GO:0045623 | Negative regulation of T-helper cell differentiation | GO:0015116 | Sulfate transmembrane transporter activity | GO:0072349 | Modified amino acid transmembrane transporter activity | GO:0016417 | S-acyltransferase activity | GO:0072497 | Mesenchymal stem cell differentiation |
| 15 | GO:0004089 | Carbonate dehydratase activity | GO:0008271 | Secondary active sulfate transmembrane transporter activity | GO:0015106 | Bicarbonate transmembrane transporter activity | GO:0046137 | Negative regulation of vitamin metabolic process | GO:0050859 | Negative regulation of B cell receptor signaling pathway |
| 16 | GO:0033270 | Paranode region of axon | GO:0004016 | Adenylate cyclase activity | GO:0050428 | 3′-phosphoadenosine 5′-phosphosulfate biosynthetic process | GO:0002370 | Natural killer cell cytokine production | GO:0019870 | Potassium channel inhibitor activity |
| 17 | GO:0050686 | Negative regulation of mRNA processing | GO:0006171 | cAMP biosynthetic process | GO:0001765 | Membrane raft assembly | GO:0045618 | Positive regulation of keratinocyte differentiation | GO:0036066 | Protein O-linked fucosylation |
| 18 | GO:0044183 | Protein binding involved in protein folding | GO:0008272 | Sulfate transport | GO:0019531 | Oxalate transmembrane transporter activity | GO:0016589 | NURF complex | GO:0046137 | Negative regulation of vitamin metabolic process |
| 19 | GO:0061082 | Myeloid leukocyte cytokine production | GO:0022821 | Potassium ion antiporter activity | GO:0045618 | Positive regulation of keratinocyte differentiation | GO:0015924 | Mannosyl-oligosaccharide mannosidase activity | GO:0044322 | Endoplasmic reticulum quality control compartment |
| 20 | GO:0000002 | Mitochondrial genome maintenance | GO:0015924 | Mannosyl-oligosaccharide mannosidase activity | GO:0008271 | Secondary active sulfate transmembrane transporter activity | GO:0045616 | Regulation of keratinocyte differentiation | GO:0004865 | Protein serine/threonine phosphatase inhibitor activity |
| 21 | GO:0045591 | Positive regulation of regulatory T cell differentiation | GO:0019373 | Epoxygenase P450 pathway | GO:0015116 | Sulfate transmembrane transporter activity | GO:0070162 | Adiponectin secretion | GO:0007175 | Negative regulation of epidermal growth factor-activated receptor activity |
| 22 | GO:2001182 | Regulation of interleukin-12 secretion | GO:0019532 | Oxalate transport | GO:0032184 | SUMO polymer binding | GO:0022821 | Potassium ion antiporter activity | GO:0042359 | Vitamin D metabolic process |
| 23 | GO:0097503 | Sialylation | GO:0099509 | Regulation of presynaptic cytosolic calcium ion concentration | GO:0045586 | Regulation of gamma-delta T cell differentiation | GO:0015377 | Cation: chloride symporter activity | GO:0009975 | Cyclase activity |
| 24 | GO:0008373 | Sialyltransferase activity | GO:0019531 | Oxalate transmembrane transporter activity | GO:0019532 | Oxalate transport | GO:0015379 | Potassium: chloride symporter activity | GO:0045616 | Regulation of keratinocyte differentiation |
| 25 | GO:0008385 | Ikappab kinase complex | GO:0050428 | 3′-phosphoadenosine 5′-phosphosulfate biosynthetic process | GO:0071447 | Cellular response to hydroperoxide | GO:0098719 | Sodium ion import across plasma membrane | GO:0016849 | Phosphorus-oxygen lyase activity |
| 26 | GO:0072643 | Interferon-gamma secretion | GO:0008391 | Arachidonic acid monooxygenase activity | GO:0042363 | Fat-soluble vitamin catabolic process | GO:0072643 | Interferon-gamma secretion | GO:1990239 | Steroid hormone binding |
| 27 | GO:0031248 | Protein acetyltransferase complex | GO:0097267 | Omega-hydroxylase P450 pathway | GO:0072497 | Mesenchymal stem cell differentiation | GO:0097503 | Sialylation | GO:0071305 | Cellular response to vitamin D |
| 28 | GO:0000188 | Inactivation of MAPK activity | GO:0010792 | DNA double-strand break processing involved in repair via single-strand annealing | GO:0005337 | Nucleoside transmembrane transporter activity | GO:0008373 | Sialyltransferase activity | GO:0070162 | Adiponectin secretion |
| 29 | GO:0002634 | Regulation of germinal center formation | GO:0031010 | ISWI-type complex | GO:0008272 | Sulfate transport | GO:0017162 | Aryl hydrocarbon receptor binding | GO:0006895 | Golgi to endosome transport |
| 30 | GO:2000515 | Negative regulation of CD4-positive, alpha-beta T cell activation | GO:0071360 | Cellular response to exogenous dsRNA | GO:0002175 | Protein localization to paranode region of axon | GO:0032689 | Negative regulation of interferon-gamma production | GO:0097225 | Sperm midpiece |
| 31 | GO:2000320 | Negative regulation of T-helper 17 cell differentiation | GO:0006685 | Sphingomyelin catabolic process | GO:0019373 | Epoxygenase P450 pathway | GO:0015296 | Anion:cation symporter activity | GO:2000535 | Regulation of entry of bacterium into host cell |
| 32 | GO:0060907 | Positive regulation of macrophage cytokine production | GO:0071577 | Zinc ion transmembrane transport | GO:2001182 | Regulation of interleukin-12 secretion | GO:0046643 | Regulation of gamma-delta T cell activation | GO:0004198 | Calcium-dependent cysteine-type endopeptidase activity |
| 33 | GO:0032426 | Stereocilium tip | GO:0005385 | Zinc ion transmembrane transporter activity | GO:0090177 | Establishment of planar polarity involved in neural tube closure | GO:0042788 | Polysomal ribosome | GO:0019373 | Epoxygenase P450 pathway |
| 34 | GO:0046915 | Transition metal ion transmembrane transporter activity | GO:0044854 | Plasma membrane raft assembly | GO:0015858 | Nucleoside transport | GO:0045503 | Dynein light chain binding | GO:1905276 | Regulation of epithelial tube formation |
| 35 | GO:0033549 | MAP kinase phosphatase activity | GO:0099516 | Ion antiporter activity | GO:0031095 | Platelet dense tubular network membrane | GO:2000773 | Negative regulation of cellular senescence | GO:0071313 | Cellular response to caffeine |
| 36 | GO:0016854 | Racemase and epimerase activity | GO:0038044 | Transforming growth factor-beta secretion | GO:0019870 | Potassium channel inhibitor activity | GO:0002707 | Negative regulation of lymphocyte mediated immunity | GO:0045671 | Negative regulation of osteoclast differentiation |
| 37 | GO:0043371 | Negative regulation of CD4-positive, alpha-beta T cell differentiation | GO:0097264 | Self-proteolysis | GO:0034139 | Regulation of toll-like receptor 3 signaling pathway | GO:0070234 | Positive regulation of T cell apoptotic process | GO:0099516 | Ion antiporter activity |
| 38 | GO:0030890 | Positive regulation of B cell proliferation | GO:0045852 | pH elevation | GO:0101020 | Estrogen 16-alpha-hydroxylase activity | GO:0071447 | Cellular response to hydroperoxide | GO:0019532 | Oxalate transport |
| 39 | GO:0050798 | Activated T cell proliferation | GO:0009698 | Phenylpropanoid metabolic process | GO:0002933 | Lipid hydroxylation | GO:0099587 | Inorganic ion import across plasma membrane | GO:2001222 | Regulation of neuron migration |
| 40 | GO:0015662 | ATPase activity, coupled to transmembrane movement of ions, phosphorylative mechanism | GO:2001182 | Regulation of interleukin-12 secretion | GO:0060353 | Regulation of cell adhesion molecule production | GO:0071636 | Positive regulation of transforming growth factor beta production | GO:0016712 | Oxidoreductase activity, acting on paired donors, with incorporation or reduction of molecular oxygen, reduced flavin or flavoprotein as one donor, and incorporation of one atom of oxygen |
| 41 | GO:0048291 | Isotype switching to IgG isotypes | GO:0015491 | Cation: cation antiporter activity | GO:0008391 | Arachidonic acid monooxygenase activity | GO:0033962 | Cytoplasmic mRNA processing body assembly | GO:2000833 | Positive regulation of steroid hormone secretion |
| 42 | GO:0017162 | Aryl hydrocarbon receptor binding | GO:0071313 | Cellular response to caffeine | GO:1905276 | Regulation of epithelial tube formation | GO:0043189 | H4/H2A histone acetyltransferase complex | GO:0007077 | Mitotic nuclear envelope disassembly |
| 43 | GO:0061081 | Positive regulation of myeloid leukocyte cytokine production involved in immune response | GO:2000833 | Positive regulation of steroid hormone secretion | GO:0031010 | ISWI-type complex | GO:0043968 | Histone H2A acetylation | GO:0015924 | Mannosyl-oligosaccharide mannosidase activity |
| 44 | GO:0016226 | Iron-sulfur cluster assembly | GO:0070162 | Adiponectin secretion | GO:0045671 | Negative regulation of osteoclast differentiation | GO:2001222 | Regulation of neuron migration | GO:2001182 | Regulation of interleukin-12 secretion |
| 45 | GO:0030007 | Cellular potassium ion homeostasis | GO:0031995 | Insulin-like growth factor II binding | GO:0031995 | Insulin-like growth factor II binding | GO:0070670 | Response to interleukin-4 | GO:0015373 | Anion: sodium symporter activity |
| 46 | GO:0015701 | Bicarbonate transport | GO:0005451 | Monovalent cation: proton antiporter activity | GO:0008541 | Proteasome regulatory particle, lid subcomplex | GO:0018230 | Peptidyl-L-cysteine S-palmitoylation | GO:0090177 | Establishment of planar polarity involved in neural tube closure |
| 47 | GO:0071850 | Mitotic cell cycle arrest | GO:0008541 | Proteasome regulatory particle, lid subcomplex | GO:0052173 | Response to defenses of other organism involved in symbiotic interaction | GO:0005416 | Amino acid: cation symporter activity | GO:0016725 | Oxidoreductase activity, acting on CH or CH2 groups |
| 48 | GO:0071014 | Post-mRNA release spliceosomal complex | GO:0031095 | Platelet dense tubular network membrane | GO:0038085 | Vascular endothelial growth factor binding | GO:0006825 | Copper ion transport | GO:0002335 | Mature B cell differentiation |
| 49 | GO:0008242 | Omega peptidase activity | GO:0016712 | Oxidoreductase activity, acting on paired donors, with incorporation or reduction of molecular oxygen, reduced flavin or flavoprotein as one donor, and incorporation of one atom of oxygen | GO:0005310 | Dicarboxylic acid transmembrane transporter activity | GO:0002857 | Positive regulation of natural killer cell-mediated immune response to tumor cell | GO:0009111 | Vitamin catabolic process |
| 50 | GO:0043966 | histone H3 acetylation | GO:0050859 | Negative regulation of B cell receptor signaling pathway | GO:2000270 | Negative regulation of fibroblast apoptotic process | GO:0000185 | Activation of MAPKKK activity | GO:0019843 | rRNA binding |
Publisher’s Note: MDPI stays neutral with regard to jurisdictional claims in published maps and institutional affiliations. |
© 2021 by the authors. Licensee MDPI, Basel, Switzerland. This article is an open access article distributed under the terms and conditions of the Creative Commons Attribution (CC BY) license (https://creativecommons.org/licenses/by/4.0/).
Share and Cite
Su, K.-M.; Gao, H.-W.; Chang, C.-M.; Lu, K.-H.; Yu, M.-H.; Lin, Y.-H.; Liu, L.-C.; Chang, C.-C.; Li, Y.-F.; Chang, C.-C. Synergistic AHR Binding Pathway with EMT Effects on Serous Ovarian Tumors Recognized by Multidisciplinary Integrated Analysis. Biomedicines 2021, 9, 866. https://doi.org/10.3390/biomedicines9080866
Su K-M, Gao H-W, Chang C-M, Lu K-H, Yu M-H, Lin Y-H, Liu L-C, Chang C-C, Li Y-F, Chang C-C. Synergistic AHR Binding Pathway with EMT Effects on Serous Ovarian Tumors Recognized by Multidisciplinary Integrated Analysis. Biomedicines. 2021; 9(8):866. https://doi.org/10.3390/biomedicines9080866
Chicago/Turabian StyleSu, Kuo-Min, Hong-Wei Gao, Chia-Ming Chang, Kai-Hsi Lu, Mu-Hsien Yu, Yi-Hsin Lin, Li-Chun Liu, Chia-Ching Chang, Yao-Feng Li, and Cheng-Chang Chang. 2021. "Synergistic AHR Binding Pathway with EMT Effects on Serous Ovarian Tumors Recognized by Multidisciplinary Integrated Analysis" Biomedicines 9, no. 8: 866. https://doi.org/10.3390/biomedicines9080866