
Mitochondrial Alterations in Fibroblasts of Early Stage Bipolar Disorder Patients

 , , and
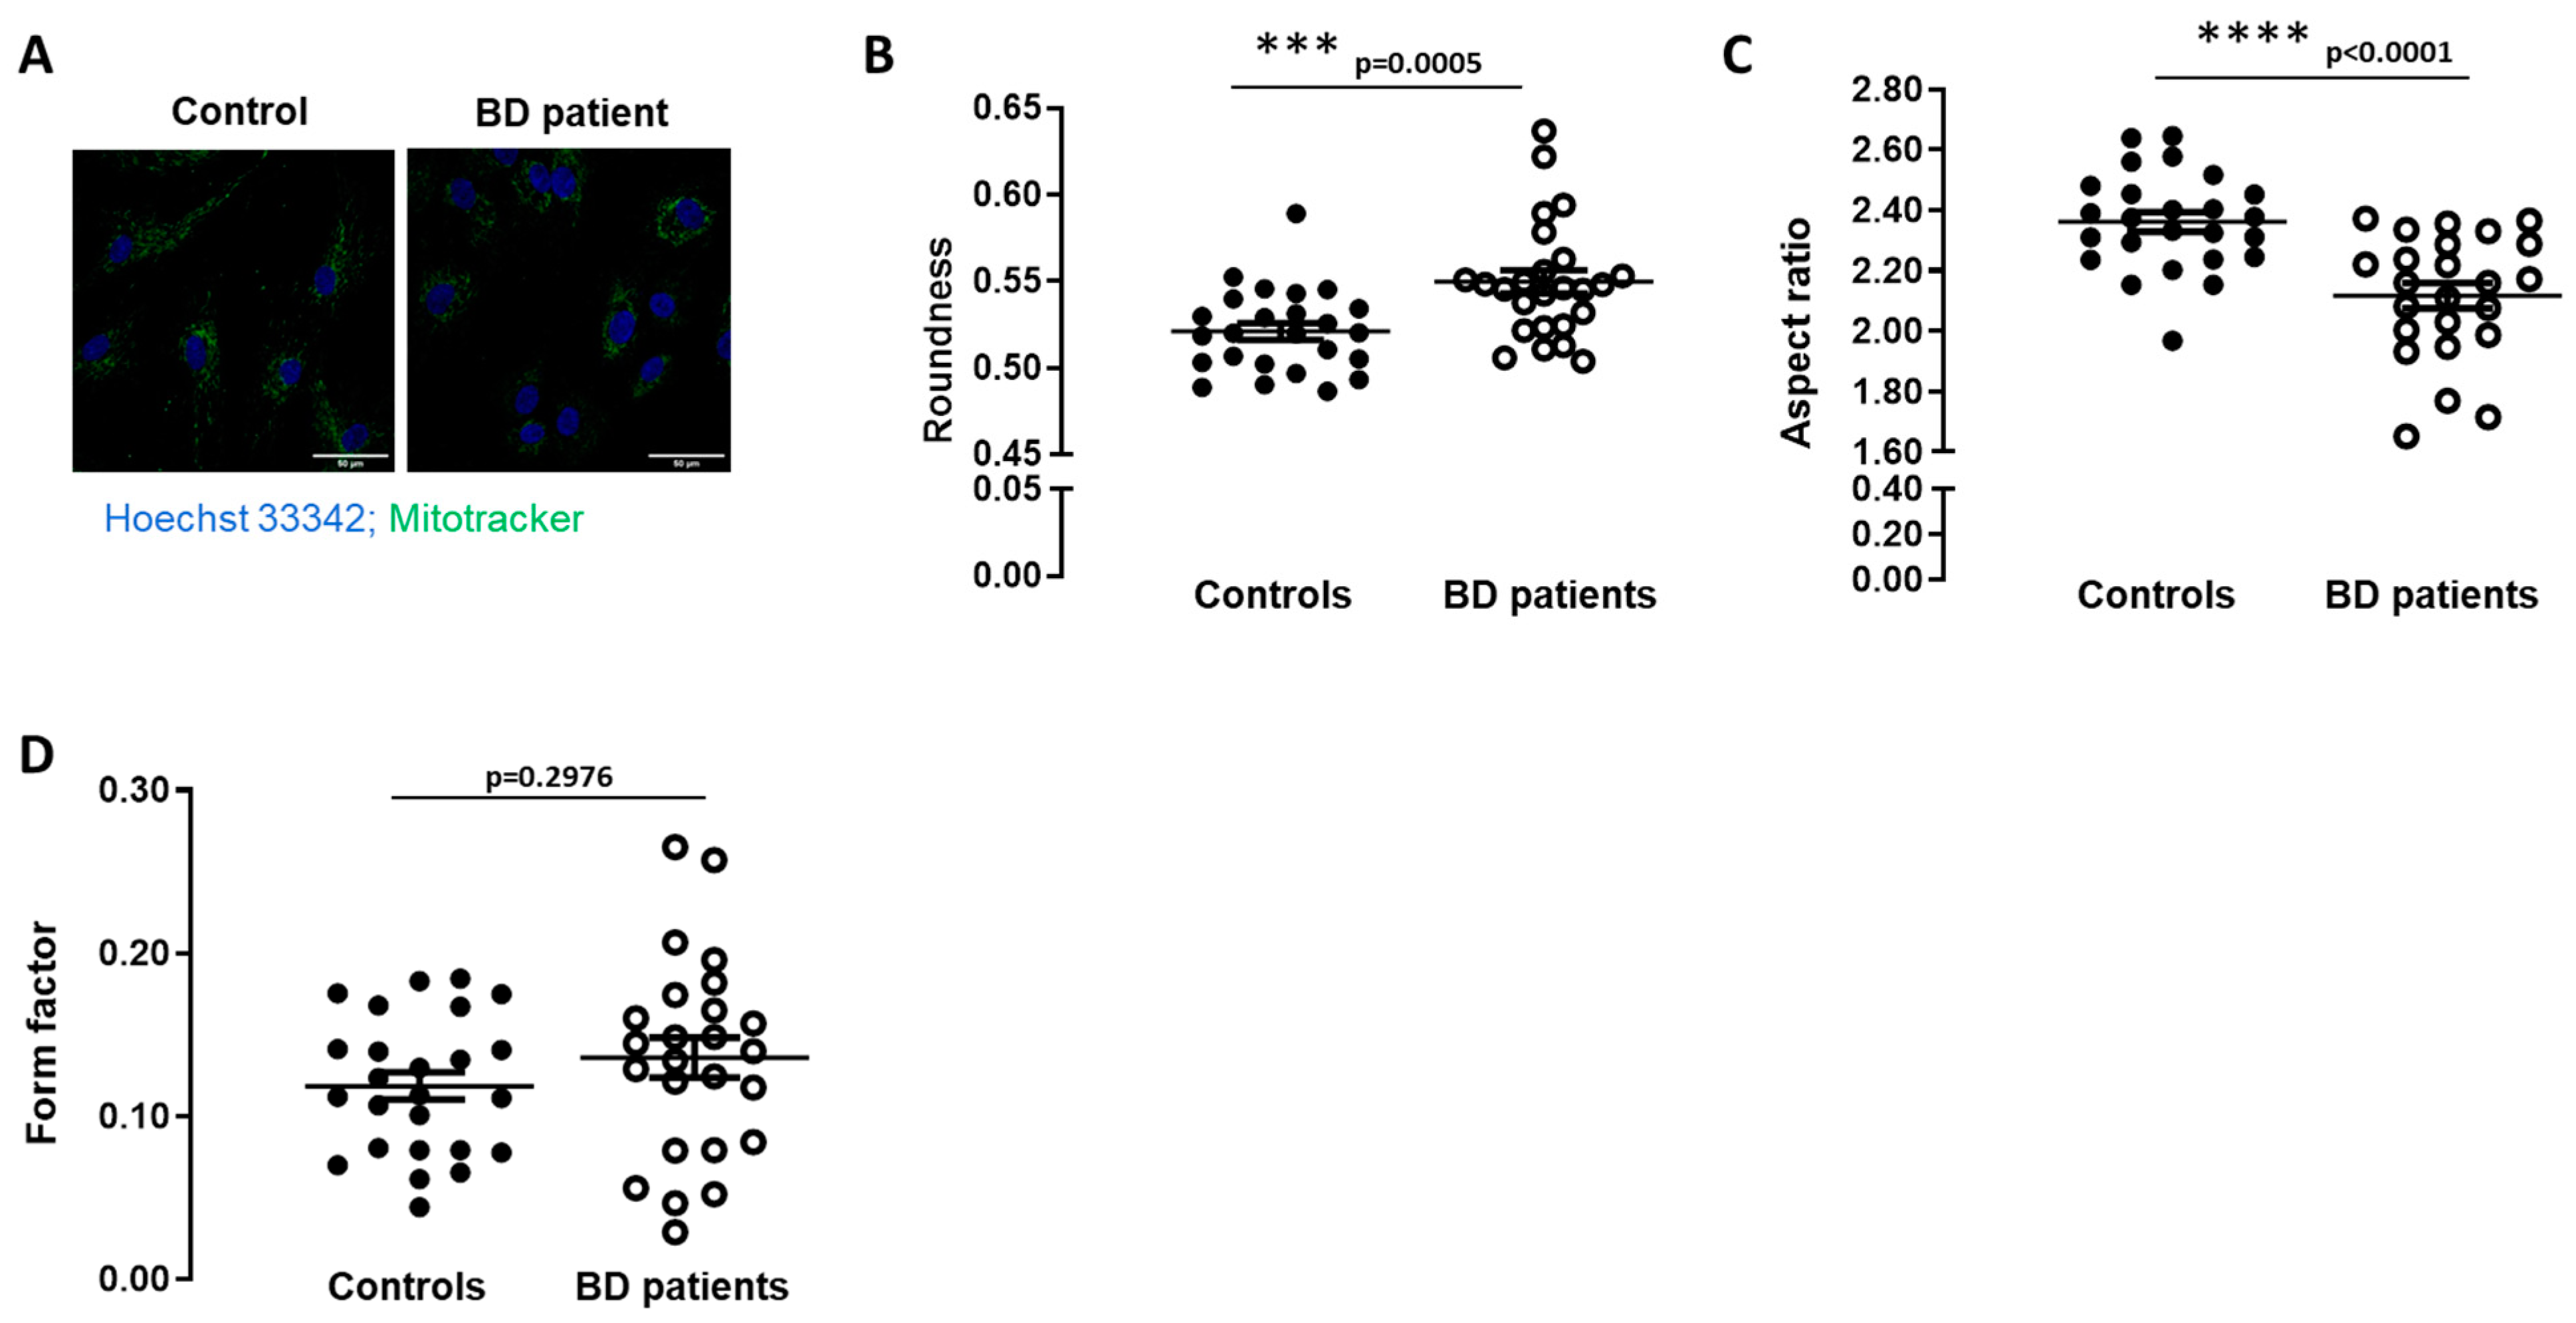
Abstract
:1. Introduction
2. Experimental Section
2.1. Patients and Fibroblasts Cell Culture
2.2. Mitochondria Morphology Analysis
Image Processing
2.3. Immunocytochemistry
2.4. Mitochondrial Membrane Potential
2.5. Protein Isolation and Western Blot Analysis
2.6. Seahorse XF24 Extracellular Flux Analyzer Measurements
2.7. Data Analysis
3. Results
3.1. Mitochondrial Morphology Is Altered in BD Patients-Derived Fibroblasts
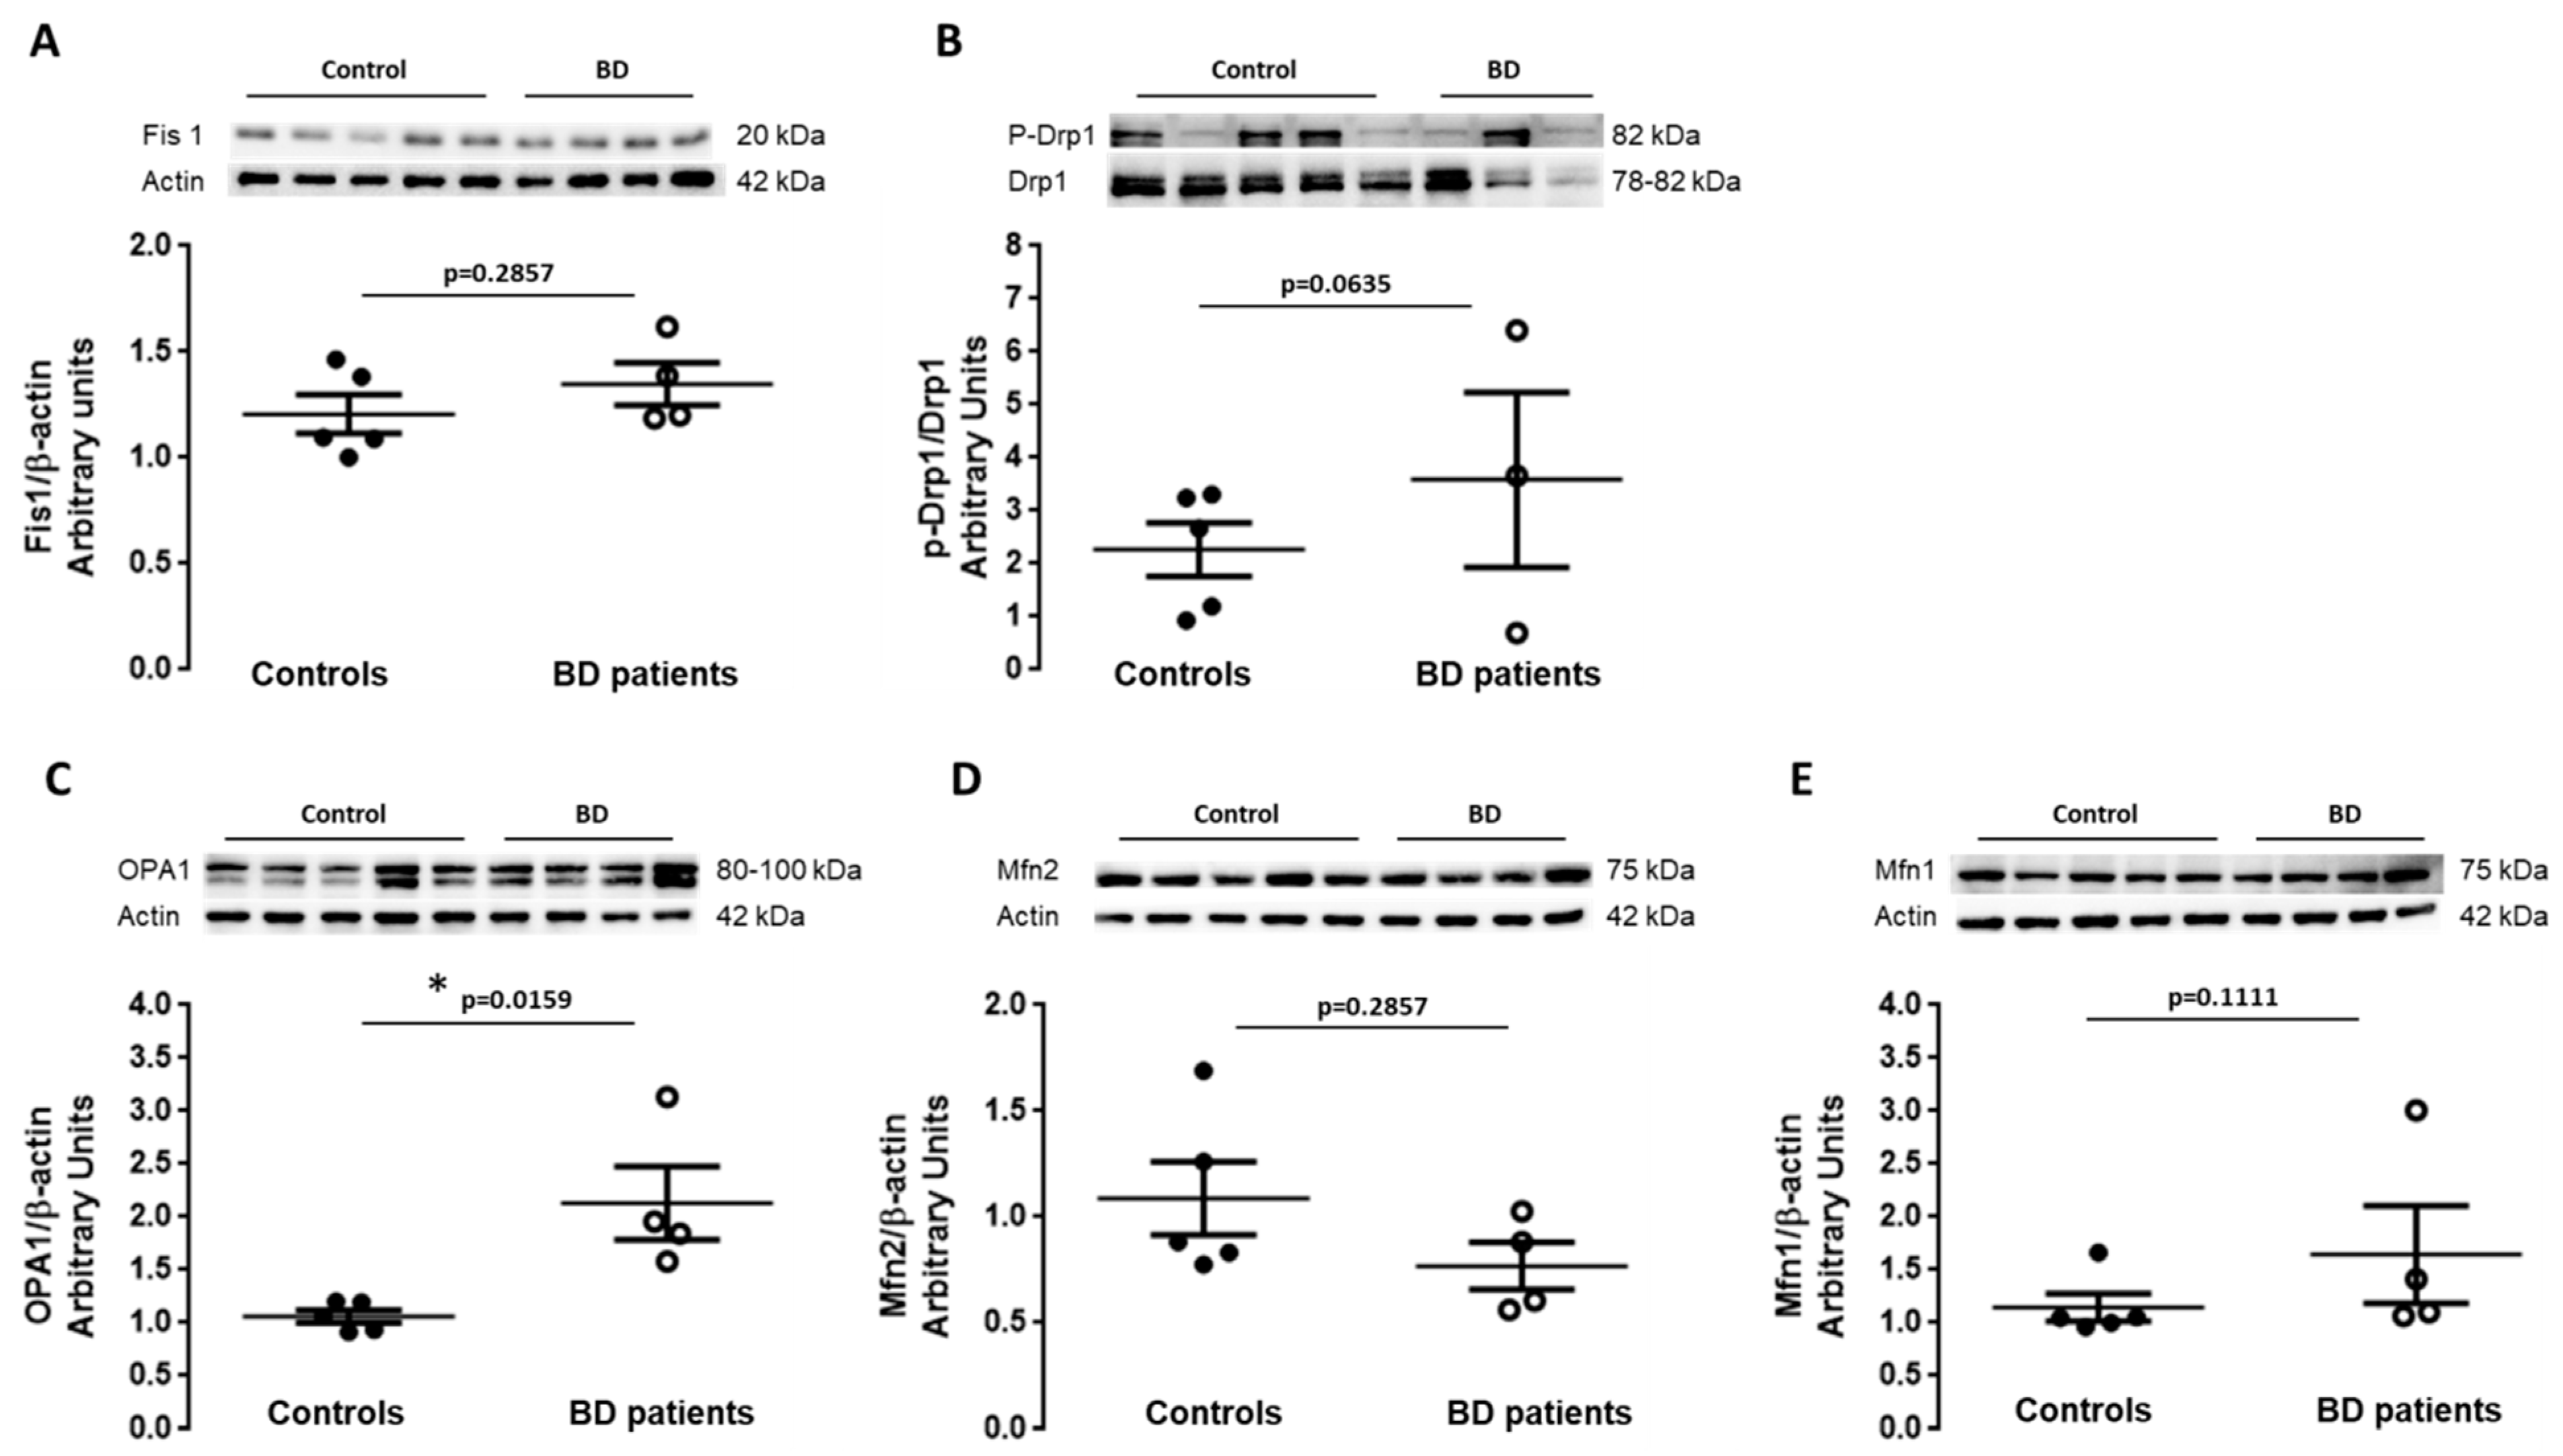
3.2. Balance between Fission and Fusion Is Disrupted in BD Patients-Derived Fibroblasts
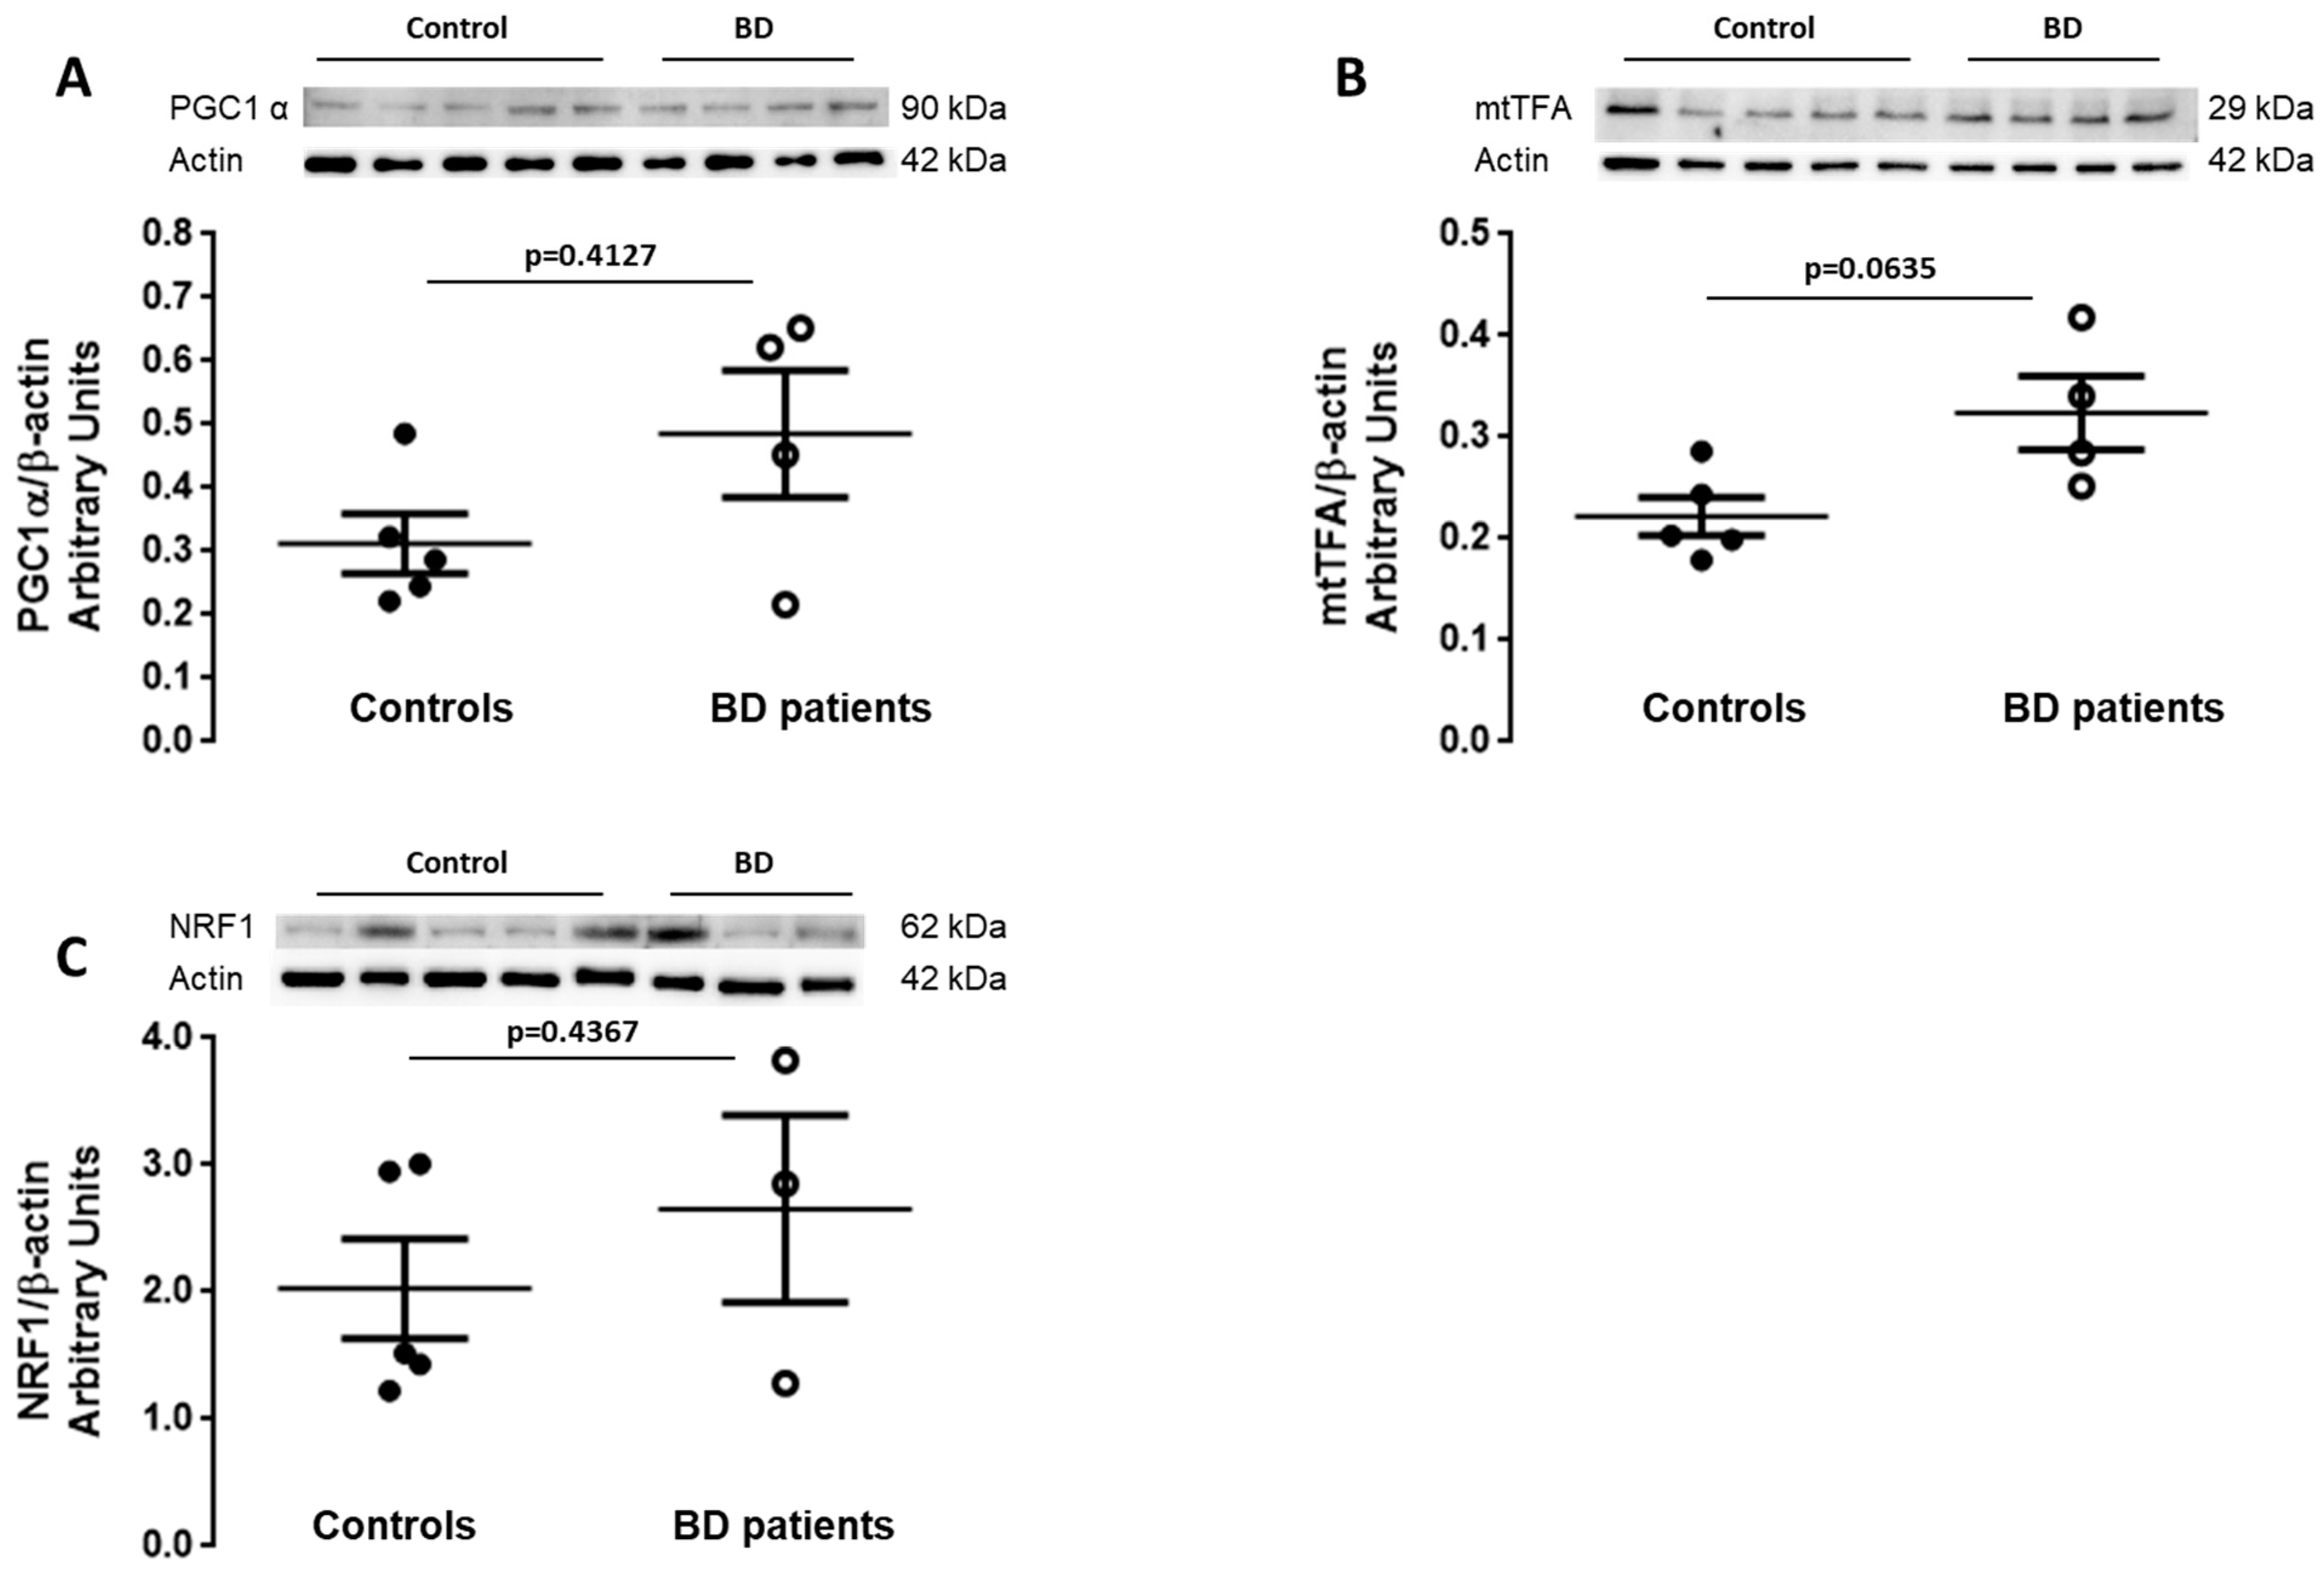
3.3. Mitochondrial Biogenesis Is Increased in BD Patients-Derived Fibroblasts
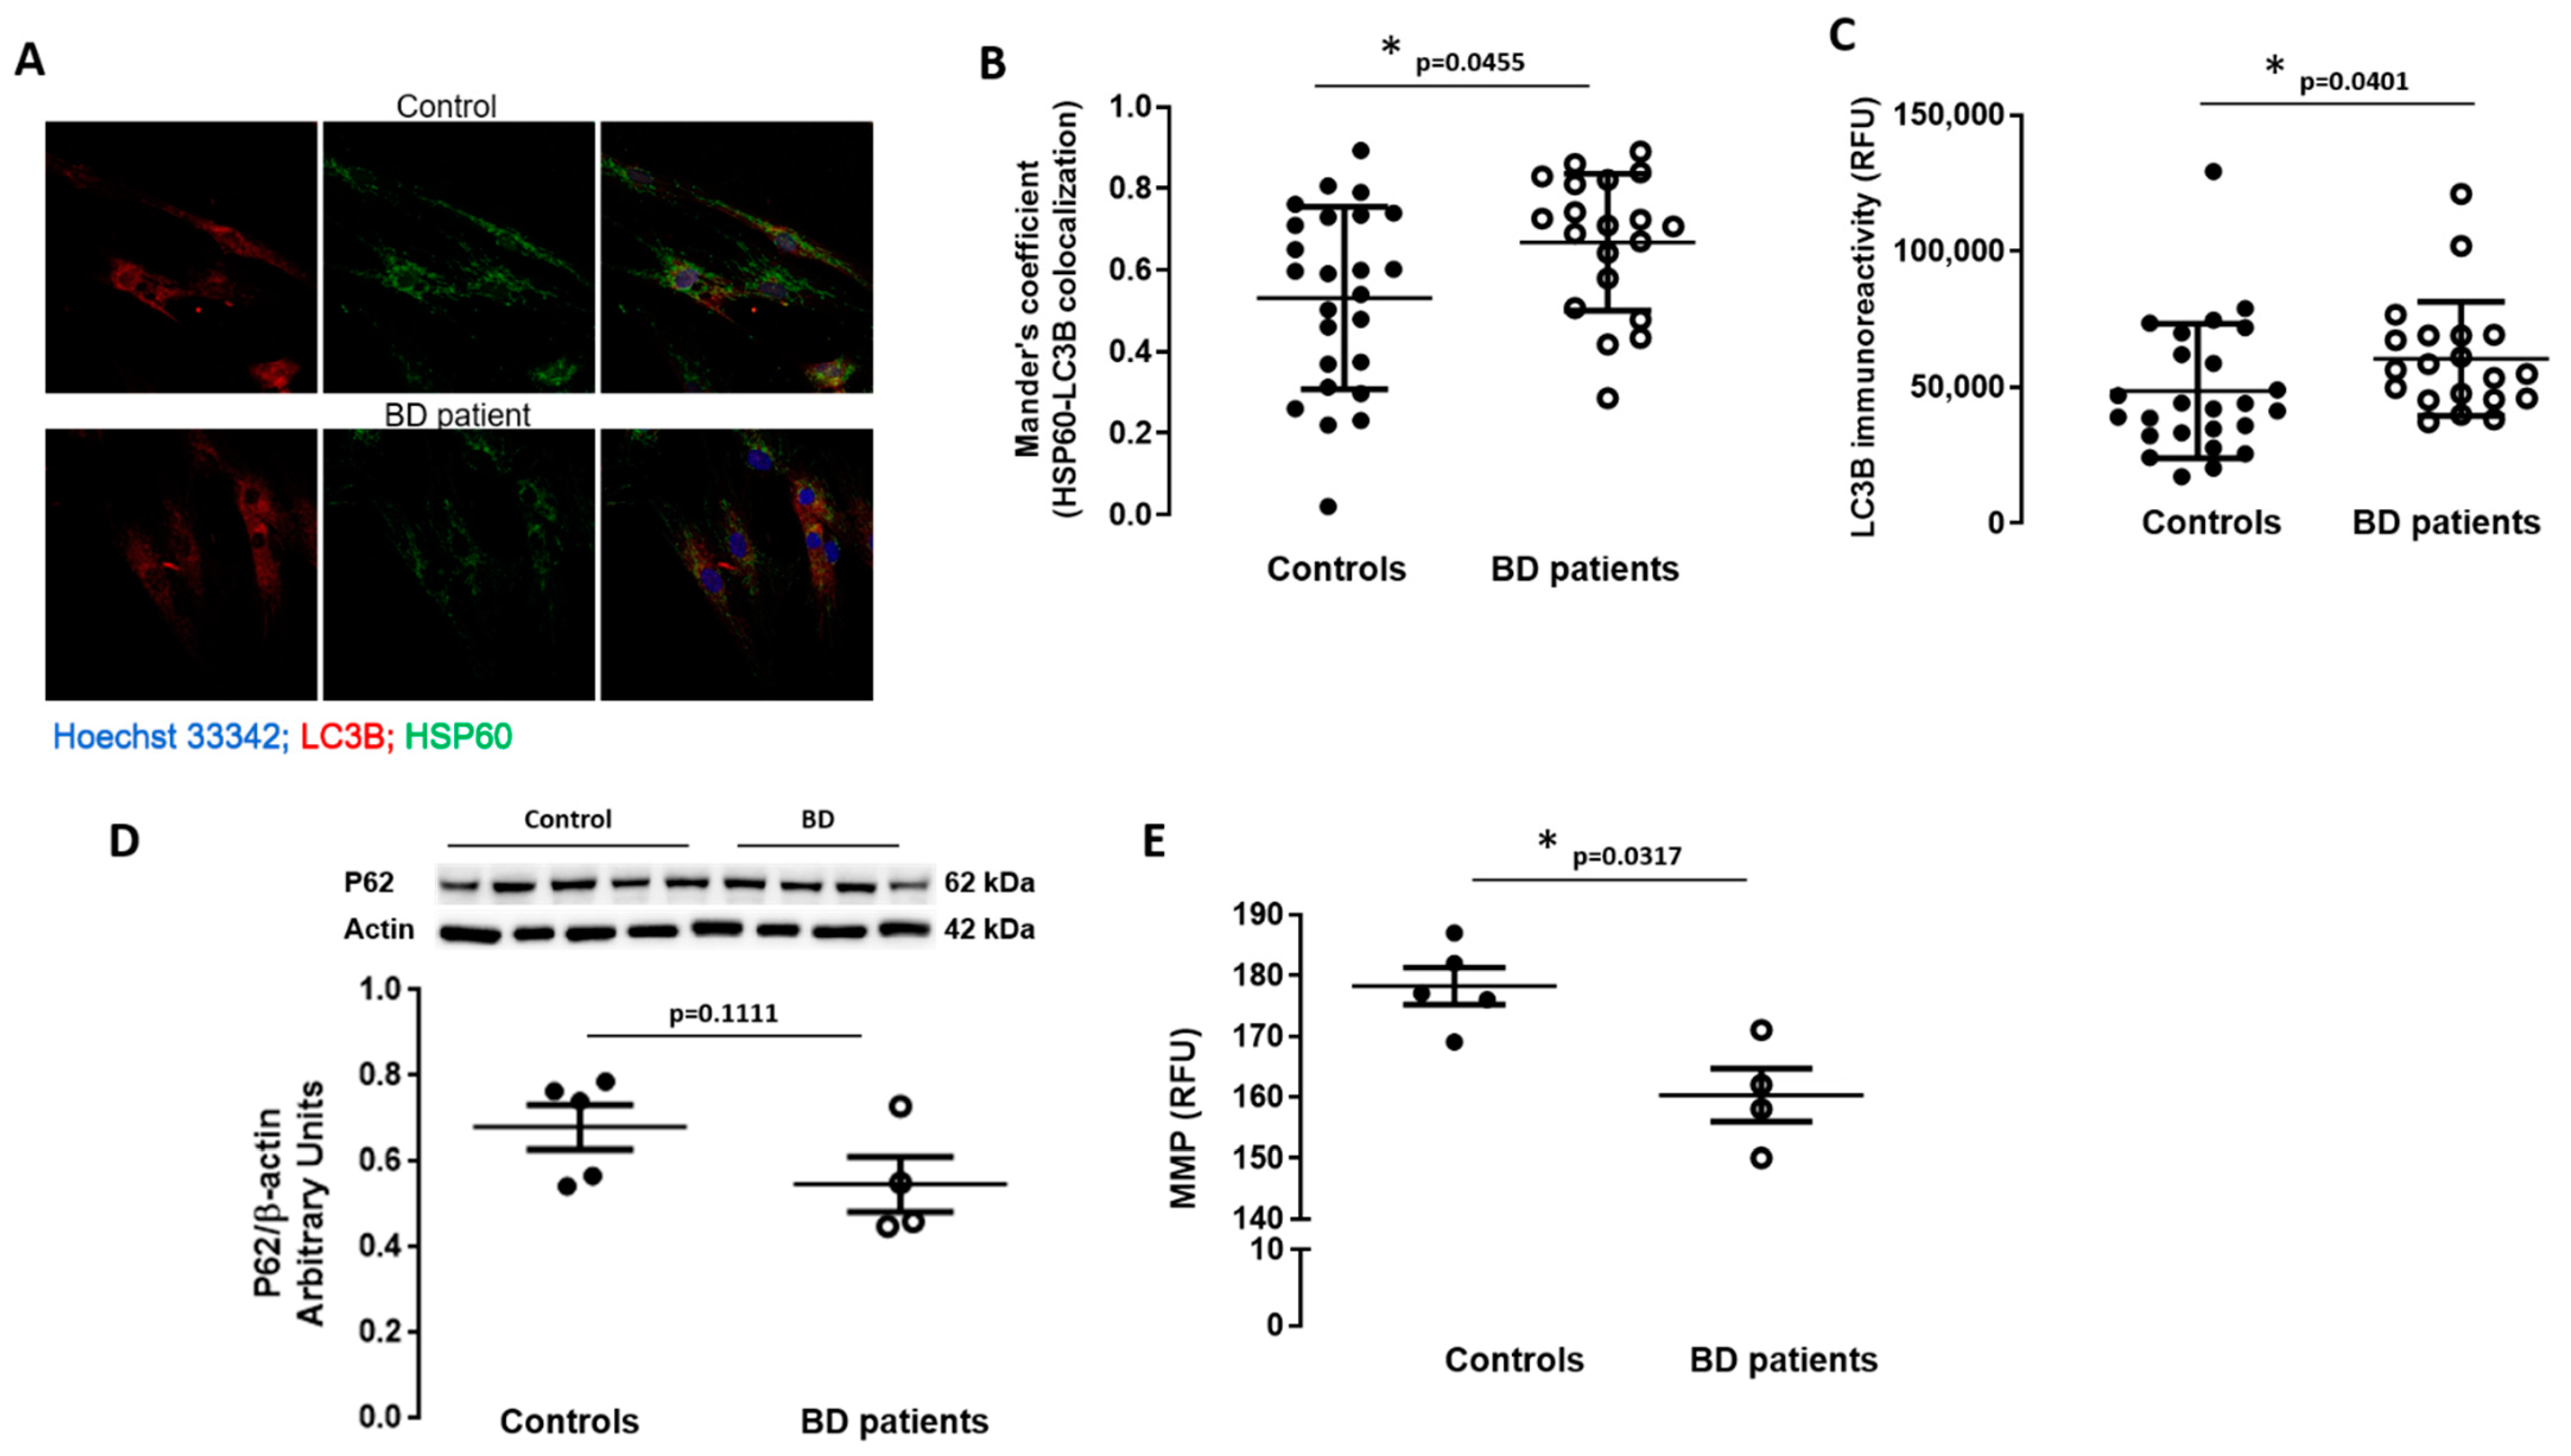
3.4. Macroautophagy and Mitophagy Are Stimulated in BD Patients-Derived Fibroblasts
3.5. Mitochondrial Membrane Depolarization in BD Patients-Derived Fibroblasts
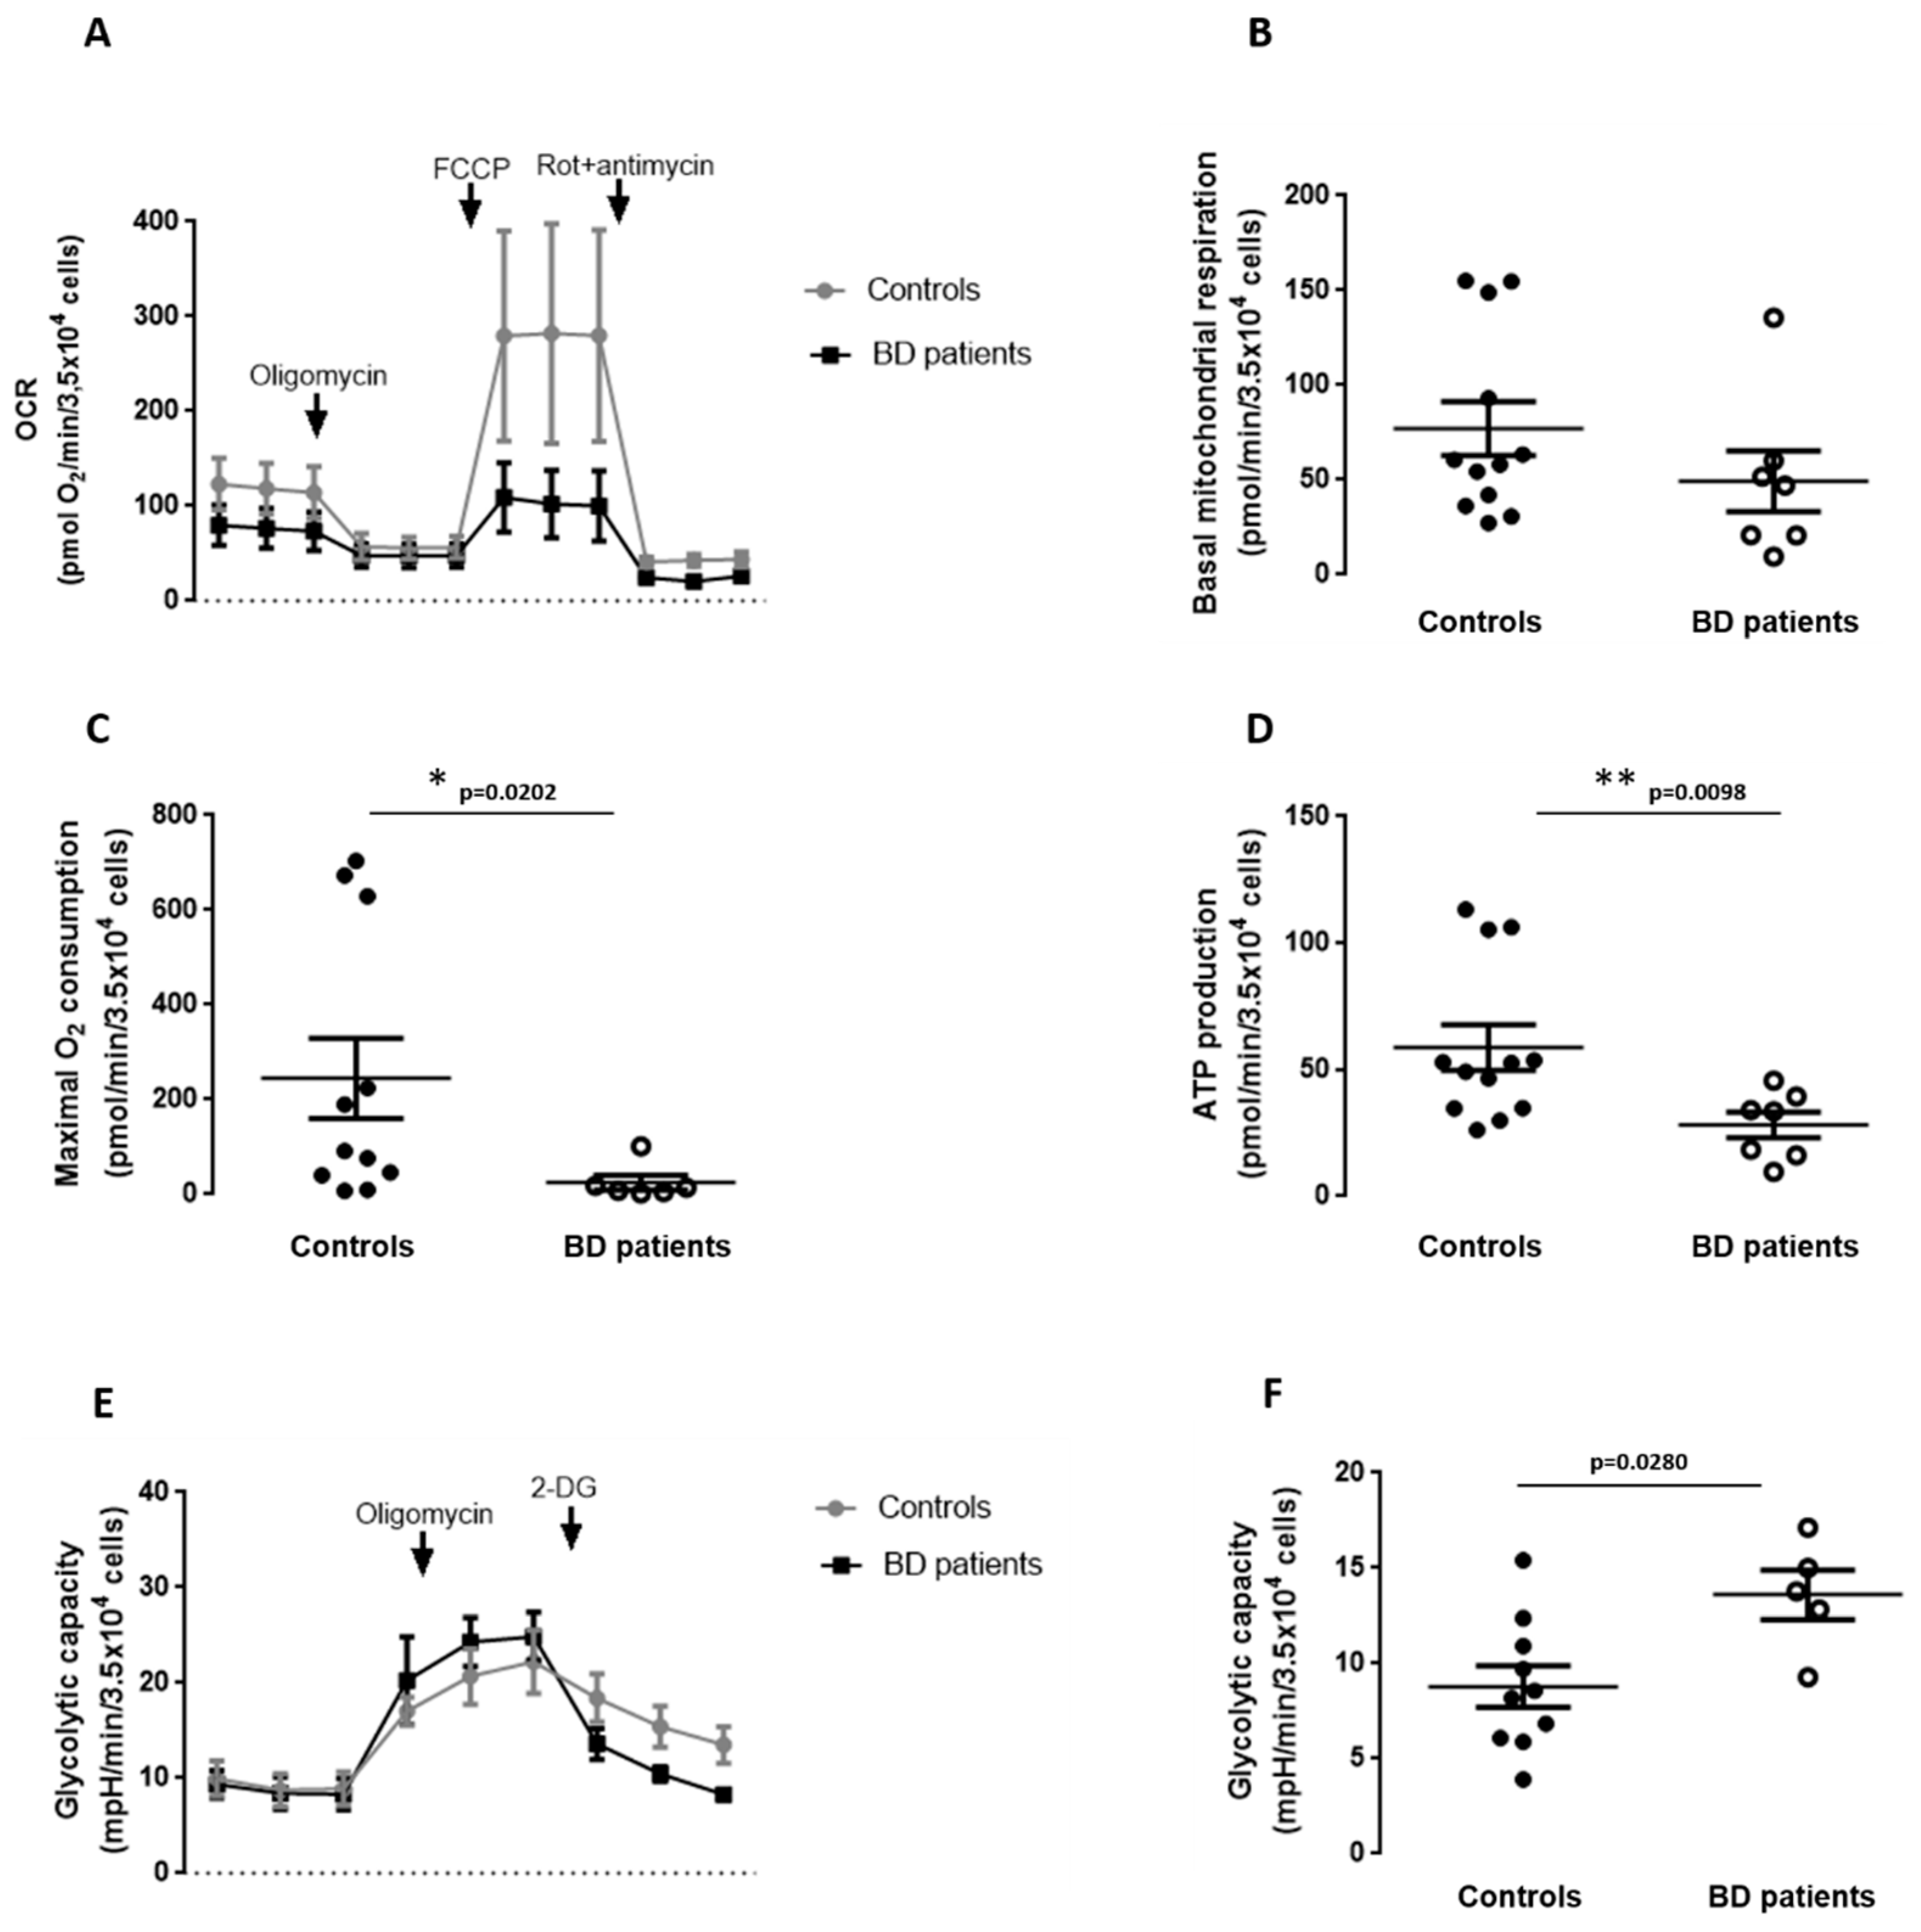
3.6. Mitochondrial Respiration and Glycolytic Capacity in BD Patients-Derived Fibroblasts
4. Discussion
Author Contributions
Funding
Institutional Review Board Statement
Informed Consent Statement
Data Availability Statement
Conflicts of Interest
References
- James, S.L.; Abate, D.; Abate, K.H.; Abay, S.M.; Abbafati, C.; Abbasi, N.; Abbastabar, H.; Abd-Allah, F.; Abdela, J.; Abdelalim, A.; et al. GBD 2017 Disease and Injury Incidence and Prevalence Collaborators. Global, regional, and national incidence, prevalence, and years lived with disability for 354 diseases and injuries for 195 countries and territories, 1990–2017: A systematic analy-sis for the Global Burden of Disease Study 2017. Lancet 2018, 392, 1789–1858. [Google Scholar] [CrossRef] [Green Version]
- Vieta, E.; Berk, M.; Schulze, T.G.; Carvalho, A.F.; Suppes, T.; Calabrese, J.R.; Gao, K.; Miskowiak, K.W.; Grande, I. Bipolar disorders. Nat. Rev. Dis. Prim. 2018, 4, 18008. [Google Scholar] [CrossRef] [PubMed]
- Merikangas, K.R.; Jin, R.; He, J.-P.; Kessler, R.C.; Lee, S.; Sampson, N.A.; Viana, M.C.; Andrade, L.H.; Hu, C.; Karam, E.G.; et al. Prevalence and Correlates of Bipolar Spectrum Disorder in the World Mental Health Survey Initiative. Arch. Gen. Psychiatry 2011, 68, 241–251. [Google Scholar] [CrossRef] [PubMed]
- López-Muñoz, F.; Shen, W.W.; D’Ocon, P.; Romero, A.; Álamo, C. A History of the Pharmacological Treatment of Bipolar Disorder. Int. J. Mol. Sci. 2018, 19, 2143. [Google Scholar] [CrossRef] [PubMed] [Green Version]
- Oliveira, P.M.S.; Santos, V.; Coroa, M.; Ribeiro, J.; Madeira, N. Serum uric acid as a predictor of bipolarity in individuals with a major depressive episode. Bipolar Disord. 2019, 21, 235–243. [Google Scholar] [CrossRef] [PubMed]
- Muneer, A. The Discovery of Clinically Applicable Biomarkers for Bipolar Disorder: A Review of Candidate and Proteomic Approaches. Chonnam Med. J. 2020, 56, 166–179. [Google Scholar] [CrossRef]
- Dagani, J.; Signorini, G.; Nielssen, O.; Bani, M.; Pastore, A.; De Girolamo, G.; Large, M. Meta-analysis of the Interval between the Onset and Management of Bipolar Disorder. Can. J. Psychiatry 2017, 62, 247–258. [Google Scholar] [CrossRef] [PubMed] [Green Version]
- Resende, R.; Fernandes, T.; Pereira, A.; De Pascale, J.; Marques, A.; Oliveira, P.; Morais, S.; Santos, V.; Madeira, N.; Pereira, C.; et al. Mitochondria, endoplasmic reticulum and innate immune dysfunction in mood disorders: Do Mitochondria-Associated Membranes (MAMs) play a role? Biochim. Biophys. Acta Mol. Basis Dis. 2020, 1866, 165752. [Google Scholar] [CrossRef]
- Okazaki, S.; Numata, S.; Otsuka, I.; Horai, T.; Kinoshita, M.; Sora, I.; Ohmori, T.; Hishimoto, A. Decelerated epigenetic aging associated with mood stabilizers in the blood of patients with bipolar disorder. Transl. Psychiatry 2020, 10, 129. [Google Scholar] [CrossRef]
- Pereira, A.C.; Oliveira, J.; Silva, S.; Madeira, N.; Pereira, C.M.; Cruz, M.T. Inflammation in Bipolar Disorder (BD): Identification of new therapeutic targets. Pharmacol. Res. 2021, 163, 105325. [Google Scholar] [CrossRef]
- Scaini, G.; Andrews, T.; Lima, C.N.; Benevenuto, D.; Streck, E.L.; Quevedo, J. Mitochondrial dysfunction as a critical event in the pathophysiology of bipolar disorder. Mitochondrion 2021, 57, 23–36. [Google Scholar] [CrossRef]
- Colasanti, A.; Bugiardini, E.; Amawi, S.; Poole, O.V.; Skorupinska, I.; Skorupinska, M.; Germain, L.; Kozyra, D.; Holmes, S.; James, N.; et al. Primary mitochondrial diseases increase susceptibility to bipolar affective disorder. J. Neurol. Neurosurg. Psychiatry 2020, 91, 892–894. [Google Scholar] [CrossRef] [PubMed]
- Ma, K.; Chen, G.; Li, W.; Kepp, O.; Zhu, Y.; Chen, Q. Mitophagy, Mitochondrial Homeostasis, and Cell Fate. Front. Cell Dev. Biol. 2020, 8, 467. [Google Scholar] [CrossRef]
- Dager, S.R.; Friedman, S.D.; Parow, A.; Demopulos, C.; Stoll, A.L.; Lyoo, I.K.; Dunner, D.L.; Renshaw, P.F. Brain Metabolic Alterations in Medication-Free Patients With BipolarDisorder. Arch. Gen. Psychiatry 2004, 61, 450–458. [Google Scholar] [CrossRef] [PubMed] [Green Version]
- Konradi, C.; Eaton, M.; Macdonald, M.L.; Walsh, J.; Benes, F.M.; Heckers, S. Molecular Evidence for Mitochondrial Dysfunction in Bipolar Disorder. Arch. Gen. Psychiatry 2004, 61, 300–308. [Google Scholar] [CrossRef] [PubMed] [Green Version]
- Sun, X.; Wang, J.-F.; Tseng, M.; Young, L.T. Downregulation in components of the mitochondrial electron transport chain in the postmortem frontal cortex of subjects with bipolar disorder. J. Psychiatry Neurosci. 2006, 31, 189–196. [Google Scholar]
- Iwamoto, K.; Kakiuchi, C.; Bundo, M.; Ikeda, K.; Kato, T. Molecular characterization of bipolar disorder by comparing gene expression profiles of postmortem brains of major mental disorders. Mol. Psychiatry 2004, 9, 406–416. [Google Scholar] [CrossRef] [PubMed] [Green Version]
- Andreazza, A.C.; Shao, L.; Wang, J.-F.; Young, L.T. Mitochondrial Complex I Activity and Oxidative Damage to Mitochondrial Proteins in the Prefrontal Cortex of Patients with Bipolar Disorder. Arch. Gen. Psychiatry 2010, 67, 360–368. [Google Scholar] [CrossRef] [PubMed] [Green Version]
- Rugarli, E.I.; Langer, T. Mitochondrial quality control: A matter of life and death for neurons. EMBO J. 2012, 31, 1336–1349. [Google Scholar] [CrossRef] [Green Version]
- Cataldo, A.M.; McPhie, D.L.; Lange, N.T.; Punzell, S.; Elmiligy, S.; Ye, N.Z.; Froimowitz, M.P.; Hassinger, L.C.; Menesale, E.B.; Sargent, L.W.; et al. Abnormalities in Mitochondrial Structure in Cells from Patients with Bipolar Disorder. Am. J. Pathol. 2010, 177, 575–585. [Google Scholar] [CrossRef] [Green Version]
- Mertens, J.; Wang, Q.-W.; Kim, Y.; Yu, D.X.; Pham, S.; Yang, B.; Zheng, Y.; Diffenderfer, K.E.; Zhang, J.; The Pharmacogenomics of Bipolar Disorder Study; et al. Differential responses to lithium in hyperexcitable neurons from patients with bipolar disorder. Nat. Cell Biol. 2015, 527, 95–99. [Google Scholar] [CrossRef] [Green Version]
- Scaini, G.; Fries, G.R.; Valvassori, S.S.; Zeni, C.P.; Zunta-Soares, G.; Berk, M.; Soares, J.C.; Quevedo, J. Perturbations in the apoptotic pathway and mitochondrial network dynamics in peripheral blood mononuclear cells from bipolar disorder patients. Transl. Psychiatry 2017, 7, e1111. [Google Scholar] [CrossRef] [PubMed] [Green Version]
- Scaini, G.; Barichello, T.; Fries, G.R.; Kennon, E.A.; Andrews, T.; Nix, B.R.; Zunta-Soares, G.; Valvassori, S.S.; Soares, J.C.; Quevedo, J. TSPO upregulation in bipolar disorder and concomitant downregulation of mitophagic proteins and NLRP3 inflammasome activation. Neuropsychopharmacology 2019, 44, 1291–1299. [Google Scholar] [CrossRef] [PubMed]
- Berk, M.; Post, R.; Ratheesh, A.; Gliddon, E.; Singh, A.; Vieta, E.; Carvalho, A.F.; Ashton, M.M.; Berk, L.; Cotton, S.M.; et al. Staging in bipolar disorder: From theoretical framework to clinical utility. World Psychiatry 2017, 16, 236–244. [Google Scholar] [CrossRef]
- American Psychiatric Association. Diagnostic and Statistical Manual of Mental Disorders, 5th ed.; American Psychiatric Association: Arlington, VA, USA, 2013. [Google Scholar]
- Martins, M.J.; Palmeira, L.; Xavier, A.; Castilho, P.; Macedo, A.; Pereira, A.T.; Pinto, A.M.; Carreiras, D.; Barreto-Carvalho, C. The Clinical Interview for Psychotic Disorders (CIPD): Preliminary results on interrater agreement, reliability and qualitative feedback. Psychiatry Res. 2019, 272, 723–729. [Google Scholar] [CrossRef] [PubMed]
- Onofre, I.; Mendonça, N.; Lopes, S.; Nobre, R.; De Melo, J.B.; Carreira, I.M.; Januário, C.; Gonçalves, A.F.; De Almeida, L.P. Fibroblasts of Machado Joseph Disease patients reveal autophagy impairment. Sci. Rep. 2016, 6, 28220. [Google Scholar] [CrossRef] [PubMed]
- Naia, L.; Carmo, C.; Campesan, S.; Fão, L.; Cotton, V.E.; Valero, J.; Lopes, C.; Rosenstock, T.R.; Giorgini, F.; Rego, A.C. Mitochondrial SIRT3 confers neuroprotection in Huntington’s disease by regulation of oxidative challenges and mitochondrial dynamics. Free. Radic. Biol. Med. 2021, 163, 163–179. [Google Scholar] [CrossRef]
- Bolte, S.; Cordelières, F.P. A guided tour into subcellular colocalization analysis in light microscopy. J. Microsc. 2006, 224, 213–232. [Google Scholar] [CrossRef]
- Pereira, A.C.; Resende, R.; Morais, S.; Madeira, N.; Pereira, C.F. The ups and downs of cellular stress: The “MAM hypothesis” for Bipolar disorder pathophysiology. Int. J. Clin. Neurosci. Ment. Heal. 2017, 4, S04. [Google Scholar] [CrossRef] [Green Version]
- Resende, R.; Ferreira-Marques, M.; Moreira, P.; Coimbra, J.R.; Baptista, S.J.; Isidoro, C.; Salvador, J.A.; Dinis, T.C.; Pereira, C.F.; Santos, A.E. New BACE1 Chimeric Peptide Inhibitors Selectively Prevent AβPPβ Cleavage Decreasing Amyloid-β Production and Accumulation in Alzheimer’s Disease Models. J. Alzheimer’s Dis. 2020, 76, 1–21. [Google Scholar] [CrossRef]
- Kornmann, B. Quality control in mitochondria: Use it, break it, fix it, trash it. F1000Prime Rep. 2014, 6. [Google Scholar] [CrossRef] [PubMed]
- Liu, Y.J.; McIntyre, R.L.; Janssens, G.E.; Houtkooper, R.H. Mitochondrial fission and fusion: A dynamic role in aging and potential target for age-related disease. Mech. Ageing Dev. 2020, 186, 111212. [Google Scholar] [CrossRef]
- Gureev, A.P.; Shaforostova, E.A.; Popov, V.N. Regulation of Mitochondrial Biogenesis as a Way for Active Longevity: Interaction Between the Nrf2 and PGC-1α Signaling Pathways. Front. Genet. 2019, 10, 435. [Google Scholar] [CrossRef] [Green Version]
- Chen, G.; Kroemer, G.; Kepp, O. Mitophagy: An Emerging Role in Aging and Age-Associated Diseases. Front. Cell Dev. Biol. 2020, 8, 200. [Google Scholar] [CrossRef] [Green Version]
- Viswanath, B.; Jose, S.P.; Squassina, A.; Thirthalli, J.; Purushottam, M.; Mukherjee, O.; Vladimirov, V.; Patrinos, G.P.; Del Zompo, M.; Jain, S. Cellular models to study bipolar disorder: A systematic review. J. Affect. Disord. 2015, 184, 36–50. [Google Scholar] [CrossRef]
- Kálmán, S.; Garbett, K.A.; Janka, Z.; Mirnics, K. Human dermal fibroblasts in psychiatry research. Neuroscience 2016, 320, 105–121. [Google Scholar] [CrossRef] [Green Version]
- Kim, Y.; Santos, R.; Gage, F.H.; Marchetto, M.C. Molecular Mechanisms of Bipolar Disorder: Progress Made and Future Challenges. Front. Cell. Neurosci. 2017, 11, 30. [Google Scholar] [CrossRef] [PubMed] [Green Version]
- Zvěřová, M.; Hroudová, J.; Fišar, Z.; Hansíková, H.; Kališová, L.; Kitzlerová, E.; Lambertová, A.; Raboch, J. Disturbances of mitochondrial parameters to distinguish patients with depressive episode of bipolar disorder and major depressive disorder. Neuropsychiatr. Dis. Treat. 2019, 15, 233–240. [Google Scholar] [CrossRef] [PubMed] [Green Version]
- Wang, D.; Li, Z.; Liu, W.; Zhou, J.; Ma, X.; Tang, J.; Chen, X. Differential mitochondrial DNA copy number in three mood states of bipolar disorder. BMC Psychiatry 2018, 18, 1–8. [Google Scholar] [CrossRef] [Green Version]
- Yamaki, N.; Otsuka, I.; Numata, S.; Yanagi, M.; Mouri, K.; Okazaki, S.; Boku, S.; Horai, T.; Ohmori, T.; Shirakawa, O.; et al. Mitochondrial DNA copy number of peripheral blood in bipolar disorder: The present study and a meta-analysis. Psychiatry Res. 2018, 269, 115–117. [Google Scholar] [CrossRef]
- Tsujii, N.; Otsuka, I.; Okazaki, S.; Yanagi, M.; Numata, S.; Yamaki, N.; Kawakubo, Y.; Shirakawa, O.; Hishimoto, A. Mitochondrial DNA Copy Number Raises the Potential of Left Frontopolar Hemodynamic Response as a Diagnostic Marker for Distinguishing Bipolar Disorder From Major Depressive Disorder. Front. Psychiatry 2019, 10. [Google Scholar] [CrossRef] [PubMed]
- de Sousa, R.T.; Uno, M.; Zanetti, M.V.; Shinjo, S.M.; Busatto, G.F.; Gattaz, W.F.; Marie, S.K.; Machado-Vieira, R. Leukocyte mitochondrial DNA copy number in bipolar disorder. Prog. Neuro Psychopharmacol. Biol. Psychiatry 2014, 48, 32–35. [Google Scholar] [CrossRef] [PubMed]
- Chang, C.-C.; Jou, S.-H.; Lin, T.-T.; Liu, C.-S. Mitochondrial DNA variation and increased oxidative damage in euthymic patients with bipolar disorder. Psychiatry Clin. Neurosci. 2014, 68, 551–557. [Google Scholar] [CrossRef] [PubMed]
- Fries, G.R.; Bauer, I.E.; Scaini, G.; Wu, M.-J.; Kazimi, I.F.; Valvassori, S.S.; Zunta-Soares, G.; Walss-Bass, C.; Soares, J.C.; Quevedo, J. Accelerated epigenetic aging and mitochondrial DNA copy number in bipolar disorder. Transl. Psychiatry 2017, 7, 1283. [Google Scholar] [CrossRef]
- Vawter, M.P.; Tomita, H.; Meng, F.; Bolstad, B.; Li, J.; Evans, S.; Choudary, P.; Atz, M.; Shao, L.; Neal, C.; et al. Mitochondrial-related gene expression changes are sensitive to agonal-pH state: Implications for brain disorders. Mol. Psychiatry 2006, 11, 663–679. [Google Scholar] [CrossRef] [Green Version]
- Pham, N.-A.; Richardson, T.; Cameron, J.; Chue, B.; Robinson, B.H. Altered Mitochondrial Structure and Motion Dynamics in Living Cells with Energy Metabolism Defects Revealed by Real Time Microscope Imaging. Microsc. Microanal. 2004, 10, 247–260. [Google Scholar] [CrossRef]
- Tran, Q.; Jung, J.-H.; Park, J.; Lee, H.; Hong, Y.; Cho, H.; Kim, M.; Park, S.; Kwon, S.-H.; Kim, S.-H.; et al. S6 kinase 1 plays a key role in mitochondrial morphology and cellular energy flow. Cell. Signal. 2018, 48, 13–24. [Google Scholar] [CrossRef]
- Yetkin-Arik, B.; Vogels, I.M.C.; Nowak-Sliwinska, P.; Weiss, A.; Houtkooper, R.H.; Van Noorden, C.J.F.; Klaassen, I.; Schlingemann, R.O. The role of glycolysis and mitochondrial respiration in the formation and functioning of endothelial tip cells during angiogenesis. Sci. Rep. 2019, 9, 1–14. [Google Scholar] [CrossRef] [Green Version]
- Akarsu, S.; Torun, D.; Erdem, M.; Kozan, S.; Akar, H.; Uzun, O. Mitochondrial complex I and III mRNA levels in bipolar disorder. J. Affect. Disord. 2015, 184, 160–163. [Google Scholar] [CrossRef]
- Regenold, W.T.; Phatak, P.; Marano, C.M.; Sassan, A.; Conley, R.R.; Kling, M.A. Elevated Cerebrospinal Fluid Lactate Concentrations in Patients with Bipolar Disorder and Schizophrenia: Implications for the Mitochondrial Dysfunction Hypothesis. Biol. Psychiatry 2009, 65, 489–494. [Google Scholar] [CrossRef] [Green Version]
- Naydenov, A.V.; Macdonald, M.L.; Ongur, D.; Konradi, C. Differences in Lymphocyte Electron Transport Gene Expression Levels Between Subjects with Bipolar Disorder and Normal Controls in Response to Glucose Deprivation Stress. Arch. Gen. Psychiatry 2007, 64, 555–564. [Google Scholar] [CrossRef] [PubMed] [Green Version]
- Shi, X.-F.; Kondo, D.G.; Sung, Y.-H.; Hellem, T.L.; Fiedler, K.K.; Jeong, E.-K.; Huber, R.S.; Renshaw, P.F. Frontal lobe bioenergetic metabolism in depressed adolescents with bipolar disorder: A phosphorus-31 magnetic resonance spectroscopy study. Bipolar Disord. 2012, 14, 607–617. [Google Scholar] [CrossRef] [PubMed] [Green Version]


Publisher’s Note: MDPI stays neutral with regard to jurisdictional claims in published maps and institutional affiliations. |
© 2021 by the authors. Licensee MDPI, Basel, Switzerland. This article is an open access article distributed under the terms and conditions of the Creative Commons Attribution (CC BY) license (https://creativecommons.org/licenses/by/4.0/).
Share and Cite
Marques, A.P.; Resende, R.; Silva, D.F.; Batista, M.; Pereira, D.; Wildenberg, B.; Morais, S.; Macedo, A.; Pais, C.; Melo, J.B.; et al. Mitochondrial Alterations in Fibroblasts of Early Stage Bipolar Disorder Patients. Biomedicines 2021, 9, 522. https://doi.org/10.3390/biomedicines9050522
Marques AP, Resende R, Silva DF, Batista M, Pereira D, Wildenberg B, Morais S, Macedo A, Pais C, Melo JB, et al. Mitochondrial Alterations in Fibroblasts of Early Stage Bipolar Disorder Patients. Biomedicines. 2021; 9(5):522. https://doi.org/10.3390/biomedicines9050522
Chicago/Turabian StyleMarques, Ana P., Rosa Resende, Diana F. Silva, Mariana Batista, Daniela Pereira, Brigite Wildenberg, Sofia Morais, António Macedo, Cláudia Pais, Joana B. Melo, and et al. 2021. "Mitochondrial Alterations in Fibroblasts of Early Stage Bipolar Disorder Patients" Biomedicines 9, no. 5: 522. https://doi.org/10.3390/biomedicines9050522