
An Orthotopic Model of Uveal Melanoma in Zebrafish Embryo: A Novel Platform for Drug Evaluation

 , , and
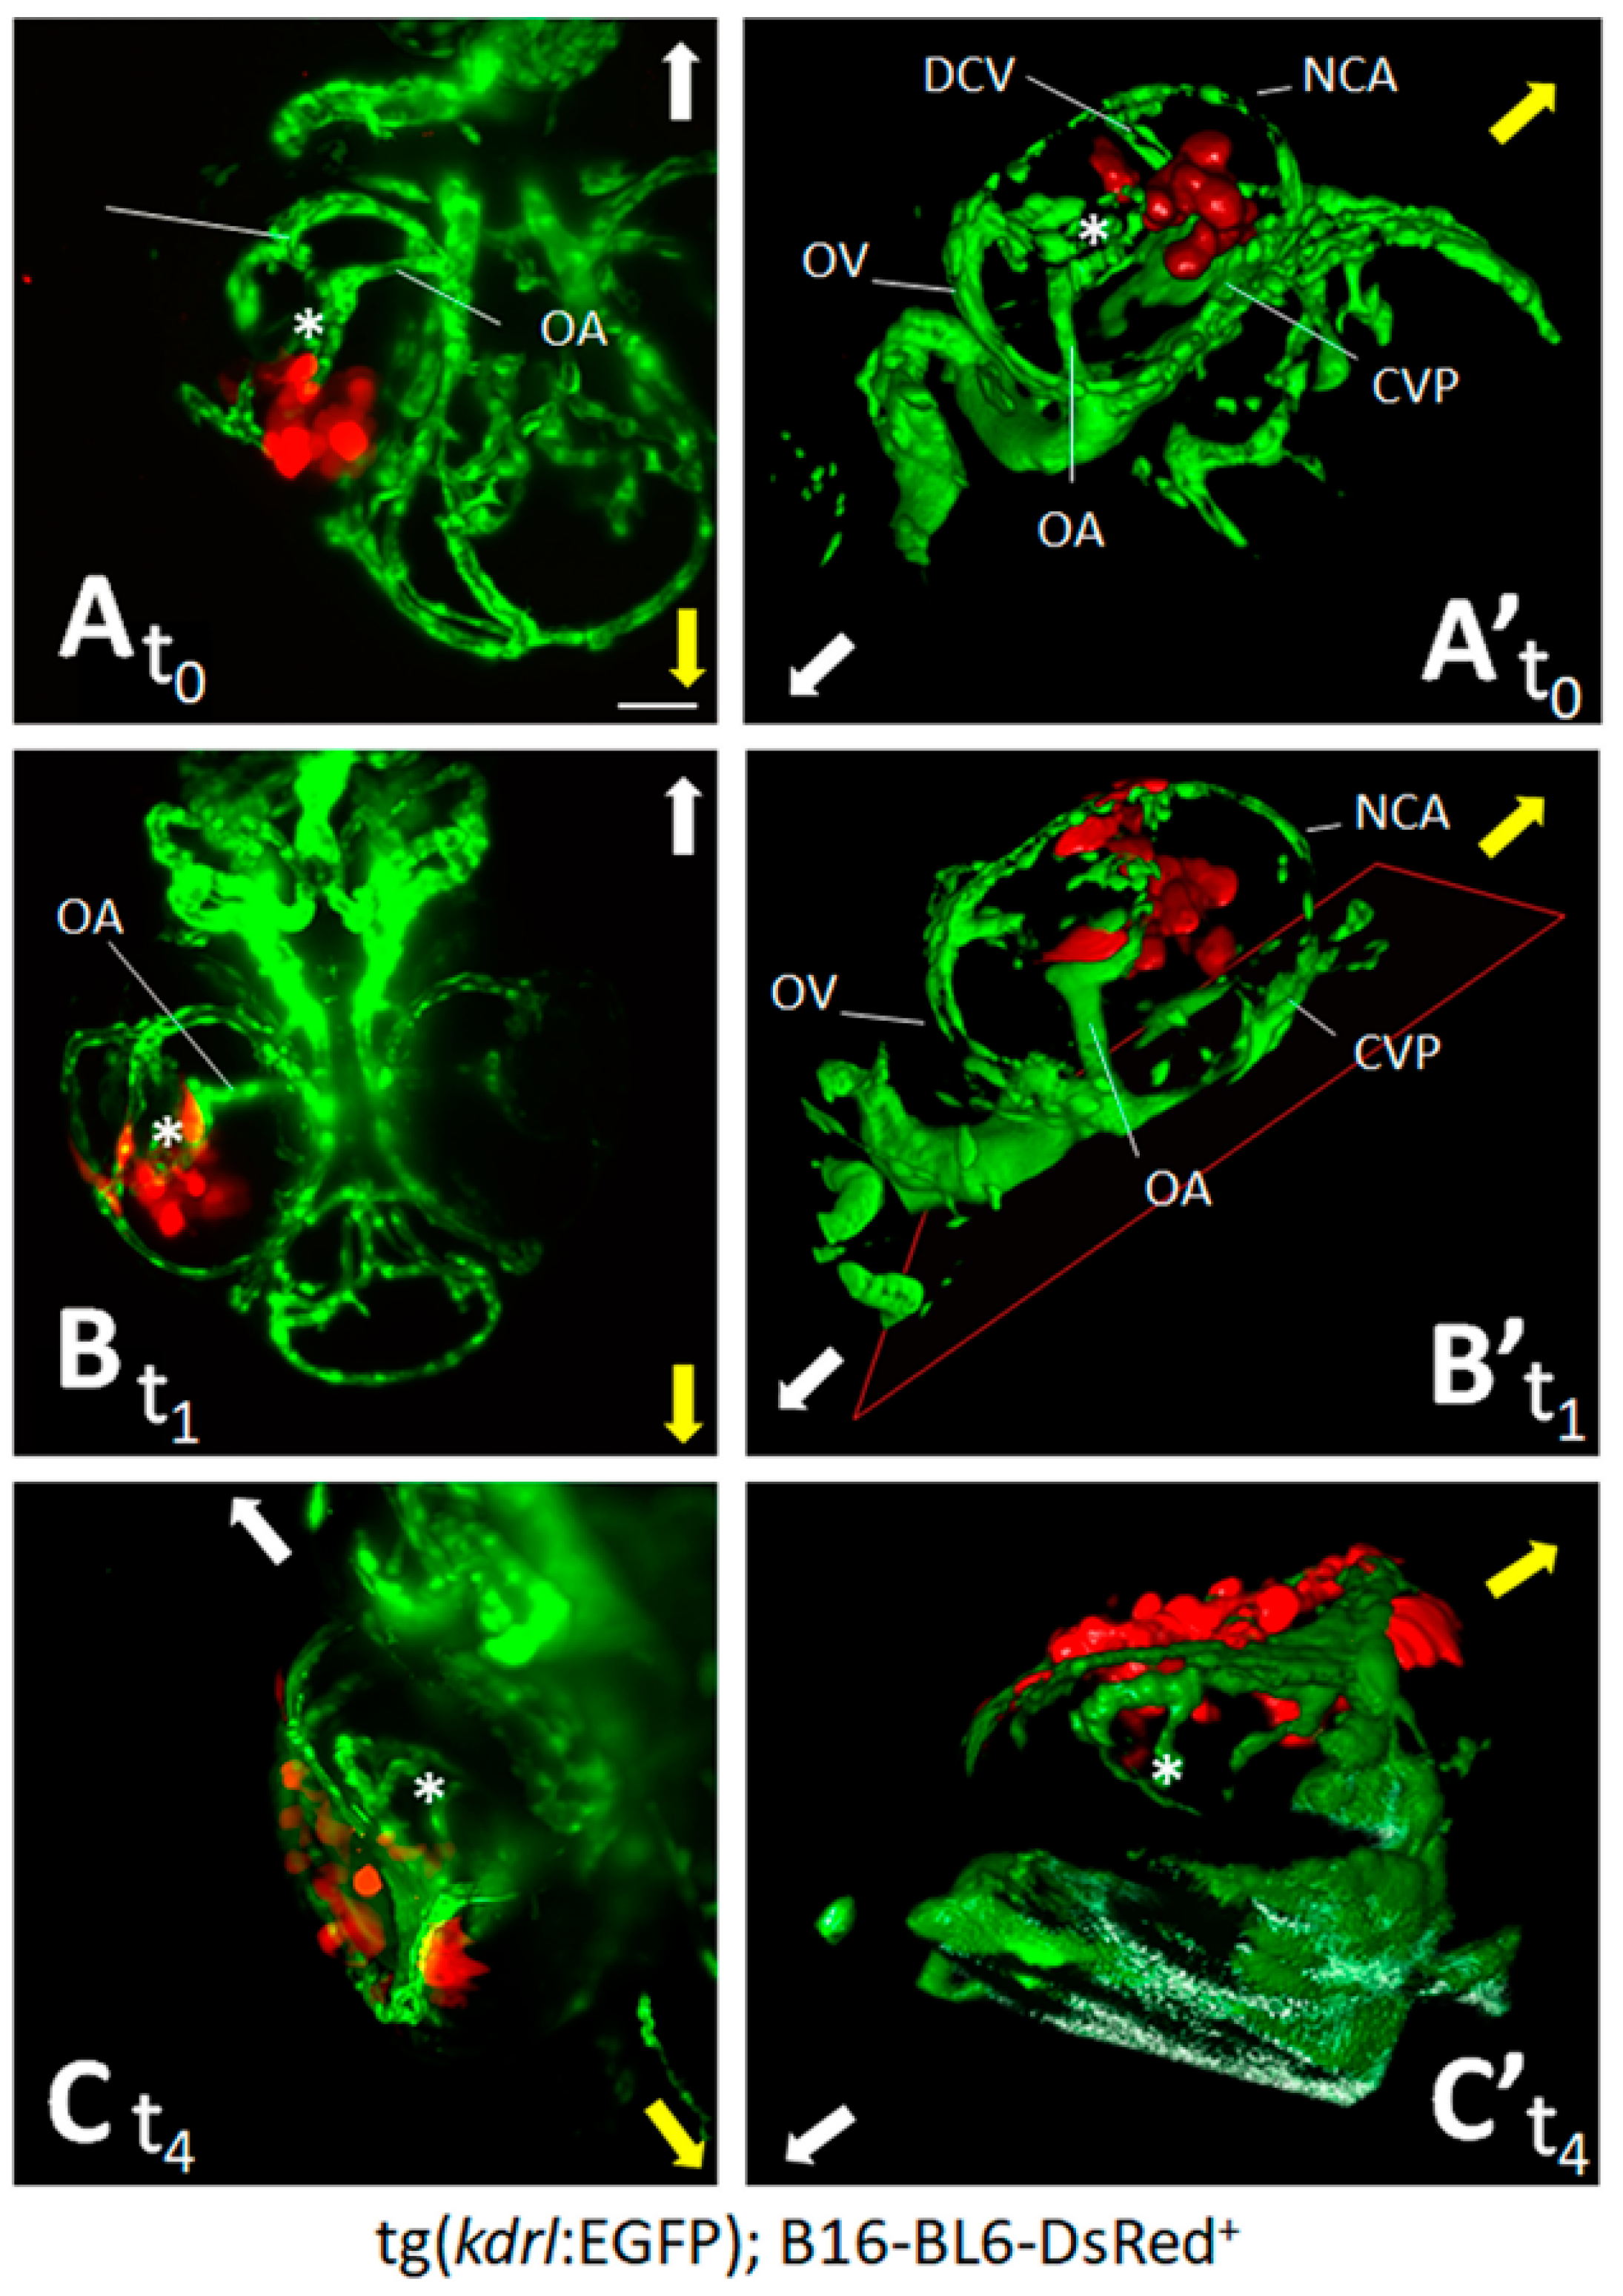
Abstract
:1. Introduction
2. Materials and Methods
2.1. Reagents
2.2. Cell Cultures
2.3. Cell Proliferation Assay
2.4. Apoptosis Assay
2.5. Zebrafish Maintenance and Cell Transplantation
2.6. Fluorescence and Light Sheet Microscopy
2.7. Immunohistochemical Analysis
2.8. Luciferase-Based Quantification Method
2.9. Statistical Analysis
3. Results and Discussion
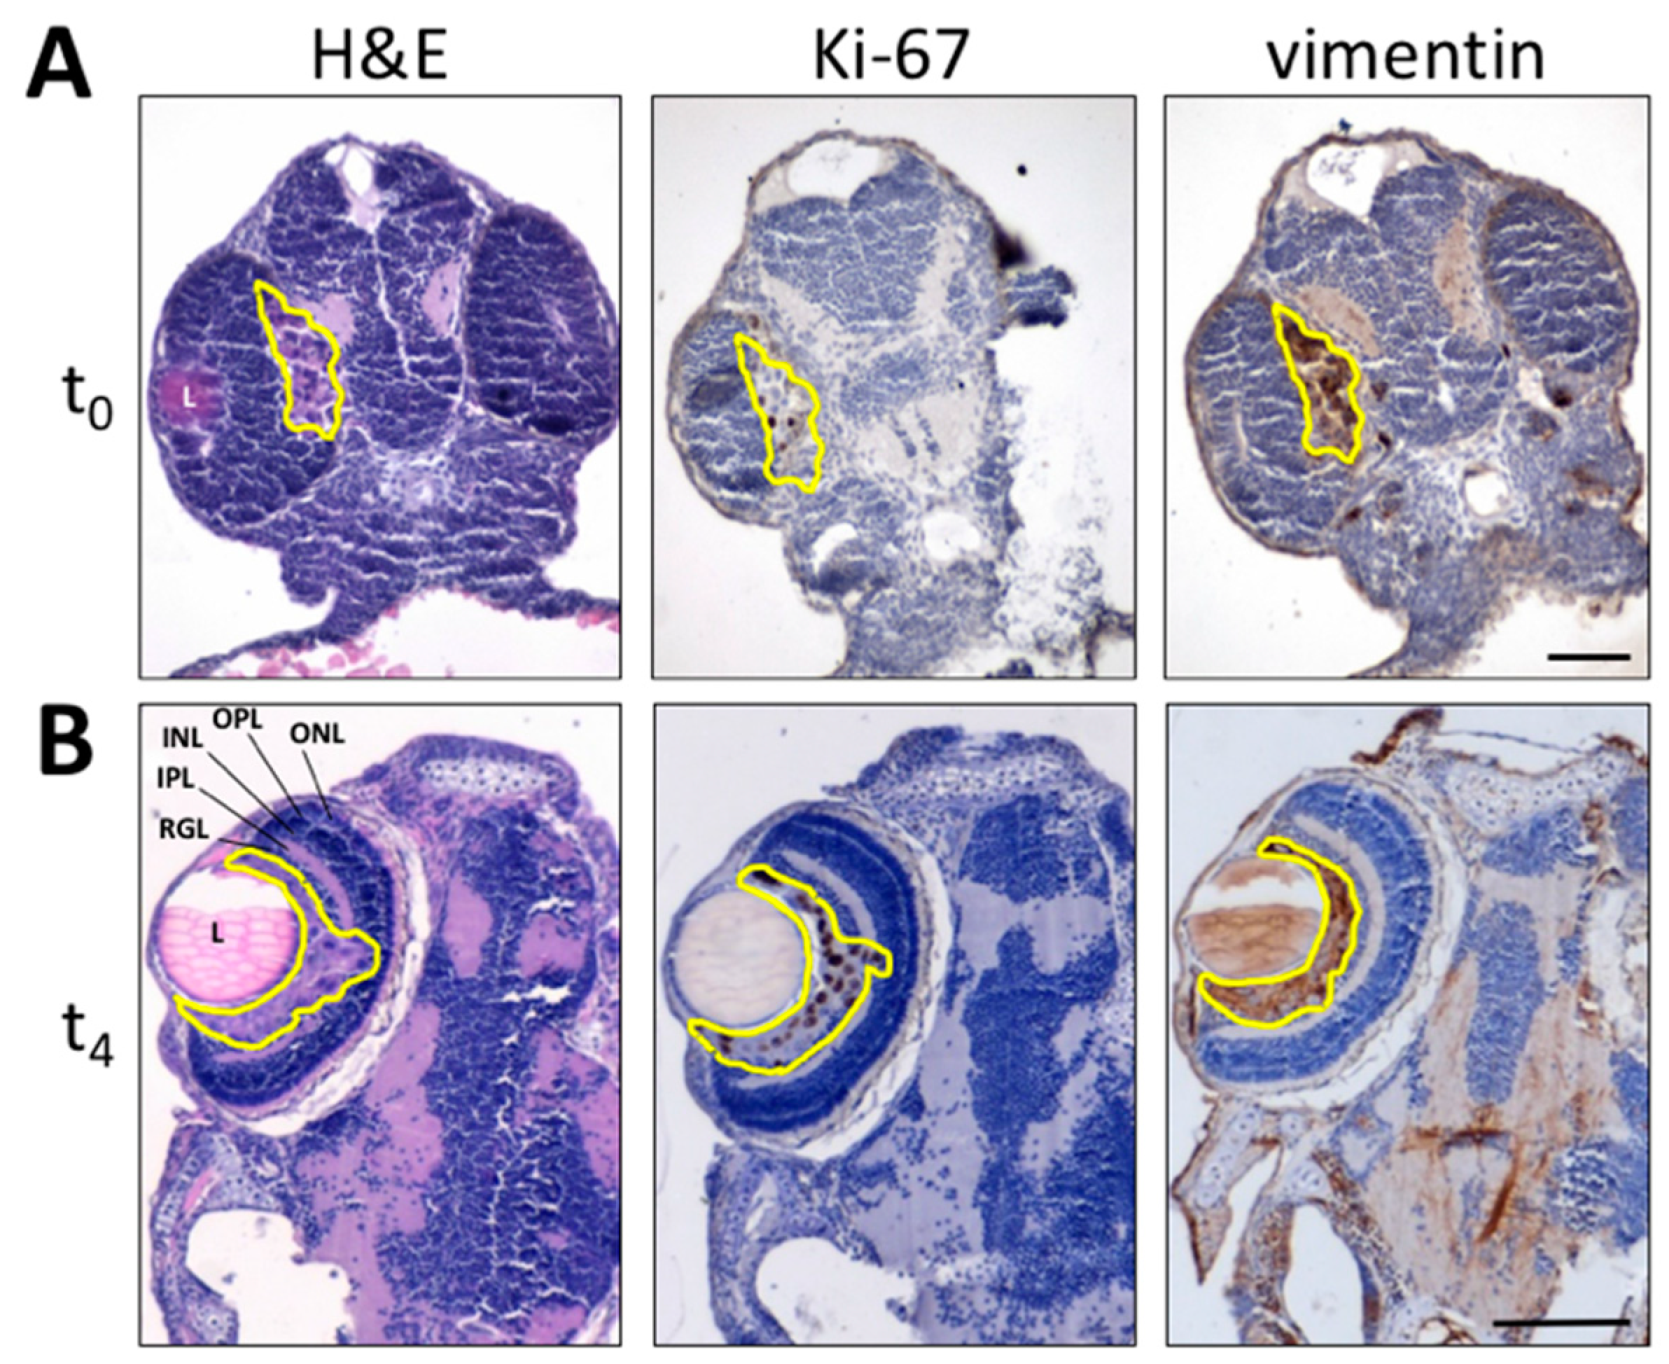
3.1. Zebrafish Embryo Eye Is a Permissive Environment for the Growth of Engrafted Melanoma Cells
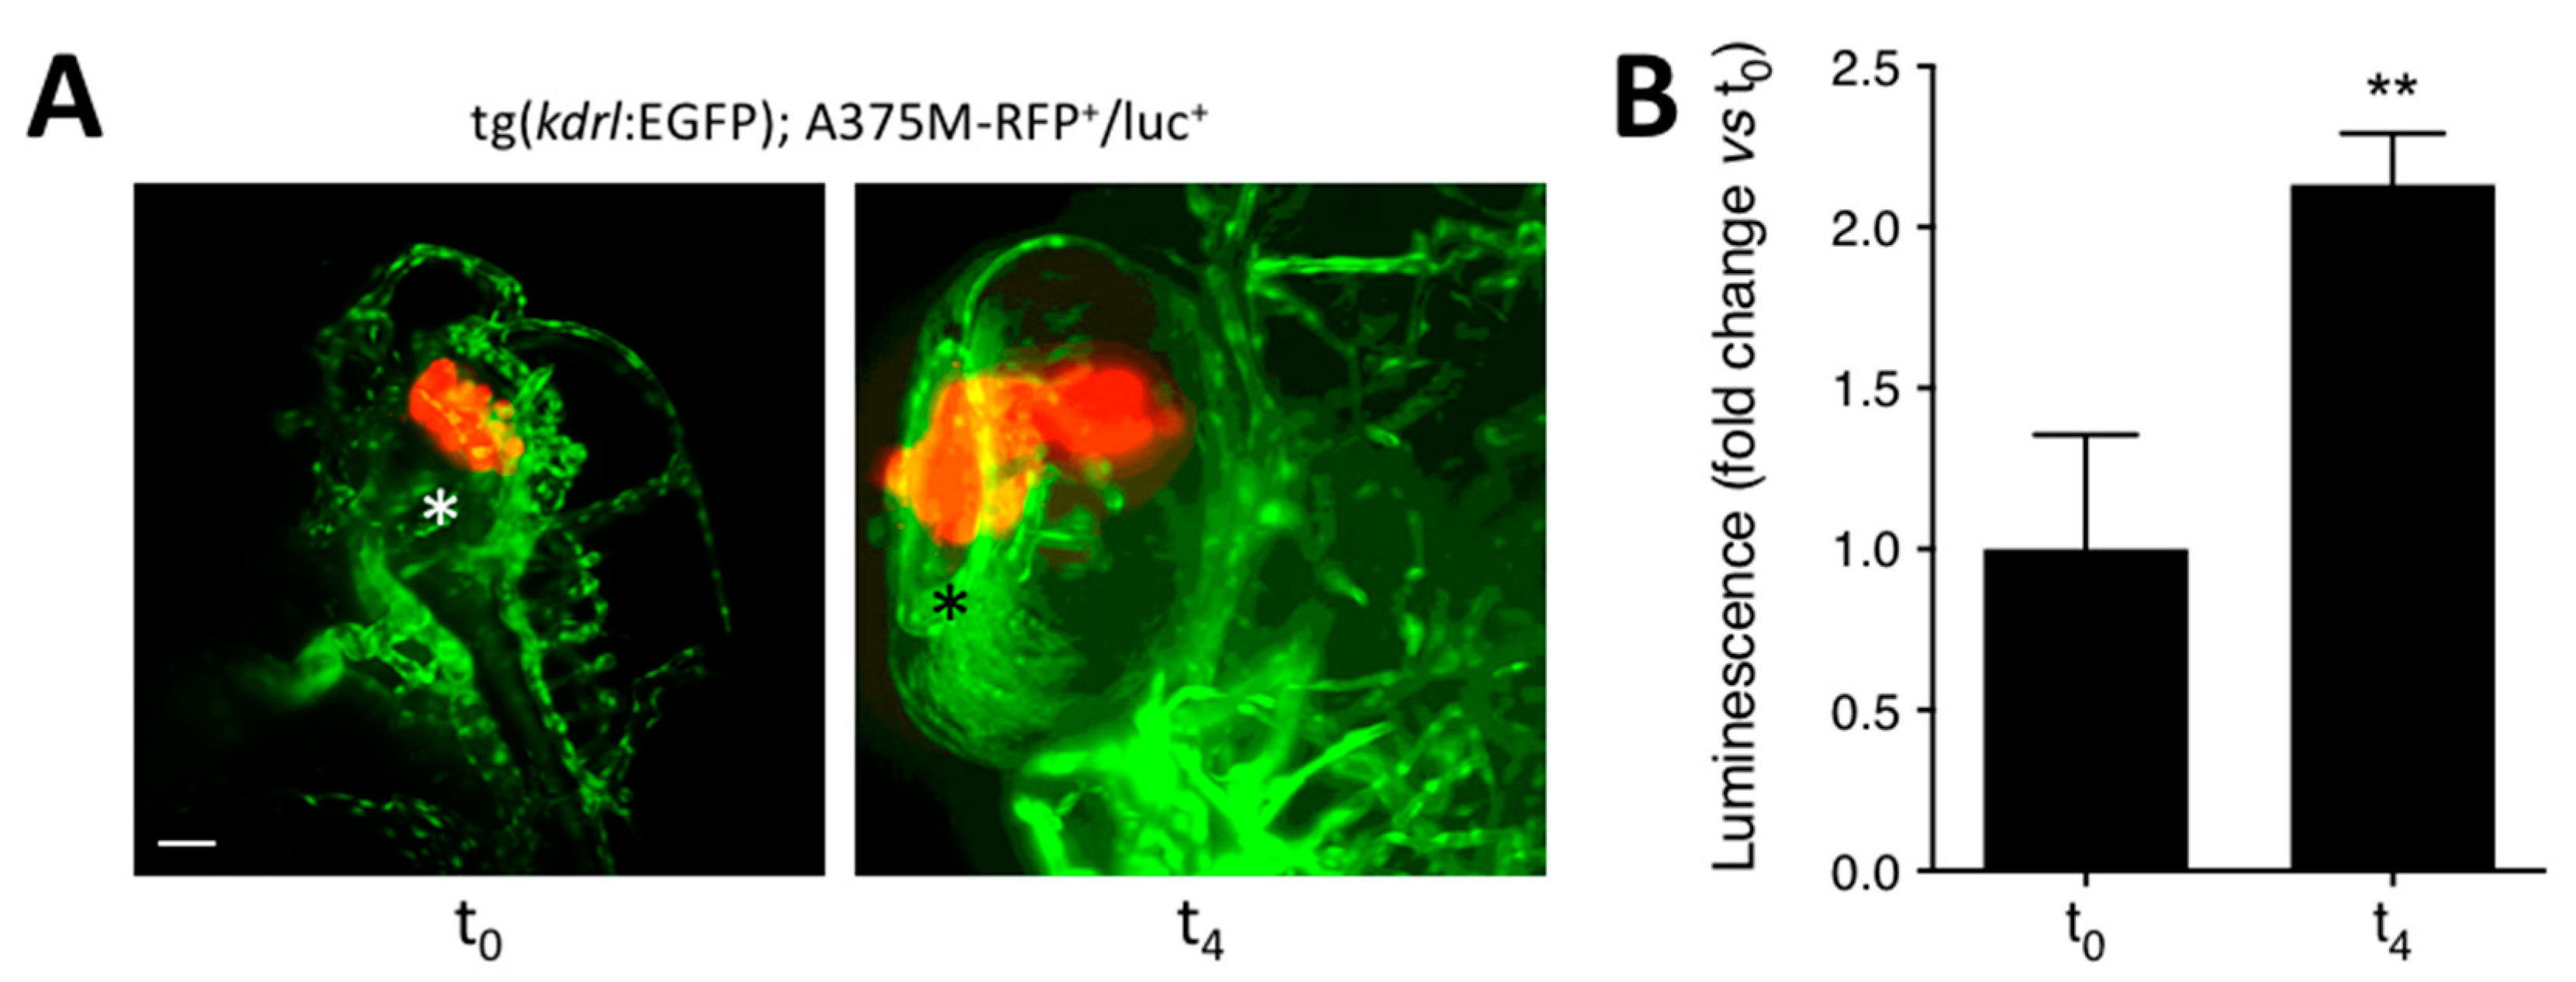
3.2. Quantification of Melanoma Xenograft Growth in the Zebrafish Embryo Eye
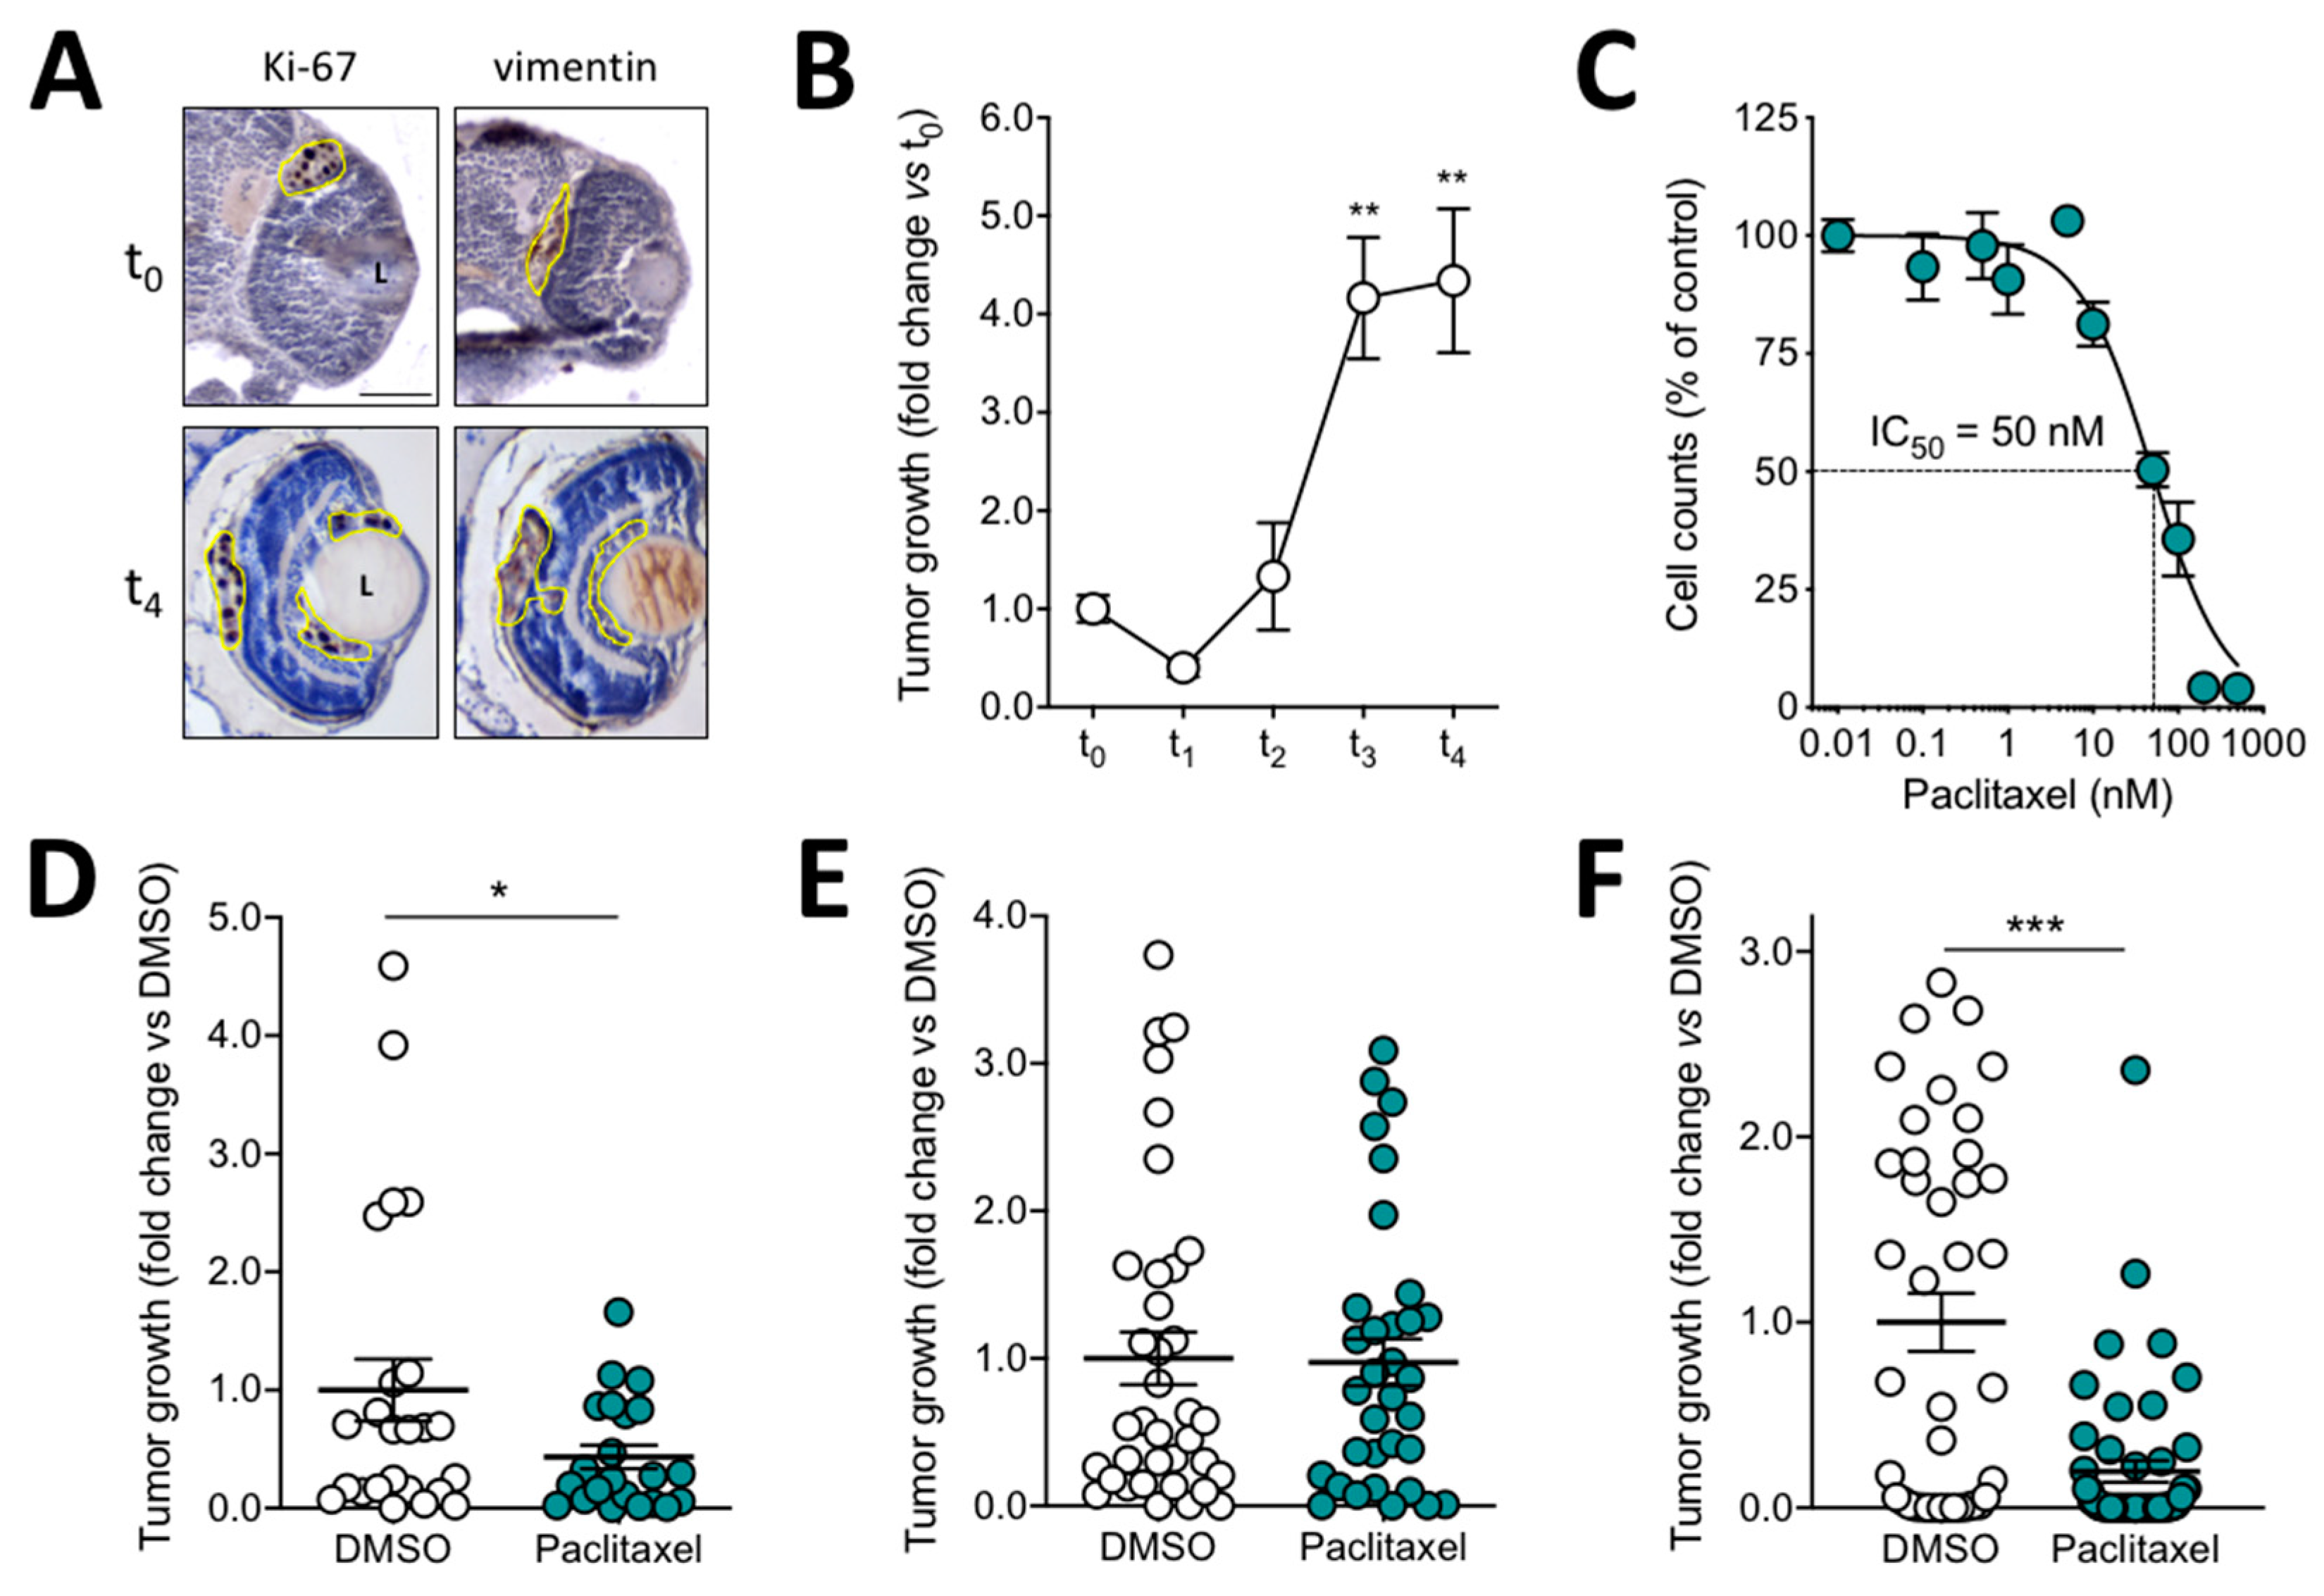
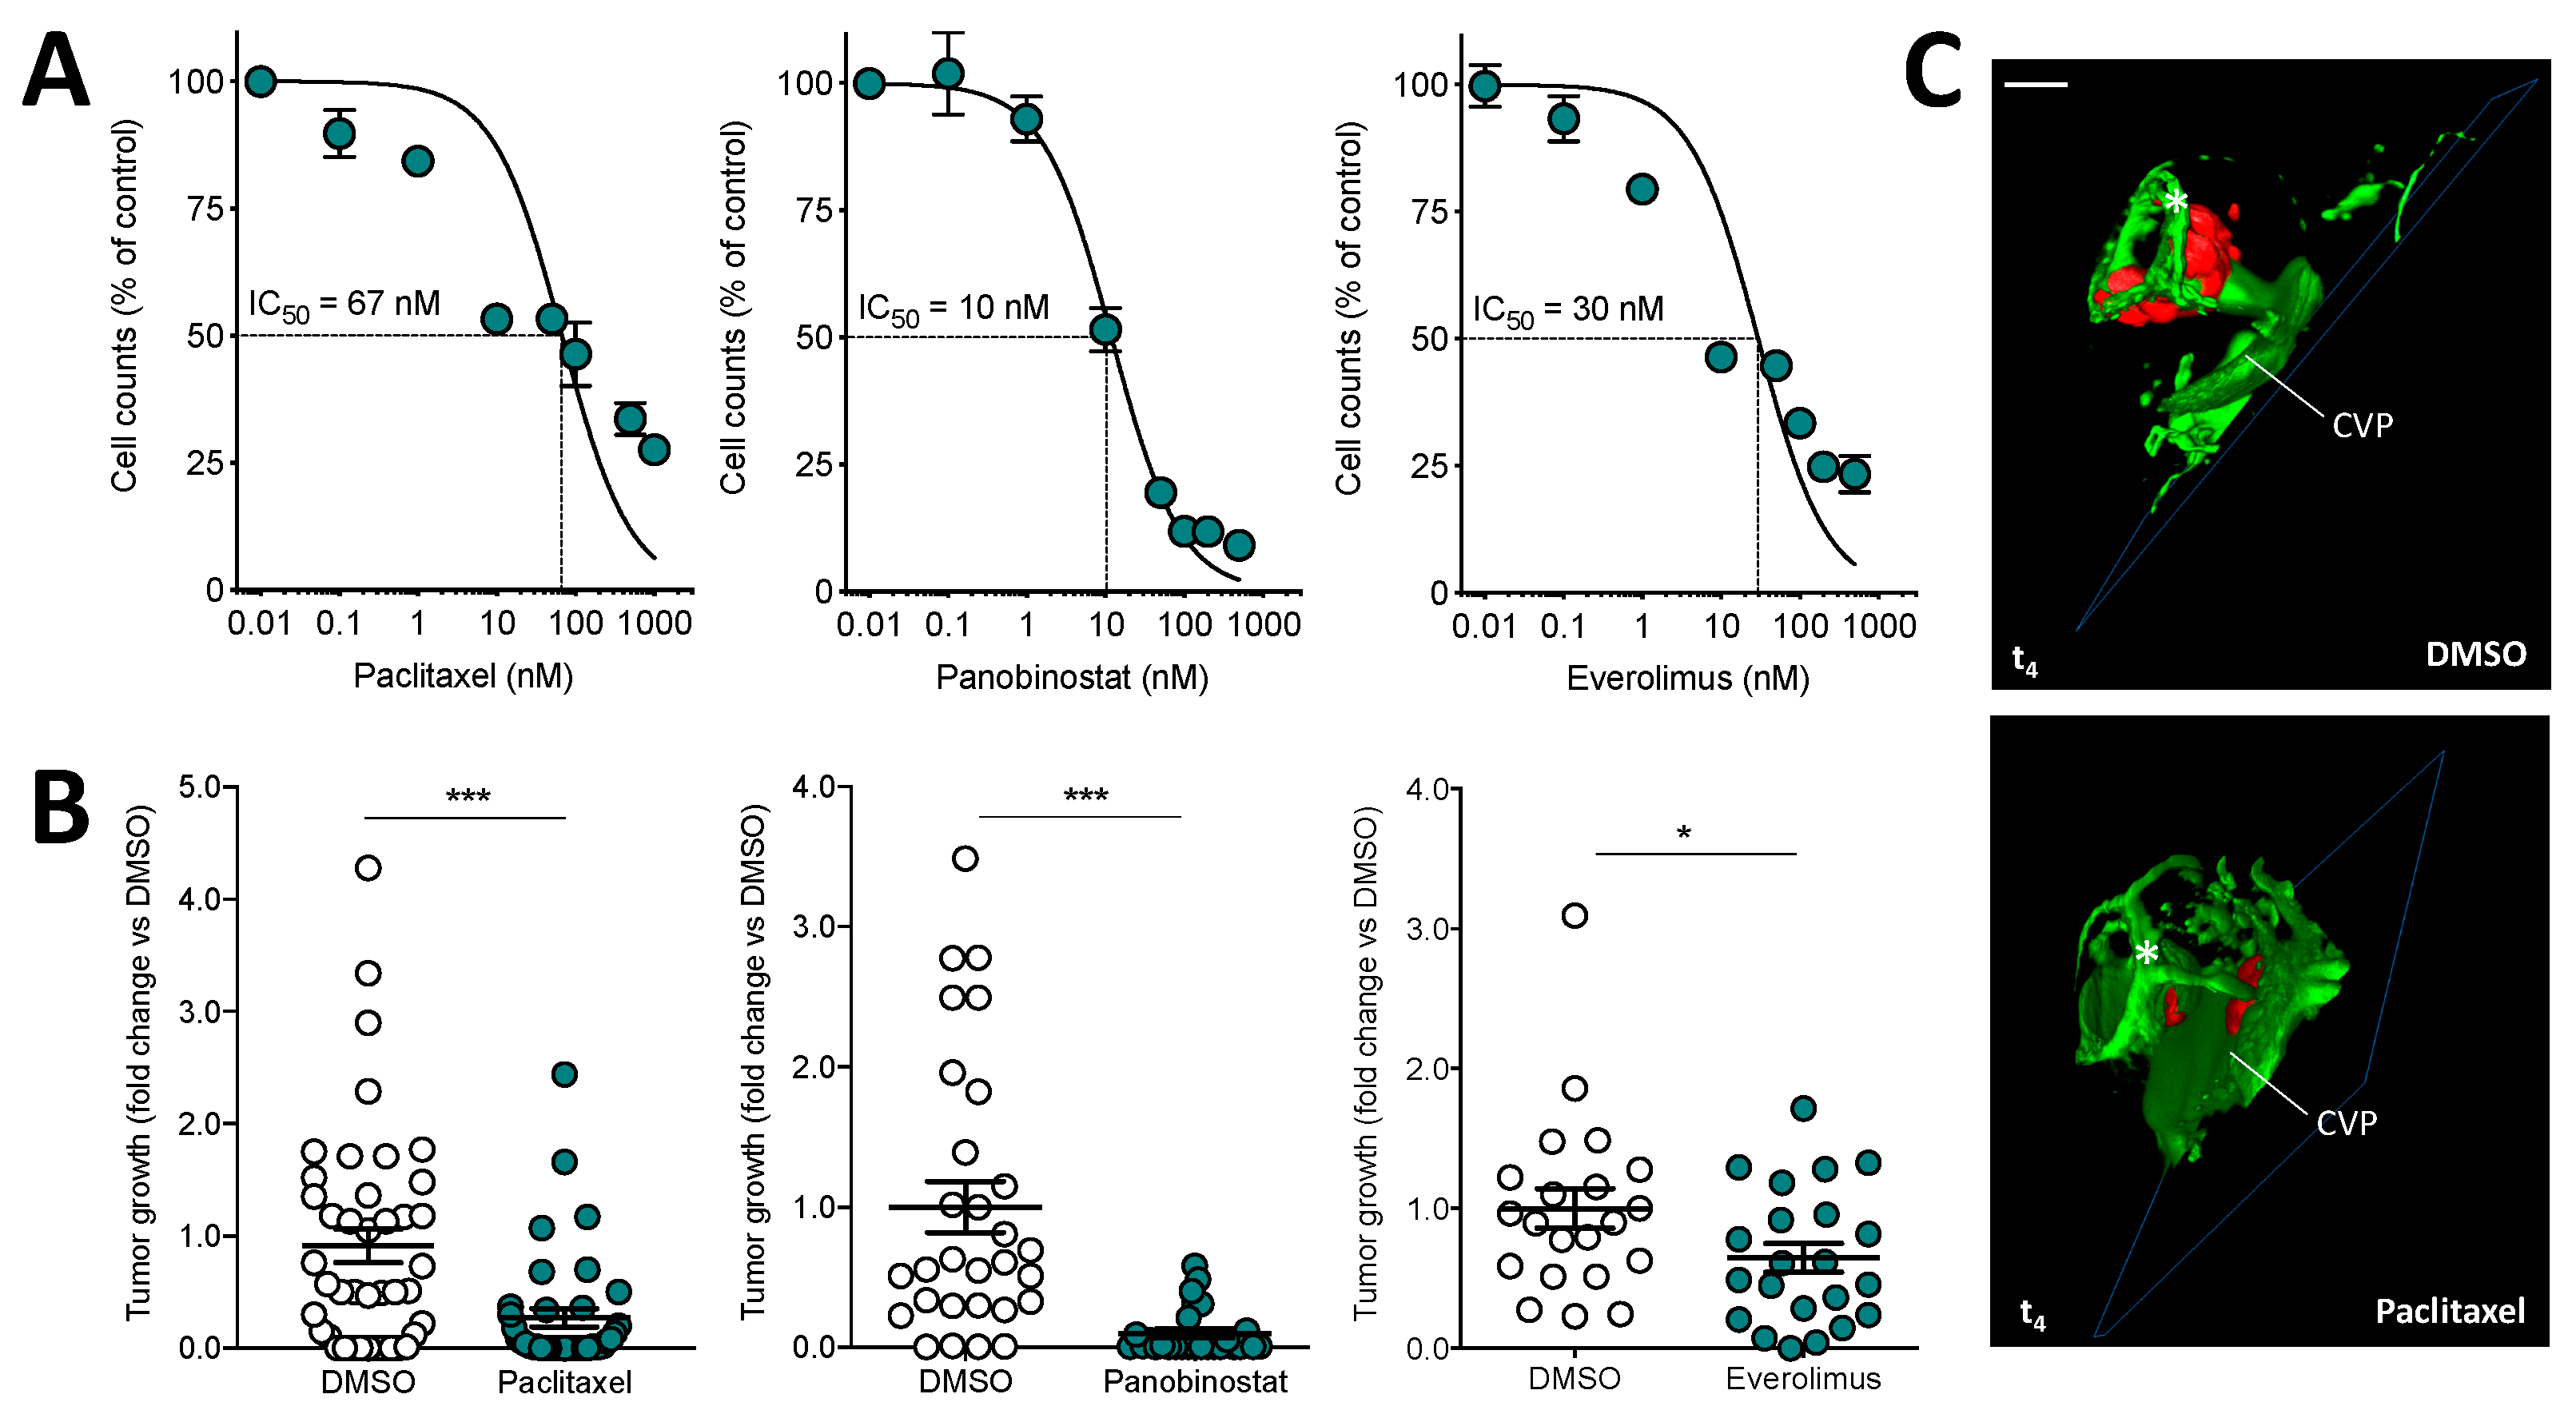
3.3. Orthotopic Ocular Grafting in the Zebrafish Embryo as a Model for Uveal Melanoma Treatment
4. Conclusions
Supplementary Materials
Author Contributions
Funding
Institutional Review Board Statement
Informed Consent Statement
Data Availability Statement
Acknowledgments
Conflicts of Interest
References
- Santoriello, C.; Zon, L.I. Hooked! Modeling human disease in zebrafish. J. Clin. Investig. 2012, 122, 2337–2343. [Google Scholar] [CrossRef] [Green Version]
- Tobia, C.; Gariano, G.; De Sena, G.; Presta, M. Zebrafish embryo as a tool to study tumor/endothelial cell cross-talk. Biochim. Biophys. Acta 2013, 1832, 1371–1377. [Google Scholar] [CrossRef] [Green Version]
- Rezzola, S.; Paganini, G.; Semeraro, F.; Presta, M.; Tobia, C. Zebrafish (Danio rerio) embryo as a platform for the identification of novel angiogenesis inhibitors of retinal vascular diseases. Biochim. Biophys. Acta 2016, 1862, 1291–1296. [Google Scholar] [CrossRef] [PubMed]
- Lee, H.-C.; Lin, C.-Y.; Tsai, H.-J. Zebrafish, an in vivo platform to screen drugs and proteins for biomedical use. Pharmaceuticals 2021, 14, 500. [Google Scholar] [CrossRef]
- Barriuso, J.; Nagaraju, R.; Hurlstone, A. Zebrafish: A new companion for translational research in oncology. Clin. Cancer Res. 2015, 21, 969–975. [Google Scholar] [CrossRef] [Green Version]
- Letrado, P.; De Miguel, I.; Lamberto, I.; Díez-Martínez, R.; Oyarzabal, J. Zebrafish: Speeding up the cancer drug discovery process. Cancer Res. 2018, 78, 6048–6058. [Google Scholar] [CrossRef] [Green Version]
- Jo, D.H.; Son, D.; Na, Y.; Jang, M.; Choi, J.-H.; Kim, J.H.; Yu, Y.S.; Seok, S.H.; Kim, J.H. Orthotopic transplantation of retinoblastoma cells into vitreous cavity of zebrafish for screening of anticancer drugs. Mol. Cancer 2013, 12, 71–79. [Google Scholar] [CrossRef] [PubMed] [Green Version]
- Chen, X.; Wang, J.; Cao, Z.; Hosaka, K.; Jensen, L.; Yang, H.; Sun, Y.; Zhuang, R.; Liu, Y.; Cao, Y. Invasiveness and metastasis of retinoblastoma in an orthotopic zebrafish tumor model. Sci. Rep. 2015, 5, srep10351. [Google Scholar] [CrossRef] [Green Version]
- Chen, Q.; Ramu, V.; Aydar, Y.; Groenewoud, A.; Zhou, X.-Q.; Jager, M.J.; Cole, H.; Cameron, C.G.; McFarland, S.A.; Bonnet, S.; et al. TLD1433 photosensitizer inhibits conjunctival melanoma cells in zebrafish ectopic and orthotopic tumour models. Cancers 2020, 12, 587. [Google Scholar] [CrossRef] [PubMed] [Green Version]
- Zhang, B.; Shimada, Y.; Kuroyanagi, J.; Umemoto, N.; Nishimura, Y.; Tanaka, T. Quantitative phenotyping-based in vivo chemical screening in a zebrafish model of leukemia stem cell xenotransplantation. PLoS ONE 2014, 9, e85439. [Google Scholar] [CrossRef]
- Hill, D.; Chen, L.; Snaar-Jagalska, E.; Chaudhry, B. Embryonic zebrafish xenograft assay of human cancer metastasis. F1000Research 2018, 7, 1682. [Google Scholar] [CrossRef]
- Jovanovic, P.; Mihajlovic, M.; Djordjevic-Jocic, J.; Vlajkovic, S.; Cekic, S.; Stefanovic, V. Ocular melanoma: An overview of the current status. Int. J. Clin. Exp. Pathol. 2013, 6, 1230–1244. [Google Scholar] [PubMed]
- Yonekawa, Y.; Kim, I.K. Epidemiology and management of uveal melanoma. Hematol. Oncol. Clin. N. Am. 2012, 26, 1169–1184. [Google Scholar] [CrossRef]
- Mahendraraj, K.; Lau, C.S.; Lee, I.; Chamberlain, R.S. Trends in incidence, survival, and management of uveal melanoma: A population-based study of 7516 patients from the Surveillance, Epidemiology, and End Results database (1973–2012). Clin. Ophthalmol. 2016, 10, 2113–2119. [Google Scholar] [CrossRef] [Green Version]
- Vivet-Noguer, R.; Tarin, M.; Roman-Roman, S.; Alsafadi, S. Emerging therapeutic opportunities based on current knowledge of uveal melanoma biology. Cancers 2019, 11, 1019. [Google Scholar] [CrossRef] [Green Version]
- Bedikian, A.Y. Metastatic uveal melanoma therapy. Int. Ophthalmol. Clin. 2006, 46, 151–166. [Google Scholar] [CrossRef]
- Croce, M.; Ferrini, S.; Pfeffer, U.; Gangemi, R. Targeted therapy of uveal melanoma: Recent failures and new perspectives. Cancers 2019, 11, 846. [Google Scholar] [CrossRef] [Green Version]
- Diaz, C.E.; Rusciano, D.; Dithmar, S.; Grossniklaus, H.E. B16LS9 melanoma cells spread to the liver from the murine ocular posterior compartment (PC). Curr. Eye Res. 1999, 18, 125–129. [Google Scholar] [CrossRef]
- Ronca, R.; Giacomini, A.; Di Salle, E.; Coltrini, D.; Pagano, K.; Ragona, L.; Matarazzo, S.; Rezzola, S.; Maiolo, D.; Torella, R.; et al. Long-pentraxin 3 derivative as a small-molecule FGF trap for cancer therapy. Cancer Cell 2015, 28, 225–239. [Google Scholar] [CrossRef] [PubMed] [Green Version]
- De Waard-Siebinga, I.; Blom, D.-J.R.; Griffioen, M.; Schrier, P.I.; Hoogendoorn, E.; Beverstock, G.; Danen, E.H.J.; Jager, M.J. Establishment and characterization of an uveal-melanoma cell line. Int. J. Cancer 1995, 62, 155–161. [Google Scholar] [CrossRef] [PubMed]
- Rezzola, S.; Guerra, J.; Chandran, A.M.K.; Loda, A.; Cancarini, A.; Sacristani, P.; Semeraro, F.; Presta, M. VEGF-independent activation of Müller cells by the vitreous from proliferative diabetic retinopathy patients. Int. J. Mol. Sci. 2021, 22, 2179. [Google Scholar] [CrossRef]
- Westerfield, M. The Zebrafish Book. A Guide for the Laboratory Use of Zebrafish (Danio rerio), 4th ed.; University of Oregon Press: Eugene, OR, USA, 2000. [Google Scholar]
- Kimmel, C.B.; Ballard, W.W.; Kimmel, S.R.; Ullmann, B.; Schilling, T.F. Stages of embryonic development of the zebrafish. Dev. Dyn. 1995, 203, 253–310. [Google Scholar] [CrossRef]
- Schindelin, J.; Arganda-Carreras, I.; Frise, E.; Kaynig, V.; Longair, M.; Pietzsch, T.; Preibisch, S.; Rueden, C.; Saalfeld, S.; Schmid, B.; et al. Fiji: An open-source platform for biological-image analysis. Nat. Methods 2012, 9, 676–682. [Google Scholar] [CrossRef] [Green Version]
- Sabaliauskas, N.A.; Foutz, C.A.; Mest, J.R.; Budgeon, L.R.; Sidor, A.T.; Gershenson, J.A.; Joshi, S.B.; Cheng, K.C. High-throughput zebrafish histology. Methods 2006, 39, 246–254. [Google Scholar] [CrossRef] [PubMed]
- Malicki, J.; Neuhauss, S.C.; Schier, A.F.; Solnica-Krezel, L.; Stemple, D.L.; Stainier, D.Y.; Abdelilah, S.; Zwartkruis, F.; Rangini, Z.; Driever, W. Mutations affecting development of the zebrafish retina. Development 1996, 123, 263–273. [Google Scholar] [CrossRef]
- Hashiura, T.; Kimura, E.; Fujisawa, S.; Oikawa, S.; Nonaka, S.; Kurosaka, D.; Hitomi, J. Live imaging of primary ocular vasculature formation in zebrafish. PLoS ONE 2017, 12, e0176456. [Google Scholar] [CrossRef]
- Singh, A.; Nüsslein-Volhard, C. Zebrafish stripes as a model for vertebrate colour pattern formation. Curr. Biol. 2015, 25, R81–R92. [Google Scholar] [CrossRef] [Green Version]
- Antinucci, P.; Hindges, R. A crystal-clear zebrafish for in vivo imaging. Sci. Rep. 2016, 6, 29490. [Google Scholar] [CrossRef] [PubMed] [Green Version]
- Rusciano, D.; Lorenzoni, P.; Burger, M. Regulation of c-met expression in B16 murine melanoma cells by melanocyte stimulating hormone. J. Cell Sci. 1999, 112 Pt 5, 623–630. [Google Scholar] [CrossRef]
- Elia, G.; Ren, Y.; Lorenzoni, P.; Zarnegar, R.; Burger, M.M.; Rusciano, D. Mechanisms regulating c-met overexpression in liver-metastatic B16-LS9 melanoma cells. J. Cell. Biochem. 2001, 81, 477–487. [Google Scholar] [CrossRef]
- Jones, N.M.; Yang, H.; Zhang, Q.; Morales-Tirado, V.M.; Grossniklaus, H.E. Natural killer cells and pigment epithelial-derived factor control the infiltrative and nodular growth of hepatic metastases in an Orthotopic murine model of ocular melanoma. BMC Cancer 2019, 19, 484. [Google Scholar] [CrossRef]
- Stei, M.M.; Loeffler, K.U.; Holz, F.G.; Herwig-Carl, M. Animal models of uveal melanoma: Methods, applicability, and limitations. BioMed Res. Int. 2016, 2016, 4521807. [Google Scholar] [CrossRef] [Green Version]
- Yang, W.; Li, H.; Mayhew, E.; Mellon, J.; Chen, P.W.; Niederkorn, J.Y. NKT cell exacerbation of liver metastases arising from melanomas transplanted into either the eyes or spleens of mice. Investig. Opthalmol. Vis. Sci. 2011, 52, 3094–3102. [Google Scholar] [CrossRef] [PubMed] [Green Version]
- Yang, H.; Brackett, C.M.; Morales-Tirado, V.M.; Li, Z.; Zhang, Q.; Wilson, M.W.; Benjamin, C.; Harris, W.; Waller, E.K.; Gudkov, A.; et al. The toll-like receptor 5 agonist entolimod suppresses hepatic metastases in a murine model of ocular melanoma via an NK cell-dependent mechanism. Oncotarget 2016, 7, 2936–2950. [Google Scholar] [CrossRef] [Green Version]
- Ashur-Fabian, O.; Zloto, O.; Fabian, I.; Tsarfaty, G.; Ellis, M.; Steinberg, D.M.; Hercbergs, A.; Davis, P.J.; Fabian, I.D. Tetrac delayed the onset of ocular melanoma in an orthotopic mouse model. Front. Endocrinol. 2018, 9, 775. [Google Scholar] [CrossRef] [PubMed]
- Rezzola, S.; Ronca, R.; Loda, A.; Nawaz, M.I.; Tobia, C.; Paganini, G.; Maccarinelli, F.; Giacomini, A.; Semeraro, F.; Mor, M.; et al. The autocrine FGF/FGFR system in both skin and uveal melanoma: FGF trapping as a possible therapeutic approach. Cancers 2019, 11, 1305. [Google Scholar] [CrossRef] [PubMed] [Green Version]
- Owinsky, E.R.K.R.; Onehower, R.O.C.D. Paclitaxel (taxol). N. Engl. J. Med. 1995, 332, 1004–1014. [Google Scholar] [CrossRef]
- Cassar, S.; Adatto, I.; Freeman, J.L.; Gamse, J.T.; Iturria, I.; Lawrence, C.; Muriana, A.; Peterson, R.T.; Van Cruchten, S.; Zon, L.I. Use of zebrafish in drug discovery toxicology. Chem. Res. Toxicol. 2020, 33, 95–118. [Google Scholar] [CrossRef] [Green Version]
- Scuto, A.; Kirschbaum, M.; Kowolik, C.; Kretzner, L.; Juhasz, A.; Atadja, P.; Pullarkat, V.; Bhatia, R.; Forman, S.; Yen, Y.; et al. The novel histone deacetylase inhibitor, LBH589, induces expression of DNA damage response genes and apoptosis in Ph– acute lymphoblastic leukemia cells. Blood 2008, 111, 5093–5100. [Google Scholar] [CrossRef] [Green Version]
- O’Reilly, T.; McSheehy, P.M. Biomarker development for the clinical activity of the mTOR inhibitor everolimus (RAD001): Processes, limitations, and further proposals. Transl. Oncol. 2010, 3, 65–79. [Google Scholar] [CrossRef] [Green Version]
- Faião-Flores, F.; Emmons, M.F.; Durante, M.A.; Kinose, F.; Saha, B.; Fang, B.; Koomen, J.M.; Chellappan, S.P.; Maria-Engler, S.; Rix, U.; et al. HDAC inhibition enhances the in vivo efficacy of MEK inhibitor therapy in uveal melanoma. Clin. Cancer Res. 2019, 25, 5686–5701. [Google Scholar] [CrossRef] [PubMed]
- Amirouchene-Angelozzi, N.; Frisch-Dit-Leitz, E.; Carita, G.; Dahmani, A.; Raymondie, C.; Liot, G.; Gentien, D.; Némati, F.; Decaudin, D.; Roman-Roman, S.; et al. The mTOR inhibitor Everolimus synergizes with the PI3K inhibitor GDC0941 to enhance anti-tumor efficacy in uveal melanoma. Oncotarget 2016, 7, 23633–23646. [Google Scholar] [CrossRef] [Green Version]
- Shoushtari, A.N.; Ong, L.T.; Schoder, H.; Singh-Kandah, S.; Abbate, K.T.; Postow, M.A.; Callahan, M.K.; Wolchok, J.; Chapman, P.B.; Panageas, K.S.; et al. A phase 2 trial of everolimus and pasireotide long-acting release in patients with metastatic uveal melanoma. Melanoma Res. 2016, 26, 272–277. [Google Scholar] [CrossRef] [PubMed] [Green Version]
- Homsi, J.; Bedikian, A.Y.; Papadopoulos, N.E.; Kim, K.B.; Hwu, W.-J.; Mahoney, S.L.; Hwu, P. Phase 2 open-label study of weekly docosahexaenoic acid–paclitaxel in patients with metastatic uveal melanoma. Melanoma Res. 2010, 20, 507–510. [Google Scholar] [CrossRef]
- Van der Ent, W.; Burrello, C.; Teunisse, A.F.A.S.; Ksander, B.R.; Van Der Velden, P.A.; Jager, M.J.; Jochemsen, A.G.; Snaar-Jagalska, B.E. Modeling of human uveal melanoma in zebrafish xenograft embryos. Investig. Opthalmol. Vis. Sci. 2014, 55, 6612–6622. [Google Scholar] [CrossRef]
- Fornabaio, G.; Barnhill, R.L.; Lugassy, C.; Bentolila, L.A.; Cassoux, N.; Roman-Roman, S.; Alsafadi, S.; Del Bene, F. Angiotropism and extravascular migratory metastasis in cutaneous and uveal melanoma progression in a zebrafish model. Sci. Rep. 2018, 8, 10448. [Google Scholar] [CrossRef]
- Van der Ent, W.; Burrello, C.; De Lange, M.J.; Van Der Velden, P.A.; Jochemsen, A.G.; Jager, M.J.; Snaar-Jagalska, B.E. Embryonic zebrafish: Different phenotypes after injection of human uveal melanoma cells. Ocul. Oncol. Pathol. 2015, 1, 170–181. [Google Scholar] [CrossRef] [PubMed] [Green Version]
- Yu, L.; Zhou, D.; Zhang, G.; Ren, Z.; Luo, X.; Liu, P.; Plouffe, S.W.; Meng, Z.; Moroishi, T.; Li, Y.; et al. Co-occurrence of BAP1 and SF3B1 mutations in uveal melanoma induces cellular senescence. Mol. Oncol. 2021. [Google Scholar] [CrossRef] [PubMed]
- Arepalli, S.; Kaliki, S.; Shields, C.L. Choroidal metastases: Origin, features, and therapy. Indian J. Ophthalmol. 2015, 63, 122–127. [Google Scholar] [CrossRef]


Publisher’s Note: MDPI stays neutral with regard to jurisdictional claims in published maps and institutional affiliations. |
© 2021 by the authors. Licensee MDPI, Basel, Switzerland. This article is an open access article distributed under the terms and conditions of the Creative Commons Attribution (CC BY) license (https://creativecommons.org/licenses/by/4.0/).
Share and Cite
Tobia, C.; Coltrini, D.; Ronca, R.; Loda, A.; Guerra, J.; Scalvini, E.; Semeraro, F.; Rezzola, S. An Orthotopic Model of Uveal Melanoma in Zebrafish Embryo: A Novel Platform for Drug Evaluation. Biomedicines 2021, 9, 1873. https://doi.org/10.3390/biomedicines9121873
Tobia C, Coltrini D, Ronca R, Loda A, Guerra J, Scalvini E, Semeraro F, Rezzola S. An Orthotopic Model of Uveal Melanoma in Zebrafish Embryo: A Novel Platform for Drug Evaluation. Biomedicines. 2021; 9(12):1873. https://doi.org/10.3390/biomedicines9121873
Chicago/Turabian StyleTobia, Chiara, Daniela Coltrini, Roberto Ronca, Alessandra Loda, Jessica Guerra, Elisa Scalvini, Francesco Semeraro, and Sara Rezzola. 2021. "An Orthotopic Model of Uveal Melanoma in Zebrafish Embryo: A Novel Platform for Drug Evaluation" Biomedicines 9, no. 12: 1873. https://doi.org/10.3390/biomedicines9121873