
Is Chronic Kidney Disease Due to Cadmium Exposure Inevitable and Can It Be Reversed?
Kidney Disease Research Collaborative, Translational Research Institute, Woolloongabba, Brisbane, QLD 4102, Australia
Biomedicines 2024, 12(4), 718; https://doi.org/10.3390/biomedicines12040718
Submission received: 19 February 2024
/
Revised: 9 March 2024
/
Accepted: 21 March 2024
/
Published: 23 March 2024
(This article belongs to the Special Issue Pathogenesis and Treatment Progress of Chronic Kidney Diseases Volume II)
Abstract
:Cadmium (Cd) is a metal with no nutritional value or physiological role. However, it is found in the body of most people because it is a contaminant of nearly all food types and is readily absorbed. The body burden of Cd is determined principally by its intestinal absorption rate as there is no mechanism for its elimination. Most acquired Cd accumulates within the kidney tubular cells, where its levels increase through to the age of 50 years but decline thereafter due to its release into the urine as the injured tubular cells die. This is associated with progressive kidney disease, which is signified by a sustained decline in the estimated glomerular filtration rate (eGFR) and albuminuria. Generally, reductions in eGFR after Cd exposure are irreversible, and are likely to decline further towards kidney failure if exposure persists. There is no evidence that the elimination of current environmental exposure can reverse these effects and no theoretical reason to believe that such a reversal is possible. This review aims to provide an update on urinary and blood Cd levels that were found to be associated with GFR loss and albuminuria in the general populations. A special emphasis is placed on the mechanisms underlying albumin excretion in Cd-exposed persons, and for an accurate measure of the doses–response relationships between Cd exposure and eGFR, its excretion rate must be normalised to creatinine clearance. The difficult challenge of establishing realistic Cd exposure guidelines such that human health is protected, is discussed.
1. Introduction
Chronic kidney disease (CKD) is a progressive disease which affects 8–16% of the world’s population [1,2,3]. It contributes significantly to global morbidity and mortality, and it is predicted to become the 5th leading cause of years life lost by 2040 [4]. Aging, being overweight, having diabetes or hypertension and chronic exposure to nephrotoxic chemicals are risk factors for CKD [1,2,3].
Diagnostic criteria for CKD include a fall in the estimated glomerular filtration rate (eGFR) below 60 mL/min/1.73 m2, termed low eGFR, or there is albuminuria that persists for at least 3 months [1,2]. Albuminuria is designated when the excretion of albumin (Ealb), measured as the albumin-to-creatinine ratio (ACR), rises to levels above 20 and 30 mg/g creatinine in men and women, respectively [1,2].
Cadmium (Cd) is a metal pollutant and a cumulative nephrotoxin presenting worldwide public health concerns because it is found in most food types [5,6,7]. For most people, diet is the main non-workplace exposure to Cd [5,6,7]. Polluted air, active and passive smoking are additional Cd exposure sources [8,9]. The intestinal absorption of Cd and its transport pathways to kidneys and other target organs follow those for essential metals closely, notably iron, zinc and calcium [1,10]. The roles of zinc and iron transporters and proteins of iron homeostasis as the determinants of blood and urinary Cd levels have been substantiated by genetic linkage studies [11,12,13]. Body iron stores and nutritional status of zinc are inversely associated with the body burden of Cd [14].
Due to a lack of excretory mechanisms, the kidney Cd content increases with age [15,16,17]. The most frequently reported effects of Cd exposure include kidney tubular cell damage and tubular proteinuria, evident from an increased excretion of the low-molecular weight protein β2-microglobulin (β2M) [18]. An increase in β2M excretion has long been used as evidence of tubular dysfunction. A Japanese cohort study reported that an increased level of urinary β2M was associated with a 79% increased risk of a large decline in eGFR (10 mL/min/1.73 m2) over a five-year observation period [19]. Thus, an increased β2M may also result from loss of nephrons for any reason.
This review has three major aims: firstly, to provide an update on the exposure levels to Cd in the general population that were found to be associated with an enhanced risk of CKD. A special emphasis is placed on the mechanisms by which Cd reduces the absorption of albumin, leading to albuminuria. This has not been clearly defined. The second aim is to demonstrate the impact of a conventional method of the normalisation of the excretion rates of Cd and albumin to creatinine excretion (Ecr) on the dose–response and health risk analyses of Cd. The third aim is, to illustrate that current exposure guidelines do not provide enough of a margin to protect health. To this end, eGFR reduction and albuminuria are proposed to be the adverse health outcomes of chronic Cd exposure according to which protective exposure guidelines should be formulated.
2. Environmental Cadmium Exposure and Risk of Chronic Kidney Disease
This section highlights epidemiological data that link an increased risk of CKD to Cd exposure in non-occupationally exposed populations.
2.1. Findings from Systematic Reviews and Meta-Analyses
Doccioli et al. (2024) conducted a systematic review and meta-analysis to evaluate the strength of an association between CKD and Cd exposure [20]. They reported that Cd exposure was associated with an increased risk of CKD only when assessed by eGFR, and the association was more evident for blood than for urinary Cd or dietary exposure [20].
Previously, Jalili et al. (2021) reported that an association of eGFR and urinary Cd was insignificant, but the risk of proteinuria rose by 35%, when the top category of Cd dose metrics was compared with the bottom Cd exposure category [21]. Byber et al. (2016) concluded that Cd exposure was not associated with a progressive decline in eGFR [22].
Nearly all studies used ACR to define albuminuria and urinary Cd normalised to Ecr as ECd/Ecr to indicate long-term exposure to Cd. However, the Ecr-adjustment appeared to introduce variance to datasets, which created a high degree of statistical uncertainty [23]. In effect, the associations between ECd/Ecr and eGFR and Ealb/Ecr (ACR) are statistically insignificant (Section 2.3).
2.2. Exposure Levels of Concern
The dose–response studies showing Cd exposure levels associated with a low eGFR, albuminuria and proteinuria can be found in Table 1.
A study from Thailand (n = 1189) reported 6.2-fold and 10.6-fold increases in the risk of a low eGFR as urinary Cd excretion levels rose from ≤0.37 to 0.38–2.49 and ≥2.5 µg/g creatinine, respectively [25]. In a study from China, there was a 2.98-fold increase in the risk of elevated albumin excretion as urinary Cd levels rose from ≤0.32 to >1.72 µg/g creatinine [29]. In a study from Spain, 1.58-fold and 4.54-fold increases in the risk of albuminuria were associated with urinary Cd levels > 0.27 and >0.54 µg/g creatinine, respectively [30].
An association of CKD with Cd exposure was observed in U.S. population studies, [30,31,32,33]. Specifically, an increased risk of CKD among U.S. citizens was linked to blood Cd levels ≥ 0.6 µg/L and urinary Cd levels ≥ 1 µg/g creatinine. Deaths from all causes among U.S. citizens who had CKD increased linearly with urinary and blood Cd levels [33].
The median for ECd/Ecr in women enrolled in the NHANES 1988–1994 was 0.77 μg/g creatinine, higher than that of men (0.58 μg/g creatinine) [34]. A study from Taiwan, including 977 men and 1470 women (mean age 55), reported a mean urinary Cd concentration higher in women than men (0.9 vs. 0.7 µg/L) [35]. A study from Sweden observed higher blood Cd in women than men of a similar age [36]. In a population-based study of Chinese subjects, aged 2.8 to 86.8 years (n = 1235), urinary Cd levels increased with age, peaking at 50 and 60 years in non-smoking women and men, respectively [37].
Associations of eGFR and Cd exposure indicators have been observed in both children and adult populations. Studies from Guatemala [38] and Myanmar [39] reported associations of lower eGFR values and higher Cd excretion rates. A prospective cohort study of Bangladeshi preschool children reported inverse relationships of kidney volume and eGFR with Cd excretion in children at age 5 years [40]. Urinary Cd excretion showed an inverse association with eGFR, especially in girls [40]. A prospective cohort study of Mexican children reported that the mean for dietary Cd exposure was 4.4 µg/d at the baseline, and it rose to 8.1 µg/d after nine years, when a marginally inverse association of eGFR and dietary Cd exposure was observed [41].
The data in Table 1 indicate that ECd/Ecr values ≥ 0.27–0.32 µg/g creatinine may be sufficient to contribute to increased albumin excretion and a decline in eGFR. These responses appeared to occur long before ECd/Ecr reached 5.24 μg/g creatinine, a level at which Eβ2M/Ecr was ≥300 μg/g creatinine. Thus, measures of CKD may serve as suitable indicators of adverse health effect and a basis on which protective exposure guidelines should be formulated (Section 4).
In summary, studies from various countries report disparate levels of urinary and blood Cd. However, they are broadly consistent in reporting that urinary Cd levels associated with a low eGFR and albuminuria were below 5.24 µg/g creatinine, which is the current nephrotoxicity threshold level for Cd. This Cd toxicity threshold level was obtained from a risk assessment model that used β2M excretion ≥ 300 μg/g creatinine as an indicator of adverse health effect of exposure to Cd, detailed in Section 5.
2.3. Impact of Normalisation of Urinary Excretion Rates of Cadmium and Albumin
In the most recent meta-analysis [20], Cd exposure was associated with a low eGFR, but not albuminuria. In this Section, a practice of adjusting urinary excretion of albumin to Ecr, known as ACR, is discussed as a reason for such a report of non-association between albuminuria and Cd exposure.
According to the ACR criterion for CKD diagnosis, a higher ACR cutoff value is used to define albuminuria in women to account for male–female differences in muscle mass. This practice simply reflects the fact that universally women have a lower muscle mass, and thus lower Ecr, compared to men. For the same reason, the normalisation of Cd excretion to Ecr yields typically higher ECd/Ecr values in women, compared to men of similar age [34,35,36,37].
The normalisation of ECd to the excretion of creatinine (Ecr) corrects for urine dilution as follows. If Vu is the rate of urine flow, ECd and Ecr equal [Cd]uVu and [cr]uVu, respectively, and ECd/Ecr simplifies to [Cd]u/[cr]u. Since these two variables, [cr]u and [Cd]u, are not connected biologically, the ratio does not normalise [Cd]u to a factor that affects ECd. The sole virtue of [Cd]u/[cr]u, as opposed to [Cd]u alone, is that it adjusts [Cd]u for Vu. However, this adjustment introduces a source of imprecision, because Ecr is proportional to muscle mass, which varies among people.
Similarly, the normalisation of ECd to creatinine clearance, ECd/Ccr is determined by calculation using an equation [Cd]u[cr]p/[cr]u, which is algebraically simplified from [Cd]uVu/[cr]uVu/[cr]p, where p = plasma and u = urine; ECd = urinary excretion rate of Cd; Vu = urine flow rate; cr = creatinine [42]. ECd/Ccr is expressed as µg/L of filtrate.
The GFR is the product of the nephron number and mean single nephron GFR, while creatinine clearance (Ccr) approximates the GFR [43,44,45]. Because Ccr varies directly with nephron mass, ECd/Ccr depicts the burden of Cd per functioning nephron. Because most or all excreted Cd emanates from injured or dying tubular cells [46]. ECd/Ccr quantifies the severity of the injury due to Cd accumulation at the present time, not the risk of injury in the future.
Timed urine collections are not required. Variation in [cr]u with muscle mass does not affect ECd/Ccr, because [cr]u and [cr]p are proportionally related at any Ccr. At a given tubular cell Cd content, the effect of a reduced nephron number to a lower ECd is offset in the calculation by a rise in [cr]p as Ccr falls, and excretion of Cd per intact nephron is accurately depicted.
2.4. Demonstrable Dose–Response Relationships
To show the effects of normalisation methods on dose–effect relationship evaluation, data on urinary excretion of Cd and various proteins recorded for residents of a Cd-contaminated area of Thailand [47] are recapitulated (Table 2).
Among 215 study subjects, 33, 131 and 51 had eGFR > 90, 61–90 and ≤60 mL/min/1.73 m2, respectively (Table 2). There was no variation in the urinary excretion of Cd, as ECd/Ecr, across the three eGFR groups, thereby suggesting a non-association of eGFR and Cd exposure. In comparison, the urinary excretion of Cd, as ECd/Ccr, differed across the three eGFR groups; the mean ECd/Ccr was the highest, middle and lowest in the low-, moderate- and high-eGFR groups. Those in the low-eGFR group excreted β2M, α1M, albumin, total protein and Cd at the highest rates.
Thus, an accurate quantification of an effect of Cd on the glomerular and tubular functions of kidneys can only be realised when the excretion rates of β2M, α1M, albumin, total protein and Cd itself are normalised to Ccr. The Ccr normalisation is not superfluous given that it eliminates conceptual flaw in the adjustment of the excretion rate to creatinine excretion.
As nephrons are lost, the amount of Cd excreted is expected to be reduced. However, the effect of a reduced nephron number to a lower ECd is offset in the Ccr normalisation by a rise in plasma creatinine as Ccr falls. Consequently, the excretion of Cd per intact nephron is accurately depicted.
In summary, Ccr normalisation is not affected by muscle mass while it corrects for differences in urine dilution and the number functioning nephrons. The utility of Ccr normalised data in mechanistic dissection of the effects of Cd are indicated also in Table 3 and Table 4 [49].
No dose–effect relationships were observed between ECd/Ecr and the prevalence odds of albuminuria and β2-microglobulinuria (Table 3). There was a 3.5-fold increase in the risk of a low eGFR in those with Cd excretion rates of 5–9.99 µg/g creatinine, but not the most severely affected group, compared with a Cd excretion rate < 2 µg/g creatinine. In comparison, clear dose–response relationships were observed for all three adverse outcomes (Table 4). Thus, in Cd-exposed subjects, normalisation of excretion rates to Ccr demonstrated dose–effect relationships that were not evident with normalisation to Ecr.
Based on Ccr-normalised data, an increased excretion of albumin and β2M and a eGFR decline appeared to occur simultaneously. Among these outcomes, eGFR was affected the most, while albumin and β2M were similarly affected. Notably, the eGFR effect of Cd was obscured completely when ECd was normalised to Ecr (Table 2 and Table 3). For Ccr-normalised data, the respective prevalence odds ratios for a low eGFR rose 5.7-fold, 10.3-fold and 18.1-fold in those with (ECd/Ccr) × 100 values of 2–4.99, 5–9.99 and ≥10 µg/L of filtrate, respectively, compared with (ECd/Ccr) × 100 values below 2 µg/L of filtrate.
Clearly, a practice of adjusting the urinary excretion rate of albumin and Cd to Ecr underestimated the severity of Cd effects on both glomerular and tubular functions.
3. Cadmium and Albuminuria
This section provides a summary of the current understanding of tubular reabsorption of proteins. The mechanisms by which Cd reduces albumin reabsorption are highlighted together with the functional consequences of renal Cd accumulation, quantified by fractional reductions in the reabsorptions of albumin. The implication of albumin reabsorption for the delivery of Cd to proximal tubules is discussed.
3.1. Tubular Protein Reabsorption: Overview
Blood perfuses the kidneys at the rate of 1 L per minute, and all renal blood flow is directed through afferent arterioles into glomeruli [50]. Under normal physiologic conditions, 20% of plasma entering the glomerulus is filtered into Bowman’s space. At least 90% of the circulating protein is ultrafilterable, and 99.9% of the filtered load is reabsorbed [51,52,53]. Approximately 40–50 g of protein can be retrieved each day in the proximal tubule of the kidneys, which is divided into segments S1, S2 and S3 [54,55,56,57,58]. The reabsorption of protein via receptor-mediated endocytosis (RME) involving megalin and cubilin occurs mostly in S1, whereas fluid phase endocytosis (FPE) occurs in all three segments [59,60].
Impaired tubular reabsorption of proteins is a known sign of Cd intoxication, which is reflected by an increased excretion of the low-molecular-weight proteins, namely retinol binding protein, α1M, and β2M, reviewed in Satarug and Phelps, 2021 [61]. Given that Cd intoxication is known to impair the reabsorption of β2M (Table 2), it was hypothesised that Cd may interfere with the reabsorption of albumin as well (Figure 1).
In normal kidney health, filtered β2M is reabsorbed and degraded mostly in S1 and to a lesser extent in S2 [62]. β2M is a constituent of the neonatal Fc receptor, FcRn, which mediates the transcytosis of reabsorbed albumin [18,63,64]. There is little evidence for the transcytosis of β2M. Albumin reabsorption occurs in S1, S2 and S3 [58,65], and FPE is believed to initiate most of the transcytosis of albumin [54].
In the circulation, most Cd (90%) is bound to haemoglobin in red blood cells [66,67]. The remainder of Cd (10%) is found in plasma, associated with albumin, histidine and other non-protein thiols, including glutathione, cysteinylglycine, homocysteine and γ-glutamylcysteine [67,68]. The total plasma concentrations of albumin thiols and non-protein thiols were 0.6 mM and 12–20 µM, respectively [68]. As a principal carrier of plasma Cd, the reabsorption of albumin complexed with Cd may provide Cd an entry route to PTCs. In an in vitro experiment, cell injury was observed in the rat proximal tubule WKPT-0293 Cl.2 cells exposed to albumin and β2M complexed with Cd, but the injury was not evident when cells were exposed to albumin or β2M alone [69].
Because the binding of Cd alters the conformation of albumin [70], Cd-bound albumin probably undergoes RME by the megalin–cubilin system and subsequent lysosomal degradation. Cd released during this process may then disrupt megalin homeostasis.
3.2. Albuminuria in Cadmium-Exposed Subjects
Albumin is a negatively charged protein with a molecular weight of 66 kDa and an average half-life in the plasma of 19 days [56,57,71]. Approximately 10–15 g of albumin is synthesised daily in the liver and released into the circulation [54,57,71]. The plasma concentration of albumin ranged between 3.5 g/dL and 5 g/dL. Normally, albumin is not filtered by glomeruli due to its negative charge and a high molecular weight [71]. However, 1–10 g of albumin may reach the tubular lumen by means of transcytosis through endothelial cells and podocyte foot processes [72,73]. The degradation of albumin occurs mainly in muscle, liver and kidney proximal tubular epithelial cells [71].
Albuminuria was observed in female Wistar rats exposed to Cd at 3 mg/kg/day by gavage for 8 weeks [74]. It was suggested that such albuminuria was due to a decreased level of cubilin protein which impaired the tubular reabsorption of albumin [74]. Studies using human renal glomerular endothelial cells showed that Cd at a non-cytotoxic level (1 µM) may increase the glomerular permeability to albumin by causing the redistribution of adheren junction protein vascular endothelial cadherin and β-catenin [75,76]. Another study using cultured LLC-PK1 cells and pig proximal tubular cells showed that Cd reduced the levels of megalin and chloride channel 5 (ClC5), thereby decreasing albumin reabsorption [77].
In any mechanistic dissection, a clear dose–response relationship must first be established, and a population exposed to a wide range of Cd doses is required to meet this requirement. The Mae Sot District in western Thailand appeared to be ideal because it was an area where environmental Cd pollution was endemic [78,79]. This geographic area provided a well-circumscribed population of people with the same level of exposure that would enable one to discern the health impact of dietary Cd exposure [80,81]. More than 40% of residents aged ≥40 years were at risk of Cd-induced toxic injury and Cd-induced tubular dysfunction [81]. Furthermore, the level of Cd exposure among the Mae Sot residents appeared to be moderate enough to be likely experienced by many populations.
In a logistic regression analysis of data from the Mae Sot residents (Table 4), the risk of albuminuria rose 2.1–7.9% for every one-year increase in age; it also rose 2-fold, and 1.9-fold in smokers and those with hypertension. In comparison, the risk of β2-microglobulinuria was not affected by age, smoking or hypertension. However, β2-microglobulinnura and albuminuria both were related to the excretion of Cd in a dose-dependent manner. Adjustment for age reduced variance and tightened the correlations of albumin excretion, β2M excretion and Cd excretion. Consequently, the slope of albumin excretion vs. β2M excretion regressions approached unity. Apparently, these data indicated that Cd affected a single mechanism, leading to reduction in the reabsorption of both albumin and β2M. The proposed mechanism of Cd-induced albuminuria is depicted in Figure 2.
In S1, β2M is reabsorbed via RME, involving the apical protein megalin. β2M is then degraded in lysosomes. Albumin is reabsorbed via RME in S1, and FPE in S1, S2 and S3, and is mostly returned to the circulation via transcytosis. A small fraction of albumin, reabsorbed through RME, undergoes lysosomal degradation. Cd does not disrupt the transcytosis of albumin, but it impairs a single mechanism for RME and the degradation of both β2M and albumin. As inferred from the literature reports, it is proposed that Cd disrupts particularly the function of megalin, thereby decreasing the reabsorption rates of both proteins [49].
3.3. Fractional Reductions in the Reabsorption of Albumin and β2M
Fractional reductions in the reabsorption of albumin and β2M were estimated to assess the functional consequences of renal Cd accumulation for protein reabsorption [49].
In the least affected subjects (eGFR > 90 mL/min/1.73 m2), the mean Ealb/Ccr was 8.57 × 10⁻² mg/L of filtrate and the mean Eβ2M/Ccr was 5.97 µg/L of filtrate. In the most affected subjects (eGFR < 60 mL/min/1.73 m2), the corresponding values of Ealb/Ccr and Eβ2M/Ccr were 70.27 × 10⁻² mg/L of filtrate and 411 µg/L of filtrate, respectively. In the latter group, the mean eGFR was 46.6 mL/min or 67.1 L/d/1.73 m2.
The fractional excretion of albumin (FEalb; excretion rate/filtration rate of albumin) can be estimated as (Ealb/Ccr)(eGFR)/(GSCalb)([alb]p])(eGFR), or (0.7027 mg/L of filtrate)(67.1 L/d)/(10−2)(40,000 mg/L)(67.1 L/d) = 0.0018, or 0.18%, if a glomerular sieving coefficient for albumin (GSCalb) of 10−2 and plasma albumin concentration ([alb]p) of 40 gm/L are assumed. This means that the mean fractional tubular reabsorption of albumin (FTRalb) was 99.8%, even though a rise in absolute albumin excretion was discernible as the eGFR fell. If GSCalb is assumed to have been 10−4 instead of 10−2, the FEalb is 18% and FTRalb is 82%.
If a GSCβ2M of 1 and [β2M]p of 2.0 mg/L (2000 µg/L) are assumed, the mean FEβ2M is (Eβ2M/Ccr)(eGFR)/(GSCβ2M)([β2M]p)(eGFR), or (411 µg/L of filtrate)(67.1 L/d)/(1)(2000 µg/L of plasma)(67.1 L/d) = 0.2055, or 21%. This means that the FTRβ2M is 79%.
It is noteworthy that although the reductions are likely to have resulted from the same altered mechanism, fractional reductions in the reabsorption of albumin and β2M differ greatly if the GSCalb of 10−2 is assumed, and is similar if a GSCalb of 10−4 is assumed.
3.4. Overall Effects of Cadmium Burden on Tubular Function
To assess the overall impact of Cd on tubular protein reabsorption function, the amounts of albumin and β2M that were reabsorbed through RME and subjected to catabolism in lysosomes were estimated, assuming glomerular sieving coefficients for albumin (GSCalb) and β2M (GSCβ2M) to be 0.01 and 1, respectively (Table 5).
3.5. Implication of Albumin Reabsorption for the Delivery of Cadmium to Proximal Tubules
The evolving concept that proximal tubules reabsorb dozens of grams of albumin per day (Table 5) raises important theoretical possibilities concerning the access of Cd to tubular cells. Red blood cells (RBCs) carry at least 90% of circulating Cd [66]. In a lysate of rabbit RBCs, the metal associated primarily with haemoglobin and glutathione [67] in the lysates of RBCs from mice pretreated with subcutaneous Cd for six months, the metal was bound to haemoglobin and to a smaller species, probably MT [66]. Multiple investigative techniques have shown that Cd binds to specific sites on the globin chains of haemoglobin, represented in Figure 1 [82].
The normal mean lifespan of RBCs (and therefore haemoglobin) is 120 days, but changes in RBC membranes induced by Cd may alter the shape of cells, induce premature haemolysis in the reticuloendothelial system (RES), and thereby shorten cellular lifespan [83,84,85]. When senescent RBCs are destroyed in the RES, heme porphyrin groups are metabolised to bilirubin, which is taken up by circulating albumin [86,87]. Presumably, Cd is simultaneously released from globin chains as they are broken down to their constituent amino acids, and since albumin is so abundant in plasma, it is speculated that it is the principal scavenger of Cd from the RES. Cd–albumin complexes are continuously presented to hepatocytes and proximal tubular cells at high rates of blood flow, and both cell types store Cd acquired as CdMT [61,88,89]. The internalisation of Cd from albumin complexes by hepatocytes has been shown [90].
Because the binding of Cd alters the conformation of albumin [70,91], filtered Cd–albumin complexes probably undergo RME by the megalin–cubilin system and subsequent lysosomal degradation. Cd released during this process may then disrupt megalin homeostasis. If the above proposal is correct, then most Cd assimilated from exogenous sources is destined to interact with albumin eventually, even if it is bound to haemoglobin initially.
3.6. Summary on the Impact of Cadmium on Protein Reabsorptive Function
The accumulation of Cd in the kidneys reduced receptor-mediated endocytosis of albumin and β2M. Estimated fractional reductions in the reabsorptions of albumin and β2M were similar (18 vs. 21%) assuming the glomerular sieving coefficients for albumin and β2M to be 10−4 and 0.01, respectively. These impacts of Cd were quantifiable because of the clear dose–effect relationships of Ealb/Ccr, Eβ2M/Ccr, eGFR and the nephron burden of Cd, indicated by ECd/Ccr. In contrast, Ealb/Ecr (ACR), Eβ2M/Ecr and ECd/Ecr were unrelated, thereby precluding a dose–response analysis and nullifying the quantification of Cd effects.
4. eGFR Decline and the Health Risk Assessment of Environmental Cadmium
The data in Table 1 indicate that urinary Cd levels associated with a low eGFR were below the current nephrotoxicity threshold level for Cd of 5.24 µg/g creatinine. Arguably, a declining eGFR may serve as a suitable indicator of the adverse health effect of Cd exposure and a basis to derive protective exposure guidelines. In this section, data on the kidney burden of Cd and an inverse relationship between eGFR and urinary excretion rate of Cd are reiterated together with a benchmark dose (BMD) estimate of the Cd burden that may carry a discernible adverse effect. This BMD estimate has now become a replacement of no-observed-adverse effect level (NOAEL) [92,93].
NOAEL is referred to the highest experimental dose level for which the response does not significantly differ from the response in the control group [94].
4.1. Measurement of Kidney Burden of Cadmium
Cd accumulation in human kidneys can be found in reports of the analysis of post-mortem and biopsied samples (Table 6).
Of note, the Australian study measured the lung Cd content, which was used to assess the contribution of inhalational exposure, where females were found to have higher hepatic and renal cortical Cd levels than males after adjustment for age and inhalational exposure. Renal cortical Cd content increases progressively until the age of 50 years, and declines sharply thereafter. The peak kidney Cd content was 25.9 µg/g [15].
The hepatic Cd content increased gradually with age without interruption, and it was higher in women than in men. It is speculated that iron depletion due to menstrual losses promoted intestinal Cd absorption in women during premenopausal years. It is also speculated that nephron loss and interstitial scarring due to aging and Cd toxicity caused the observed decline in cortical Cd content after the age of 50 years [100,101].
4.2. Cadmium Excretion and Glomerular Filtration Rate
A paradox is evident in the reported relationships of GFR and environmental Cd exposure. Some investigators found that ECd rose with the GFR when exposure was low [102,103,104]. At least two groups found that the GFR fell from normal values as ECd rose minimally [105,106]. To reconcile these observations, it was speculated that the nephrotoxicity of Cd begins with a transitory phase in which cell injury is releasing Cd to filtrate but has not yet led to cell death; during that phase, the number of nephrons determines the ECd. As Cd begins to destroy tubular cells, ECd increases further, even though nephrons drop out and the GFR begins to decline.
A large body of work shows that the GFR fell in both occupational and environmental exposure settings. Nephron loss was most extreme in polluted regions of Japan [107], but it was also documented in other Asian countries and Europe, listed in Table 1 [108,109]. The progression of CKD often continued after cessation of exogenous exposure [110].
Reductions in GFR due to Cd nephropathy could be attributed mostly to tubular injury that disables glomerular filtration and ultimately leads to nephron atrophy, glomerulosclerosis, and interstitial inflammation and fibrosis [111,112].
Under chronic exposure conditions, cellular defence mechanisms are often overwhelmed, i.e., the binding sites are saturated, and Cd that eludes MT complexation promotes the synthesis of reactive oxygen species (ROS) that inflict injury. This injury induces the apoptosis and necrosis of tubular cells, and it undermines the adhesion of cells to one another. Cellular injury also leads to the release of proteins and CdMT into filtrate; compromises protein reabsorption (Section 2) and substances co-transported with sodium; and ultimately reduces the GFR through the destruction of nephrons.
4.3. The NOAEL Equivalent Value of Cadmium Burden
Using eGFR decline as an adverse health effect, the NOAEL equivalent value of ECd/Ccr was determined from a cohort of 1189 Thai subjects (493 males and 696 females) with a mean age of 43.2 years [24]. By definition, a NOAEL equivalent is the lower 95% confidence bound of the benchmark dose (BMD), termed the BMDL value, which is derived from fitting data to various dose–response models, and the ECd/Ccr value that produces eGFR reduction less than 5% can be considered the level that carries a negligible health risk [93,94,113].
The overall percentages of smokers, subjects with hypertension and low eGFR in the Thai cohort used to determine the NOAEL equivalent values of ECd/Ccr were 33.6%, 29.4% and 6.2%, respectively. The dose–response models and the lower and upper 95% confidence bounds of the BMD (BMDL/BMDU) computed from 5% eGFR reduction are provided in Figure 3.
The NOAEL equivalent value of (ECd/Ccr) × 100 was 1.13 µg/L of filtrate in both men and women. Because the basic cellular toxicity mechanism of Cd should be the same, the NOAEL for any effect of Cd can be expected to be identical in women and men. This estimate of a NOAEL equivalent can be translatable to ECd/Ecr values between 0.01 and 0.02 µg/g creatinine.
A previous risk analysis, using β2-microglobulinuria as an indicator of adverse health effect, reported that a BMD value of Cd excretion was higher in female than male residents (8.1 vs. 6.9 μg/g creatinine [81]). These figures are more than 500 times higher than the NOAEL equivalent computed from eGFR decline endpoint.
4.4. Evidence for the Threshold Level of Cadmium
A recent dose–response analysis revealed that a non-toxic level of Cd burden was extremely low (Figure 4), in ranges with the NOAEL equivalent obtained above.
Scatterplots relating eGFR to ECd/Ccr showed that the eGFR rose with Cd exposure when (ECd/Ccr) × 100 values were ≤1.44 and 1.25 µg/L filtrate in women and men, respectively (Figure 4a,b). An inverse relationship of eGFR and Cd exposure was evident when (ECd/Ccr) × 100 values rose above 1.44 and 1.25 µg/L filtrate in women and men, respectively (Figure 4c,d).
5. Past and Present Health Threat of Environmental Cadmium
An outbreak of severe Cd poisoning, known as “itai-itai” disease [115], has brought into focus health threats from the consumption of rice heavily contaminated with Cd. To safeguard against excessive dietary exposure, a tolerable intake level of Cd, a reference dose (RfD), toxicological reference value and permissible levels of Cd in foods were determined [116,117].
This section gives a summary of the existing dietary Cd exposure guidelines and the nephrotoxicity threshold level, which are not protective of human health. The molecular basis for the cytotoxicity of Cd, especially in the proximal tubular cells, is highlighted.
5.1. The WHO Exposure Guidelines and the Nephrotoxicity Threshold Level
Using the excretion rate of β2M ≥ 300 μg/g creatinine as an indicator of the nephrotoxicity of Cd, a provisional tolerable weekly intake (PTWI) of Cd at 7 µg per kg body weight per week was derived by the Food and Agriculture Organization and World Health Organization (FAO/WHO) Joint Expert Committee on Food Additives and Contaminants (JECFA) [116]. Later, the PTWI was amended to a tolerable monthly intake (TMI) of Cd at 25 μg per kg body weight per month, equivalent to 0.83 μg per kg body weight per day (58 µg/day for a 70 kg person), and the Cd excretion of 5.24 μg/g creatinine was employed as a nephrotoxicity threshold value [116].
The rice Cd content of 0.27 mg/kg may be sufficient to cause kidney and bone damage like those found in itai-itai disease patients [118]. This rice Cd content is below the Codex standard for rice of 0.4 mg/kg [117]. Also, a lifetime Cd intake ≥ 1 g, which is half of the JECFA exposure guideline [116], yielded a 49% increase in mortality from kidney failure, especially among women [119]. These findings cast considerable doubt on the Codex maximally permissible Cd level in rice of 0.4 mg/kg and the lifetime tolerable Cd intake of 2 g [116].
A study from China suggested an upper limit of a permissible level of Cd in rice to be 0.2 mg/kg, one half of the Codex standard [120]. All these estimations relied on the threshold of nephrotoxicity at a Cd excretion rate of 5.24 μg/g creatinine to indicate a toxic Cd accumulation level. Of note, the prevalence odds for a low eGFR and albuminuria rose at the Cd excretion levels of ≥0.27–0.32 µg/g creatinine (Table 1). Thus, these indicators of Cd toxicity occurred long before Cd excretion reached 5.24 μg/g creatinine level, at which the excretion of β2M rises above 300 μg/g creatinine. Furthermore, the likelihood of eGFR to fall below 60 mL/min/1.73 m2 rose 4.7-fold, 6.2-fold and 10.5-fold in those who had β2M excretion levels of 100–299, 300–999 and ≥1000 μg/g creatinine, respectively [121]. Because eGFR values ≤ 60 mL/min/1.73 m2 are indicative of substantial nephron loss [121], a rise of β2M excretion levels ≥ 300 μg/g creatinine is a manifestation of severe toxicity of Cd; as such, its use in health risk estimation is inappropriate. The reasons for a massive increase in β2M excretion, especially in those with a low eGFR, can be found below.
5.2. β2-Microglobulinuria Is the Manifestation of Severe Kidney Pathologies
β2M is a low-molecular-weight protein which is completely filtered by the glomeruli, and virtually all filtered β2M is reabsorbed by proximal tubules and subjected to lysosomal degradation [18,122,123,124]. Most of the β2M that undergoes tubular degradation is from glomerular filtration, while a small fraction of the protein is from peritubular capillaries [123]. When the GFR drops, the plasma β2M level increases subsequently, and an equilibrium between the filtered β2M and its tubular degradation is maintained [122,123,124].
Using the same concept as that in Section 3.3, a substantial increase in the excretion of β2M in response to nephron loss is demonstrable in the following two scenarios.
At a β2M excretion rate of 300 µg/day, an excretion of Cd of 1 µg/day, GFR of 144 L/day (100 mL/min) and filterable plasma concentration of β2M of 2.0 mg/L, the fractional excretion of β2M is 0.1% and fractional reabsorption is 99.9%.
A two-fold increment of urinary excretion of β2M to 600 µg/g creatinine necessitates an increase in the fractional excretion of β2M from 0.1% to 0.2% and a reduction in fractional excretion of β2M to 99.8%. Thus, miniscule Cd-induced reductions in the fractional reabsorption of β2M result in an increase in the excretion of β2M from 300 to 600 µg/g creatinine [125]. The slight reductions in the fractional reabsorption of β2M should not be interpreted to suggest that the effect of Cd is trivial. The excretion rates of β2M above 300 µg/g creatinine are at least 10 times higher than in normal populations [126,127].
The excretion of β2M can be related to its tubular maximal reabsorption (Tmβ2M). This Tmβ2M was not found in dogs [123] but in rats, where Tmβ2MG was observed to be at a plasma β2M concentration four times higher than the normal level [51].
Multiple lines of evidence suggest that Cd may impose a Tmβ2M or reduce one that already exists, and an increased excretion of β2M indicates reduced β2M reabsorption per nephron at any GFR [128]. Once Cd has established a Tmβ2M, the excretion of β2M can be expected to rise substantially as the GFR falls [122].
5.3. Cadmium and Renal Tubular Cell Death: Molecular Basis
5.3.1. Mitochondrial Dysfunction and Calcium Homeostasis Disruption
Proximal tubular epithelial cells of the kidneys are highly susceptible to mitochondrial toxicant, like Cd, because of their intense metabolic activity, high-energy demand and heavy reliance on autophagy for survival [129,130]. Examples of the effects of Cd on mitochondrial function include impaired energy production, disrupted electron transport chain and enhanced ROS generation [5,130].
The disruption of calcium homeostasis has been suggested to be another mechanism by which Cd induces tubular cell death [131,132,133]. In primary rat proximal tubular cells, Cd caused calcium release from the endoplasmic reticulum, which raised intracellular calcium concentrations and inhibited autophagy [131,132]. In mouse renal tubular cells, Cd appeared to activate at least two calcium channels, namely phospholipase C (PLC)-inositol 1, 4, 5-trisphosphate receptor (IP3R) and the sarco/endoplasmic reticulum Ca2+-ATPase (SERCA), known to be involved in the release and reuptake of calcium by the ER [132]. Cd also suppressed SERCA expression and diminished the stability of the SERCA protein in mouse tubular epithelial cells, thereby intensifying the toxic effects of Cd [133].
5.3.2. The Deprivation of Cellular Antioxidant Defence by Cadmium
At least two major lines of cellular defence mechanisms against the cytotoxicity of Cd have been investigated. One involves the induction of the metal binding protein MT, and the other involves glutathione together with various antioxidant enzyme systems. The induction of heme oxygenase-1 (HO-1) has long been the therapeutic target of Cd toxicity in the belief that the induced expression of HO-1 will generate a potent antioxidant molecule, bilirubin, to neutralise ROS. Cd, itself, is a well-known HO-1 inducer, but distinctively, HO-1 induction by Cd is not coupled with bilirubin synthesis [134].
Takeda et al. (2015) used the eel fluorescent protein UnaG, capable of binding unconjugated bilirubin, to measure intracellular bilirubin production [135]. They found that all cell types synthesised heme as a precursor substrate for the production of antioxidant bilirubin [134]. Takeda et al. have further unveiled that Cd2+ and inorganic arsenic as As3+ increased the expression of HO-1, but the production of bilirubin remained unchanged.
In summary, the discovery that HO-1 induction by Cd is not coupled with bilirubin synthesis is of significance to our understanding of the pervasiveness of Cd toxicity. This metal Cd increases cellular oxidative stress and deprives the cellular frontline antioxidant defence at the same time. In the best interest of public health protection, an acceptable Cd exposure level and its toxicity threshold level should be formulated using the current scientific knowledge, elaborated herein.
6. Conclusions
As the result of cadmium accumulation in kidney proximal tubular cells, the GFR, and fractional reabsorption rates of albumin and β2-microglobulin are reduced simultaneously, leading to an increased excretion of both proteins. It appears that cadmium adversely affects a single phenomenon involved in the reabsorption of both albumin and β2-mcroglobulin. The affected phenomenon is probably receptor-mediated endocytosis involving megalin.
The practice of adjusting the excretion rates of cadmium and albumin to the excretion of creatinine incorporates a conceptual flaw that can be eliminated if the rates are normalised to creatinine clearance. The urinary excretion rate of cadmium, normalized to creatinine clearance (ECd/Ccr), quantifies the severity of the kidney tubular injury due to cadmium accumulation at the present time, not the risk of injury in the future.
The NOAEL equivalent of Cd accumulation levels corresponding to a discernible GFR decline is extremely low. Now is the time to acknowledge that there is no safe level of Cd exposure. At present, no effective chelation therapy exists for the removal of Cd from the kidneys. Commonsense therapeutic measures include the cessation of environmental exposure.
Funding
This work was supported with resources from the Centre for Kidney Disease Research, Translational Research Institute, and the Department of Kidney and Transplant Services, Princess Alexandra Hospital.
Institutional Review Board Statement
Not applicable.
Informed Consent Statement
Not applicable.
Data Availability Statement
Not applicable.
Acknowledgments
The author thanks David Vesey and Aleksandar Cirovic for comments on the manuscript draft, editing the English and assistance with drawing the figures. The author gratefully acknowledges overseas travel grants and partial research project funds through the Reverse Brain Drain Project, the Commission of Higher Education, Thailand Ministry of Education, and the National Science and Technology Development Agency, Thailand Ministry of Sciences and Technology.
Conflicts of Interest
The author declares no conflicts of interest.
References
- Kalantar-Zadeh, K.; Jafar, T.H.; Nitsch, D.; Neuen, B.L.; Perkovic, V. Chronic kidney disease. Lancet 2021, 398, 786–802. [Google Scholar] [CrossRef]
- Murton, M.; Goff-Leggett, D.; Bobrowska, A.; Garcia Sanchez, J.J.; James, G.; Wittbrodt, E.; Nolan, S.; Sörstadius, E.; Pecoits-Filho, R.; Tuttle, K. Burden of chronic kidney disease by KDIGO categories of glomerular filtration rate and albuminuria: A Systematic review. Adv. Ther. 2021, 38, 180–200. [Google Scholar] [CrossRef]
- Rex, N.; Melk, A.; Schmitt, R. Cellular senescence and kidney aging. Clin. Sci. 2023, 137, 1805–1821. [Google Scholar] [CrossRef]
- Foreman, K.J.; Marquez, N.; Dolgert, A.; Fukutaki, K.; Fullman, N.; McGaughey, M.; Pletcher, M.A.; Smith, A.E.; Tang, K.; Yuan, C.W.; et al. Forecasting life expectancy, years of life lost, and all-cause and cause-specific mortality for 250 causes of death: Reference and alternative scenarios for 2016-40 for 195 countries and territories. Lancet 2018, 392, 2052–2090. [Google Scholar] [CrossRef]
- Satarug, S.; Vesey, D.A.; Gobe, G.C.; Phelps, K.R. Estimation of health risks associated with dietary cadmium exposure. Arch. Toxicol. 2023, 97, 329–358. [Google Scholar] [CrossRef]
- Fechner, C.; Hackethal, C.; Höpfner, T.; Dietrich, J.; Bloch, D.; Lindtner, O.; Sarvan, I. Results of the BfR MEAL Study: In Germany, mercury is mostly contained in fish and seafood while cadmium, lead, and nickel are present in a broad spectrum of foods. Food Chem. X 2022, 14, 100326. [Google Scholar] [CrossRef]
- Almerud, P.; Zamaratskaia, G.; Lindroos, A.K.; Bjermo, H.; Andersson, E.M.; Lundh, T.; Ankarberg, E.H.; Lignell, S. Cadmium, total mercury, and lead in blood and associations with diet, sociodemographic factors, and smoking in Swedish adolescents. Environ. Res. 2021, 197, 110991. [Google Scholar] [CrossRef]
- Pappas, R.S.; Fresquez, M.R.; Watson, C.H. Cigarette smoke cadmium breakthrough from traditional filters: Implications for exposure. J. Anal. Toxicol. 2015, 39, 45–51. [Google Scholar] [CrossRef]
- Kim, J.; Song, H.; Lee, J.; Kim, Y.J.; Chung, H.S.; Yu, J.M.; Jang, G.; Park, R.; Chung, W.; Oh, C.M.; et al. Smoking and passive smoking increases mortality through mediation effect of cadmium exposure in the United States. Sci. Rep. 2023, 13, 3878. [Google Scholar] [CrossRef]
- Thévenod, F.; Herbrechter, R.; Schlabs, C.; Pethe, A.; Lee, W.K.; Wolff, N.A.; Roussa, E. Role of the SLC22A17/lipocalin-2 receptor in renal endocytosis of proteins/metalloproteins: A focus on iron- and cadmium-binding proteins. Am. J. Physiol. Ren. Physiol. 2023, 325, F564–F577. [Google Scholar] [CrossRef]
- Rentschler, G.; Kippler, M.; Axmon, A.; Raqib, R.; Skerfving, S.; Vahter, M.; Broberg, K. Cadmium concentrations in human blood and urine are associated with polymorphisms in zinc transporter genes. Metallomics 2014, 6, 885–891. [Google Scholar] [CrossRef]
- Rentschler, G.; Kippler, M.; Axmon, A.; Raqib, R.; Ekström, E.C.; Skerfving, S.; Vahter, M.; Broberg, K. Polymorphisms in iron homeostasis genes and urinary cadmium concentrations among nonsmoking women in Argentina and Bangladesh. Environ. Health Perspect. 2013, 121, 467–472. [Google Scholar] [CrossRef]
- Ng, E.; Lind, P.M.; Lindgren, C.; Ingelsson, E.; Mahajan, A.; Morris, A.; Lind, L. Genome-wide association study of toxic metals and trace elements reveals novel associations. Hum. Mol. Genet. 2015, 24, 4739–4745. [Google Scholar] [CrossRef]
- Peng, X.; Li, C.; Zhao, D.; Huang, L. Associations of micronutrients exposure with cadmium body burden among population: A systematic review. Ecotoxicol. Environ. Saf. 2023, 256, 114878. [Google Scholar] [CrossRef]
- Satarug, S.; Baker, J.R.; Reilly, P.E.B.; Moore, M.R.; Williams, D.J. Cadmium levels in the lung, liver, kidney cortex, and urine samples from Australians without occupational exposure to metals. Arch. Environ. Health 2002, 57, 69–77. [Google Scholar] [CrossRef]
- Elinder, C.G.; Lind, B.; Kjellström, T.; Linnman, L.; Friberg, L. Cadmium in kidney cortex, liver, and pancreas from Swedish autopsies. Estimation of biological half time in kidney cortex, considering calorie intake and smoking habits. Arch. Environ. Health 1976, 31, 292–302. [Google Scholar] [CrossRef]
- Barregard, L.; Sallsten, G.; Lundh, T.; Mölne, J. Low-level exposure to lead, cadmium and mercury, and histopathological findings in kidney biopsies. Environ. Res. 2022, 211, 113119. [Google Scholar] [CrossRef]
- Argyropoulos, C.P.; Chen, S.S.; Ng, Y.-H.; Roumelioti, M.-E.; Shaffi, K.; Singh, P.P.; Tzamaloukas, A.H. Rediscovering Beta-2 microglobulin as a biomarker across the spectrum of kidney diseases. Front. Med. 2017, 4, 73. [Google Scholar] [CrossRef] [PubMed]
- Kudo, K.; Konta, T.; Mashima, Y.; Ichikawa, K.; Takasaki, S.; Ikeda, A.; Hoshikawa, M.; Suzuki, K.; Shibata, Y.; Watanabe, T.; et al. The association between renal tubular damage and rapid renal deterioration in the Japanese population: The Takahata study. Clin. Exp. Nephrol. 2011, 15, 235–241. [Google Scholar] [CrossRef] [PubMed]
- Doccioli, C.; Sera, F.; Francavilla, A.; Cupisti, A.; Biggeri, A. Association of cadmium environmental exposure with chronic kidney disease: A systematic review and meta-analysis. Sci. Total Environ. 2024, 906, 167165. [Google Scholar] [CrossRef] [PubMed]
- Jalili, C.; Kazemi, M.; Cheng, H.; Mohammadi, H.; Babaei, A.; Taheri, E.; Moradi, S. Associations between exposure to heavy metals and the risk of chronic kidney disease: A systematic review and meta-analysis. Crit. Rev. Toxicol. 2021, 51, 165–182. [Google Scholar] [CrossRef]
- Byber, K.; Lison, D.; Verougstraete, V.; Dressel, H.; Hotz, P. Cadmium or cadmium compounds and chronic kidney disease in workers and the general population: A systematic review. Crit. Rev. Toxicol. 2016, 46, 191–240. [Google Scholar] [CrossRef]
- Satarug, S.; Vesey, D.A.; Gobe, G.C.; Yimthiang, S.; Buha Đorđević, A. Health risk in a geographic area of Thailand with endemic cadmium contamination: Focus on albuminuria. Toxics 2023, 11, 68. [Google Scholar] [CrossRef]
- Satarug, S.; Đorđević, A.B.; Yimthiang, S.; Vesey, D.A.; Gobe, G.C. The NOAEL equivalent of environmental cadmium exposure associated with GFR reduction and chronic kidney disease. Toxics 2022, 10, 614. [Google Scholar] [CrossRef]
- Myong, J.-P.; Kim, H.-R.; Baker, D.; Choi, B. Blood cadmium and moderate-to-severe glomerular dysfunction in Korean adults: Analysis of KNHANES 2005–2008 data. Int. Arch. Occup. Environ. Health 2012, 85, 885–893. [Google Scholar] [CrossRef] [PubMed]
- Chung, S.; Chung, J.H.; Kim, S.J.; Koh, E.S.; Yoon, H.E.; Park, C.W.; Chang, Y.S.; Shin, S.J. Blood lead and cadmium levels and renal function in Korean adults. Clin. Exp. Nephrol. 2014, 18, 726–734. [Google Scholar] [CrossRef] [PubMed]
- Tsai, H.J.; Hung, C.H.; Wang, C.W.; Tu, H.P.; Li, C.H.; Tsai, C.C.; Lin, W.Y.; Chen, S.C.; Kuo, C.H. Associations among heavy metals and proteinuria and chronic kidney disease. Diagnostics 2021, 11, 282. [Google Scholar] [CrossRef]
- Feng, X.; Zhou, R.; Jiang, Q.; Wang, Y.; Chen, C. Analysis of cadmium accumulation in community adults and its correlation with low-grade albuminuria. Sci. Total Environ. 2022, 834, 155210. [Google Scholar] [CrossRef] [PubMed]
- Grau-Perez, M.; Pichler, G.; Galan-Chilet, I.; Briongos-Figuero, L.S.; Rentero-Garrido, P.; Lopez-Izquierdo, R.; Navas-Acien, A.; Weaver, V.; García-Barrera, T.; Gomez-Ariza, J.L.; et al. Urine cadmium levels and albuminuria in a general population from Spain: A gene-environment interaction analysis. Environ. Int. 2017, 106, 27–36. [Google Scholar] [CrossRef]
- Navas-Acien, A.; Tellez-Plaza, M.; Guallar, E.; Muntner, P.; Silbergeld, E.; Jaar, B.; Weaver, V. Blood cadmium and lead and chronic kidney disease in US adults: A joint analysis. Am. J. Epidemiol. 2009, 170, 1156–1164. [Google Scholar] [CrossRef]
- Ferraro, P.M.; Costanzi, S.; Naticchia, A.; Sturniolo, A.; Gambaro, G. Low level exposure to cadmium increases the risk of chronic kidney disease: Analysis of the NHANES 1999–2006. BMC Publ. Health 2010, 10, 304. [Google Scholar] [CrossRef] [PubMed]
- Madrigal, J.M.; Ricardo, A.C.; Persky, V.; Turyk, M. Associations between blood cadmium concentration and kidney function in the U.S. population: Impact of sex, diabetes and hypertension. Environ. Res. 2018, 169, 180–188. [Google Scholar] [CrossRef] [PubMed]
- Zhang, J.; Wang, X.; Ma, Z.; Dang, Y.; Yang, Y.; Cao, S.; Ouyang, C.; Shi, X.; Pan, J.; Hu, X. Associations of urinary and blood cadmium concentrations with all-cause mortality in US adults with chronic kidney disease: A prospective cohort study. Environ. Sci. Pollut. Res. Int. 2023, 30, 61659–61671. [Google Scholar] [CrossRef] [PubMed]
- Lin, Y.S.; Caffrey, J.L.; Lin, J.W.; Bayliss, D.; Faramawi, M.F.; Bateson, T.F.; Sonawane, B. Increased risk of cancer mortality associated with cadmium exposures in older Americans with low zinc intake. J. Toxicol. Environ Health A 2013, 76, 1–15. [Google Scholar] [CrossRef] [PubMed]
- Huang, C.H.; Wang, C.W.; Chen, H.C.; Tu, H.P.; Chen, S.C.; Hung, C.H.; Kuo, C.H. Gender difference in the associations among heavy metals with red blood cell hemogram. Int. J. Environ. Res. Public Health 2021, 19, 189. [Google Scholar] [CrossRef] [PubMed]
- Olsén, L.; Lind, P.M.; Lind, L. Gender differences for associations between circulating levels of metals and coronary risk in the elderly. Int. J. Hyg. Environ. Health 2012, 215, 411–417. [Google Scholar] [CrossRef]
- Sun, H.; Wang, D.; Zhou, Z.; Ding, Z.; Chen, X.; Xu, Y.; Huang, L.; Tang, D. Association of cadmium in urine and blood with age in a general population with low environmental exposure. Chemosphere 2016, 156, 392–397. [Google Scholar] [CrossRef]
- Butler-Dawson, J.; James, K.A.; Krisher, L.; Jaramillo, D.; Dally, M.; Neumann, N.; Pilloni, D.; Cruz, A.; Asensio, C.; Johnson, R.J.; et al. Environmental metal exposures and kidney function of Guatemalan sugarcane workers. J. Expo. Sci. Environ. Epidemiol. 2022, 32, 461–471. [Google Scholar] [CrossRef]
- Win-Thu, M.; Myint-Thein, O.; Win-Shwe, T.-T.; Mar, O. Environmental cadmium exposure induces kidney tubular and glomerular dysfunction in the Myanmar adults. J. Toxicol. Sci. 2021, 46, 319–328. [Google Scholar] [CrossRef]
- Skröder, H.; Hawkesworth, S.; Kippler, M.; El Arifeen, S.; Wagatsuma, Y.; Moore, S.E.; Vahter, M. Kidney function and blood pressure in preschool-aged children exposed to cadmium and arsenic-potential alleviation by selenium. Environ. Res. 2015, 140, 205–213. [Google Scholar] [CrossRef]
- Rodríguez-López, E.; Tamayo-Ortiz, M.; Ariza, A.C.; Ortiz-Panozo, E.; Deierlein, A.L.; Pantic, I.; Tolentino, M.C.; Es-trada-Gutiérrez, G.; Parra-Hernández, S.; Espejel-Núñez, A.; et al. Early-life dietary cadmium exposure and kidney function in 9-year-old children from the PROGRESS cohort. Toxics 2020, 8, 83. [Google Scholar] [CrossRef]
- Phelps, K.R.; Gosmanova, E.O. A generic method for analysis of plasma concentrations. Clin. Nephrol. 2020, 94, 43–49. [Google Scholar] [CrossRef]
- Denic, A.; Elsherbiny, H.; Rule, A.D. In-vivo techniques for determining nephron number. Curr. Opin. Nephrol. Hypertens. 2019, 28, 545–551. [Google Scholar] [CrossRef]
- Soveri, I.; Berg, U.B.; Björk, J.; Elinder, C.G.; Grubb, A.; Mejare, I.; Sterner, G.; Bäck, S.E.; SBU GFR Review Group. Measuring GFR: A systematic review. Am. J. Kidney Dis. 2014, 64, 411–424. [Google Scholar] [CrossRef]
- White, C.A.; Allen, C.M.; Akbari, A.; Collier, C.P.; Holland, D.C.; Day, A.G.; Knoll, G.A. Comparison of the new and traditional CKD-EPI GFR estimation equations with urinary inulin clearance: A study of equation performance. Clin. Chim. Acta 2019, 488, 189–195. [Google Scholar] [CrossRef] [PubMed]
- Satarug, S.; Vesey, D.A.; Ruangyuttikarn, W.; Nishijo, M.; Gobe, G.C.; Phelps, K.R. The source and pathophysiologic significance of excreted cadmium. Toxics 2019, 7, 55. [Google Scholar] [CrossRef]
- Satarug, S.; Vesey, D.A.; Gobe, G.C. Cadmium-induced proteinuria: Mechanistic insights from dose–effect analyses. Int. J. Mol. Sci. 2023, 24, 1893. [Google Scholar] [CrossRef] [PubMed]
- Levey, A.S.; Stevens, L.A.; Scmid, C.H.; Zhang, Y.; Castro, A.F., III; Feldman, H.I.; Kusek, J.W.; Eggers, P.; Van Lente, F.; Greene, T.; et al. A new equation to estimate glomerular filtration rate. Ann. Intern. Med. 2009, 150, 604–612. [Google Scholar] [CrossRef] [PubMed]
- Satarug, S.; Vesey, D.A.; Gobe, G.C.; Phelps, K.R. The pathogenesis of albuminuria in cadmium nephropathy. Curr. Res. Toxicol. 2024, 6, 100140. [Google Scholar] [CrossRef] [PubMed]
- Navar, L.G.; Maddox, D.A.; Munger, K.A. Chapter 3: The renal circulations and glomerular filtration. In Brenner and Rector’s the Kidney, 11th ed.; Elsevier: Philadelphia, PA, USA, 2020; pp. 80–114. [Google Scholar]
- Gauthier, C.; Nguyen-Simonnet, H.; Vincent, C.; Revillard, J.-P.; Pellet, M.V. Renal tubular absorption of β2-microglobulin. Kidney Int. 1984, 26, 170–175. [Google Scholar] [CrossRef] [PubMed]
- Norden, A.G.W.; Lapsley, M.; Lee, P.J.; Pusey, C.D.; Scheinman, S.J.; Tam, F.W.K.; Thakker, R.V.; Unwin, R.J.; Wrong, O. Glomerular protein sieving and implications for renal failure in Fanconi syndrome. Kidney Int. 2001, 60, 1885–1892. [Google Scholar] [CrossRef]
- Nielsen, R.; Christensen, E.I.; Birn, H. Megalin and cubilin in proximal tubule protein reabsorption: From experimental models to human disease. Kidney Int. 2016, 89, 58–67. [Google Scholar] [CrossRef]
- Molitoris, B.A.; Sandoval, R.M.; Yadav, S.P.S.; Wagner, M.C. Albumin uptake and processing by the proximal tubule: Physiological, pathological, and therapeutic implications. Physiol. Rev. 2022, 102, 1625–1667. [Google Scholar] [CrossRef]
- Eshbach, M.L.; Weisz, O.A. Receptor-mediated endocytosis in the proximal tubule. Annu. Rev. Physiol. 2017, 79, 425–448. [Google Scholar] [CrossRef]
- Comper, W.D.; Vuchkova, J.; McCarthy, K.J. New insights into proteinuria/albuminuria. Front. Physiol. 2022, 13, 991756. [Google Scholar] [CrossRef]
- Benzing, T.; Salant, D. Insights into glomerular filtration and albuminuria. N. Engl. J. Med. 2021, 384, 1437–1446. [Google Scholar] [CrossRef]
- Clapp, W.L.; Park, C.H.; Madsen, K.M.; Tisher, C.C. Axial heterogeneity in the handling of albumin by the rabbit proximal tubule. Lab. Investig. 1988, 58, 549–558. [Google Scholar] [PubMed]
- Schuh, C.D.; Polesel, M.; Platonova, E.; Haenni, D.; Gassama, A.; Tokonami, N.; Ghazi, S.; Bugarski, M.; Devuyst, O.; Ziegler, U.; et al. Combined structural and functional imaging of the kidney reveals major axial differences in proximal tubule endocytosis. J. Am. Soc. Nephrol. 2018, 29, 2696–2712. [Google Scholar] [CrossRef] [PubMed]
- Wagner, M.C.; Sandoval, R.M.; Yadav, S.P.S.; Campos, S.B.; Rhodes, G.J.; Phillips, C.L.; Molitoris, B.A. Lrpap1 (RAP) inhibits proximal tubule clathrin mediated and clathrin independent endocytosis, ameliorating renal aminoglycoside nephrotoxicity. Kidney360 2023, 4, 591–605. [Google Scholar] [CrossRef]
- Satarug, S.; Phelps, K.R. Cadmium Exposure and Toxicity. In Metal Toxicology Handbook; Bagchi, D., Bagchi, M., Eds.; CRC Press: Boca Raton, FL, USA, 2021; pp. 219–274. [Google Scholar]
- Polesel, M.; Kaminska, M.; Haenni, D.; Bugarski, M.; Schuh, C.; Jankovic, N.; Kaech, A.; Mateos, J.M.; Berquez, M.; Hall, A.M. Spatiotemporal organisation of protein processing in the kidney. Nat. Commun. 2022, 13, 5732. [Google Scholar] [CrossRef] [PubMed]
- Sarav, M.; Wang, Y.; Hack, B.K.; Chang, A.; Jensen, M.; Bao, L.; Quigg, R.J. Renal FcRn reclaims albumin but facilitates elimination of IgG. J. Am. Soc. Nephrol. 2009, 20, 1941–1952. [Google Scholar] [CrossRef]
- Tenten, V.; Menzel, S.; Kunter, U.; Sicking, E.-M.; van Roeyen, C.R.C.; Sanden, S.K.; Kaldenbach, M.; Boor, P.; Fuss, A.; Uhlig, S.; et al. Albumin is recycled from the primary urine by tubular transcytosis. J. Am. Soc. Nephrol. 2013, 24, 1966–1980. [Google Scholar] [CrossRef] [PubMed]
- Tojo, A.; Endou, H. Intrarenal handling of proteins in rats using fractional micropuncture technique. Am. J. Physiol. 1992, 263, F601–F606. [Google Scholar] [CrossRef] [PubMed]
- Nordberg, G.F.; Piscator, M.; Nordberg, M. On the distribution of cadmium in blood. Acta Pharmacol. Toxicol. 1971, 30, 289–295. [Google Scholar] [CrossRef]
- Gibson, M.A.; Sarpong-Kumankomah, S.; Nehzati, S.; George, G.N.; Gailer, J. Remarkable differences in the biochemical fate of Cd2+, Hg2+, CH3Hg+ and thimerosal in red blood cell lysate. Metallomics 2017, 9, 1060–1072. [Google Scholar] [CrossRef]
- Turell, L.; Radi, R.; Alvarez, B. The thiol pool in human plasma: The central contribution of albumin to redox processes. Free Radic. Biol. Med. 2013, 65, 244–253. [Google Scholar] [CrossRef]
- Fels, J.; Scharner, B.; Zarbock, R.; Zavala Guevara, I.P.; Lee, W.K.; Barbier, O.C.; Thévenod, F. Cadmium complexed with β2-microglobulin, albumin and lipocalin-2 rather than metallothionein cause megalin:cubilin dependent toxicity of the renal proximal tubule. Int. J. Mol. Sci. 2019, 20, 2379. [Google Scholar] [CrossRef]
- Liu, Y.; Chen, M.; Jiang, L.; Song, L. New insight into molecular interaction of heavy metal pollutant–cadmium (II) with human serum albumin. Environ. Sci. Pollut. Res. 2014, 21, 6994–7005. [Google Scholar] [CrossRef] [PubMed]
- Gburek, J.; Konopska, B.; Gołąb, K. Renal handling of albumin-from early findings to current concepts. Int. J. Mol. Sci. 2021, 22, 5809. [Google Scholar] [CrossRef]
- Edwards, A.; Long, K.R.; Baty, C.J.; Shipman, K.E.; Weisz, O.A. Modelling normal and nephrotic axial uptake of albumin and other filtered proteins along the proximal tubule. J. Physiol. 2022, 600, 1933–1952. [Google Scholar] [CrossRef]
- Castrop, H.; Schießl, I.M. Novel routes of albumin passage across the glomerular filtration barrier. Acta Physiol. 2017, 219, 544–553. [Google Scholar] [CrossRef]
- Santoyo-Sánchez, M.P.; Pedraza-Chaverri, J.; Molina-Jijón, E.; Arreola-Mendoza, L.; Rodríguez-Muñoz, R.; Barbier, O.C. Impaired endocytosis in proximal tubule from subchronic exposure to cadmium involves angiotensin II type 1 and cubilin receptors. BMC Nephrol. 2013, 14, 211. [Google Scholar] [CrossRef]
- Li, L.; Dong, F.; Xu, D.; Du, L.; Yan, S.; Hu, H.; Lobe, C.G.; Yi, F.; Kapron, C.M.; Liu, J. Short-term, low-dose cadmium exposure induces hyperpermeability in human renal glomerular endothelial cells. J. Appl. Toxicol. 2016, 36, 257–265. [Google Scholar] [CrossRef]
- Li, Z.; Jiang, L.; Tao, T.; Su, W.; Guo, Y.; Yu, H.; Qin, J. Assessment of cadmium-induced nephrotoxicity using a kidney-on-a-chip device. Toxicol. Res. 2017, 6, 372–380. [Google Scholar] [CrossRef]
- Gena, P.; Calamita, G.; Guggino, W.B. Cadmium impairs albumin reabsorption by down-regulating megalin and ClC5 channels in renal proximal tubule cells. Environ. Health Perspect. 2010, 118, 1551–1556. [Google Scholar] [CrossRef] [PubMed]
- Simmons, R.W.; Pongsakul, P.; Saiyasitpanich, D.; Klinpholap, S. Elevated levels of cadmium and zinc in paddy soils and elevated levels of cadmium in rice grain downstream of a zinc mineralized area in Thailand: Implications for public health. Environ. Geochem. Health 2005, 27, 501–511. [Google Scholar] [CrossRef] [PubMed]
- Suwatvitayakorn, P.; Ko, M.S.; Kim, K.W.; Chanpiwat, P. Human health risk assessment of cadmium exposure through rice consumption in cadmium-contaminated areas of the Mae Tao sub-district, Tak, Thailand. Environ. Geochem. Health 2020, 42, 2331–2344. [Google Scholar] [CrossRef]
- Swaddiwudhipong, W.; Nguntra, P.; Kaewnate, Y.; Mahasakpan, P.; Limpatanachote, P.; Aunjai, T.; Jeekeeree, W.; Punta, B.; Funkhiew, T.; Phopueng, I. Human health effects from cadmium exposure: Comparison between persons living in cadmium-contaminated and non-contaminated areas in northwestern Thailand. Southeast Asian J. Trop. Med. Publ. Health 2015, 46, 133–142. [Google Scholar]
- Nishijo, M.; Suwazono, Y.; Ruangyuttikarn, W.; Nambunmee, K.; Swaddiwudhipong, W.; Nogawa, K.; Nakagawa, H. Risk assessment for Thai population: Benchmark dose of urinary and blood cadmium levels for renal effects by hybrid approach of inhabitants living in polluted and non-polluted areas in Thailand. BMC Publ. Health 2014, 14, 702. [Google Scholar] [CrossRef]
- Guo, D.; Liu, R. Spectroscopic investigation of the effects of aqueous-phase prepared CdTe quantum dots on protein hemoglobin at the molecular level. J. Biochem. Mol. Toxicol. 2017, 31, 21953. [Google Scholar] [CrossRef]
- Sopjani, M.; Föller, M.; Dreischer, P.; Lang, F. Stimulation of eryptosis by cadmium ions. Cell Physiol. Biochem. 2008, 22, 245–252. [Google Scholar] [CrossRef]
- Lang, F.; Bissinger, R.; Abed, M.; Artunc, F. Eryptosis—The neglected cause of anemia in end stage renal disease. Kidney Blood Press. Res. 2017, 42, 749–760. [Google Scholar] [CrossRef]
- Horiguchi, H.; Oguma, E.; Kayama, F. Cadmium induces anemia through interdependent progress of hemolysis, body iron accumulation, and insufficient erythropoietin production in rats. Toxicol. Sci. 2011, 122, 198–210. [Google Scholar] [CrossRef]
- Gray, R.D.; Stroupe, S.D. Kinetics and mechanism of bilirubin binding to human serum albumin. J. Biol. Chem. 1978, 253, 4370–4377. [Google Scholar] [CrossRef]
- Petersen, C.E.; Ha, C.-E.; Harohalli, K.; Feix, J.B.; Bhagavan, N.V. A dynamic model for bilirubin binding to human serum albumin. J. Biol. Chem. 2000, 275, 20985–20995. [Google Scholar] [CrossRef]
- Torra, M.; To-Figueras, J.; Brunet, M.; Rodamilans, M.; Corbella, J. Total and methionein-bound cadmium in the liver and the kidney of a population in Barcelona (Spain). Bull. Environ. Contam. Toxicol. 1994, 53, 509–515. [Google Scholar] [CrossRef]
- Yoshida, M.; Ohta, H.; Yamauchi, Y.; Seki, Y.; Sagi, M.; Yamazaki, K.; Sumi, Y. Age-dependent changes in metallothionein levels in liver and kidney of the Japanese. Biol. Trace Elem. Res. 1998, 63, 167–175. [Google Scholar] [CrossRef]
- DelRaso, N.J.; Foy, B.D.; Gearhart, J.M.; Frazier, J.M. Cadmium uptake kinetics in rat hepatocytes: Correction for albumin binding. Toxicol. Sci. 2003, 72, 19–30. [Google Scholar] [CrossRef]
- Chen, M.; Guo, H.; Liu, Y.; Zhang, Q. Structural changes of human serum albumin induced by calcium acetate. J. Biochem. Mol. Toxicol. 2014, 28, 281–287. [Google Scholar] [CrossRef]
- EFSA. European Food Safety Agency, Statement on tolerable weekly intake for cadmium. EFSA J. 2011, 9, 1975. [Google Scholar]
- EFSA Scientific Committee. Update: Use of the benchmark dose approach in risk assessment. EFSA J. 2017, 15, 4658. [Google Scholar]
- Wong, C.; Roberts, S.M.; Saab, I.N. Review of regulatory reference values and background levels for heavy metals in the human diet. Regul. Toxicol. Pharmacol. 2022, 130, 105122. [Google Scholar] [CrossRef]
- Lyon, T.D.; Aughey, E.; Scott, R.; Fell, G.S. Cadmium concentrations in human kidney in the UK: 1978–1993. J. Environ. Monit. 1999, 1, 227–231. [Google Scholar] [CrossRef]
- Benedetti, J.L.; Samuel, O.; Dewailly, E.; Gingras, S.; Lefebvre, M.A. Levels of cadmium in kidney and liver tissues among a Canadian population (province of Quebec). J. Toxicol. Environ. Health 1999, 56, 145–163. [Google Scholar] [CrossRef]
- Johansen, P.; Mulvad, G.; Pedersen, H.S.; Hansen, J.C.; Riget, F. Accumulation of cadmium in livers and kidneys in Greenlanders. Sci. Total Environ. 2006, 372, 58–63. [Google Scholar] [CrossRef]
- Barregard, L.; Fabricius-Lagging, E.; Lundh, T.; Mölne, J.; Wallin, M.; Olausson, M.; Modigh, C.; Sallsten, G. Cadmium, mercury, and lead in kidney cortex of living kidney donors: Impact of different exposure sources. Environ. Res. 2010, 110, 47–54. [Google Scholar] [CrossRef]
- Schaefer, H.R.; Flannery, B.M.; Crosby, L.M.; Pouillot, R.; Farakos, S.M.S.; Van Doren, J.M.; Dennis, S.; Fitzpatrick, S.; Middleton, K. Reassessment of the cadmium toxicological reference value for use in human health assessments of foods. Regul. Toxicol. Pharmacol. 2023, 144, 105487. [Google Scholar] [CrossRef]
- Fleming, R.E.; Bacon, B.R. Orchestration of iron homeostasis. N. Engl. J. Med. 2005, 352, 1741–1744. [Google Scholar] [CrossRef]
- Camaschella, C. Iron-deficiency anemia. N. Engl. J. Med. 2015, 373, 485–486. [Google Scholar] [CrossRef]
- Weaver, V.M.; Kim, N.S.; Jaar, B.G.; Schwartz, B.S.; Parsons, P.J.; Steuerwald, A.J.; Todd, A.C.; Simon, D.; Lee, B.K. Associations of low-level urine cadmium with kidney function in lead workers. Occup. Environ. Med. 2011, 68, 250–256. [Google Scholar] [CrossRef]
- Jin, R.; Zhu, X.; Shrubsole, M.J.; Yu, C.; Xia, Z.; Dai, Q. Associations of renal function with urinary excretion of metals: Evidence from NHANES 2003–2012. Environ. Int. 2018, 121, 1355–1362. [Google Scholar] [CrossRef]
- Buser, M.C.; Ingber, S.Z.; Raines, N.; Fowler, D.A.; Scinicariello, F. Urinary and blood cadmium and lead and kidney function: NHANES 2007–2012. Int. J. Hyg. Environ. Health 2016, 219, 261–267. [Google Scholar] [CrossRef]
- Akesson, A.; Lundh, T.; Vahter, M.; Bjellerup, P.; Lidfeldt, J.; Nerbrand, C.; Samsioe, G.; Strömberg, U.; Skerfving, S. Tubular and glomerular kidney effects in Swedish women with low environmental cadmium exposure. Environ. Health Perspect. 2005, 113, 1627–1631. [Google Scholar] [CrossRef]
- Satarug, S.; Gobe, G.C.; Ujjin, P.; Vesey, D.A. A comparison of the nephrotoxicity of low doses of cadmium and lead. Toxics 2020, 8, 18. [Google Scholar] [CrossRef]
- Saito, H.; Shioji, R.; Hurukawa, Y.; Nagai, K.; Arikawa, T. Cadmium-induced proximal tubular dysfunction in a cadmium-polluted area. Contrib. Nephrol. 1977, 6, 1–12. [Google Scholar]
- Roels, H.A.; Lauwerys, R.R.; Buchet, J.P.; Bernard, A.M.; Vos, A.; Oversteyns, M. Health significance of cadmium induced renal dysfunction: A five year follow up. Br. J. Ind. Med. 1989, 46, 755–764. [Google Scholar] [CrossRef]
- Järup, L.; Persson, B.; Elinder, C.G. Decreased glomerular filtration rate in solderers exposed to cadmium. Occup. Environ. Med. 1995, 52, 818–822. [Google Scholar] [CrossRef]
- Swaddiwudhipong, W.; Limpatanachote, P.; Mahasakpan, P.; Krintratun, S.; Punta, B.; Funkhiew, T. Progress in cadmium-related health effects in persons with high environmental exposure in northwestern Thailand: A five-year follow-up. Environ. Res. 2012, 112, 194–198. [Google Scholar] [CrossRef]
- Schnaper, H.W. The tubulointerstitial pathophysiology of progressive kidney disease. Adv. Chronic Kidney Dis. 2017, 24, 107–116. [Google Scholar] [CrossRef]
- Chevalier, R.L. The proximal tubule is the primary target of injury and progression of kidney disease: Role of the glomerulotubular junction. Am. J. Physiol. Ren. Physiol. 2016, 311, F145–F161. [Google Scholar] [CrossRef]
- Moffett, D.B.; Mumtaz, M.M.; Sullivan, D.W., Jr.; Whittaker, M.H. Chapter 13, General Considerations of Dose-Effect and Dose-Response Relationships. In Handbook on the Toxicology of Metals, 5th ed.; Nordberg, G., Costa, M., Eds.; Academic Press: Cambridge, MA, USA, 2022; Volume I: General Considerations, pp. 299–317. [Google Scholar]
- Satarug, S.; Vesey, D.A.; Khamphaya, T.; Pouyfung, P.; Gobe, G.C.; Yimthiang, S. Estimation of the cadmium nephrotoxicity threshold from loss of glomerular filtration rate and albuminuria. Toxics 2023, 11, 755. [Google Scholar] [CrossRef]
- Aoshima, K. Epidemiology and tubular dysfunction in the inhabitants of a cadmium-polluted area in the Jinzu River basin in Toyama Prefecture. Tohoku J. Exp. Med. 1987, 152, 151–172. [Google Scholar] [CrossRef]
- JECFA. In Proceedings of the Joint FAO/WHO Expert Committee on Food Additives and Contaminants, Seventy-Third Meeting, Geneva, Switzerland, 8–17 June 2010; In Summary and Conclusions; JECFA/73/SC; Food and Agriculture Organization of the United Nations/World Health Organization: Geneva, Switzerland, 2011; Available online: https://apps.who.int/iris/handle/10665/44521 (accessed on 12 February 2024).
- Codex Alimentarius, CODEX STAN 193–1995, General Standard for Contaminants and Toxins in Food and Feed. Available online: http://www.fao.org/fileadmin/user_upload/livestockgov/documents/1_CXS_193e.pdf (accessed on 12 February 2024).
- Nogawa, K.; Sakurai, M.; Ishizaki, M.; Kido, T.; Nakagawa, H.; Suwazono, Y. Threshold limit values of the cadmium concentration in rice in the development of itai-itai disease using benchmark dose analysis. J. Appl. Toxicol. 2017, 37, 962–966. [Google Scholar] [CrossRef]
- Nishijo, M.; Nogawa, K.; Suwazono, Y.; Kido, T.; Sakurai, M.; Nakagawa, H. Lifetime cadmium exposure and mortality for renal diseases in residents of the cadmium-polluted Kakehashi River Basin in Japan. Toxics 2020, 8, 81. [Google Scholar] [CrossRef]
- Liu, P.; Zhang, Y.; Su, J.; Bai, Z.; Li, T.; Wu, Y. Maximum cadmium limits establishment strategy based on the dietary exposure estimation: An example from Chinese populations and subgroups. Environ. Sci. Pollut. Res. Int. 2018, 25, 18762–18771. [Google Scholar] [CrossRef]
- Satarug, S.; Vesey, D.A.; Nishijo, M.; Ruangyuttikarn, W.; Gobe, G.C. The inverse association of glomerular function and urinary β2-MG excretion and its implications for cadmium health risk assessment. Environ. Res. 2019, 173, 40–47. [Google Scholar] [CrossRef]
- Schardijn, G.H.C.; Statius van Eps, L.W. β2-microglobulin: Its significance in the evaluation of renal function. Kidney Int. 1987, 32, 635–641. [Google Scholar] [CrossRef]
- Hall, P.W., III; Chung-Park, M.; Vacca, C.V.; London, M.; Crowley, A.Q. The renal handling of beta2-microglobulin in the dog. Kidney Int. 1982, 22, 156–161. [Google Scholar] [CrossRef]
- Portman, R.J.; Kissane, J.M.; Robson, A.M. Use of β2-microglobulin to diagnose tubulo-interstitial renal lesions in children. Kidney Int. 1986, 30, 91–98. [Google Scholar] [CrossRef]
- Bernard, A. Renal dysfunction induced by cadmium: Biomarkers of critical effects. Biometals 2004, 17, 519–523. [Google Scholar] [CrossRef]
- Nogawa, K.; Kobayashi, E.; Honda, R. A study of the relationship between cadmium concentrations in urine and renal effects of cadmium. Environ. Health Perspect. 1979, 28, 161–168. [Google Scholar] [CrossRef]
- Ikeda, M.; Ezaki, T.; Moriguchi, J.; Fukui, Y.; Ukai, H.; Okamoto, S.; Sakurai, H. The threshold cadmium level that causes a substantial increase in β2-microglobulin in urine of general populations. Tohoku J. Exp. Med. 2005, 205, 247–261. [Google Scholar] [CrossRef] [PubMed]
- Peterson, P.A.; Evrin, P.-E.; Berggard, I. Differentiation of glomerular, tubular, and normal proteinuria: Determinations of urinary excretion of β2-microglobulin, albumin, and total protein. J. Clin. Investig. 1969, 48, 1189–1198. [Google Scholar] [CrossRef] [PubMed]
- Lee, W.K.; Thévenod, F. Cell organelles as targets of mammalian cadmium toxicity. Arch. Toxicol. 2020, 94, 1017–1049. [Google Scholar] [CrossRef]
- Thévenod, F.; Lee, W.K.; Garrick, M.D. Iron and cadmium entry into renal mitochondria: Physiological and toxicological implications. Front. Cell Dev. Biol. 2020, 8, 848. [Google Scholar] [CrossRef]
- Ning, B.; Guo, C.; Kong, A.; Li, K.; Xie, Y.; Shi, H.; Gu, J. Calcium signaling mediates cell death and crosstalk with autophagy in kidney disease. Cells 2021, 10, 3204. [Google Scholar] [CrossRef]
- Liu, F.; Li, Z.F.; Wang, Z.Y.; Wang, L. Role of subcellular calcium redistribution in regulating apoptosis and autophagy in cadmium-exposed primary rat proximal tubular cells. J. Inorg. Biochem. 2016, 164, 99–109. [Google Scholar] [CrossRef]
- Li, K.; Guo, C.; Ruan, J.; Ning, B.; Wong, C.K.-C.; Shi, H.; Gu, J. Cadmium disrupted ER Ca2+ homeostasis by inhibiting SERCA2 expression and activity to induce apoptosis in renal proximal tubular cells. Int. J. Mol. Sci. 2023, 24, 5979. [Google Scholar] [CrossRef]
- Takeda, T.A.; Mu, A.; Tai, T.T.; Kitajima, S.; Taketani, S. Continuous de novo biosynthesis of haem and its rapid turnover to bilirubin are necessary for cytoprotection against cell damage. Sci. Rep. 2015, 5, 10488. [Google Scholar] [CrossRef] [PubMed]
- Kumagai, A.; Ando, R.; Miyatake, H.; Greimel, P.; Kobayashi, T.; Hirabayashi, Y.; Shimogori, T.; Miyawaki, A. A bilirubin-inducible fluorescent protein from eel muscle. Cell 2013, 153, 1602–1611. [Google Scholar] [CrossRef]
Figure 1.
Tubular reabsorption of β2-microglobulin (β2M) and albumin. β2M is reabsorbed by receptor-mediated endocytosis (RME) and is catabolised (C) in lysosomes. Only a small fraction of albumin is reabsorbed via RME. Most albumin is returned to the circulation via transcytosis. Cd intoxication increases the excretion of both β2M and albumin. As a carrier of Cd, the reabsorption of albumin may provide a delivery route for Cd to PTCs.

Figure 2.
Proposed pathogenesis of reduced proximal tubular reabsorption of albumin and β2-microglobulin after exposure to cadmium. In S1, all β2M is reabsorbed through receptor-mediated endocytosis (RME) and is catabolised (C) in lysosomes. Albumin is reabsorbed through RME in S1 and transcytosis in S1, S2 and S3. A small fraction of reabsorbed albumin is subjected to lysosomal catabolism, while most is returned to the blood stream via transcytosis. Cd impairs RME function, which reduces the reabsorption of both albumin and β2M.

Figure 3.
Determination of the NOAEL equivalent of kidney cadmium burden. Pairs of ECd/Ccr and eGFR data were fitted to (a) an inverse exponential model; (b) a natural logarithmic model; (c) an exponential model; and (d) Hill model. Bootstrap curves for model averaging (e). BMDL/BMDU values of ECd/Ccr producing a 5% reduction in eGFR (f). Data are from Satarug et al., 2022 [24].

Figure 4.
The paradox relationships between the eGFR and urinary excretion rate of cadmium. In women and men with low Cd burdens (a,b), eGFR showed a positive association with Cd exposure. Conversely, eGFR showed an inverse association with Cd exposure in women and men (c,d) who had a high Cd burden. Data are from Satarug et al., 2023 [114].


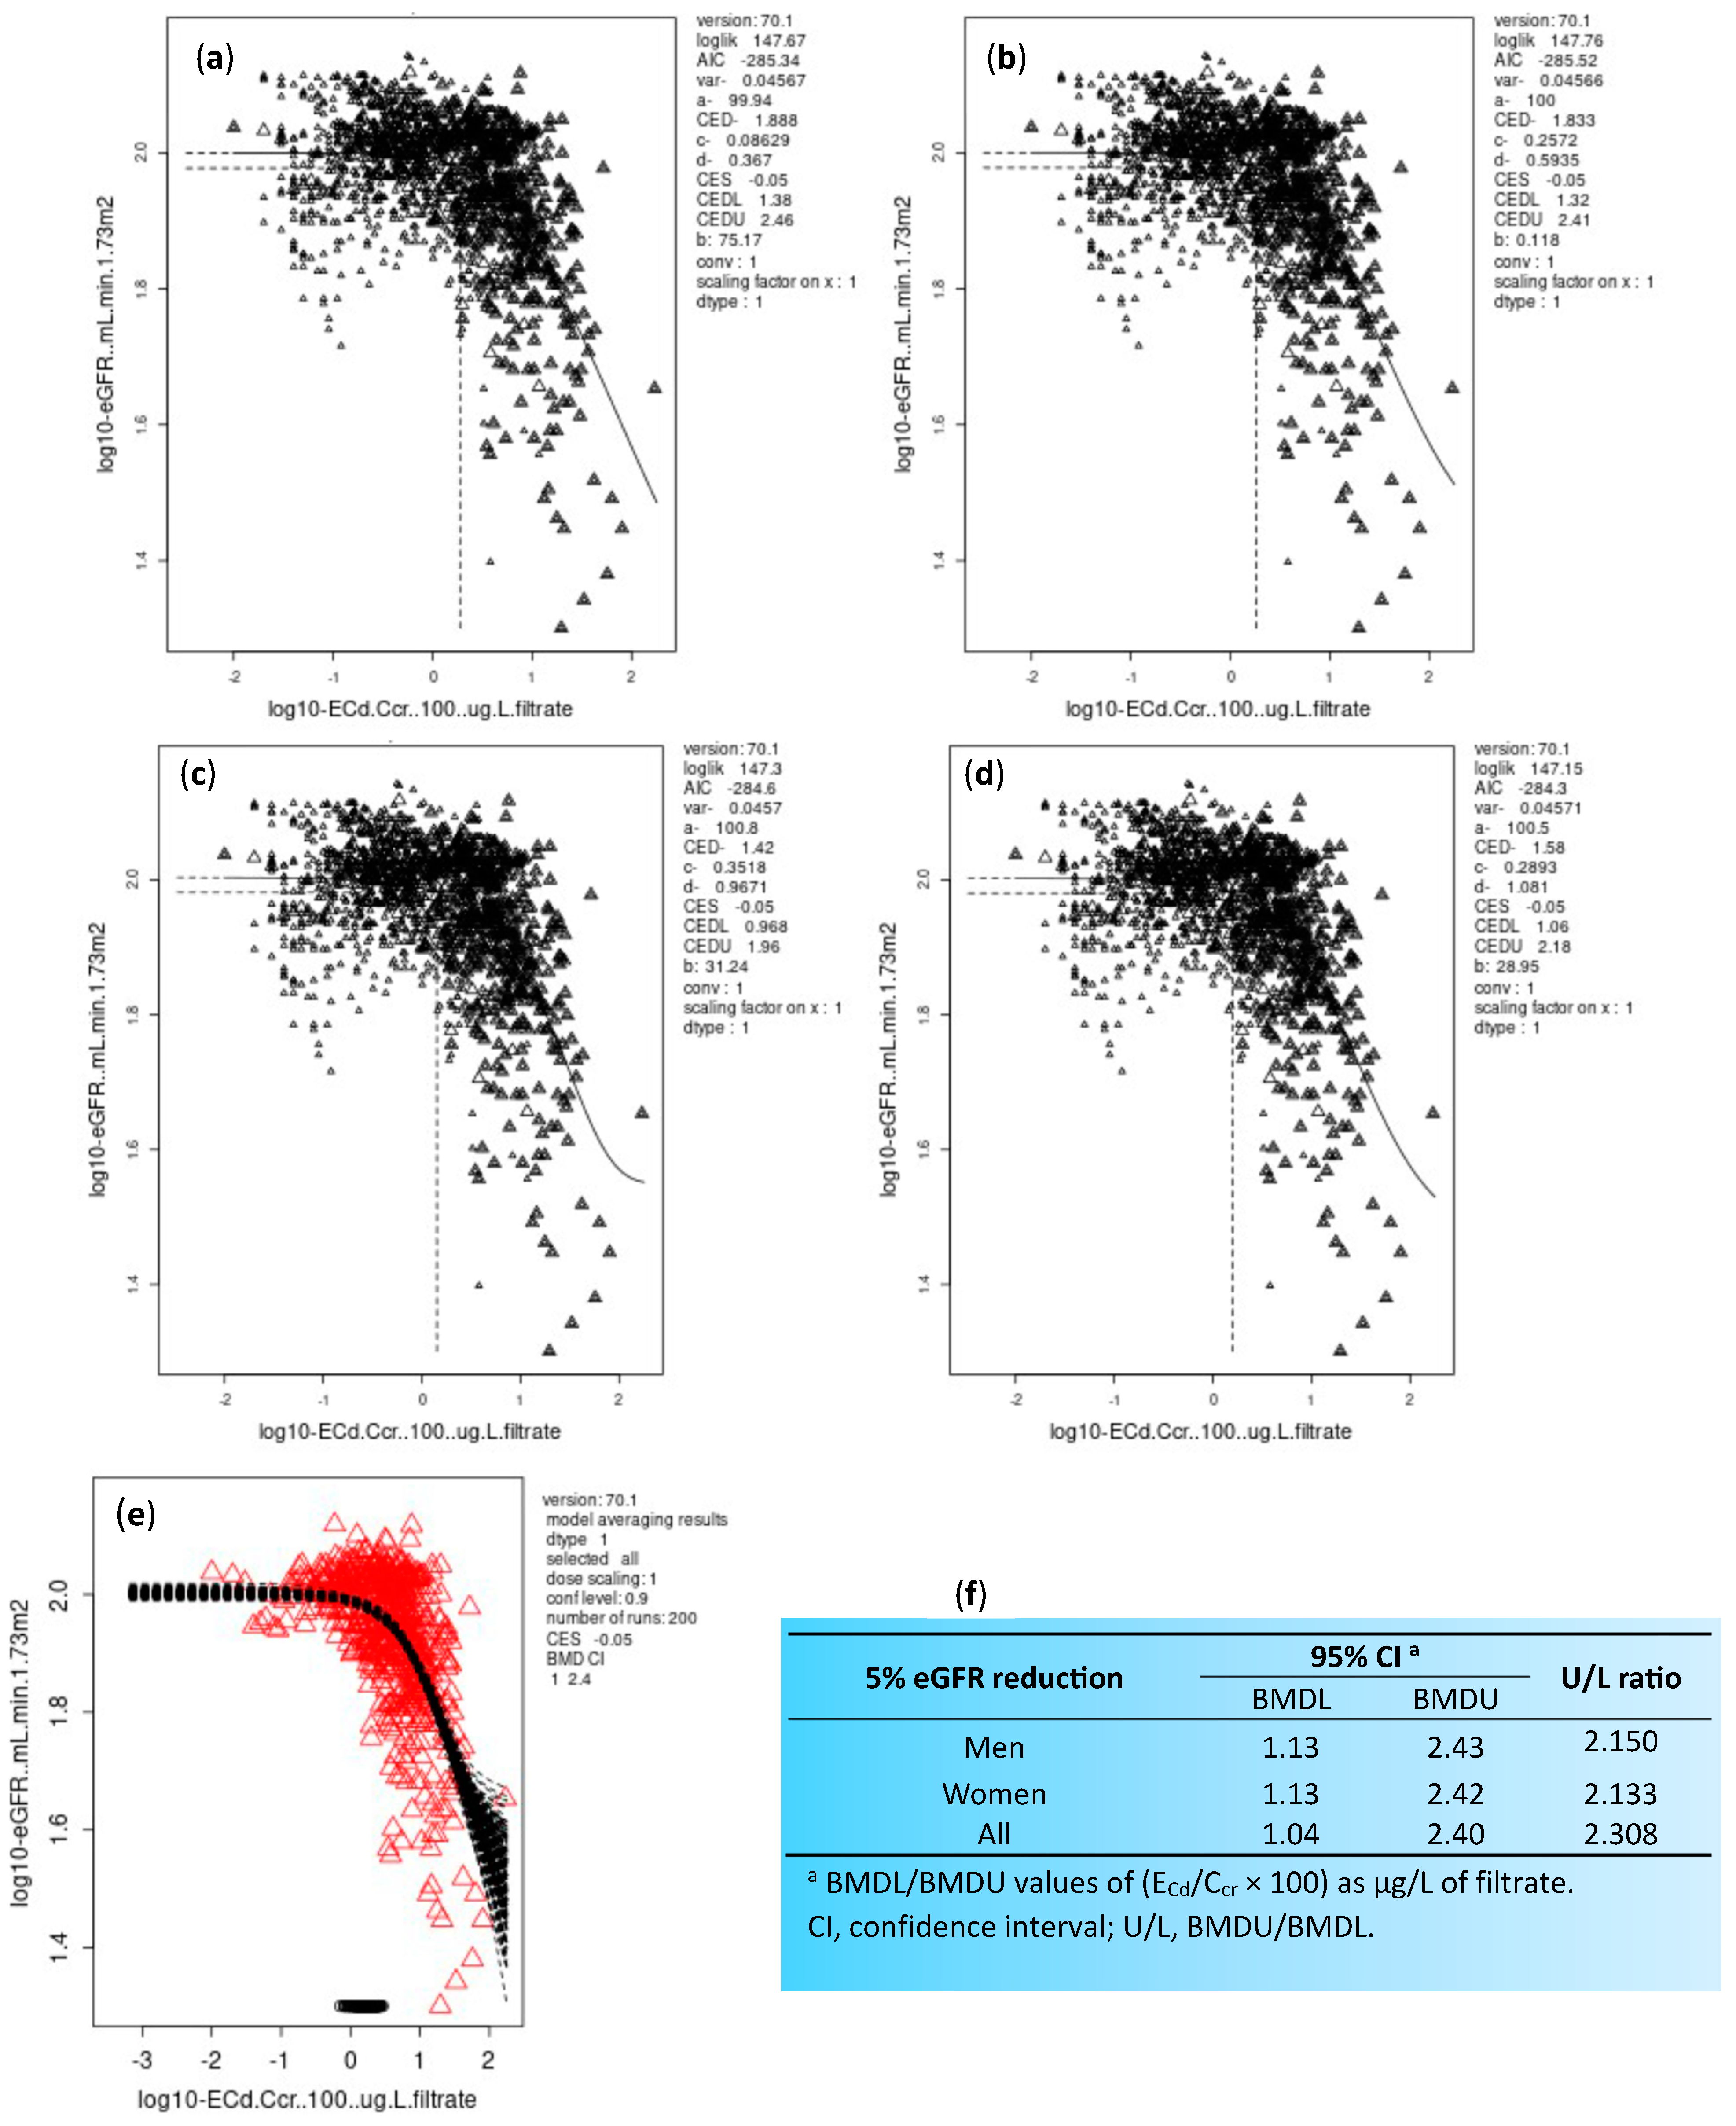
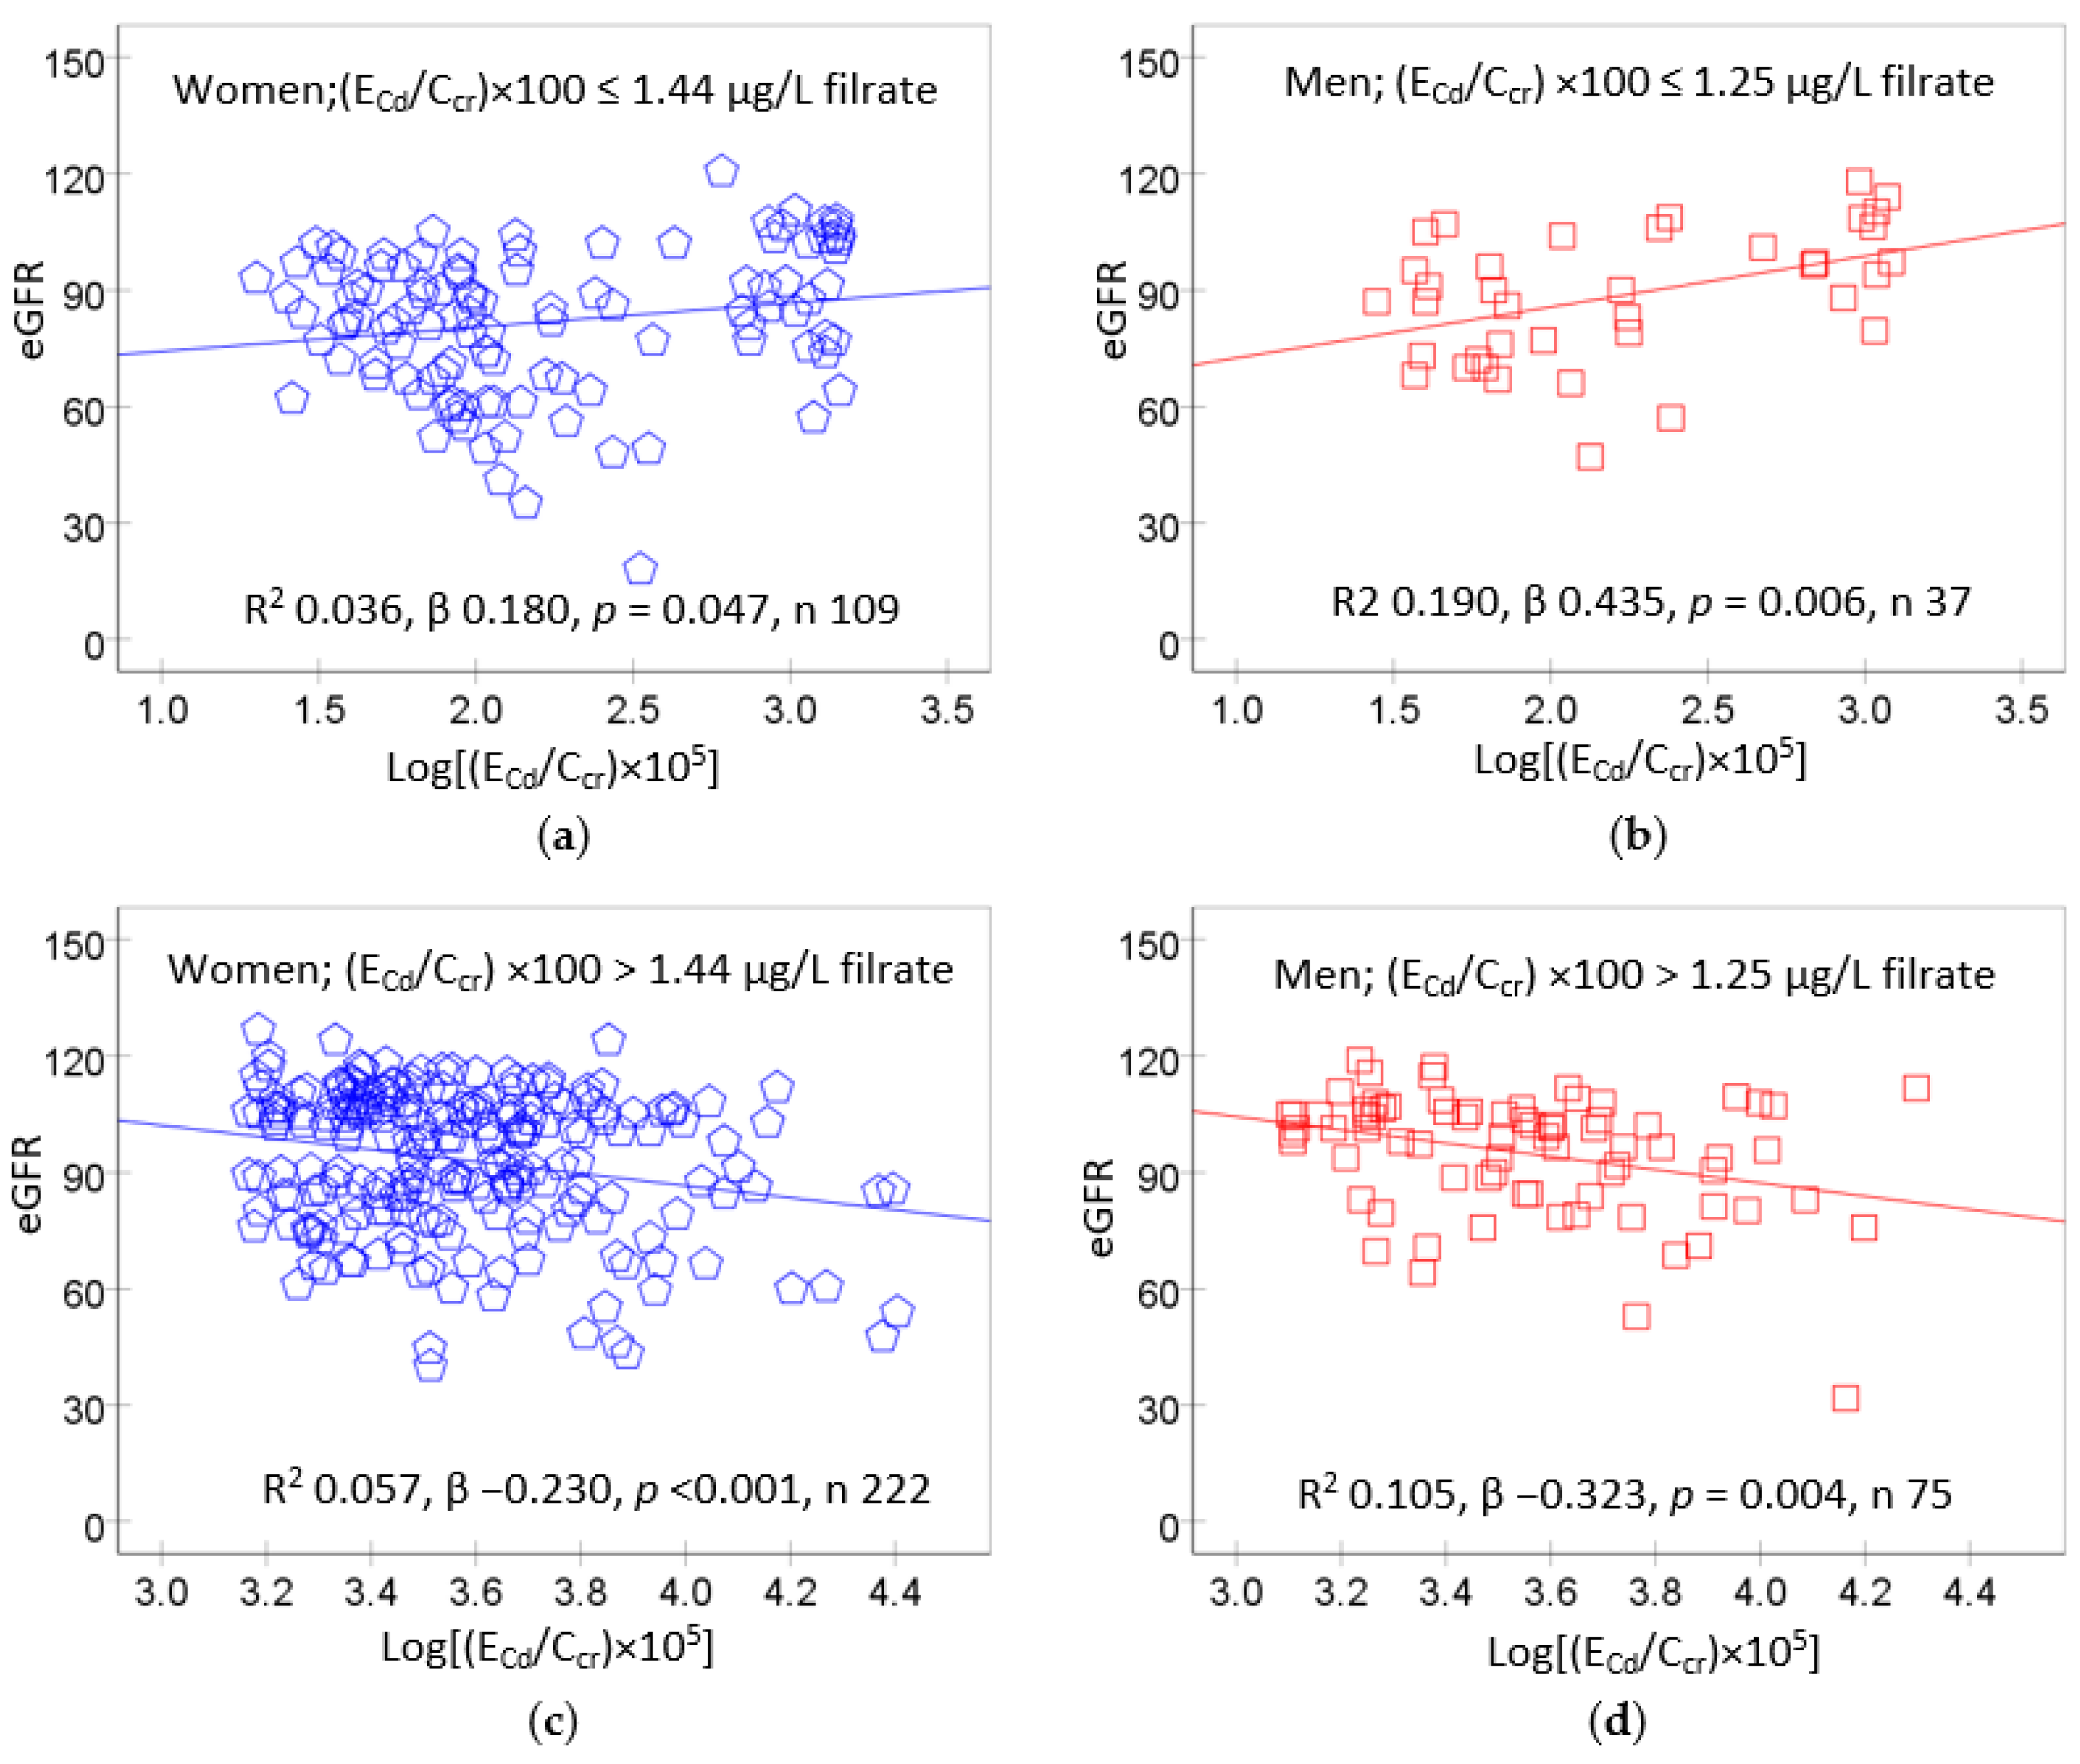
Table 1.
Associations of enhanced risk of CKD with blood and urinary cadmium.
| Study Location | Cadmium Exposure Metrics and Effects Observed | Reference |
|---|---|---|
| Thailand, n 1189 16–87 years mean age 43.2 years | Risk of low eGFR increased 6.2-fold and 10.6-fold, comparing urinary Cd levels 0.38–2.49 and ≥2.5 µg/g creatinine with ≤0.37 µg/g creatinine, respectively. | Satarug et al., 2022 [24]. |
| Korea, n 2992 20–65 years | Increased risk of low eGFR (OR 1.97) in women was associated with blood Cd levels > 1.74 μg/L. | Myong et al., 2012 [25] |
| Korea, n 2005 ≥20 years | Increased risk of low eGFR (OR 1.93) was associated with blood Cd in the top quartile (mean, 2.08 μg/L). | Chung et al., 2014 [26] |
| Taiwan, n 2447 mean age 55.1 years | Increased risk of proteinuria was associated with urinary Cd (OR 2.67) and copper (OR 1.94). Mean urinary Cd in subjects with proteinuria (1.1 μg/L) was 27.3% higher than those without proteinuria. | Tsai et al., 2021 [27] |
| China n 683 (64.7% women) mean age 57.4 years | Risk of elevated albumin excretion increased 2.98-fold comparing urinary Cd levels ≤ 0.32 with >1.72 µg/g creatinine. | Feng et al., 2022 [28] |
| Spain, n 1397 age 18–85 years | Increased risks of albuminuria 1.58-fold and 4.54-fold were associated with urinary Cd levels > 0.27 and >0.54 µg/g creatinine, respectively. | Grau-Perez et al., 2017 [29] |
| United States NHANES 1999–2006 n 14,778, ≥20 years | Blood Cd levels ≥ 0.6 μg/L were associated with a low eGFR (OR 1.32), albuminuria (OR 1.92) and a low eGFR plus albuminuria (OR 2.91). | Navas-Acien et al., 2009 [30] |
| United States NHANES 1999–2006 n 5426, ≥20 years | Blood Cd levels > 1 µg/L plus urinary Cd levels > 1 µg/g creatinine was associated with albuminuria (OR 1.63). Blood Cd levels > 1 µg/L were associated with a low eGFR (OR 1.48) and albuminuria (OR 1.41). | Ferraro et al., 2010 [31] |
| United States NHANES 2007–2012 n 12,577, ≥20 years | Blood Cd levels > 0.61 μg/L were associated with a low eGFR (OR 1.80) and albuminuria (OR 1.60). eGFR reduction due to Cd was more pronounced in diabetic and hypertensive people, or both. | Madrigal et al., 2019 [32] |
| United States NHANES, 1999–2014 A cohort, n 1825 with CKD Follow-up period, 6.8 years | Urinary Cd levels ≥ 0.60 μg/g creatinine were associated with all-cause mortality (HR 1.75; 95%CI: 1.28, 2.39). Blood Cd levels ≥ 0.70 μg/L were associated all-cause mortality (HR 1.59; 95%CI: 1.17, 2.15). Linear dose–response relationships were observed between urinary and blood Cd levels and all-cause mortality. | Zhang et al., 2023 [33] |
OR, odds ratio; HR, hazard ratio; CI, confidence interval; NHANES, National Health and Nutrition Examination Survey.
Table 2.
Comparing the excretion rates of various proteins and cadmium in residents of an area of Thailand with endemic cadmium contamination.
Table 2.
Comparing the excretion rates of various proteins and cadmium in residents of an area of Thailand with endemic cadmium contamination.
| Parameter | All Subjects n = 215 | eGFR, mL/min/1.73 m2 | p | ||
|---|---|---|---|---|---|
| >90, n = 33 | 61–90, n = 131 | ≤60, n = 51 | |||
| Age, years | 57.0 ± 11.1 | 49.4 ± 9.4 | 55.6 ± 9.6 | 65.6 ± 10.6 | <0.001 |
| BMI, kg/m2 | 21.4 ± 3.6 | 21.2 ± 3.2 | 21.3 ± 3.5 | 21.7 ± 4.3 | 0.822 |
| eGFR, mL/min/1.73 m2 | 71.6 ± 19.4 | 100.4 ± 8.3 | 74.6 ± 8.2 | 45.4 ± 11.3 | <0.001 |
| Plasma creatinine, mg/dL | 1.07 ± 0.35 | 0.79 ± 0.13 | 0.98 ± 0.14 | 1.50 ± 0.44 | <0.001 |
| Urine creatinine, mg/dL | 118.4 ± 62.2 | 99.1 ± 53.1 | 116.8 ± 60.2 | 135.2 ± 69.4 | 0.054 |
| Urine Cd, µg/L | 11.85 ± 12.28 | 11.18 ± 18.70 | 10.56 ± 8.05 | 15.61 ± 15.31 | 0.079 |
| Urine β2M, mg/L | 4.92 ± 17.43 | 0.20 ± 0.36 | 1.18 ± 4.02 | 17.57 ± 32.31 | <0.001 |
| Urine α1M, mg/L | 13.09 ± 18.68 | 5.66 ± 6.17 | 8.37 ± 7.91 | 30.04 ± 30.31 | <0.001 |
| Urine albumin, mg/L | 25.57 ± 70.59 | 7.62 ± 7.29 | 22.64 ± 76.57 | 44.72 ± 73.74 | <0.001 |
| Urine protein, mg/L | 85.4 ± 199.1 | 14.9 ± 22.6 | 56.2 ± 144.6 | 206.2 ± 307.7 | <0.001 |
| Normalised to Ecr as Ex/Ecr | |||||
| ECd/Ecr, µg/g creatinine | 10.43 ± 8.02 | 10.26 ± 10.35 | 9.98 ± 6.79 | 11.69 ± 9.20 | 0.641 |
| Eβ2M/Ecr, mg/g creatinine | 4.87 ± 16.55 | 0.23 ± 0.37 | 1.66 ± 9.72 | 16.13 ± 27.49 | <0.001 |
| Eα1M/Ecr, mg/g creatinine | 11.34 ± 15.00 | 5.78 ± 4.95 | 7.53 ± 6.30 | 24.72 ± 24.57 | <0.001 |
| EAlb/Ecr, mg/g creatinine | 23.21 ± 55.07 | 10.47 ± 15.68 | 20.71 ± 59.50 | 37.88 ± 57.23 | <0.001 |
| EProt/Ecr, mg/g creatinine | 78.25 ± 174.96 | 16.73 ± 24.54 | 57.98 ± 149.26 | 170.13 ± 246.01 | <0.001 |
| Normalized to Ccr as Ex/Ccr | |||||
| (ECd/Ccr) × 100, µg/L filtrate | 11.27 ± 9.89 | 8.10 ± 9.06 | 9.67 ± 6.60 | 17.44 ± 14.17 | <0.001 |
| (Eβ2M/Ccr) × 100, mg/L filtrate | 7.74 ± 29.06 | 0.18 ± 0.28 | 1.82 ± 11.58 | 27.82 ± 52.20 | <0.001 |
| (Eα1M/Ccr) × 100, mg/L filtrate | 15.00 ± 28.25 | 4.46 ± 3.59 | 7.45 ± 6.63 | 41.20 ± 48.68 | <0.001 |
| (EAlb/Ccr) × 100, mg/L filtrate | 29.06 ± 75.93 | 7.50 ± 9.83 | 20.23 ± 56.82 | 65.68 ± 119.75 | <0.001 |
| (EProt/Ccr) × 100, mg/L filtrate | 109.9 ± 316.8 | 13.0 ± 19.1 | 56.3 ± 141.0 | 310.2 ± 568.2 | <0.001 |
Table 3.
Dose–response assessment using Ecr-normalised data.
| Independent Variables | Albuminuria | β2-microglobulinuria | Low eGFR |
|---|---|---|---|
| POR (95% CI) | POR (95% CI) | POR (95% CI) | |
| Age, years | 1.053 (1.024, 1.082) *** | 1.008 (0.988, 1.030) | 1.143 (1.104, 1.184) *** |
| BMI, kg/m2 | 1.009 (0.935, 1.089) | 0.987 (0.937, 1.039) | 1.073 (0.982, 1.173) |
| Gender | 0.959 (0.534, 1.722) | 0.974 (0.640, 1.484) | 0.904 (0.438, 1.846) |
| Smoking | 1.903 (1.021, 3.547) | 1.087 (0.720, 1.1641) | 1.232 (0.583, 2.605) |
| Hypertension | 1.815 (1.051, 3.134) | 1.262 (0.867, 1.839) | 1.474 (0.750, 2.894) |
| ECd/Ecr, µg/g creatinine | |||
| <2 | Referent | Referent | Referent |
| 2−4.99 | 0.799 (0.402, 1.586) | 1.120 (0.687, 1.826) | 1.959 (0.928, 4.133) |
| 5−9.99 | 1.080 (0.526, 2.216) | 1.417 (0.875, 2.296) | 3.463 (1.466, 8.179) ** |
| ≥10 | 1.093 (0.380, 3.139) | 1.807 (0.910, 3.587) | 3.382 (0.862, 13.27) |
POR, prevalence odds ratio; CI, confidence interval. ** p = 0.005; *** p < 0.001 [49].
Table 4.
Dose–response assessment using Ccr-normalised data.
| Independent Variables/Factors | Albuminuria | β2-microglobulinuria | Low eGFR |
|---|---|---|---|
| POR (95% CI) | POR (95% CI) | POR (95% CI) | |
| Age, years | 1.050 (1.021, 1.079) ** | 1.008 (0.986, 1.030) | 1.135 (1.094, 1.178) *** |
| BMI, kg/m2 | 1.017 (0.946, 1.093) | 0.989 (0.939, 1.043) | 1.083 (0.984, 1.192) |
| Gender | 1.196 (0.676, 2.116) | 0.962 (0.627, 1.474) | 1.258 (0.576, 2.744) |
| Smoking | 2.009 (1.118, 3.619) * | 1.011 (0.667, 1.534) | 1.280 (0.589, 2.782) |
| Hypertension | 1.912 (1.129, 3.237) * | 1.328 (0.907, 1.945) | 2.063 (0.992, 4.294) |
| (ECd/Ccr) × 100, µg/L filtrate | |||
| <2 | Referent | Referent | Referent |
| 2−4.99 | 1.764 (0.886, 3.514) | 1.914 (1.100, 3.330) * | 5.704 (2.414, 13.48) *** |
| 5−9.99 | 1.950 (1.009, 3.766) * | 1.744 (1.030, 2.951) * | 10.35 (4.160, 25.76) *** |
| ≥10 | 2.849 (1.136, 7.146) * | 2.462 (1.320, 4.595) ** | 18.06 (3.702, 88.15) *** |
POR, prevalence odds ratio; CI, confidence interval. * p = 0.016–0.047; ** p = 0.001–0.005; *** p < 0.001 [49].
Table 5.
Representative rates of filtration, excretion, catabolism and transcytosis in normal and Cd-intoxicated proximal tubular cells.
Table 5.
Representative rates of filtration, excretion, catabolism and transcytosis in normal and Cd-intoxicated proximal tubular cells.
| PTC Status | Protein | Filtration Rate | Excretion Rate | Catabolic Rate | Transcytosis Rate |
|---|---|---|---|---|---|
| Normal | Albumin | 60 gm/d | 20 mg/d | 2.980 gm/d | 57 gm/d |
| β2M | 300 mg/d | 100 μg/d | 299.9 mg/d | 0 | |
| Cd intoxicated | Albumin | 60 gm/d | 50 mg/d | 2.950 gm/d | 57 gm/d |
| β2M | 300 mg/d | 1000 μg/d | 299 mg/d | 0 |
Assumptions: plasma albumin is 40 gm/L; plasma β2M is 2.0 mg/L; GFR is 150 L/d; the glomerular sieving coefficient for albumin (GSCalb) is 0.01; and GSCβ2M is 1.
Table 6.
Cadmium accumulation in human organs.
| Country of Origin | Cadmium Content, µg/g Wet Tissue Weight | Reference |
|---|---|---|
| Australia, Autopsy, n 61, 2–89 years | The percentage of kidney Cd content ≥ 50 µg/g was 3.3%. a Mean lung, liver and kidney Cd were 0.13, 0.95 and 15.45 µg/g, respectively. Mean kidney Cd was 16 times higher than that in the liver. Peak hepatic and renal Cd levels were 1.5 and 25.9 µg/g. | Satarug et al. [15] |
| United Kingdom, Autopsy, n 2700, nationwide (1978–1993) | The percentage of kidney Cd content ≥ 50 µg/g was 3.9%. Mean kidney Cd content was 19 µg/g. Peak renal Cd level was 23 µg/g. | Lyon et al. [95] |
| Canada (Quebec) Autopsy, n 314 | Respective mean liver (kidney) Cd in smokers, ex-smokers and non-smokers were 2.5 (34.5), 1.4 (20.3) and 0.7 (7.0) µg/g. Mean liver Cd in female smokers was higher than male smokers (3.6 vs. 2.2 µg/g). Peak hepatic and renal Cd levels were 2.2 and 44.2 µg/g. | Benedetti et al. [96] |
| Greenland Autopsy, n 95, 19–89 years | Mean (range) liver Cd content was 5.3 (0.3–24.3) μg/g. Mean (range) kidney Cd content was 43.8 (6.7–126) μg/g. Peak hepatic and renal Cd levels were 1.97 and 22.3 μg/g. | Johansen et al. [97] |
| Sweden Kidney transplant donors, n 109, 24–70 years, median age 51. | Median kidney Cd was 12.9 μg/g. In non-smokers, the renal Cd accumulation rate was 3.9 μg/g for every 10-year increase in age. An additional 3.7 μg/g accumulation rate for every 10-year increase in smoking. In women who had serum ferritin levels ≤ 20 µg/L (depleted iron stores), the renal Cd accumulation rate was 4.5 μg/g for every 10-year increase in age. | Barregard et al. [98] |
a Kidney Cd content of 50 µg/g was used as a toxicological reference value [99].
Disclaimer/Publisher’s Note: The statements, opinions and data contained in all publications are solely those of the individual author(s) and contributor(s) and not of MDPI and/or the editor(s). MDPI and/or the editor(s) disclaim responsibility for any injury to people or property resulting from any ideas, methods, instructions or products referred to in the content. |
© 2024 by the author. Licensee MDPI, Basel, Switzerland. This article is an open access article distributed under the terms and conditions of the Creative Commons Attribution (CC BY) license (https://creativecommons.org/licenses/by/4.0/).
Share and Cite
MDPI and ACS Style
Satarug, S. Is Chronic Kidney Disease Due to Cadmium Exposure Inevitable and Can It Be Reversed? Biomedicines 2024, 12, 718. https://doi.org/10.3390/biomedicines12040718
AMA Style
Satarug S. Is Chronic Kidney Disease Due to Cadmium Exposure Inevitable and Can It Be Reversed? Biomedicines. 2024; 12(4):718. https://doi.org/10.3390/biomedicines12040718
Chicago/Turabian StyleSatarug, Soisungwan. 2024. "Is Chronic Kidney Disease Due to Cadmium Exposure Inevitable and Can It Be Reversed?" Biomedicines 12, no. 4: 718. https://doi.org/10.3390/biomedicines12040718
Note that from the first issue of 2016, this journal uses article numbers instead of page numbers. See further details here.