
Application of Machine Learning in Chronic Kidney Disease: Current Status and Future Prospects

Abstract
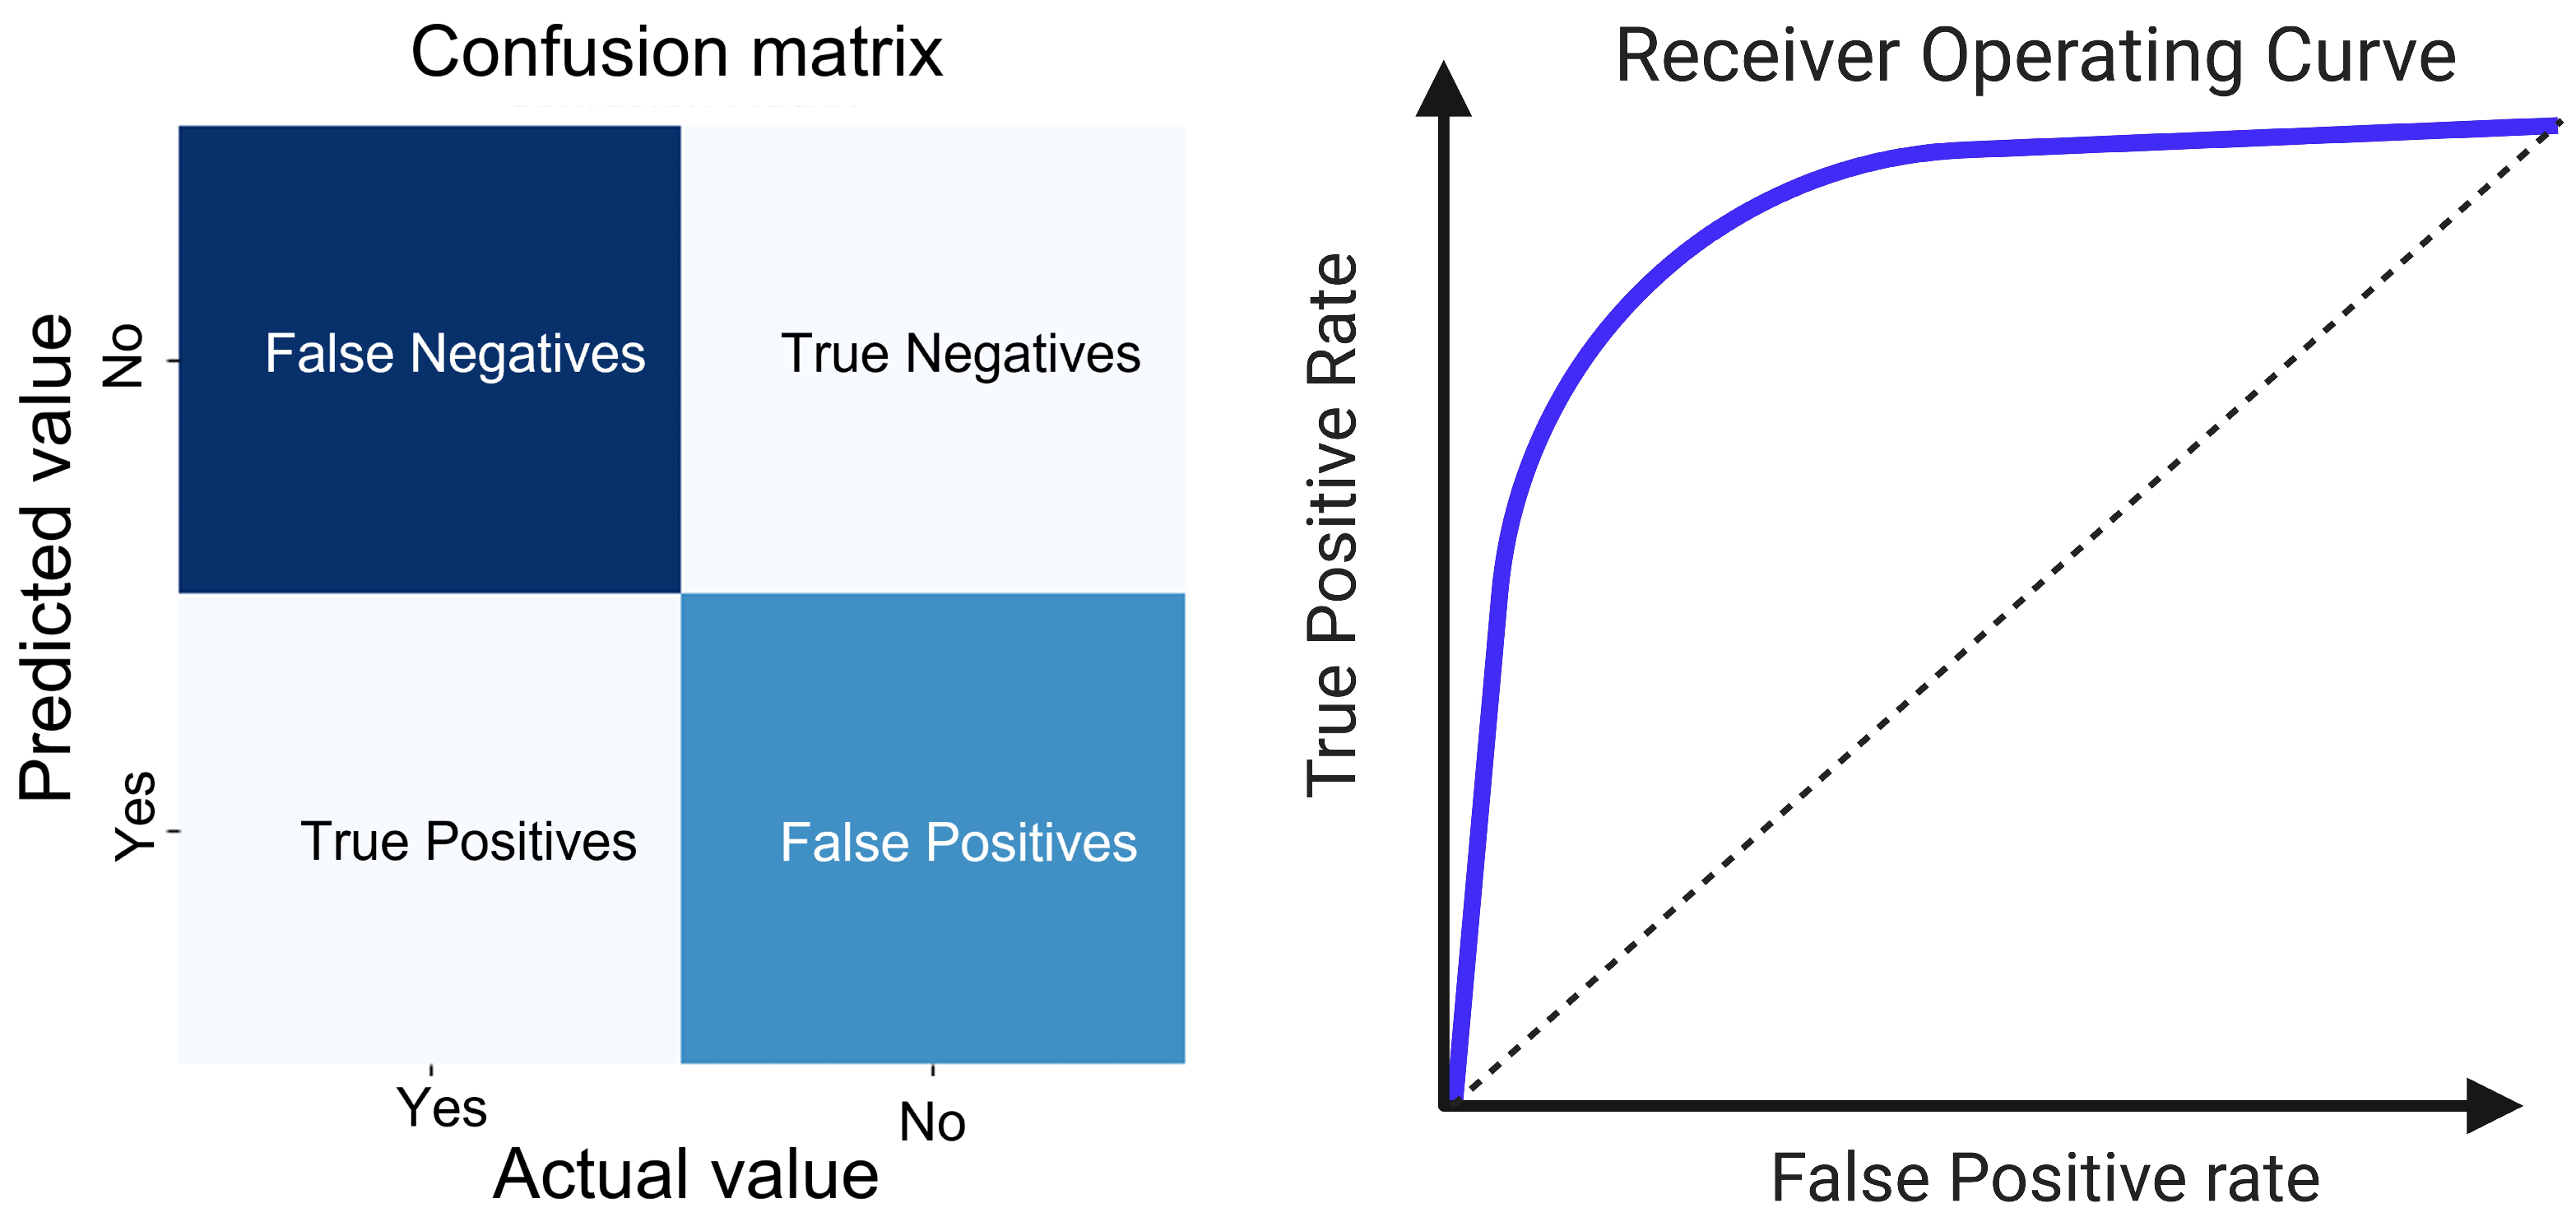
:1. Machine Learning
1.1. Linear Regression
1.2. Logistic Regression
1.3. Decision Trees
1.4. Random Forest
1.5. KNN
1.6. SVM
1.7. ANN
2. Current Status of Machine Learning in CKD
2.1. Diabetic Kidney Disease
2.2. IgA Nephropathy
2.3. Hemodialysis

| Disease | ML Model | Dataset | Outcome | Metrics | Bottlenecks | Data Availability | Reference |
|---|---|---|---|---|---|---|---|
| DKD | Logistic regression | 110 patients: 60 DN patients and 50 NDRD patients | DN vs. NDRD | Sensitivity of 90% Specificity of 92% AUC of 0.968 | Monocentric study. Less effective for non-linear problems. Requires careful feature selection. | No data availability | [30] |
| Support vector machines | 4321 diabetic patients | Predict DN | AUC of 0.969 | Difficult to tune hyperparameters. Not ideal for very large datasets. | No data availability | [32] | |
| Random forest | 10,251 patients | Risk of DN | Sensitivity 72% Accuracy of 73% | No external validation. Can lead to overfitting in complex models. Interpretation can be challenging. | Data available | [33] | |
| Logistic regression | 10,251 patients | Risk of DN | Sensitivity of 76% Accuracy of 80% | No external validation. Less effective for non-linear problems. Requires careful feature selection. | Data available | [33] | |
| Logistic regression | 522,416 DM patients in the training set and 82,912 DM patients in the validation set | Predict CKD | AUC of 0.794 | Less effective for non-linear problems. Requires careful feature selection. | No data availability | [34] | |
| Support vector machines | 119 subjects with DN and 554 without DN at enrolment | Predict DN | Accuracy of 95.0% | Difficult to tune hyperparameters. Not ideal for very large datasets. | Limited data availability | [35] | |
| Random forest | 119 subjects with DN and 554 without DN at enrolment | Predict DN | Accuracy of 90.0% | Can lead to overfitting in complex models. Interpretation can be challenging. | Limited data availability | [35] | |
| IgA nephropathy | Random forest | 262 Asian IgAN patients | Predict ESKD | AUC of 97.29% F-score of 83.0% | Can lead to overfitting in complex models. Interpretation can be challenging. | Limited data availability | [39] |
| Artificial neural network | 54 patients with IgAN | Predict outcome at 7 years | Accuracy of 87.0% patients Sensitivity of 86.4% Specificity of 87.5% | Lack of validation. Small sample size. Requires substantial computational resource. Model complexity can obscure interpretability. | No data availability | [40] | |
| Artificial neural network | 1040 biopsy-proven IgAN patients (from Italy, Norway, and Japan) | Risk and timing of ESKD | AUC of 0.899–1.000 in different geographic cohorts F-score of 70.8–90.7% in different geographic cohorts | Requires substantial computational resources. Model complexity can obscure interpretability. | Data available | [41] | |
| Decision tree | 790 Japanese IgAN patients | Risk stratification for renal deterioration | AUC of 0.830 (95% confidence interval, 0.777–0.883) | Prone to overfitting. Simplicity can lead to less nuanced decisions. | Limited data availability | [43] | |
| Logistic regression | 790 Japanese IgAN patients | Risk stratification for renal deterioration | AUC of 0.808 (95% confidence interval, 0.754–0.861) | Less effective for non-linear problems. Requires careful feature selection. | Limited data availability | [43] | |
| Gradient boosting | Validation cohort of 1025 patients with IgAN from 18 renal center | Combined event of ESKD or 50% reduction in eGFR | C-statistic of 0.840 (95% confidence interval, 0.80–0.88) | Sensitive to overfitting with small datasets. Long training times. | Limited data availability | [45] | |
| Hemodialysis | Artificial neural network | 15 chronic hemodialysis patients | Predict hemodialysis session time needed to reach a target SRI in patients | Prediction error of 10.9% (compared to DDQ model) | Requires substantial computational resource. Model complexity can obscure interpretability. | Limited data availability | [46] |
| Random forest | 27,615 US veterans with incident ESKD | Risk of death | C-statistic of 0.7185 (95% confidence interval: 0.6994–0.7377) C-statistic of 0.7446 (95% confidence interval: 0.7346–0.7546) C-statistic of 0.7504 (95% confidence interval: 0.7425–0.7583) C-statistic of 0.7488 (95% confidence interval: 0.7421–0.7554) for predicting risk of death 30-, 90-, 180-, and 365-day all-cause mortality after dialysis initiation, respectively | Can lead to overfitting in complex models. Interpretation can be challenging. | Limited data availability | [48] | |
| Artificial neural network | 52 patients undergoing hemodialysis therapy | Hb fluctuation | The percentage of Hb values within target range increased from 70.6% to 76.6% | Requires substantial computational resources. Model complexity can obscure interpretability. | No data availability. | [52] | |
| Artificial neural network | 688 patients (21,866 records) from Italian clinics, 1397 patients (24,565 records) from Spanish clinics, and 2050 patients (55,487 records) from Portuguese clinics formed part of this study | Hb prediction | MAE ranging from 0.548 to 0.613 across different countries | Requires substantial computational resources. Model complexity can obscure interpretability. | No data availability. | [54] | |
| Random forest | 826 hemodialysis patients of 66 years or older | Sudden cardiac death the day of or day after a dialysis session | C-statistic of 0.799 including both predialysis and postdialysis information | Can lead to overfitting in complex models. Interpretation can be challenging. | No data availability. | [59] |
3. Future Prospects of Machine Learning in CKD
Author Contributions
Funding
Institutional Review Board Statement
Informed Consent Statement
Data Availability Statement
Conflicts of Interest
References
- Sim, J.Z.T.; Fong, Q.W.; Huang, W.; Tan, C.H. Machine Learning in Medicine: What Clinicians Should Know. Singap. Med. J. 2021, 64, 91–97. [Google Scholar] [CrossRef]
- Deo, R.C. Machine Learning in Medicine. Circulation 2015, 132, 1920–1930. [Google Scholar] [CrossRef]
- Cuda, J.; Seigh, L.; Clark, K.; Monaco, S.; Pantanowitz, L. Utilizing Computerized Provider Order Entry (CPOE) to Reduce the Garbage in Garbage out Effect in the Cytology Laboratory. J. Am. Soc. Cytopathol. 2016, 5, S85. [Google Scholar] [CrossRef]
- Albahra, S.; Gorbett, T.; Robertson, S.; D’Aleo, G.; Kumar, S.V.S.; Ockunzzi, S.; Lallo, D.; Hu, B.; Rashidi, H.H. Artificial Intelligence and Machine Learning Overview in Pathology & Laboratory Medicine: A General Review of Data Preprocessing and Basic Supervised Concepts. Semin. Diagn. Pathol. 2023, 40, 71–87. [Google Scholar] [CrossRef]
- Mueller, B.; Kinoshita, T.; Peebles, A.; Graber, M.A.; Lee, S. Artificial Intelligence and Machine Learning in Emergency Medicine: A Narrative Review. Acute Med. Surg. 2022, 9, e740. [Google Scholar] [CrossRef]
- De Bruyne, S.; Speeckaert, M.M.; Van Biesen, W.; Delanghe, J.R. Recent Evolutions of Machine Learning Applications in Clinical Laboratory Medicine. Crit. Rev. Clin. Lab. Sci. 2021, 58, 131–152. [Google Scholar] [CrossRef]
- Handelman, G.S.; Kok, H.K.; Chandra, R.V.; Razavi, A.H.; Lee, M.J.; Asadi, H. eDoctor: Machine Learning and the Future of Medicine. J. Intern. Med. 2018, 284, 603–619. [Google Scholar] [CrossRef]
- Kononenko, I. Machine Learning for Medical Diagnosis: History, State of the Art and Perspective. Artif. Intell. Med. 2001, 23, 89–109. [Google Scholar] [CrossRef]
- Choi, R.Y.; Coyner, A.S.; Kalpathy-Cramer, J.; Chiang, M.F.; Campbell, J.P. Introduction to Machine Learning, Neural Networks, and Deep Learning. Transl. Vis. Sci. Technol. 2020, 9, 14. [Google Scholar]
- James, G.; Witten, D.; Hastie, T.; Tibshirani, R. An Introduction to Statistical Learning: With Applications in R; Springer Texts in Statistics; Springer: New York, NY, USA, 2021; ISBN 978-1-07-161417-4. [Google Scholar]
- Hastie, T.; Tibshirani, R.; Friedman, J.H.; Friedman, J.H. The Elements of Statistical Learning: Data Mining, Inference, and Prediction; Springer: New York, NY, USA, 2009; Volume 2. [Google Scholar]
- Gadegbeku, C.A.; Gipson, D.S.; Holzman, L.; Ojo, A.O.; Song, P.; Barisoni, L.; Sampson, M.G.; Kopp, J.; Lemley, K.V.; Nelson, P.; et al. Design of the Nephrotic Syndrome Study Network (NEPTUNE) to Evaluate Primary Glomerular Nephropathy by a Multi-Disciplinary Approach. Kidney Int. 2013, 83, 749–756. [Google Scholar] [CrossRef]
- Webster, A.C.; Nagler, E.V.; Morton, R.L.; Masson, P. Chronic Kidney Disease. Lancet 2017, 389, 1238–1252. [Google Scholar] [CrossRef]
- Xu, J.; Luo, X.; Wang, G.; Gilmore, H.; Madabhushi, A. A Deep Convolutional Neural Network for Segmenting and Classifying Epithelial and Stromal Regions in Histopathological Images. Neurocomputing 2016, 191, 214–223. [Google Scholar] [CrossRef]
- Cruz-Roa, A.; Gilmore, H.; Basavanhally, A.; Feldman, M.; Ganesan, S.; Shih, N.N.C.; Tomaszewski, J.; González, F.A.; Madabhushi, A. Accurate and Reproducible Invasive Breast Cancer Detection in Whole-Slide Images: A Deep Learning Approach for Quantifying Tumor Extent. Sci. Rep. 2017, 7, 46450. [Google Scholar] [CrossRef]
- Han, Z.; Wei, B.; Zheng, Y.; Yin, Y.; Li, K.; Li, S. Breast Cancer Multi-Classification from Histopathological Images with Structured Deep Learning Model. Sci. Rep. 2017, 7, 4172. [Google Scholar] [CrossRef]
- Saha, M.; Chakraborty, C.; Arun, I.; Ahmed, R.; Chatterjee, S. An Advanced Deep Learning Approach for Ki-67 Stained Hotspot Detection and Proliferation Rate Scoring for Prognostic Evaluation of Breast Cancer. Sci. Rep. 2017, 7, 3213. [Google Scholar] [CrossRef]
- Turkki, R.; Linder, N.; Kovanen, P.E.; Pellinen, T.; Lundin, J. Antibody-Supervised Deep Learning for Quantification of Tumor-Infiltrating Immune Cells in Hematoxylin and Eosin Stained Breast Cancer Samples. J. Pathol. Inf. Inform. 2016, 7, 38. [Google Scholar] [CrossRef]
- Vandenberghe, M.E.; Scott, M.L.J.; Scorer, P.W.; Söderberg, M.; Balcerzak, D.; Barker, C. Relevance of Deep Learning to Facilitate the Diagnosis of HER2 Status in Breast Cancer. Sci. Rep. 2017, 7, 45938. [Google Scholar] [CrossRef]
- Li, Q.; Fan, Q.-L.; Han, Q.-X.; Geng, W.-J.; Zhao, H.-H.; Ding, X.-N.; Yan, J.-Y.; Zhu, H.-Y. Machine Learning in Nephrology: Scratching the Surface. Chin. Med. J. 2020, 133, 687–698. [Google Scholar] [CrossRef]
- Maree, R.; Dallongeville, S.; Olivo-Marin, J.-C.; Meas-Yedid, V. An Approach for Detection of Glomeruli in Multisite Digital Pathology. In Proceedings of the 2016 IEEE 13th International Symposium on Biomedical Imaging (ISBI), Prague, Czech Republic, 13–16 April 2016; pp. 1033–1036. [Google Scholar]
- Rashidian, S.; Hajagos, J.; Moffitt, R.A.; Wang, F.; Noel, K.M.; Gupta, R.R.; Tharakan, M.A.; Saltz, J.H.; Saltz, M.M. Deep Learning on Electronic Health Records to Improve Disease Coding Accuracy. AMIA Jt. Summits Transl. Sci. Proc. 2019, 2019, 620–629. [Google Scholar]
- Tangri, N.; Stevens, L.A.; Griffith, J.; Tighiouart, H.; Djurdjev, O.; Naimark, D.; Levin, A.; Levey, A.S. A Predictive Model for Progression of Chronic Kidney Disease to Kidney Failure. JAMA 2011, 305, 1553–1559. [Google Scholar] [CrossRef]
- Norouzi, J.; Yadollahpour, A.; Mirbagheri, S.A.; Mazdeh, M.M.; Hosseini, S.A. Predicting Renal Failure Progression in Chronic Kidney Disease Using Integrated Intelligent Fuzzy Expert System. Comput. Math. Methods Med. 2016, 2016, 6080814. [Google Scholar] [CrossRef]
- Perotte, A.; Ranganath, R.; Hirsch, J.S.; Blei, D.; Elhadad, N. Risk Prediction for Chronic Kidney Disease Progression Using Heterogeneous Electronic Health Record Data and Time Series Analysis. J. Am. Med. Inf. Inform. Assoc. 2015, 22, 872–880. [Google Scholar] [CrossRef]
- Molitch, M.E.; DeFronzo, R.A.; Franz, M.J.; Keane, W.F.; Mogensen, C.E.; Parving, H.-H.; Steffes, M.W.; American Diabetes Association. Nephropathy in Diabetes. Diabetes Care 2004, 27 (Suppl. S1), S79–S83. [Google Scholar] [CrossRef]
- Spasovski, G.; Ortiz, A.; Vanholder, R.; El Nahas, M. Proteomics in Chronic Kidney Disease: The Issues Clinical Nephrologists Need an Answer For. Proteom. Clin. Appl. 2011, 5, 233–240. [Google Scholar] [CrossRef]
- Macisaac, R.J.; Jerums, G. Diabetic Kidney Disease with and without Albuminuria. Curr. Opin. Nephrol. Hypertens. 2011, 20, 246–257. [Google Scholar] [CrossRef]
- Liang, S.; Zhang, X.-G.; Cai, G.-Y.; Zhu, H.-Y.; Zhou, J.-H.; Wu, J.; Chen, P.; Lin, S.-P.; Qiu, Q.; Chen, X.-M. Identifying Parameters to Distinguish Non-Diabetic Renal Diseases from Diabetic Nephropathy in Patients with Type 2 Diabetes Mellitus: A Meta-Analysis. PLoS ONE 2013, 8, e64184. [Google Scholar] [CrossRef]
- Zhou, J.; Chen, X.; Xie, Y.; Li, J.; Yamanaka, N.; Tong, X. A Differential Diagnostic Model of Diabetic Nephropathy and Non-Diabetic Renal Diseases. Nephrol. Dial. Transplant. 2008, 23, 1940–1945. [Google Scholar] [CrossRef]
- Miotto, R.; Li, L.; Kidd, B.A.; Dudley, J.T. Deep Patient: An Unsupervised Representation to Predict the Future of Patients from the Electronic Health Records. Sci. Rep. 2016, 6, 26094. [Google Scholar] [CrossRef]
- Cho, B.H.; Yu, H.; Kim, K.-W.; Kim, T.H.; Kim, I.Y.; Kim, S.I. Application of Irregular and Unbalanced Data to Predict Diabetic Nephropathy Using Visualization and Feature Selection Methods. Artif. Intell. Med. 2008, 42, 37–53. [Google Scholar] [CrossRef]
- Rodriguez-Romero, V.; Bergstrom, R.F.; Decker, B.S.; Lahu, G.; Vakilynejad, M.; Bies, R.R. Prediction of Nephropathy in Type 2 Diabetes: An Analysis of the ACCORD Trial Applying Machine Learning Techniques. Clin. Transl. Sci. 2019, 12, 519–528. [Google Scholar] [CrossRef]
- Ravizza, S.; Huschto, T.; Adamov, A.; Böhm, L.; Büsser, A.; Flöther, F.F.; Hinzmann, R.; König, H.; McAhren, S.M.; Robertson, D.H.; et al. Predicting the Early Risk of Chronic Kidney Disease in Patients with Diabetes Using Real-World Data. Nat. Med. 2019, 25, 57–59. [Google Scholar] [CrossRef]
- Leung, R.K.; Wang, Y.; Ma, R.C.; Luk, A.O.; Lam, V.; Ng, M.; So, W.Y.; Tsui, S.K.; Chan, J.C. Using a Multi-Staged Strategy Based on Machine Learning and Mathematical Modeling to Predict Genotype-Phenotype Risk Patterns in Diabetic Kidney Disease: A Prospective Case–Control Cohort Analysis. BMC Nephrol. 2013, 14, 162. [Google Scholar] [CrossRef]
- Manno, C.; Strippoli, G.F.M.; D’Altri, C.; Torres, D.; Rossini, M.; Schena, F.P. A Novel Simpler Histological Classification for Renal Survival in IgA Nephropathy: A Retrospective Study. Am. J. Kidney Dis. 2007, 49, 763–775. [Google Scholar] [CrossRef]
- Han, X.; Zheng, X.; Wang, Y.; Sun, X.; Xiao, Y.; Tang, Y.; Qin, W. Random Forest Can Accurately Predict the Development of End-Stage Renal Disease in Immunoglobulin a Nephropathy Patients. Ann. Transl. Med. 2019, 7, 234. [Google Scholar] [CrossRef]
- Berger, J.; Hinglais, N. Intercapillary deposits of IgA-IgG. J. Urol. Nephrol. 1968, 74, 694–695. [Google Scholar]
- Liu, Y.; Zhang, Y.; Liu, D.; Tan, X.; Tang, X.; Zhang, F.; Xia, M.; Chen, G.; He, L.; Zhou, L.; et al. Prediction of ESRD in IgA Nephropathy Patients from an Asian Cohort: A Random Forest Model. Kidney Blood Press. Res. 2018, 43, 1852–1864. [Google Scholar] [CrossRef]
- Geddes, C.C.; Fox, J.G.; Allison, M.E.; Boulton-Jones, J.M.; Simpson, K. An Artificial Neural Network Can Select Patients at High Risk of Developing Progressive IgA Nephropathy More Accurately than Experienced Nephrologists. Nephrol. Dial. Transplant. 1998, 13, 67–71. [Google Scholar] [CrossRef]
- Pesce, F.; Diciolla, M.; Binetti, G.; Naso, D.; Ostuni, V.C.; Di Noia, T.; Vågane, A.M.; Bjørneklett, R.; Suzuki, H.; Tomino, Y.; et al. Clinical Decision Support System for End-Stage Kidney Disease Risk Estimation in IgA Nephropathy Patients. Nephrol. Dial. Transplant. 2016, 31, 80–86. [Google Scholar] [CrossRef]
- Chen, I.Y.; Pierson, E.; Rose, S.; Joshi, S.; Ferryman, K.; Ghassemi, M. Ethical Machine Learning in Healthcare. Annu. Rev. Biomed. Data Sci. 2021, 4, 123–144. [Google Scholar] [CrossRef]
- Goto, M.; Kawamura, T.; Wakai, K.; Ando, M.; Endoh, M.; Tomino, Y. Risk Stratification for Progression of IgA Nephropathy Using a Decision Tree Induction Algorithm. Nephrol. Dial. Transplant. 2009, 24, 1242–1247. [Google Scholar] [CrossRef]
- Berthoux, F.; Mohey, H.; Laurent, B.; Mariat, C.; Afiani, A.; Thibaudin, L. Predicting the Risk for Dialysis or Death in IgA Nephropathy. J. Am. Soc. Nephrol. 2011, 22, 752–761. [Google Scholar] [CrossRef]
- Chen, T.; Li, X.; Li, Y.; Xia, E.; Qin, Y.; Liang, S.; Xu, F.; Liang, D.; Zeng, C.; Liu, Z. Prediction and Risk Stratification of Kidney Outcomes in IgA Nephropathy. Am. J. Kidney Dis. 2019, 74, 300–309. [Google Scholar] [CrossRef]
- Akl, A.I.; Sobh, M.A.; Enab, Y.M.; Tattersall, J. Artificial Intelligence: A New Approach for Prescription and Monitoring of Hemodialysis Therapy. Am. J. Kidney Dis. 2001, 38, 1277–1283. [Google Scholar] [CrossRef]
- Brier, M.E.; Gaweda, A.E. Artificial Intelligence for Optimal Anemia Management in End-Stage Renal Disease. Kidney Int. 2016, 90, 259–261. [Google Scholar] [CrossRef]
- Akbilgic, O.; Obi, Y.; Potukuchi, P.K.; Karabayir, I.; Nguyen, D.V.; Soohoo, M.; Streja, E.; Molnar, M.Z.; Rhee, C.M.; Kalantar-Zadeh, K.; et al. Machine Learning to Identify Dialysis Patients at High Death Risk. Kidney Int. Rep. 2019, 4, 1219–1229. [Google Scholar] [CrossRef]
- Hueso, M.; Vellido, A.; Montero, N.; Barbieri, C.; Ramos, R.; Angoso, M.; Cruzado, J.M.; Jonsson, A. Artificial Intelligence for the Artificial Kidney: Pointers to the Future of a Personalized Hemodialysis Therapy. Kidney Dis. 2018, 4, 1–9. [Google Scholar] [CrossRef]
- Fernández, E.A.; Valtuille, R.; Presedo, J.M.R.; Willshaw, P. Comparison of Different Methods for Hemodialysis Evaluation by Means of ROC Curves: From Artificial Intelligence to Current Methods. Clin. Nephrol. 2005, 64, 205–213. [Google Scholar] [CrossRef]
- Fernández, E.A.; Valtuille, R.; Willshaw, P.; Perazzo, C.A. Using Artificial Intelligence to Predict the Equilibrated Postdialysis Blood Urea Concentration. Blood Purif. 2001, 19, 271–285. [Google Scholar] [CrossRef]
- Barbieri, C.; Molina, M.; Ponce, P.; Tothova, M.; Cattinelli, I.; Ion Titapiccolo, J.; Mari, F.; Amato, C.; Leipold, F.; Wehmeyer, W.; et al. An International Observational Study Suggests That Artificial Intelligence for Clinical Decision Support Optimizes Anemia Management in Hemodialysis Patients. Kidney Int. 2016, 90, 422–429. [Google Scholar] [CrossRef]
- Martínez-Martínez, J.M.; Escandell-Montero, P.; Barbieri, C.; Soria-Olivas, E.; Mari, F.; Martínez-Sober, M.; Amato, C.; Serrano López, A.J.; Bassi, M.; Magdalena-Benedito, R.; et al. Prediction of the Hemoglobin Level in Hemodialysis Patients Using Machine Learning Techniques. Comput. Methods Programs Biomed. 2014, 117, 208–217. [Google Scholar] [CrossRef]
- Barbieri, C.; Mari, F.; Stopper, A.; Gatti, E.; Escandell-Montero, P.; Martínez-Martínez, J.M.; Martín-Guerrero, J.D. A New Machine Learning Approach for Predicting the Response to Anemia Treatment in a Large Cohort of End Stage Renal Disease Patients Undergoing Dialysis. Comput. Biol. Med. 2015, 61, 56–61. [Google Scholar] [CrossRef]
- Brier, M.E.; Gaweda, A.E.; Dailey, A.; Aronoff, G.R.; Jacobs, A.A. Randomized Trial of Model Predictive Control for Improved Anemia Management. Clin. J. Am. Soc. Nephrol. 2010, 5, 814–820. [Google Scholar] [CrossRef]
- Gaweda, A.E.; Aronoff, G.R.; Jacobs, A.A.; Rai, S.N.; Brier, M.E. Individualized Anemia Management Reduces Hemoglobin Variability in Hemodialysis Patients. J. Am. Soc. Nephrol. 2014, 25, 159–166. [Google Scholar] [CrossRef]
- McCarthy, J.T.; Hocum, C.L.; Albright, R.C.; Rogers, J.; Gallaher, E.J.; Steensma, D.P.; Gudgell, S.F.; Bergstralh, E.J.; Dillon, J.C.; Hickson, L.J.; et al. Biomedical System Dynamics to Improve Anemia Control With Darbepoetin Alfa in Long-Term Hemodialysis Patients. Mayo Clin. Proc. 2014, 89, 87–94. [Google Scholar] [CrossRef]
- Singh, A.K.; Szczech, L.; Tang, K.L.; Barnhart, H.; Sapp, S.; Wolfson, M.; Reddan, D. CHOIR Investigators Correction of Anemia with Epoetin Alfa in Chronic Kidney Disease. N. Engl. J. Med. 2006, 355, 2085–2098. [Google Scholar] [CrossRef]
- Goldstein, B.A.; Chang, T.I.; Mitani, A.A.; Assimes, T.L.; Winkelmayer, W.C. Near-Term Prediction of Sudden Cardiac Death in Older Hemodialysis Patients Using Electronic Health Records. Clin. J. Am. Soc. Nephrol. 2014, 9, 82–91. [Google Scholar] [CrossRef]
- Arif, F.M.; Sumida, K.; Molnar, M.Z.; Potukuchi, P.K.; Lu, J.L.; Hassan, F.; Thomas, F.; Siddiqui, O.A.; Gyamlani, G.G.; Kalantar-Zadeh, K.; et al. Early Mortality Associated with Inpatient vs. Outpatient Hemodialysis Initiation in a Large Cohort of US Veterans with Incident ESRD. Nephron 2017, 137, 15–22. [Google Scholar] [CrossRef]
- Tomašev, N.; Glorot, X.; Rae, J.W.; Zielinski, M.; Askham, H.; Saraiva, A.; Mottram, A.; Meyer, C.; Ravuri, S.; Protsyuk, I.; et al. A Clinically Applicable Approach to Continuous Prediction of Future Acute Kidney Injury. Nature 2019, 572, 116–119. [Google Scholar] [CrossRef]
- Chan, E.D.; Chan, M.M.; Chan, M.M. Pulse Oximetry: Understanding Its Basic Principles Facilitates Appreciation of Its Limitations. Respir. Med. 2013, 107, 789–799. [Google Scholar] [CrossRef]
- Shameer, K.; Johnson, K.W.; Glicksberg, B.S.; Dudley, J.T.; Sengupta, P.P. Machine Learning in Cardiovascular Medicine: Are We There Yet? Heart 2018, 104, 1156–1164. [Google Scholar] [CrossRef]
- Zia, A.; Aziz, M.; Popa, I.; Khan, S.A.; Hamedani, A.F.; Asif, A.R. Artificial Intelligence-Based Medical Data Mining. J. Pers. Med. 2022, 12, 1359. [Google Scholar] [CrossRef] [PubMed]


Disclaimer/Publisher’s Note: The statements, opinions and data contained in all publications are solely those of the individual author(s) and contributor(s) and not of MDPI and/or the editor(s). MDPI and/or the editor(s) disclaim responsibility for any injury to people or property resulting from any ideas, methods, instructions or products referred to in the content. |
© 2024 by the authors. Licensee MDPI, Basel, Switzerland. This article is an open access article distributed under the terms and conditions of the Creative Commons Attribution (CC BY) license (https://creativecommons.org/licenses/by/4.0/).
Share and Cite
Delrue, C.; De Bruyne, S.; Speeckaert, M.M. Application of Machine Learning in Chronic Kidney Disease: Current Status and Future Prospects. Biomedicines 2024, 12, 568. https://doi.org/10.3390/biomedicines12030568
Delrue C, De Bruyne S, Speeckaert MM. Application of Machine Learning in Chronic Kidney Disease: Current Status and Future Prospects. Biomedicines. 2024; 12(3):568. https://doi.org/10.3390/biomedicines12030568
Chicago/Turabian StyleDelrue, Charlotte, Sander De Bruyne, and Marijn M. Speeckaert. 2024. "Application of Machine Learning in Chronic Kidney Disease: Current Status and Future Prospects" Biomedicines 12, no. 3: 568. https://doi.org/10.3390/biomedicines12030568