
The Antimalarial Drug Artesunate Mediates Selective Cytotoxicity by Upregulating HO-1 in Melanoma Cells
 , , , , and
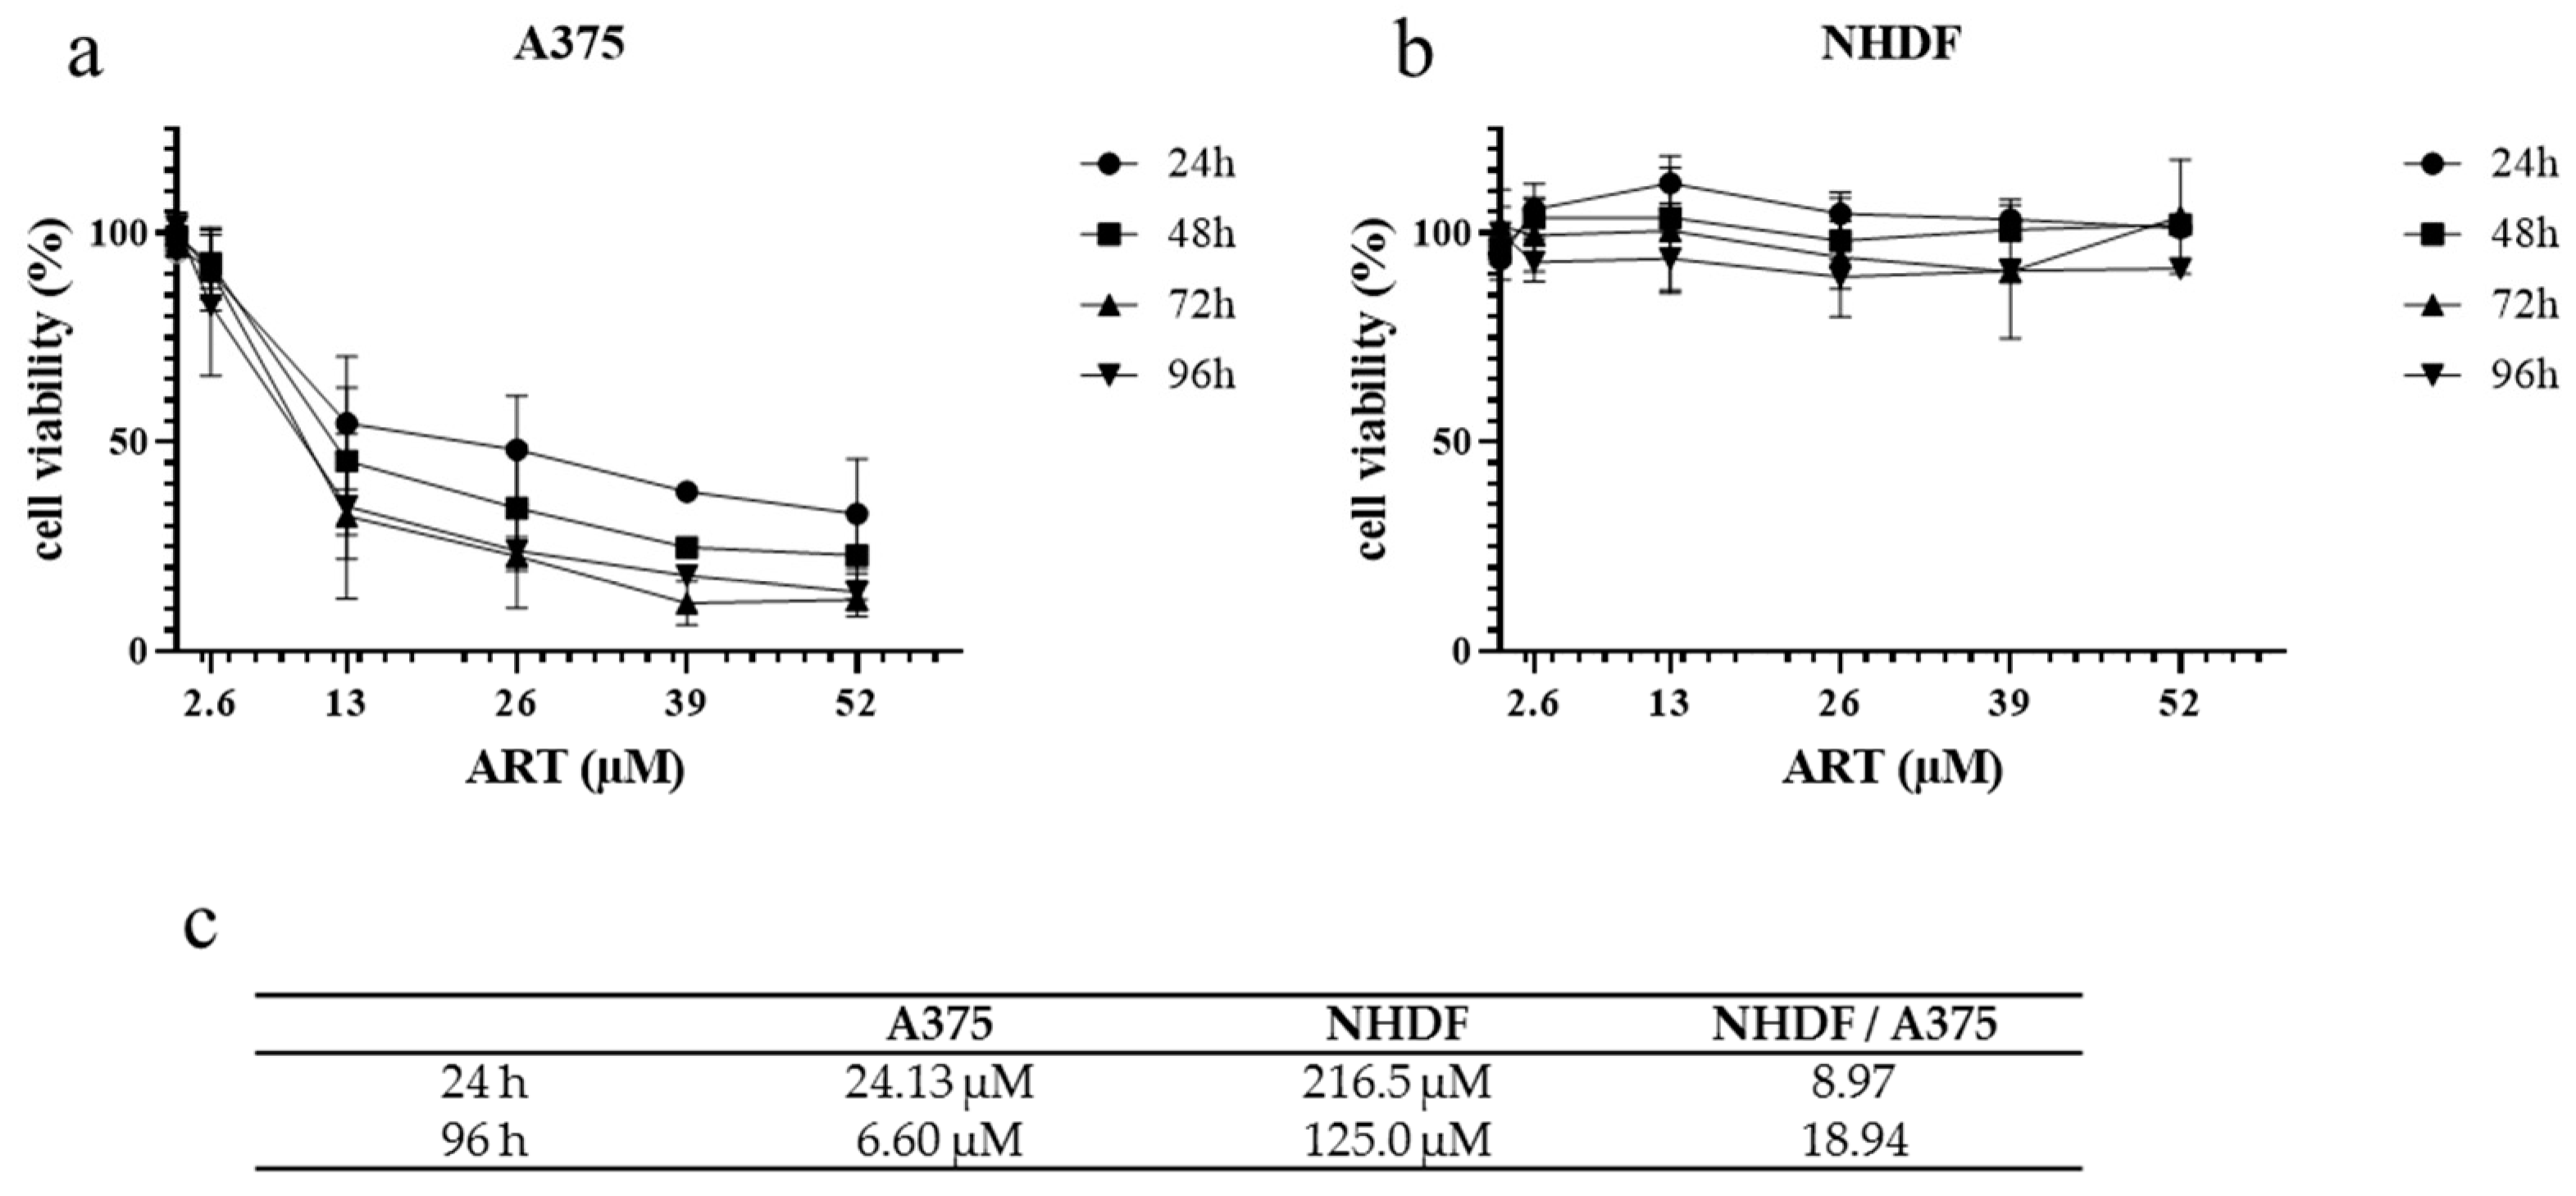
Abstract
:1. Introduction
2. Materials and Methods
2.1. Materials
2.2. Cell Culture
2.3. Viability—Sulforhodamine B Assay (SRB-Assay)
2.4. ROS Measurement via FACS
2.5. SDS-PAGE and Western Blot
2.6. Generating HO-1 Knock Out Cell Line
2.7. Statistical Analysis
3. Results
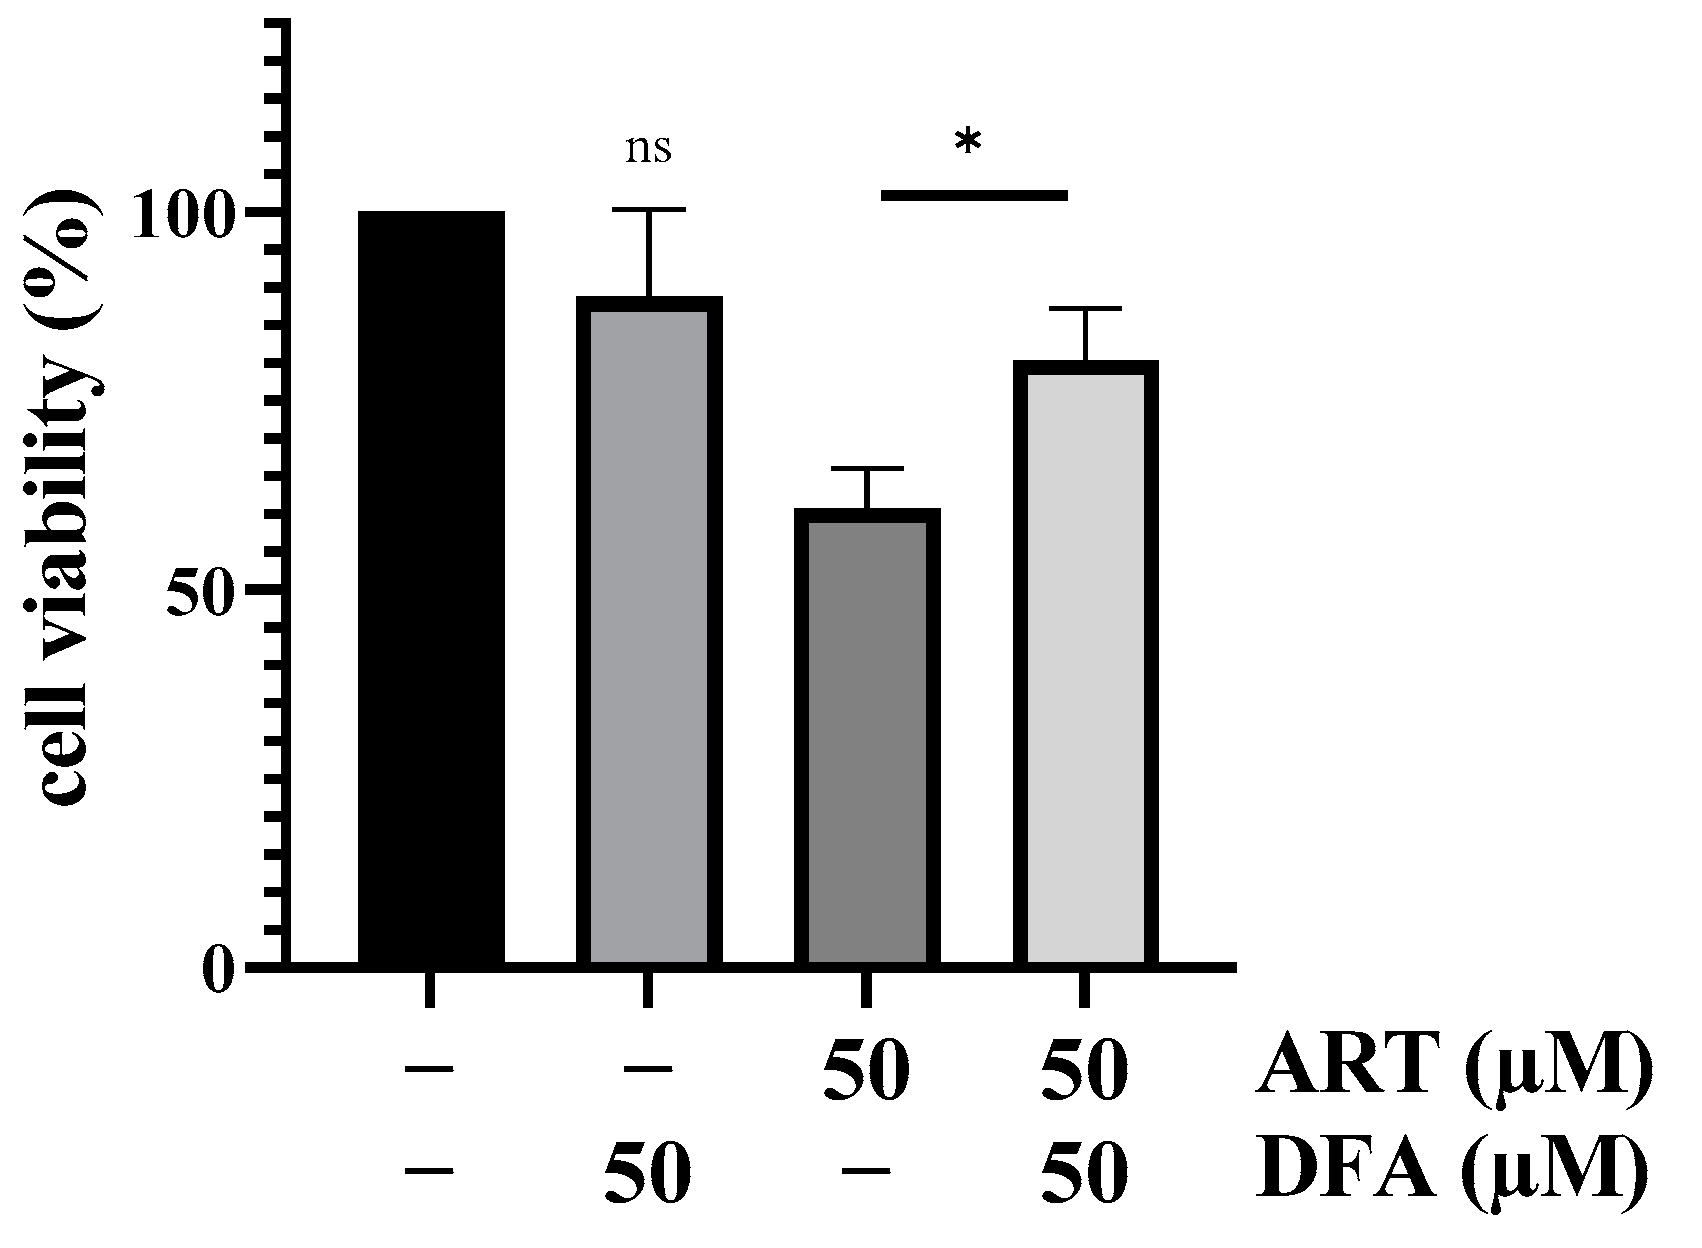
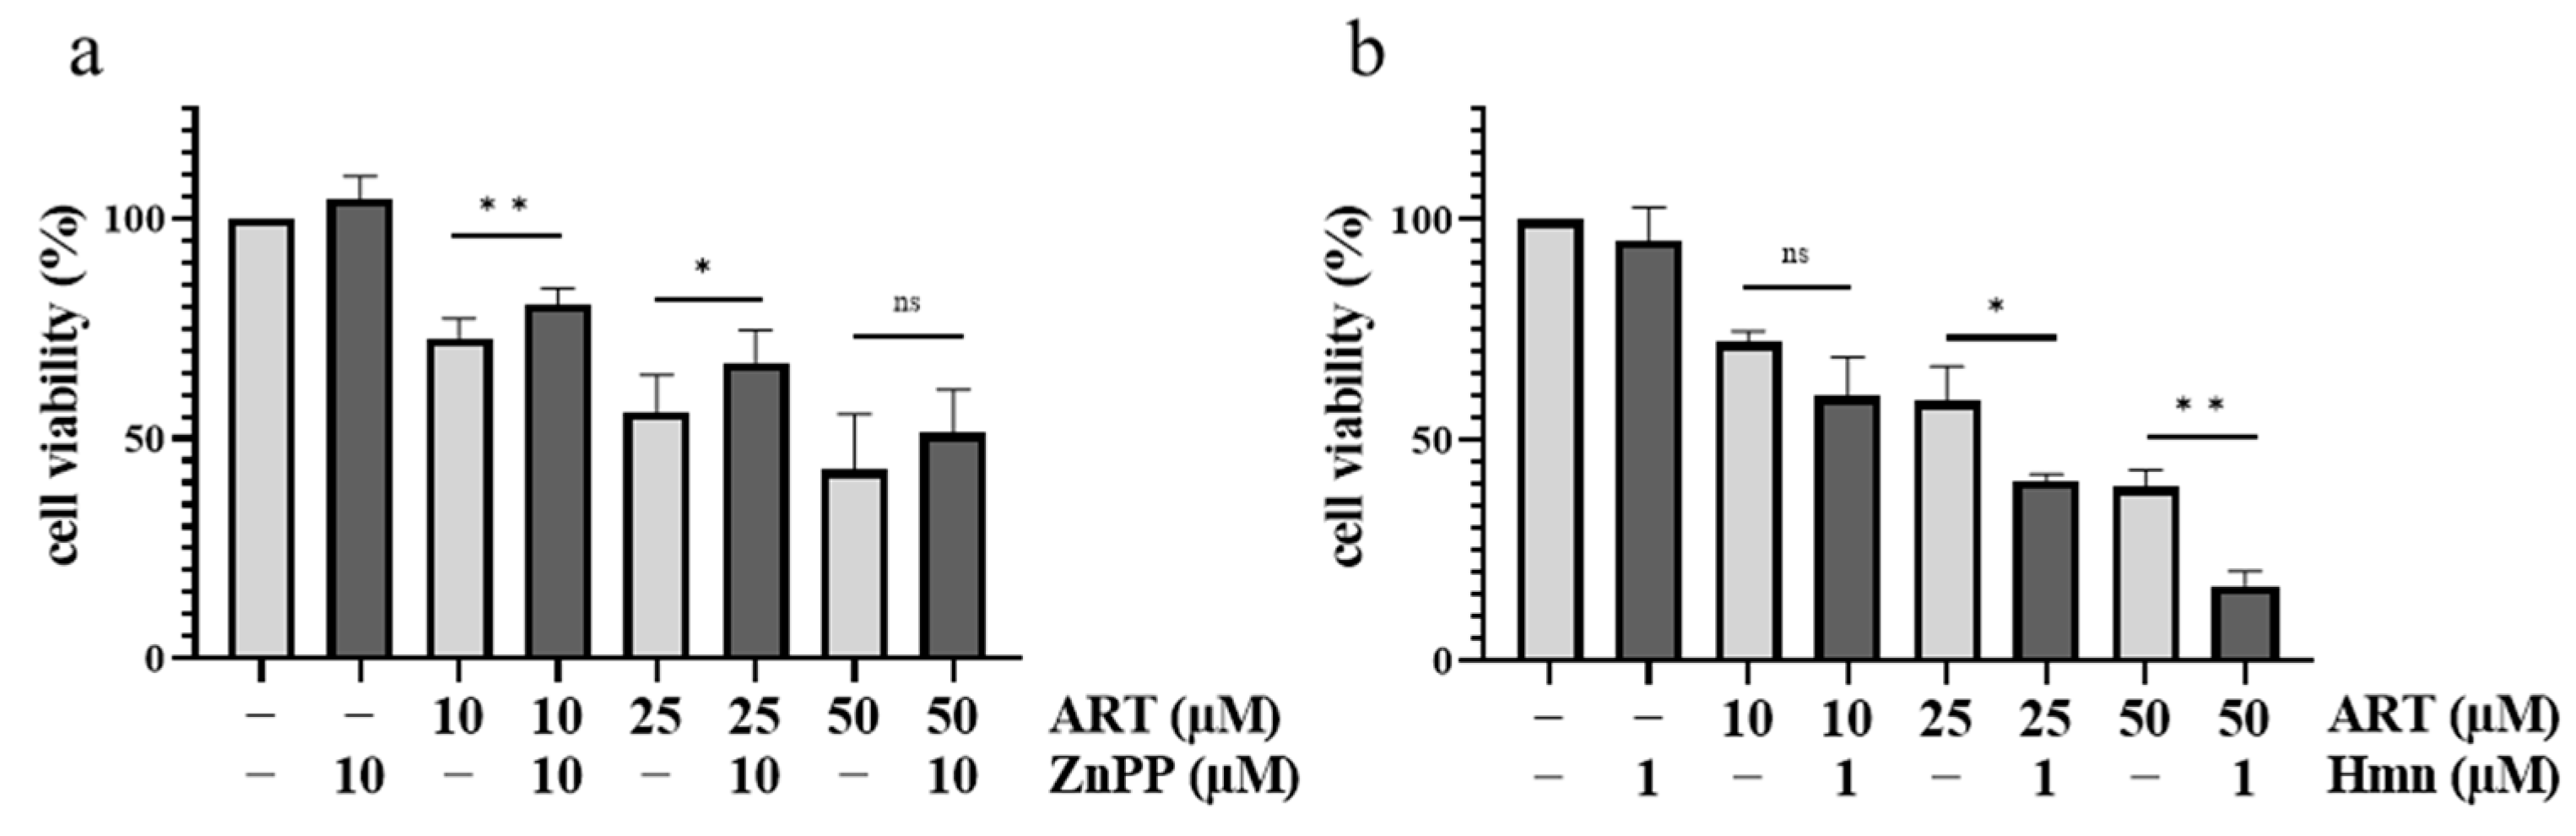
3.1. ART Displays Selective Cytotoxicity on Cancer Cells Depending on Intracellular Iron (Fe2+)
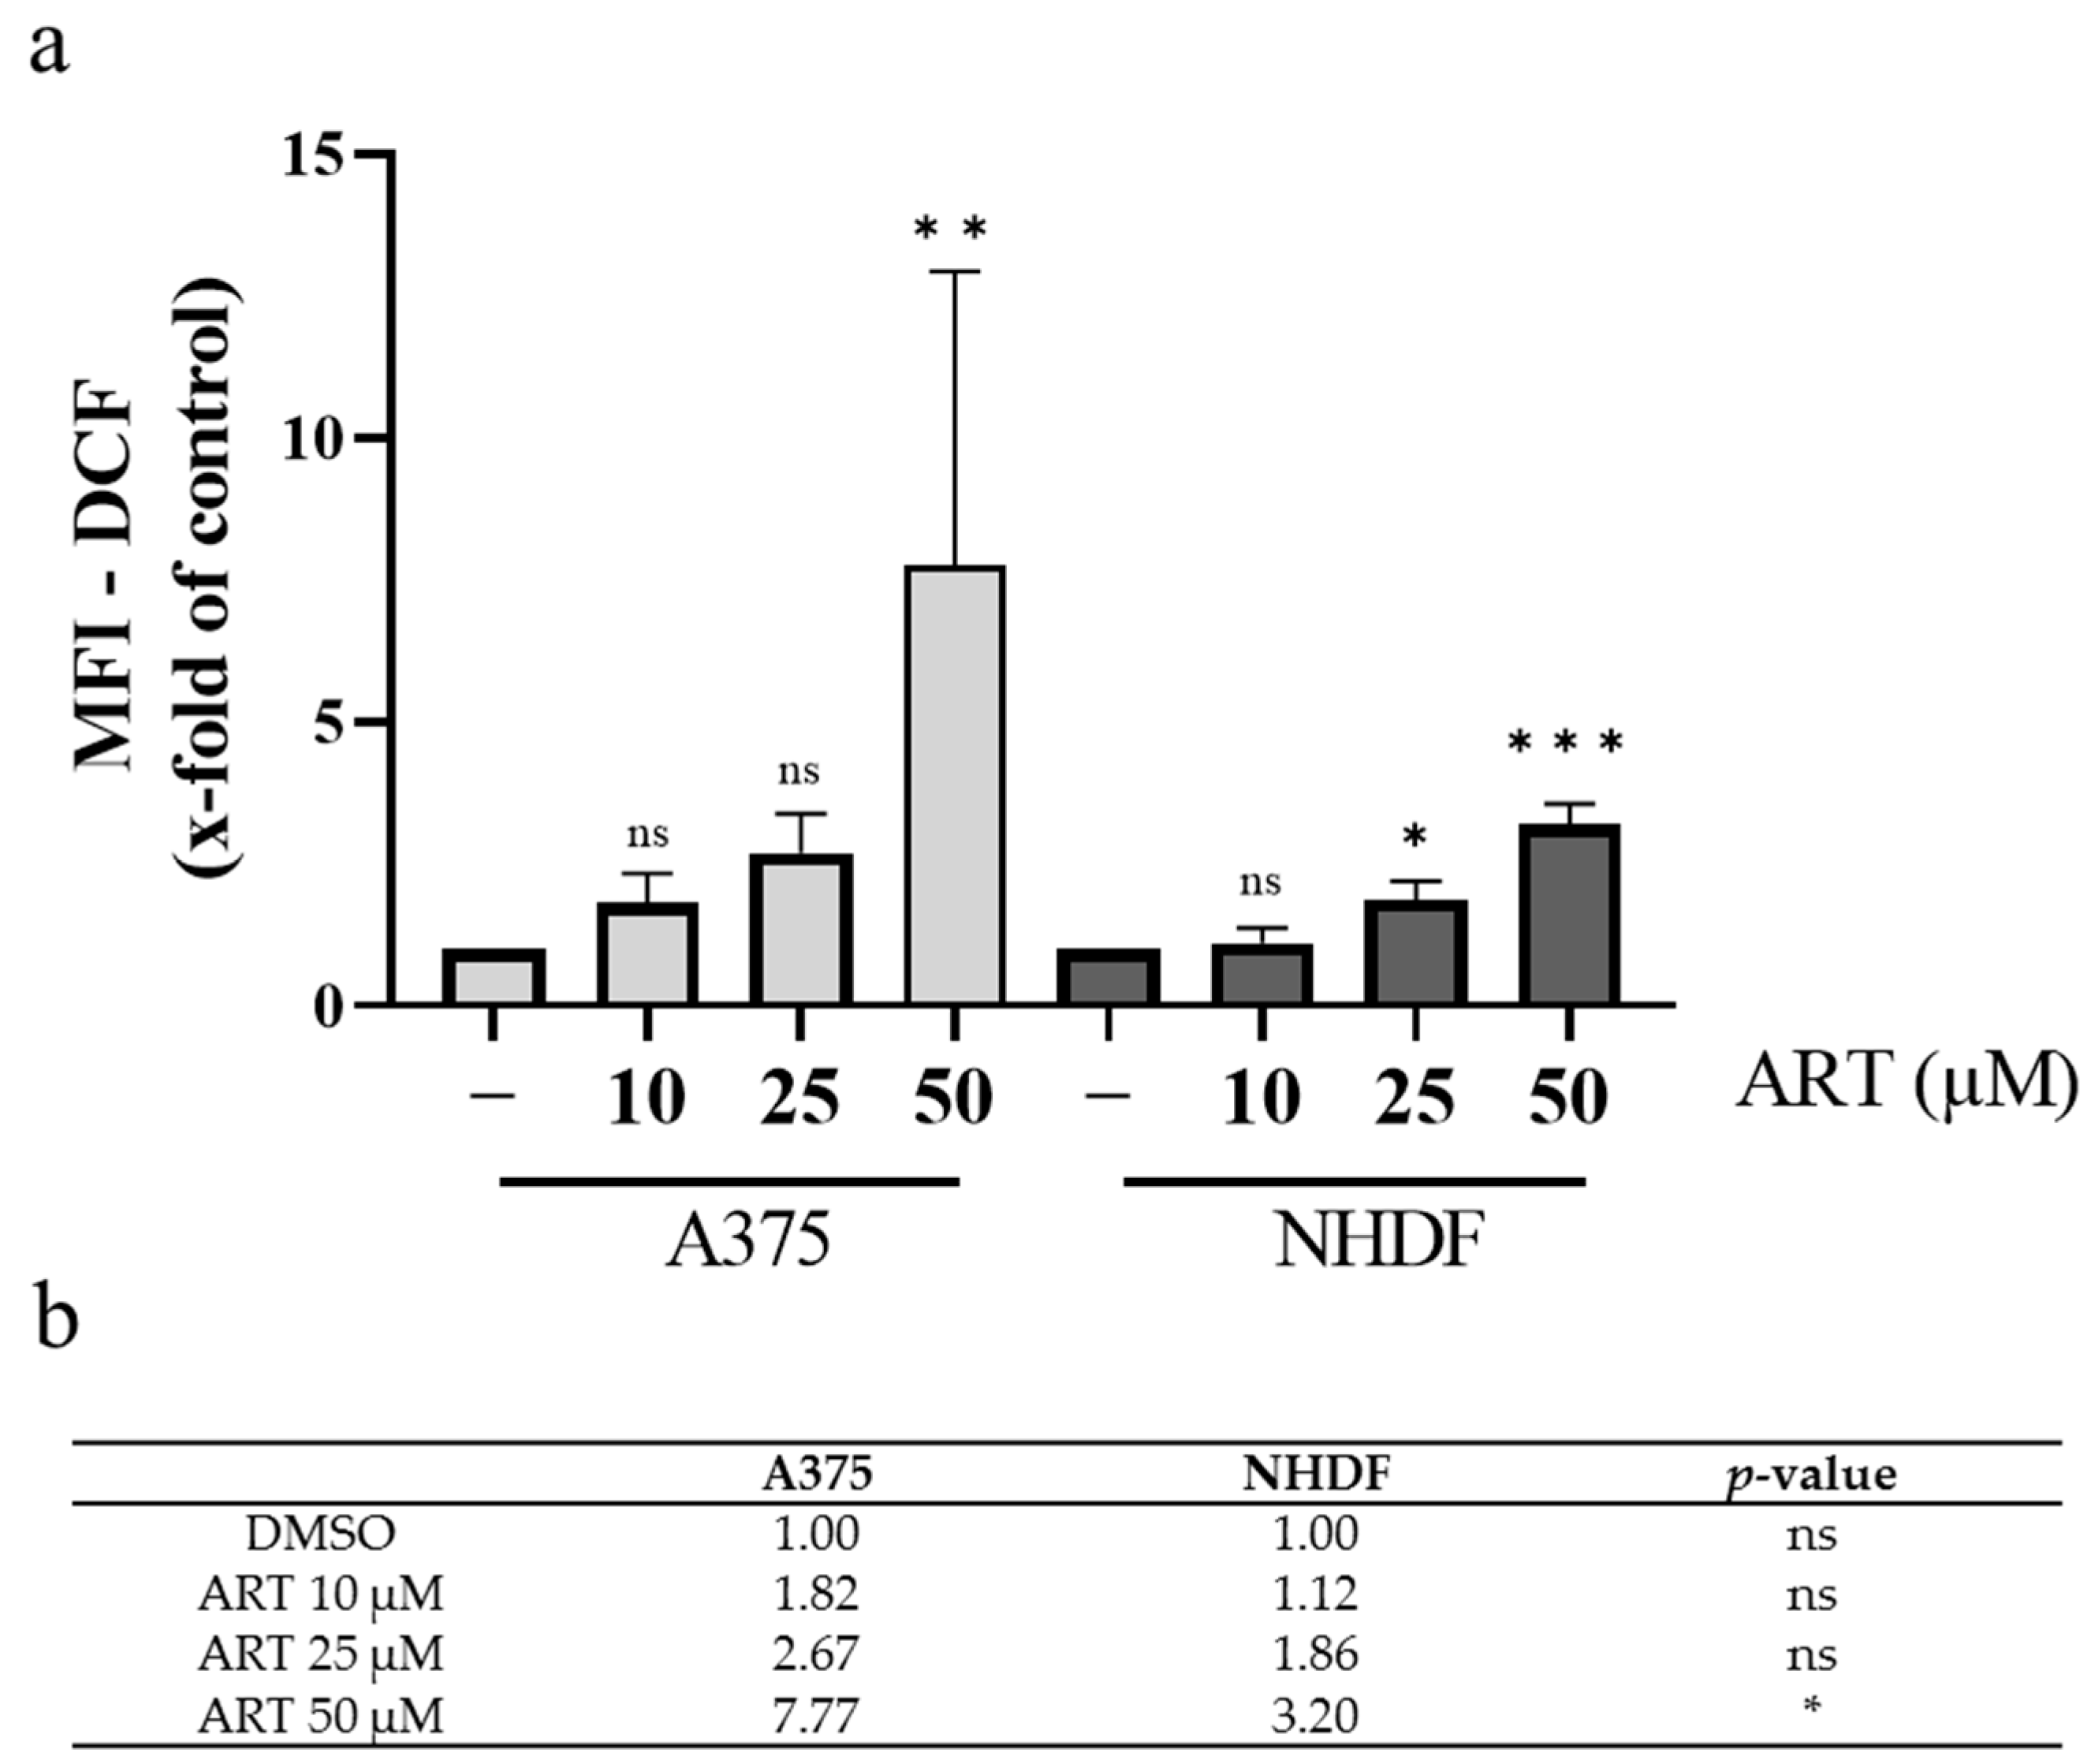
3.2. ART Selectively Induces Oxidative Stress in Melanoma Cells
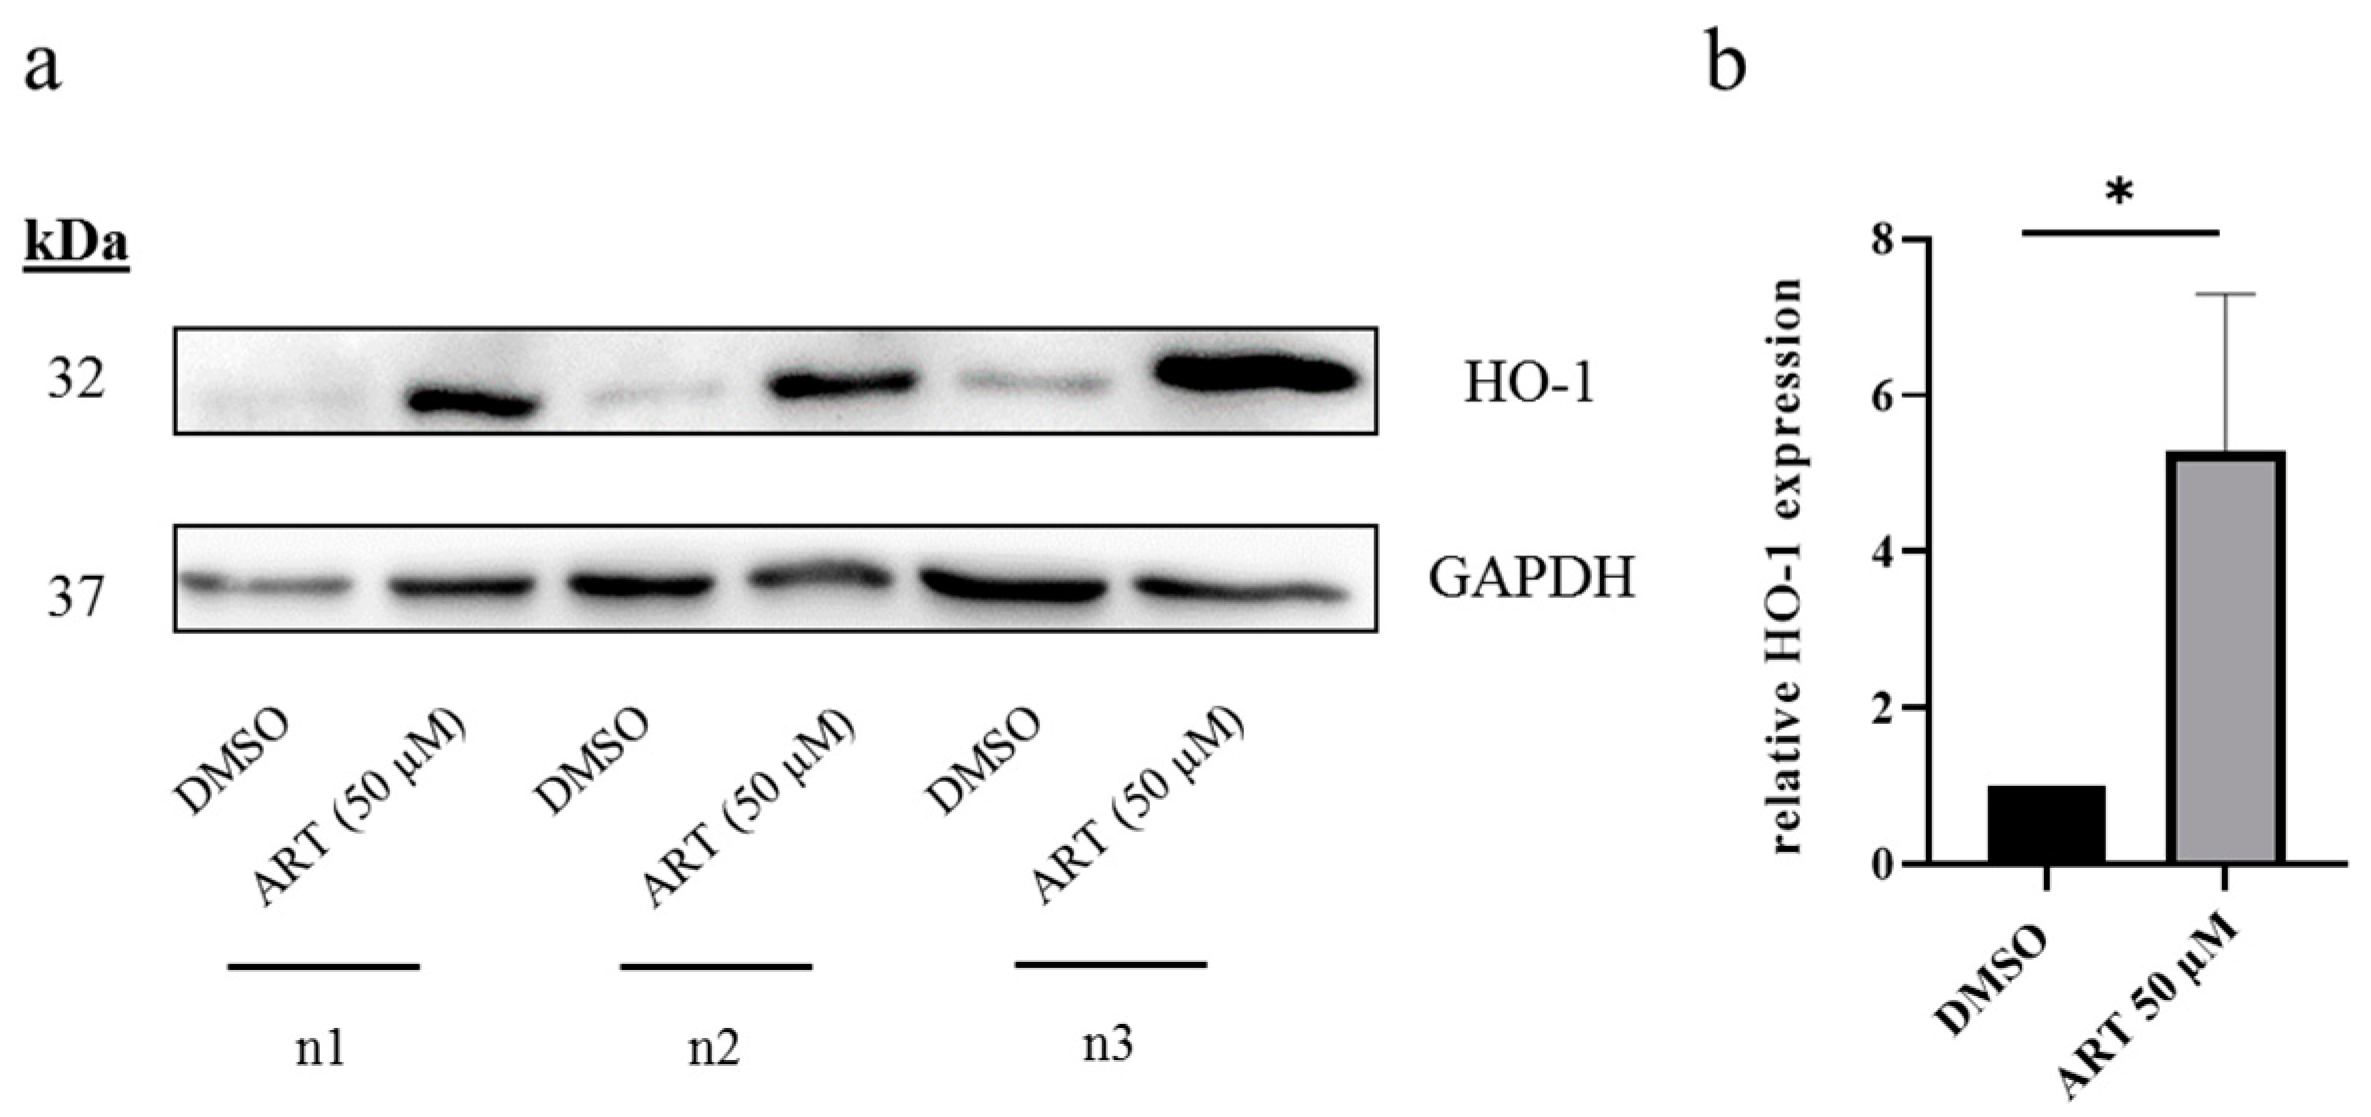
3.3. HO-1 Is Upregulated upon ART Treatment in Melanoma Cells
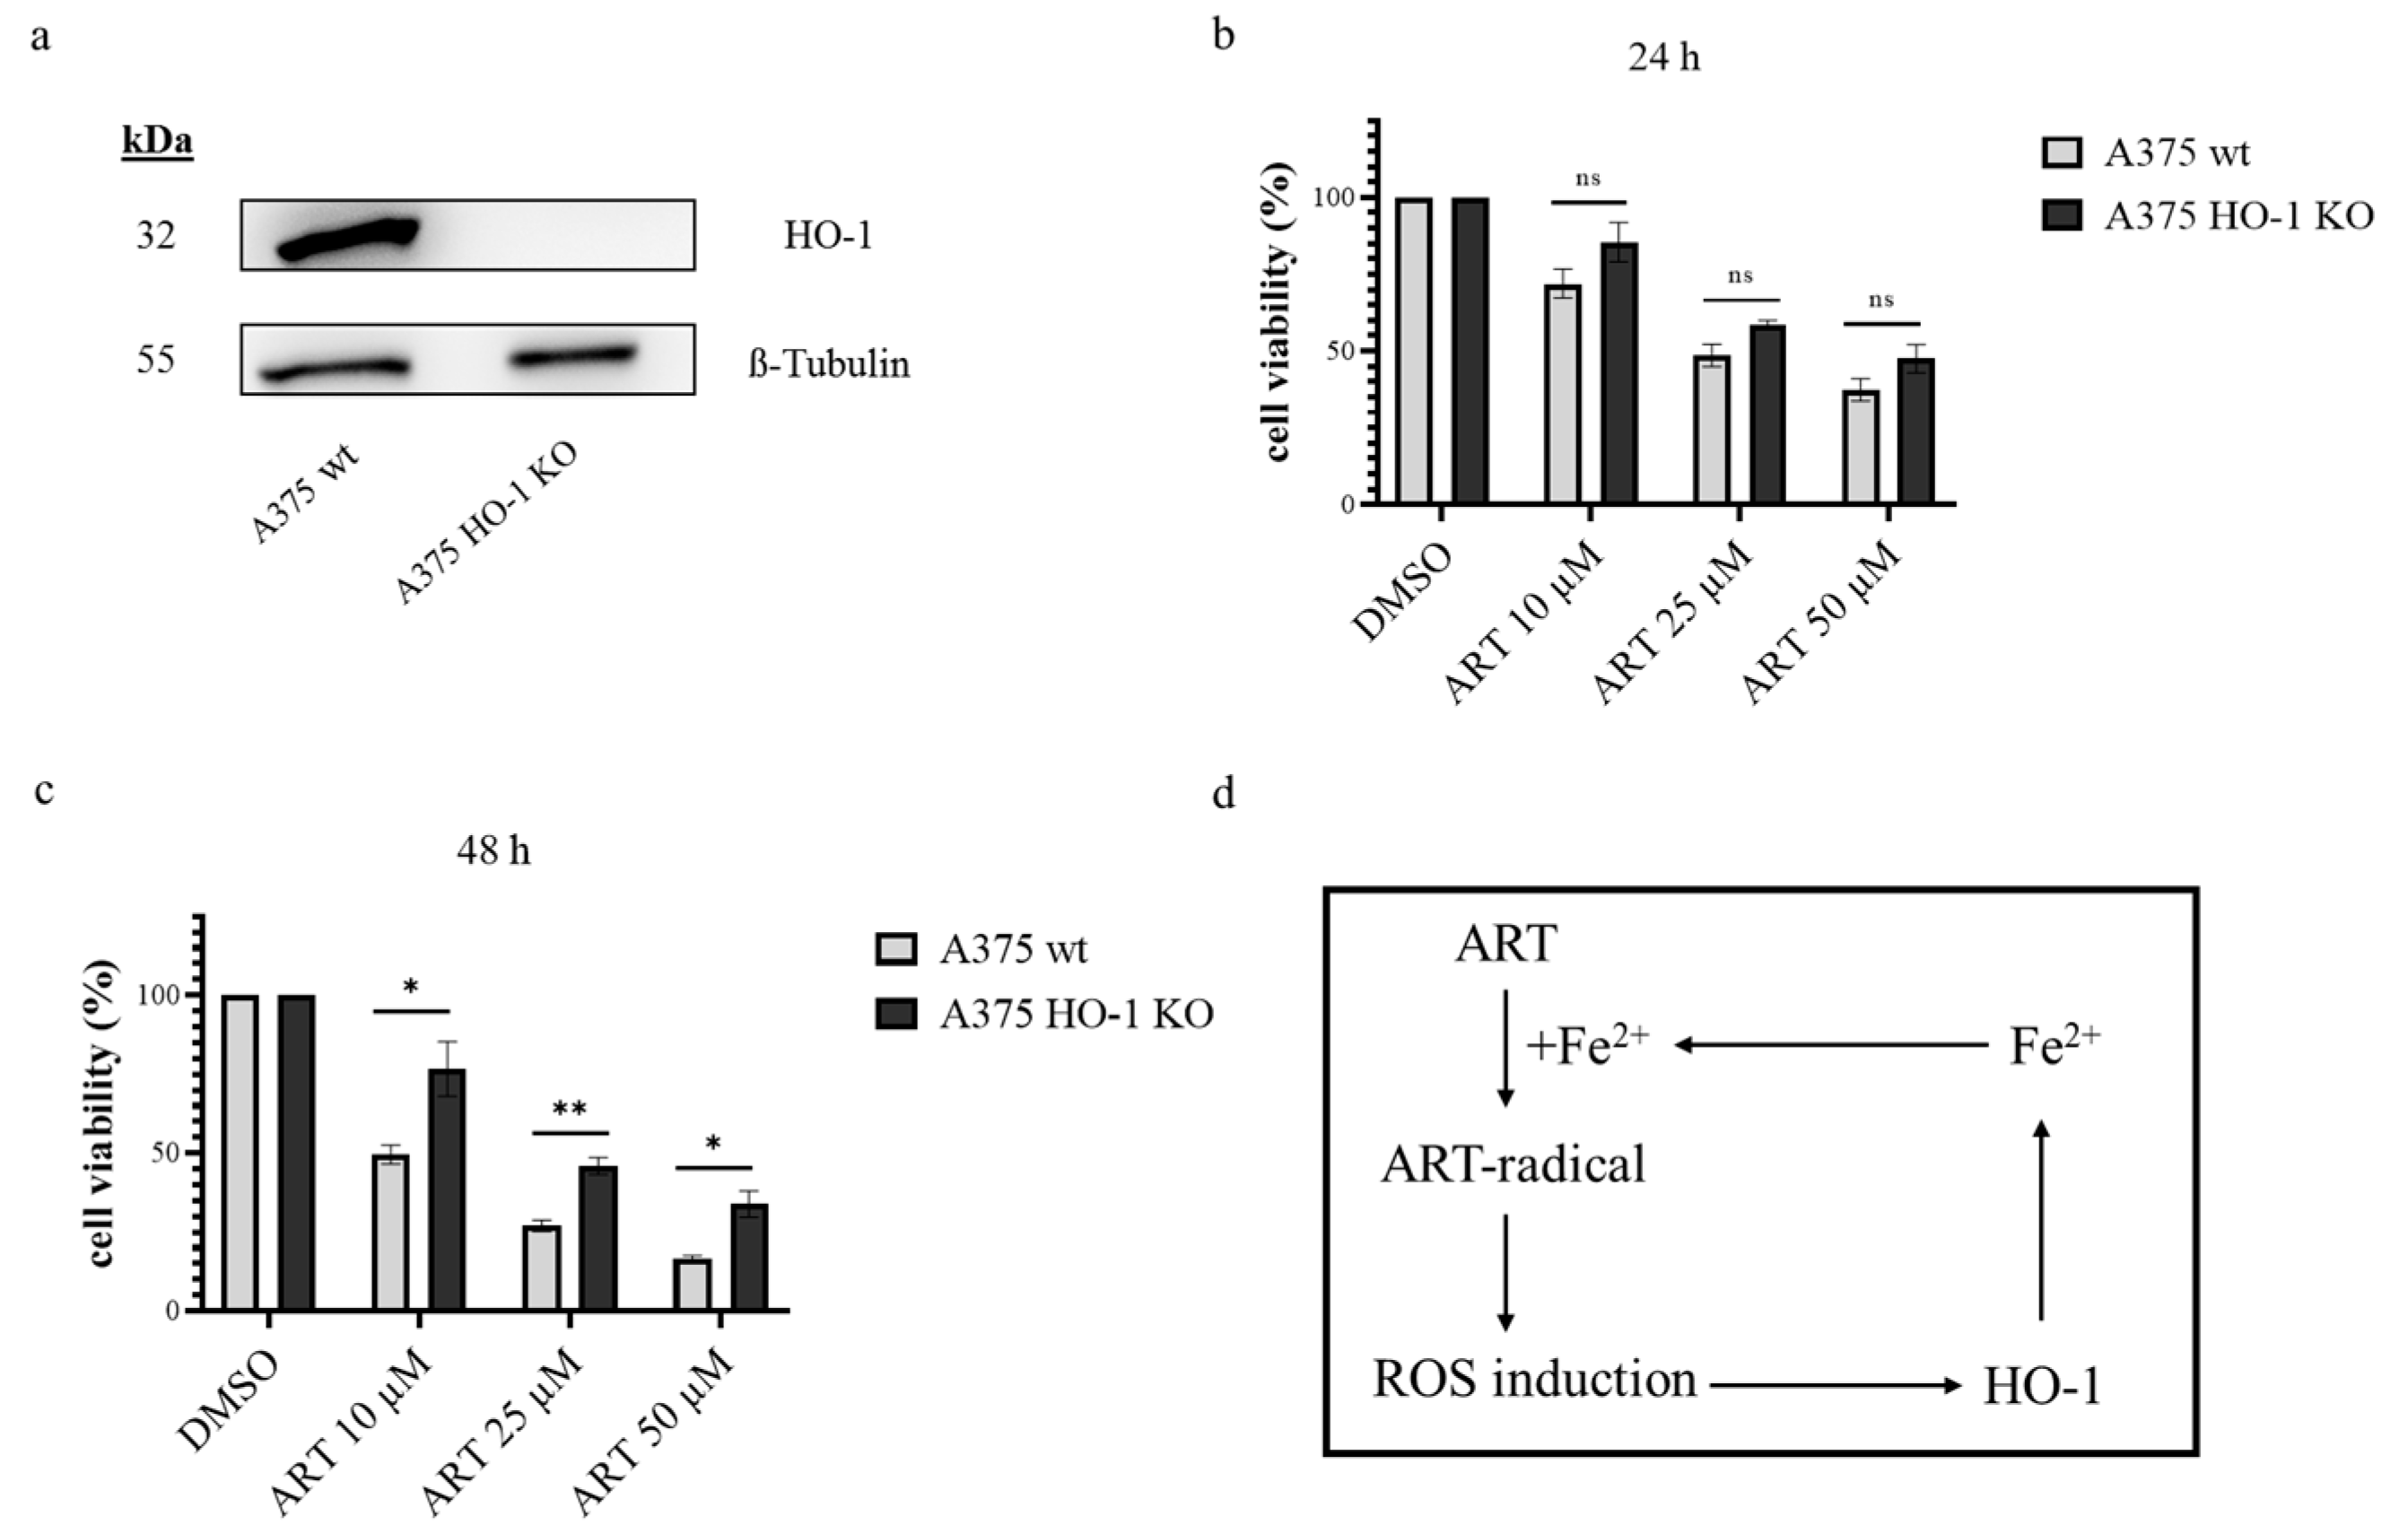
3.4. HO-1 Further Increases ART Mediated Cytotoxicity in Melanoma Cells
4. Discussion
5. Conclusions
Author Contributions
Funding
Data Availability Statement
Acknowledgments
Conflicts of Interest
References
- Sung, H.; Ferlay, J.; Siegel, R.L.; Laversanne, M.; Soerjomataram, I.; Jemal, A.; Bray, F. Global Cancer Statistics 2020: GLOBOCAN Estimates of Incidence and Mortality Worldwide for 36 Cancers in 185 Countries. CA Cancer J. Clin. 2021, 71, 209–249. [Google Scholar] [CrossRef] [PubMed]
- Whiteman, D.C.; Green, A.C.; Olsen, C.M. The Growing Burden of Invasive Melanoma: Projections of Incidence Rates and Numbers of New Cases in Six Susceptible Populations through 2031. J. Investig. Dermatol. 2016, 136, 1161–1171. [Google Scholar] [CrossRef] [PubMed]
- Nabirotchkin, S.; Peluffo, A.E.; Rinaudo, P.; Yu, J.; Hajj, R.; Cohen, D. Next-generation drug repurposing using human genetics and network biology. Curr. Opin. Pharmacol. 2020, 51, 78–92. [Google Scholar] [CrossRef] [PubMed]
- Wong, C.H.; Siah, K.W.; Lo, A.W. Corrigendum: Estimation of clinical trial success rates and related parameters. Biostatistics 2019, 20, 366. [Google Scholar] [CrossRef]
- Ávalos-Moreno, M.; López-Tejada, A.; Blaya-Cánovas, J.L.; Cara-Lupiañez, F.E.; González-González, A.; Lorente, J.A.; Sánchez-Rovira, P.; Granados-Principal, S. Drug Repurposing for Triple-Negative Breast Cancer. J. Pers. Med. 2020, 10, 200. [Google Scholar] [CrossRef] [PubMed]
- Ma, Z.; Woon, C.Y.-N.; Liu, C.-G.; Cheng, J.-T.; You, M.; Sethi, G.; Wong, A.L.-A.; Ho, P.C.-L.; Zhang, D.; Ong, P.; et al. Repurposing Artemisinin and its Derivatives as Anticancer Drugs: A Chance or Challenge? Front. Pharmacol. 2021, 12, 828856. [Google Scholar] [CrossRef]
- Kouakou, Y.I.; Tod, M.; Leboucher, G.; Lavoignat, A.; Bonnot, G.; Bienvenu, A.-L.; Picot, S. Systematic review of artesunate pharmacokinetics: Implication for treatment of resistant malaria. Int. J. Infect. Dis. 2019, 89, 30–44. [Google Scholar] [CrossRef]
- Hamacher-Brady, A.; Stein, H.A.; Turschner, S.; Toegel, I.; Mora, R.; Jennewein, N.; Efferth, T.; Eils, R.; Brady, N.R. Artesunate activates mitochondrial apoptosis in breast cancer cells via iron-catalyzed lysosomal reactive oxygen species production. J. Biol. Chem. 2011, 286, 6587–6601. [Google Scholar] [CrossRef]
- Eling, N.; Reuter, L.; Hazin, J.; Hamacher-Brady, A.; Brady, N.R. Identification of artesunate as a specific activator of ferroptosis in pancreatic cancer cells. Oncoscience 2015, 2, 517–532. [Google Scholar] [CrossRef]
- Button, R.W.; Lin, F.; Ercolano, E.; Vincent, J.H.; Hu, B.; Hanemann, C.O.; Luo, S. Artesunate induces necrotic cell death in schwannoma cells. Cell Death Dis. 2014, 5, e1466. [Google Scholar] [CrossRef]
- Geng, B.; Zhu, Y.; Yuan, Y.; Bai, J.; Dou, Z.; Sui, A.; Luo, W. Artesunate Suppresses Choroidal Melanoma Vasculogenic Mimicry Formation and Angiogenesis via the Wnt/CaMKII Signaling Axis. Front. Oncol. 2021, 11, 714646. [Google Scholar] [CrossRef]
- Xu, Z.; Liu, X.; Zhuang, D. Artesunate inhibits proliferation, migration, and invasion of thyroid cancer cells by regulating the PI3K/AKT/FKHR pathway. Biochem. Cell Biol. 2022, 100, 85–92. [Google Scholar] [CrossRef] [PubMed]
- Von Hagens, C.; Walter-Sack, I.; Goeckenjan, M.; Osburg, J.; Storch-Hagenlocher, B.; Sertel, S.; Elsässer, M.; Remppis, B.A.; Edler, L.; Munzinger, J.; et al. Prospective open uncontrolled phase I study to define a well-tolerated dose of oral artesunate as add-on therapy in patients with metastatic breast cancer (ARTIC M33/2). Breast Cancer Res. Treat. 2017, 164, 359–369. [Google Scholar] [CrossRef] [PubMed]
- Von Hagens, C.; Walter-Sack, I.; Goeckenjan, M.; Storch-Hagenlocher, B.; Sertel, S.; Elsässer, M.; Remppis, B.A.; Munzinger, J.; Edler, L.; Efferth, T.; et al. Long-term add-on therapy (compassionate use) with oral artesunate in patients with metastatic breast cancer after participating in a phase I study (ARTIC M33/2). Phytomedicine 2019, 54, 140–148. [Google Scholar] [CrossRef] [PubMed]
- Andreyev, A.Y.; Kushnareva, Y.E.; Starkov, A.A. Mitochondrial metabolism of reactive oxygen species. Biochemistry 2005, 70, 200–214. [Google Scholar] [CrossRef] [PubMed]
- Sies, H.; Belousov, V.V.; Chandel, N.S.; Davies, M.J.; Jones, D.P.; Mann, G.E.; Murphy, M.P.; Yamamoto, M.; Winterbourn, C. Defining roles of specific reactive oxygen species (ROS) in cell biology and physiology. Nat. Rev. Mol. Cell Biol. 2022, 23, 499–515. [Google Scholar] [CrossRef]
- Liou, G.-Y.; Storz, P. Reactive oxygen species in cancer. Free Radic. Res. 2010, 44, 479–496. [Google Scholar] [CrossRef]
- Perillo, B.; Di Donato, M.; Pezone, A.; Di Zazzo, E.; Giovannelli, P.; Galasso, G.; Castoria, G.; Migliaccio, A. ROS in cancer therapy: The bright side of the moon. Exp. Mol. Med. 2020, 52, 192–203. [Google Scholar] [CrossRef]
- Kim, S.J.; Kim, H.S.; Seo, Y.R. Understanding of ROS-Inducing Strategy in Anticancer Therapy. Oxid. Med. Cell. Longev. 2019, 2019, 5381692. [Google Scholar] [CrossRef]
- Nizami, Z.N.; Aburawi, H.E.; Semlali, A.; Muhammad, K.; Iratni, R. Oxidative Stress Inducers in Cancer Therapy: Preclinical and Clinical Evidence. Antioxidants 2023, 12, 1159. [Google Scholar] [CrossRef]
- Aplak, E.; von Montfort, C.; Haasler, L.; Stucki, D.; Steckel, B.; Reichert, A.S.; Stahl, W.; Brenneisen, P. CNP mediated selective toxicity on melanoma cells is accompanied by mitochondrial dysfunction. PLoS ONE 2020, 15, e0227926. [Google Scholar] [CrossRef] [PubMed]
- Alili, L.; Sack, M.; von Montfort, C.; Giri, S.; Das, S.; Carroll, K.S.; Zanger, K.; Seal, S.; Brenneisen, P. Downregulation of tumor growth and invasion by redox-active nanoparticles. Antioxid. Redox Signal. 2013, 19, 765–778. [Google Scholar] [CrossRef]
- Rahman, M.A.; Hannan, M.A.; Dash, R.; Rahman, M.H.; Islam, R.; Uddin, M.J.; Sohag, A.A.M.; Rahman, M.H.; Rhim, H. Phytochemicals as a Complement to Cancer Chemotherapy: Pharmacological Modulation of the Autophagy-Apoptosis Pathway. Front. Pharmacol. 2021, 12, 639628. [Google Scholar] [CrossRef]
- Du, J.-H.; Zhang, H.-D.; Ma, Z.-J.; Ji, K.-M. Artesunate induces oncosis-like cell death in vitro and has antitumor activity against pancreatic cancer xenografts in vivo. Cancer Chemother. Pharmacol. 2010, 65, 895–902. [Google Scholar] [CrossRef]
- Zhang, J.; Sun, X.; Wang, L.; Wong, Y.K.; Lee, Y.M.; Zhou, C.; Wu, G.; Zhao, T.; Yang, L.; Lu, L.; et al. Artesunate-induced mitophagy alters cellular redox status. Redox Biol. 2018, 19, 263–273. [Google Scholar] [CrossRef]
- Shterman, N.; Kupfer, B.; Moroz, C. Comparison of transferrin receptors, iron content and isoferritin profile in normal and malignant human breast cell lines. Pathobiology 1991, 59, 19–25. [Google Scholar] [CrossRef]
- Kwok, J.C.; Des Richardson, R. The iron metabolism of neoplastic cells: Alterations that facilitate proliferation? Crit. Rev. Oncol. Hematol. 2002, 42, 65–78. [Google Scholar] [CrossRef]
- Salnikow, K. Role of iron in cancer. Semin. Cancer Biol. 2021, 76, 189–194. [Google Scholar] [CrossRef]
- MacKenzie, E.L.; Iwasaki, K.; Tsuji, Y. Intracellular iron transport and storage: From molecular mechanisms to health implications. Antioxid. Redox Signal. 2008, 10, 997–1030. [Google Scholar] [CrossRef] [PubMed]
- Recalcati, S.; Gammella, E.; Buratti, P.; Cairo, G. Molecular regulation of cellular iron balance. IUBMB Life 2017, 69, 389–398. [Google Scholar] [CrossRef] [PubMed]
- Jung, M.; Mertens, C.; Tomat, E.; Brüne, B. Iron as a Central Player and Promising Target in Cancer Progression. Int. J. Mol. Sci. 2019, 20, 273. [Google Scholar] [CrossRef] [PubMed]
- Kwon, M.-Y.; Park, E.; Lee, S.-J.; Chung, S.W. Heme oxygenase-1 accelerates erastin-induced ferroptotic cell death. Oncotarget 2015, 6, 24393–24403. [Google Scholar] [CrossRef] [PubMed]
- Farombi, E.O.; Surh, Y.J. Heme oxygenase-1 as a potential therapeutic target for hepatoprotection. J. Biochem. Mol. Biol. 2006, 39, 479–491. [Google Scholar] [CrossRef] [PubMed]
- Pae, H.-O.; Chung, H.-T. Heme oxygenase-1: Its therapeutic roles in inflammatory diseases. Immune Netw. 2009, 9, 12–19. [Google Scholar] [CrossRef]
- Duvigneau, J.C.; Esterbauer, H.; Kozlov, A.V. Role of Heme Oxygenase as a Modulator of Heme-Mediated Pathways. Antioxidants 2019, 8, 475. [Google Scholar] [CrossRef]
- Skehan, P.; Storeng, R.; Scudiero, D.; Monks, A.; McMahon, J.; Vistica, D.; Warren, J.T.; Bokesch, H.; Kenney, S.; Boyd, M.R. New colorimetric cytotoxicity assay for anticancer-drug screening. J. Natl. Cancer Inst. 1990, 82, 1107–1112. [Google Scholar] [CrossRef]
- Murphy, M.P.; Bayir, H.; Belousov, V.; Chang, C.J.; Davies, K.J.A.; Davies, M.J.; Dick, T.P.; Finkel, T.; Forman, H.J.; Janssen-Heininger, Y.; et al. Guidelines for measuring reactive oxygen species and oxidative damage in cells and in vivo. Nat. Metab. 2022, 4, 651–662. [Google Scholar] [CrossRef]
- Laemmli, U.K. Cleavage of structural proteins during the assembly of the head of bacteriophage T4. Nature 1970, 227, 680–685. [Google Scholar] [CrossRef]
- O’Neill, P.M.; Barton, V.E.; Ward, S.A. The molecular mechanism of action of artemisinin--the debate continues. Molecules 2010, 15, 1705–1721. [Google Scholar] [CrossRef]
- Rudrapal, M.; Chetia, D. Endoperoxide antimalarials: Development, structural diversity and pharmacodynamic aspects with reference to 1,2,4-trioxane-based structural scaffold. Drug Des. Dev. Ther. 2016, 10, 3575–3590. [Google Scholar] [CrossRef]
- Meshnick, S.R. The mode of action of antimalarial endoperoxides. Trans. R. Soc. Trop. Med. Hyg. 1994, 88 (Suppl. S1), 31–32. [Google Scholar] [CrossRef]
- Yang, N.-D.; Tan, S.-H.; Ng, S.; Shi, Y.; Zhou, J.; Tan, K.S.W.; Wong, W.-S.F.; Shen, H.-M. Artesunate induces cell death in human cancer cells via enhancing lysosomal function and lysosomal degradation of ferritin. J. Biol. Chem. 2014, 289, 33425–33441. [Google Scholar] [CrossRef] [PubMed]
- Efferth, T.; Giaisi, M.; Merling, A.; Krammer, P.H.; Li-Weber, M. Artesunate induces ROS-mediated apoptosis in doxorubicin-resistant T leukemia cells. PLoS ONE 2007, 2, e693. [Google Scholar] [CrossRef]
- Berdelle, N.; Nikolova, T.; Quiros, S.; Efferth, T.; Kaina, B. Artesunate induces oxidative DNA damage, sustained DNA double-strand breaks, and the ATM/ATR damage response in cancer cells. Mol. Cancer Ther. 2011, 10, 2224–2233. [Google Scholar] [CrossRef]
- Chiang, S.-K.; Chen, S.-E.; Chang, L.-C. The Role of HO-1 and Its Crosstalk with Oxidative Stress in Cancer Cell Survival. Cells 2021, 10, 2401. [Google Scholar] [CrossRef]
- Kwok, S.C.M. Zinc Protoporphyrin Upregulates Heme Oxygenase-1 in PC-3 Cells via the Stress Response Pathway. Int. J. Cell Biol. 2013, 2013, 162094. [Google Scholar] [CrossRef] [PubMed]
- Bharucha, A.E.; Kulkarni, A.; Choi, K.M.; Camilleri, M.; Lempke, M.; Brunn, G.J.; Gibbons, S.J.; Zinsmeister, A.R.; Farrugia, G. First-in-human study demonstrating pharmacological activation of heme oxygenase-1 in humans. Clin. Pharmacol. Ther. 2010, 87, 187–190. [Google Scholar] [CrossRef] [PubMed]
- Jenkins, R.W.; Fisher, D.E. Treatment of Advanced Melanoma in 2020 and Beyond. J. Investig. Dermatol. 2021, 141, 23–31. [Google Scholar] [CrossRef]
- Thornton, J.; Chhabra, G.; Singh, C.K.; Guzmán-Pérez, G.; Shirley, C.A.; Ahmad, N. Mechanisms of Immunotherapy Resistance in Cutaneous Melanoma: Recognizing a Shapeshifter. Front. Oncol. 2022, 12, 880876. [Google Scholar] [CrossRef] [PubMed]
- Amaral, T.; Seeber, O.; Mersi, E.; Sanchez, S.; Thomas, I.; Meiwes, A.; Forschner, A.; Leiter, U.; Eigentler, T.; Keim, U.; et al. Primary Resistance to PD-1-Based Immunotherapy-A Study in 319 Patients with Stage IV Melanoma. Cancers 2020, 12, 1027. [Google Scholar] [CrossRef]
- Patel, M.; Eckburg, A.; Gantiwala, S.; Hart, Z.; Dein, J.; Lam, K.; Puri, N. Resistance to Molecularly Targeted Therapies in Melanoma. Cancers 2021, 13, 1115. [Google Scholar] [CrossRef]
- Zoller, T.; Junghanss, T.; Kapaun, A.; Gjorup, I.; Richter, J.; Hugo-Persson, M.; Mørch, K.; Foroutan, B.; Suttorp, N.; Yürek, S.; et al. Intravenous artesunate for severe malaria in travelers, Europe. Emerg. Infect. Dis. 2011, 17, 771–777. [Google Scholar] [CrossRef]
- Efferth, T.; Dunstan, H.; Sauerbrey, A.; Miyachi, H.; Chitambar, C.R. The anti-malarial artesunate is also active against cancer. Int. J. Oncol. 2001, 18, 767–773. [Google Scholar] [CrossRef] [PubMed]
- Roh, J.-L.; Kim, E.H.; Jang, H.; Shin, D. Nrf2 inhibition reverses the resistance of cisplatin-resistant head and neck cancer cells to artesunate-induced ferroptosis. Redox Biol. 2017, 11, 254–262. [Google Scholar] [CrossRef]
- Da Jeong, E.; Song, H.J.J.; Lim, S.; Lee, S.J.J.; Lim, J.E.; Nam, D.-H.; Joo, K.M.; Jeong, B.C.; Jeon, S.S.; Choi, H.Y.; et al. Repurposing the anti-malarial drug artesunate as a novel therapeutic agent for metastatic renal cell carcinoma due to its attenuation of tumor growth, metastasis, and angiogenesis. Oncotarget 2015, 6, 33046–33064. [Google Scholar] [CrossRef] [PubMed]
- Tamargo, J.; Le Heuzey, J.-Y.; Mabo, P. Narrow therapeutic index drugs: A clinical pharmacological consideration to flecainide. Eur. J. Clin. Pharmacol. 2015, 71, 549–567. [Google Scholar] [CrossRef]
- Smita, P.; Narayan, P.A.; Gaurav, P. Therapeutic drug monitoring for cytotoxic anticancer drugs: Principles and evidence-based practices. Front. Oncol. 2022, 12, 1015200. [Google Scholar] [CrossRef]
- Jiang, Z.; Wang, Z.; Chen, L.; Zhang, C.; Liao, F.; Wang, Y.; Wang, Y.; Luo, P.; Luo, M.; Shi, C. Artesunate induces ER-derived-ROS-mediated cell death by disrupting labile iron pool and iron redistribution in hepatocellular carcinoma cells. Am. J. Cancer Res. 2021, 11, 691–711. [Google Scholar] [PubMed]
- Cheng, R.; Li, C.; Li, C.; Wei, L.; Li, L.; Zhang, Y.; Yao, Y.; Gu, X.; Cai, W.; Yang, Z.; et al. The artemisinin derivative artesunate inhibits corneal neovascularization by inducing ROS-dependent apoptosis in vascular endothelial cells. Investig. Ophthalmol. Vis. Sci. 2013, 54, 3400–3409. [Google Scholar] [CrossRef]
- Beccafico, S.; Morozzi, G.; Marchetti, M.C.; Riccardi, C.; Sidoni, A.; Donato, R.; Sorci, G. Artesunate induces ROS- and p38 MAPK-mediated apoptosis and counteracts tumor growth in vivo in embryonal rhabdomyosarcoma cells. Carcinogenesis 2015, 36, 1071–1083. [Google Scholar] [CrossRef]
- Schieber, M.; Chandel, N.S. ROS function in redox signaling and oxidative stress. Curr. Biol. 2014, 24, R453–R462. [Google Scholar] [CrossRef] [PubMed]
- Levonen, A.-L.; Hill, B.G.; Kansanen, E.; Zhang, J.; Darley-Usmar, V.M. Redox regulation of antioxidants, autophagy, and the response to stress: Implications for electrophile therapeutics. Free Radic. Biol. Med. 2014, 71, 196–207. [Google Scholar] [CrossRef]
- Kansanen, E.; Kuosmanen, S.M.; Leinonen, H.; Levonen, A.-L. The Keap1-Nrf2 pathway: Mechanisms of activation and dysregulation in cancer. Redox Biol. 2013, 1, 45–49. [Google Scholar] [CrossRef] [PubMed]
- Ngo, V.; Duennwald, M.L. Nrf2 and Oxidative Stress: A General Overview of Mechanisms and Implications in Human Disease. Antioxidants 2022, 11, 2345. [Google Scholar] [CrossRef]
- Zhao, D.; Zhang, J.; Xu, G.; Wang, Q. Artesunate Protects LPS-Induced Acute Lung Injury by Inhibiting TLR4 Expression and Inducing Nrf2 Activation. Inflammation 2017, 40, 798–805. [Google Scholar] [CrossRef] [PubMed]
- Chiang, S.-K.; Chen, S.-E.; Chang, L.-C. A Dual Role of Heme Oxygenase-1 in Cancer Cells. Int. J. Mol. Sci. 2018, 20, 39. [Google Scholar] [CrossRef]
- Mayerhofer, M.; Gleixner, K.V.; Mayerhofer, J.; Hoermann, G.; Jaeger, E.; Aichberger, K.J.; Ott, R.G.; Greish, K.; Nakamura, H.; Derdak, S.; et al. Targeting of heat shock protein 32 (Hsp32)/heme oxygenase-1 (HO-1) in leukemic cells in chronic myeloid leukemia: A novel approach to overcome resistance against imatinib. Blood 2008, 111, 2200–2210. [Google Scholar] [CrossRef]
- Hill, K.S.; McDowell, A.; McCorkle, J.R.; Schuler, E.; Ellingson, S.R.; Plattner, R.; Kolesar, J.M. KEAP1 Is Required for Artesunate Anticancer Activity in Non-Small-Cell Lung Cancer. Cancers 2021, 13, 1885. [Google Scholar] [CrossRef]


Disclaimer/Publisher’s Note: The statements, opinions and data contained in all publications are solely those of the individual author(s) and contributor(s) and not of MDPI and/or the editor(s). MDPI and/or the editor(s) disclaim responsibility for any injury to people or property resulting from any ideas, methods, instructions or products referred to in the content. |
© 2023 by the authors. Licensee MDPI, Basel, Switzerland. This article is an open access article distributed under the terms and conditions of the Creative Commons Attribution (CC BY) license (https://creativecommons.org/licenses/by/4.0/).
Share and Cite
Jochims, F.; Strohm, R.; von Montfort, C.; Wenzel, C.-K.; Klahm, N.; Kondadi, A.K.; Stahl, W.; Reichert, A.S.; Brenneisen, P. The Antimalarial Drug Artesunate Mediates Selective Cytotoxicity by Upregulating HO-1 in Melanoma Cells. Biomedicines 2023, 11, 2393. https://doi.org/10.3390/biomedicines11092393
Jochims F, Strohm R, von Montfort C, Wenzel C-K, Klahm N, Kondadi AK, Stahl W, Reichert AS, Brenneisen P. The Antimalarial Drug Artesunate Mediates Selective Cytotoxicity by Upregulating HO-1 in Melanoma Cells. Biomedicines. 2023; 11(9):2393. https://doi.org/10.3390/biomedicines11092393
Chicago/Turabian StyleJochims, Finn, Rebecca Strohm, Claudia von Montfort, Chantal-Kristin Wenzel, Niklas Klahm, Arun Kumar Kondadi, Wilhelm Stahl, Andreas S. Reichert, and Peter Brenneisen. 2023. "The Antimalarial Drug Artesunate Mediates Selective Cytotoxicity by Upregulating HO-1 in Melanoma Cells" Biomedicines 11, no. 9: 2393. https://doi.org/10.3390/biomedicines11092393