
Myogenesis in C2C12 Cells Requires Phosphorylation of ATF6α by p38 MAPK
 , ,
, ,  , , , , and
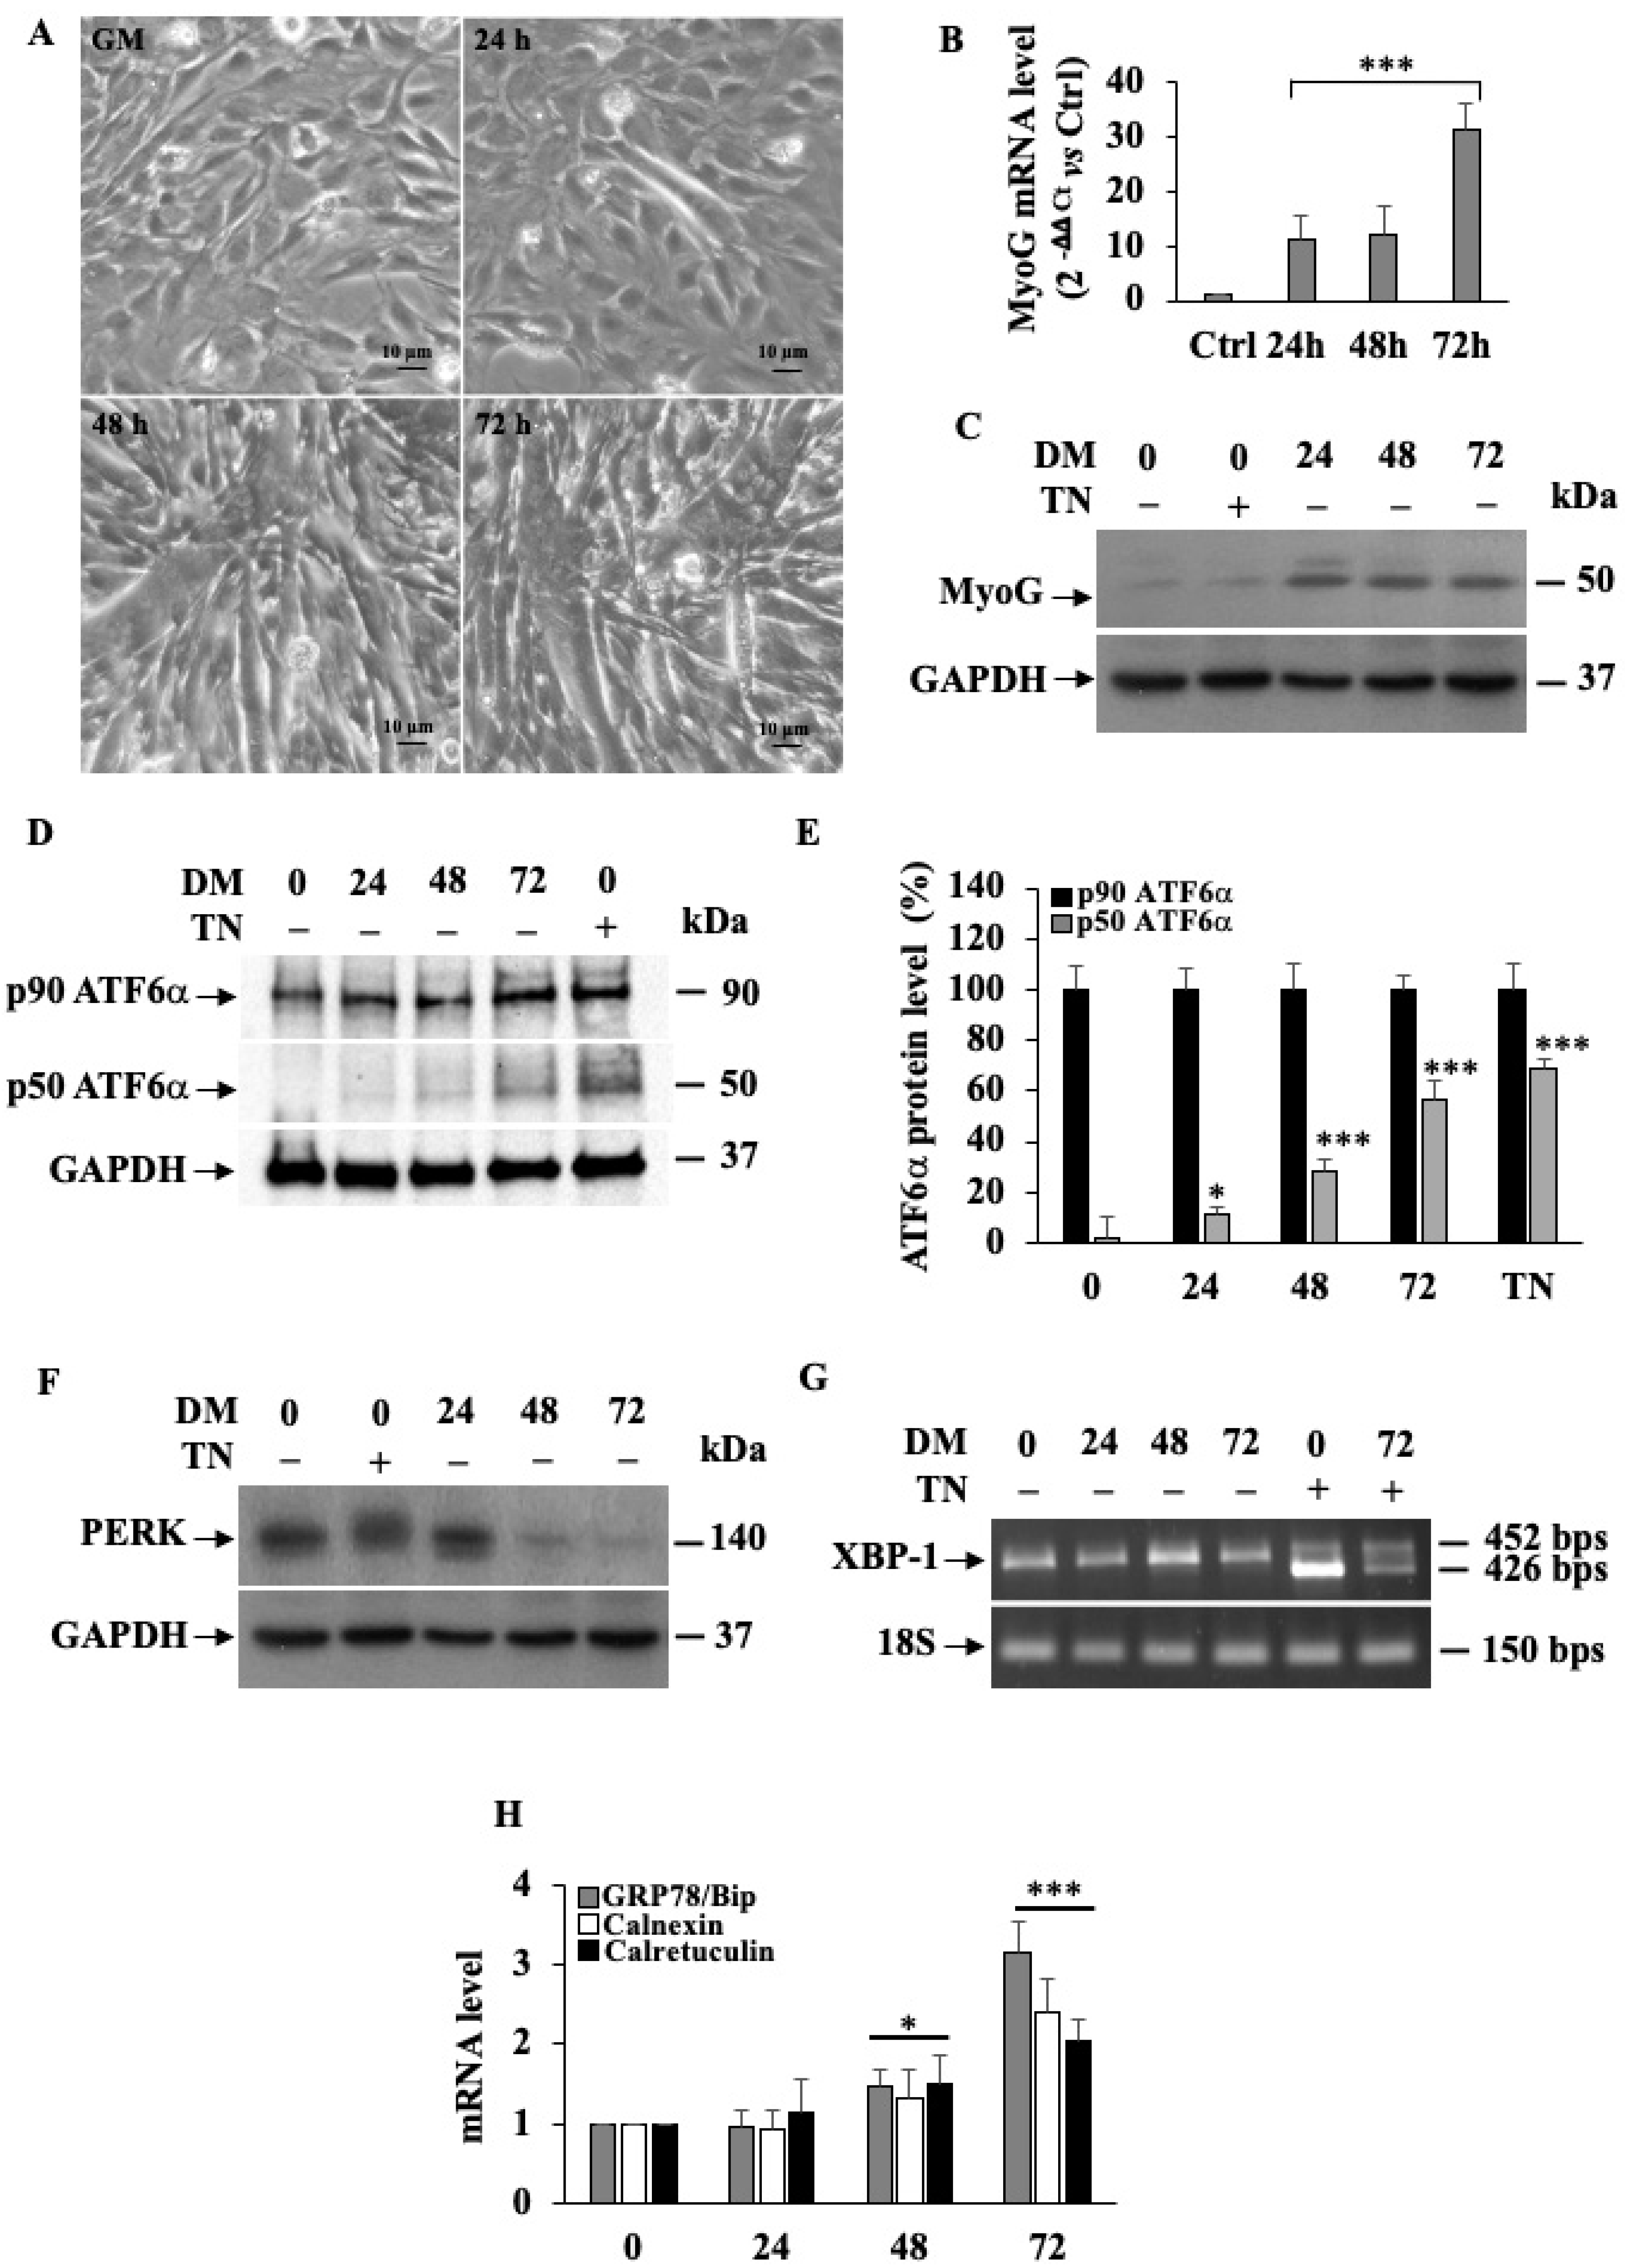
Abstract
:1. Introduction
2. Materials and Methods
2.1. Cell Culture and Treatments
2.2. Genetic Ablation of the ATF6α Gene and Isolation of Knock out ATF6α C2C12 Myoblasts
2.3. Construction of T166A and S130A ATF6α Mutants
2.4. Western Blotting Analysis
2.5. RNA Extraction, Reverse Transcription (RT), XBPI Splicing Assay and Quantitative Real-Time Polymerase Chain Reaction (qPCR)
2.6. Phase-Contrast and Confocal Microscopy
2.7. Evaluation of Apoptosis and Cell Cycle
2.8. Statistical Analysis
3. Results
3.1. ATF6α Is the Only UPR Pathway Activated in Differentiating Mouse C2C12 Myoblasts
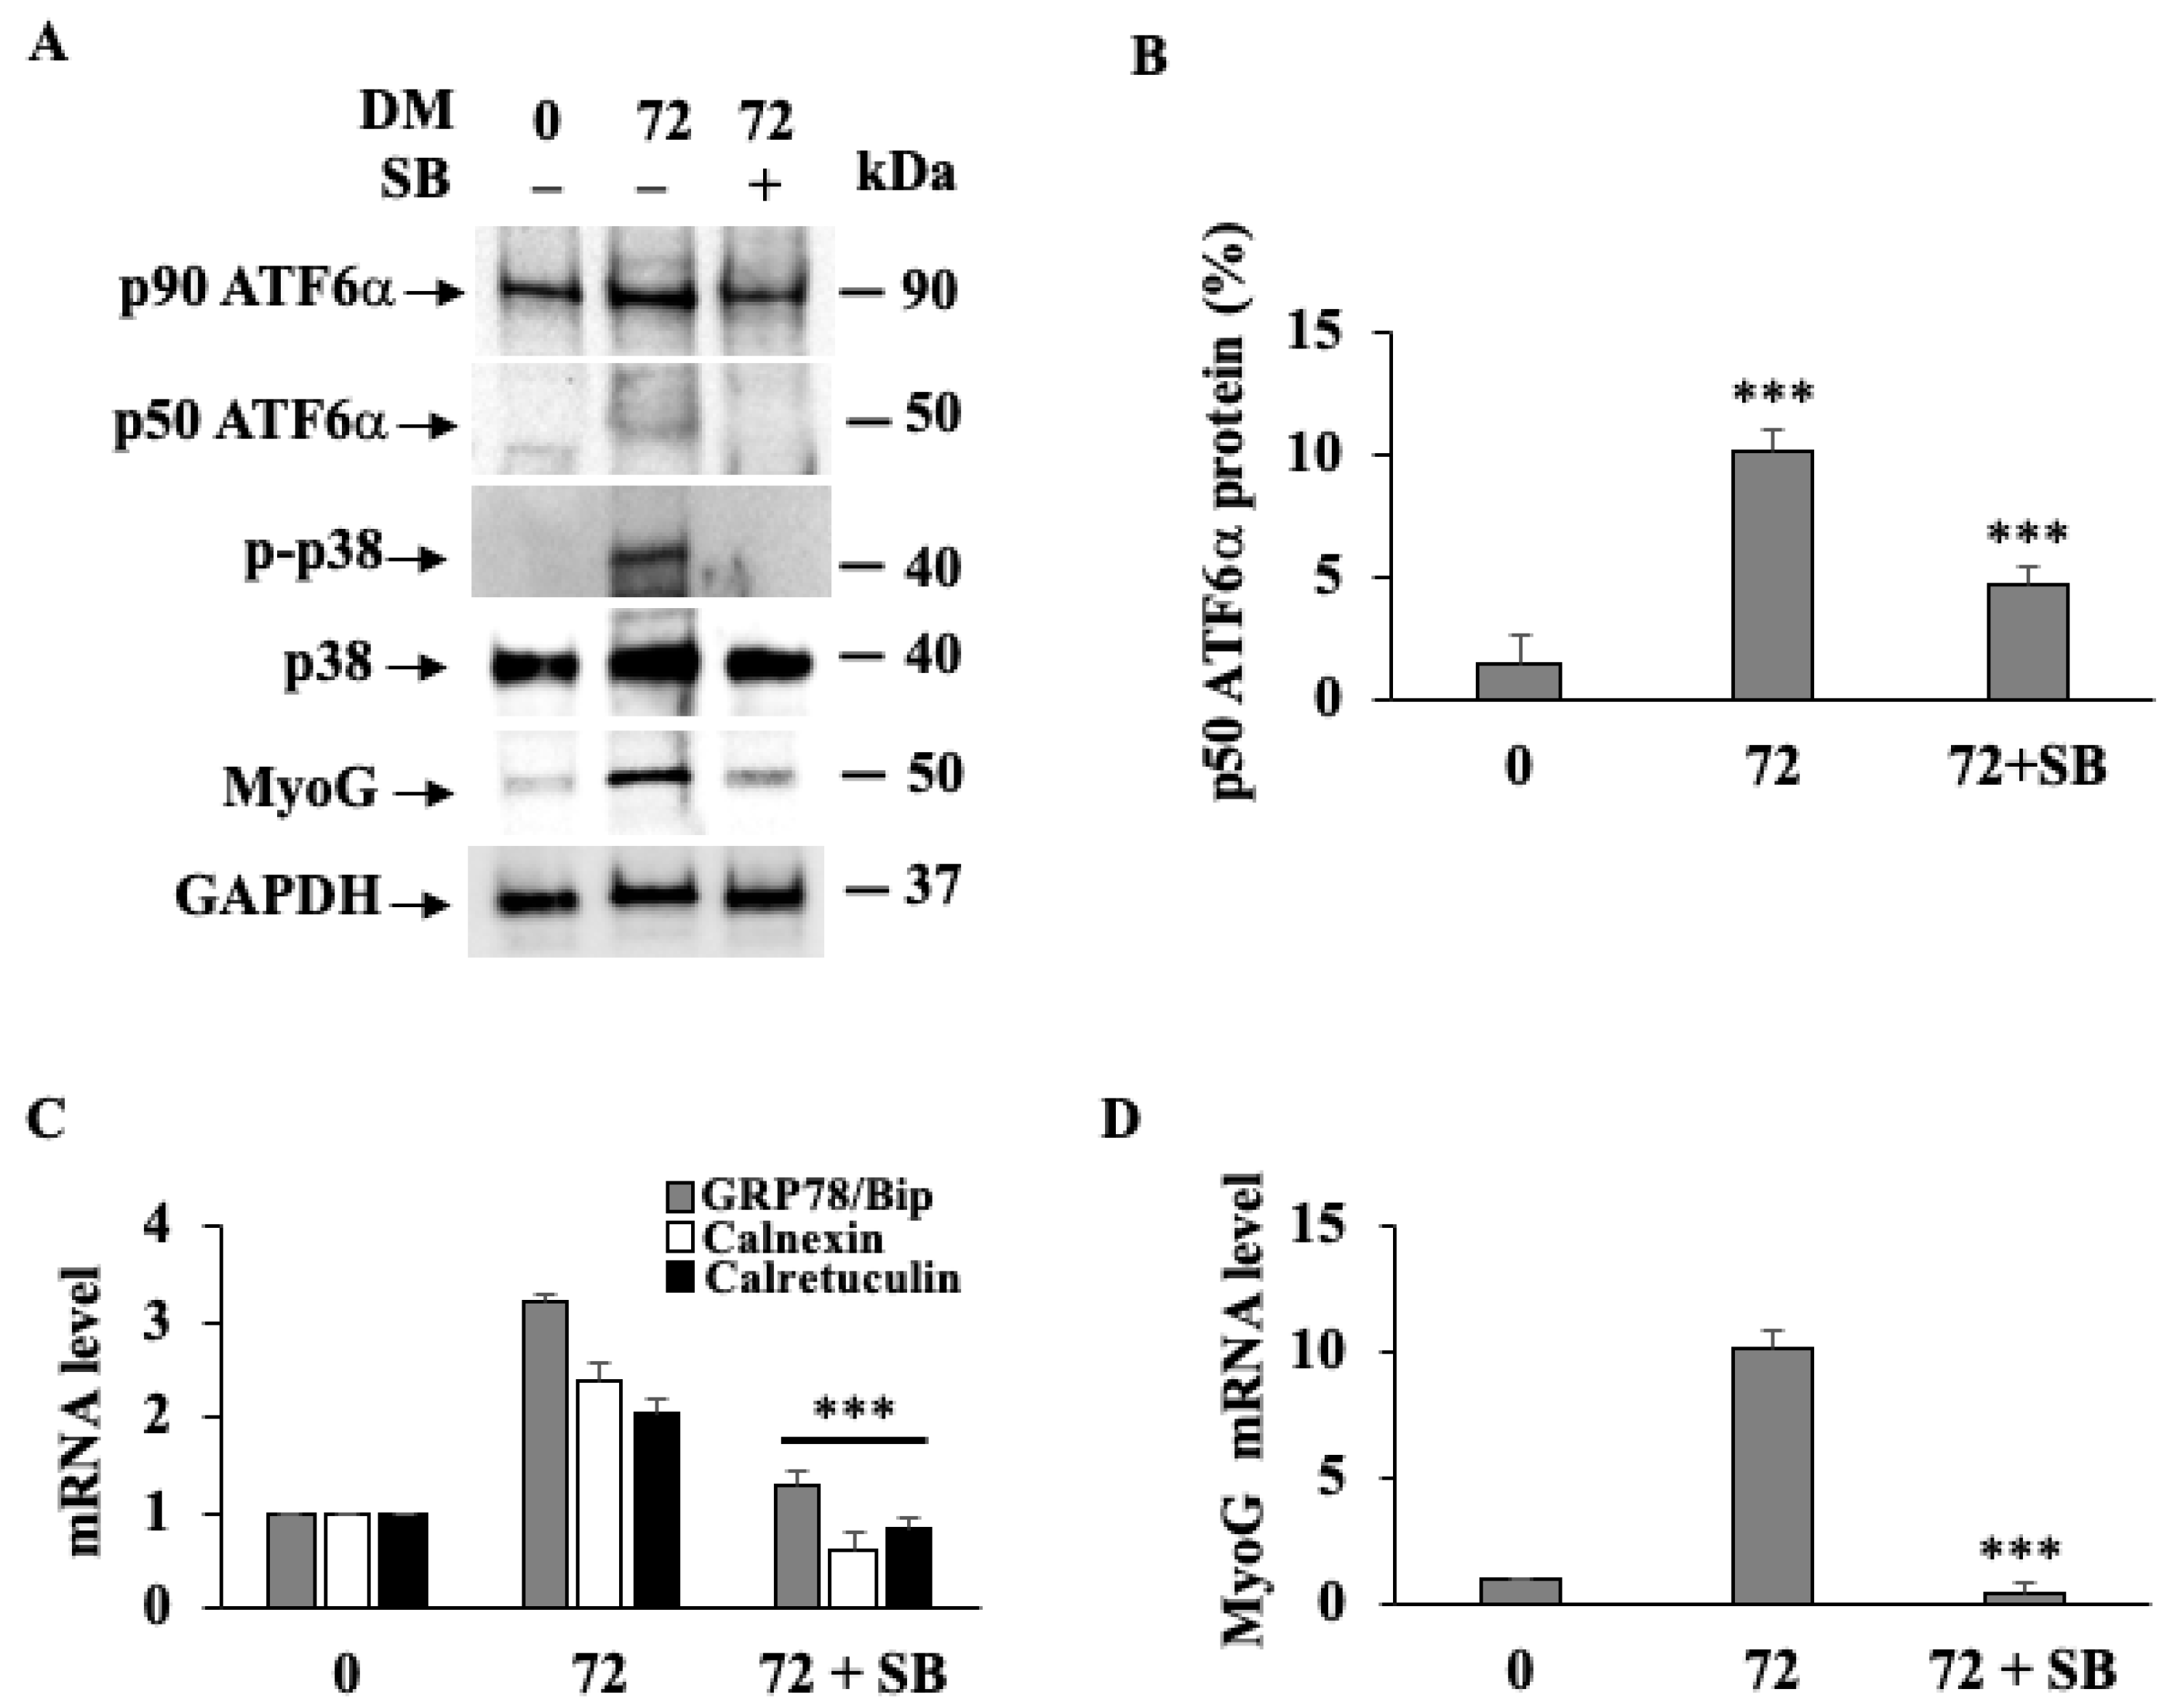
3.2. p38 MAPK Phosphorylation Drives Activation of ATF6α during Myogenesis
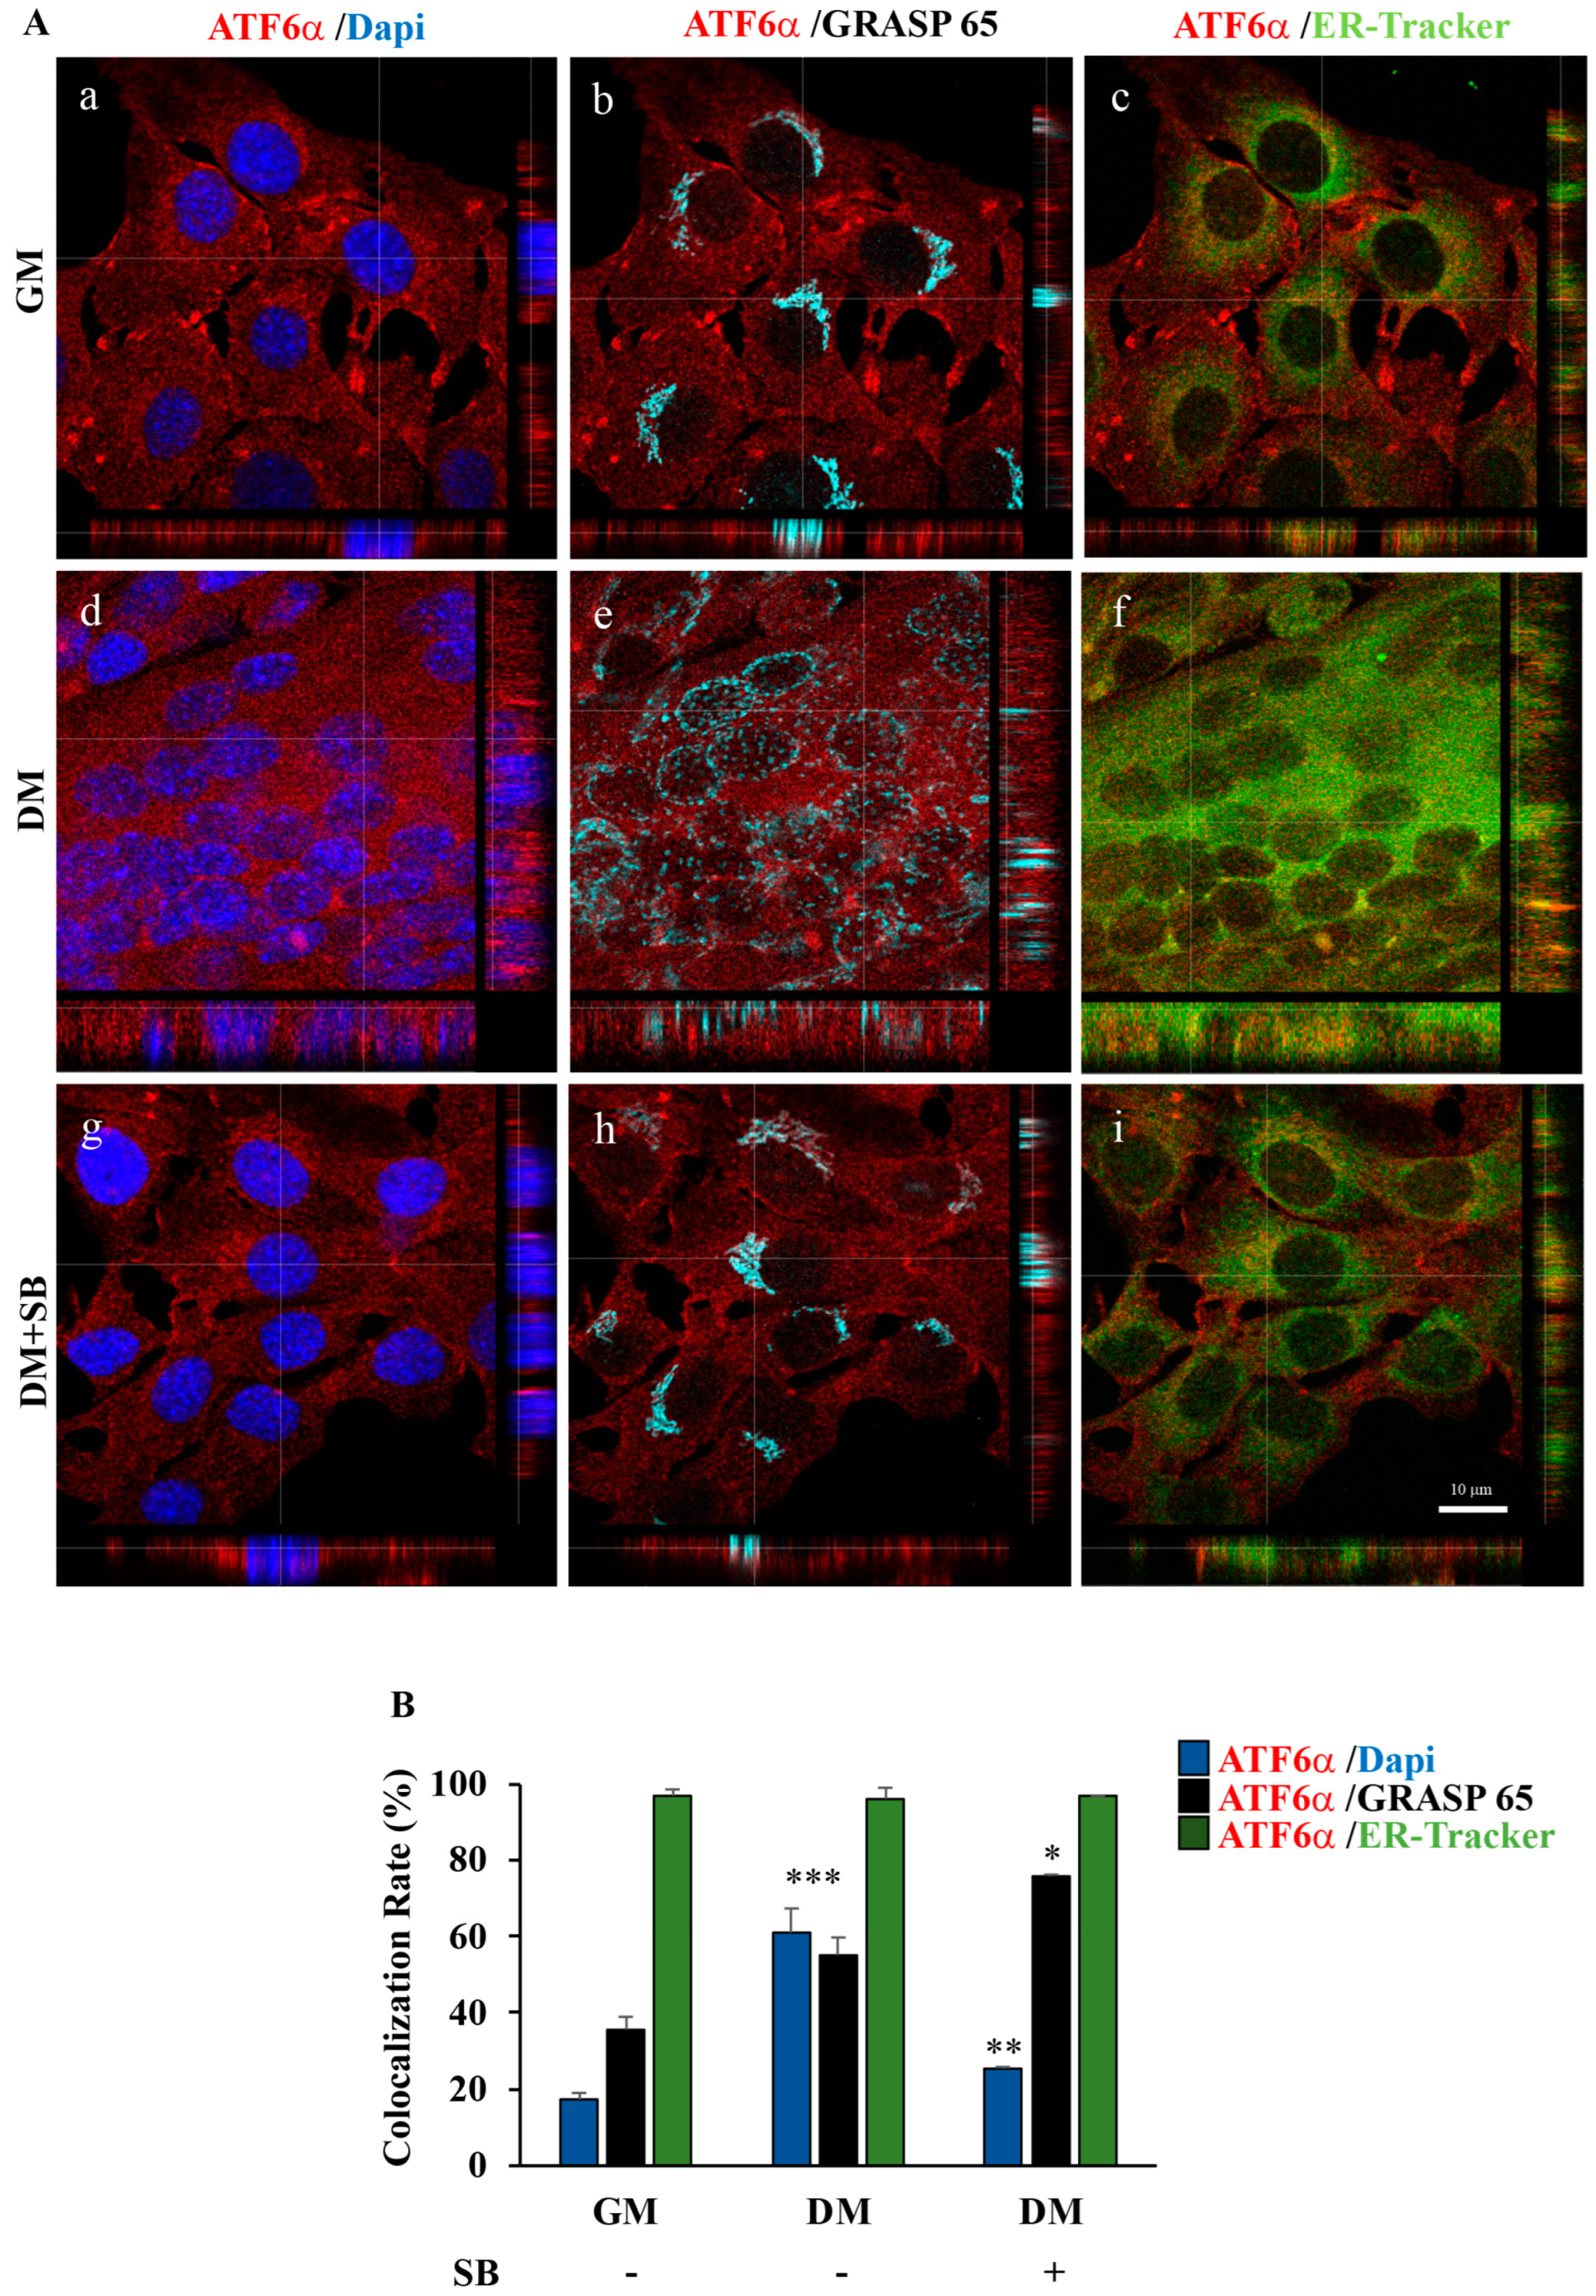
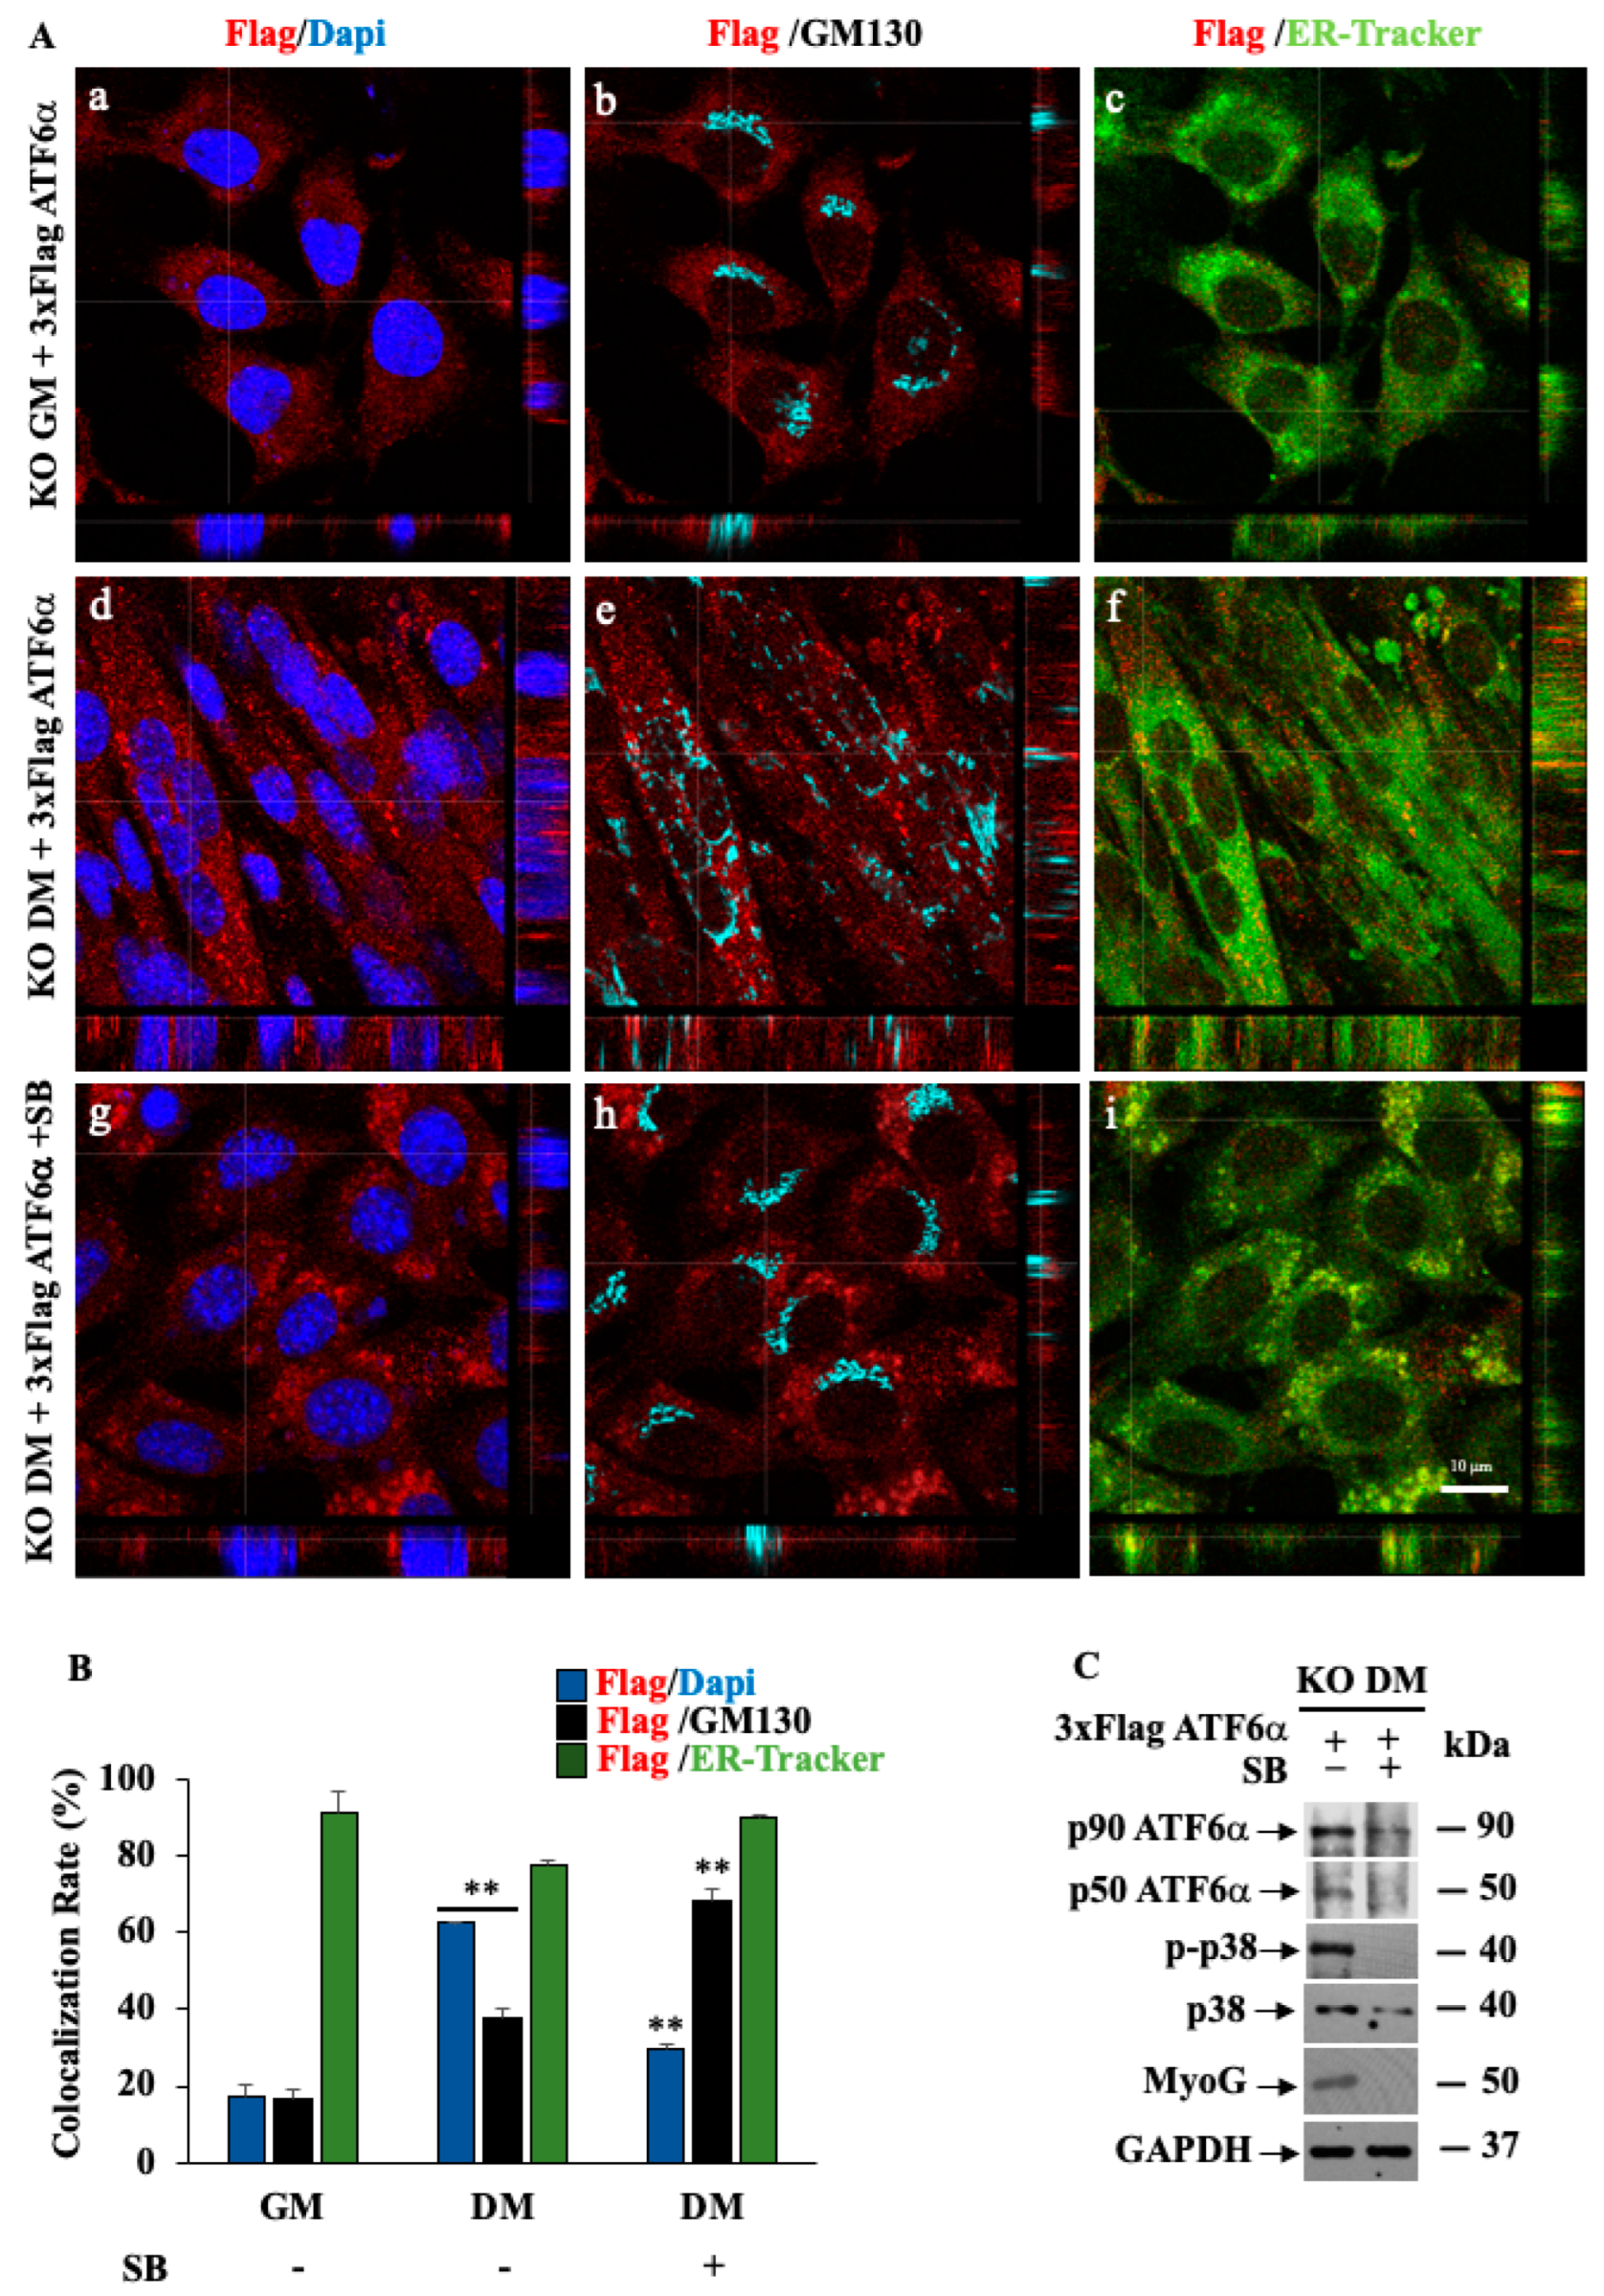
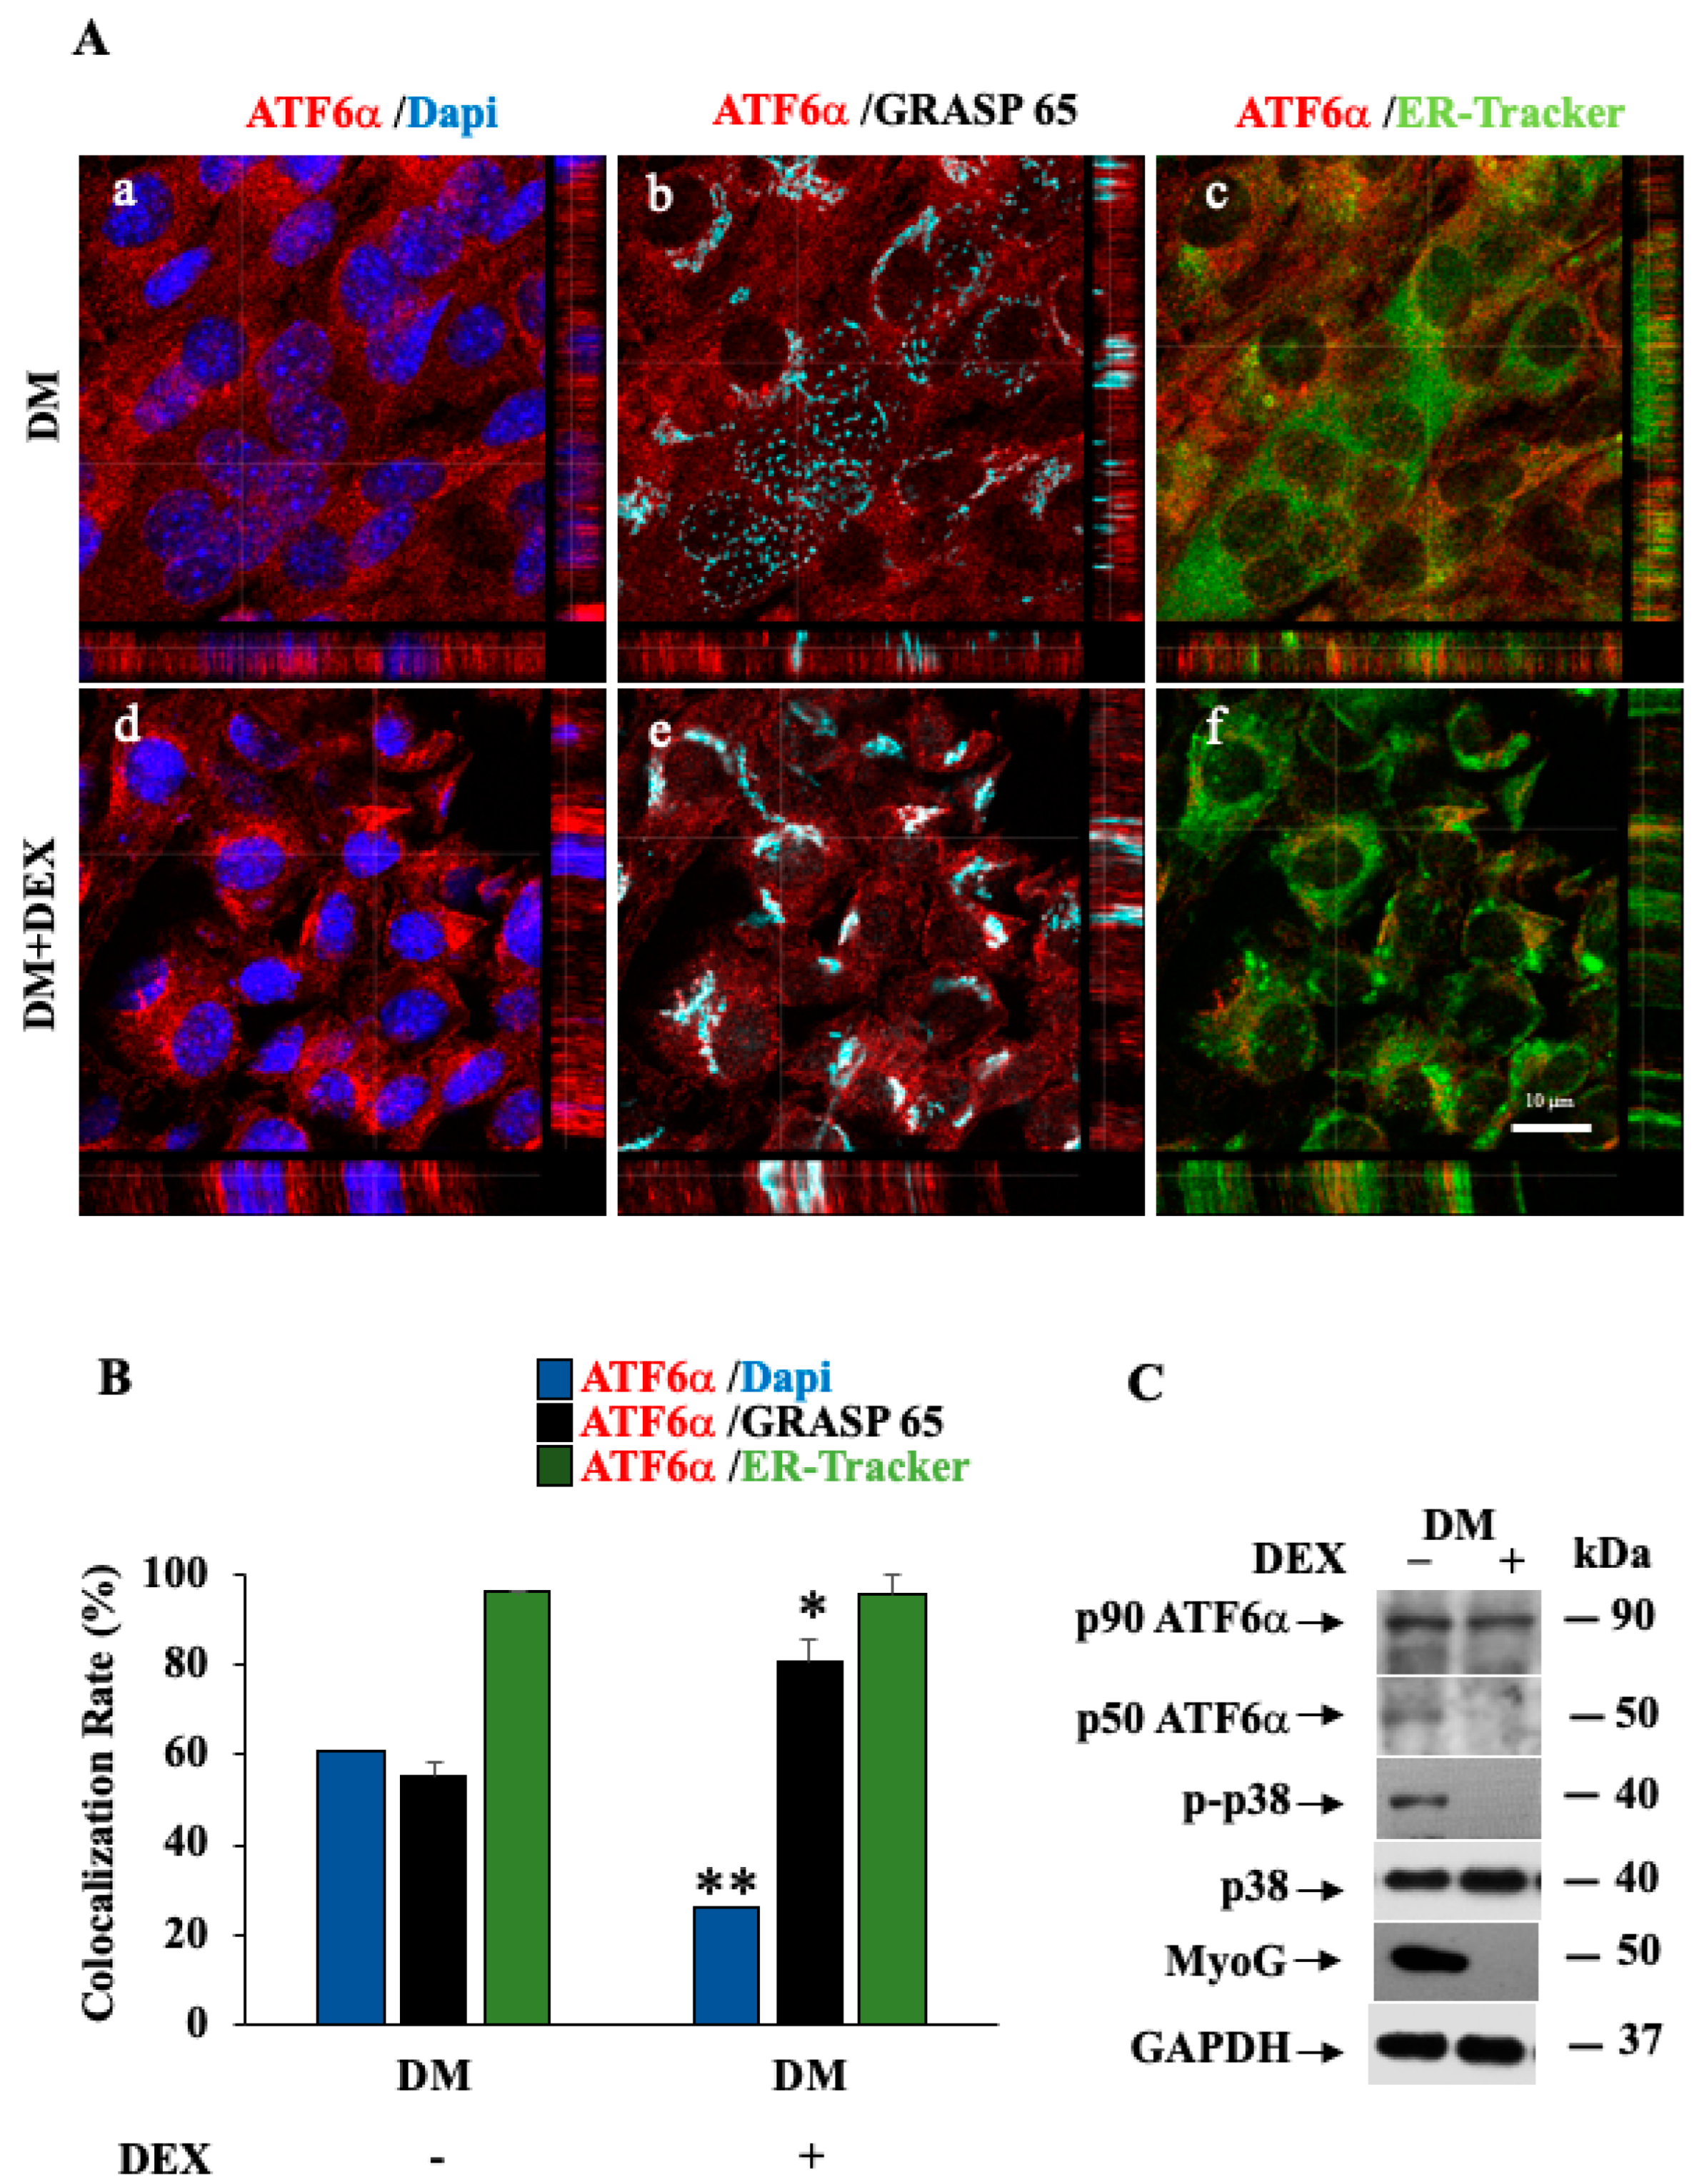
3.3. Inhibition of p38 MAPK by SB203580 Influences Morphology of the Secretory Pathway and the Intracellular Trafficking of the Endogenous ATF6α Protein
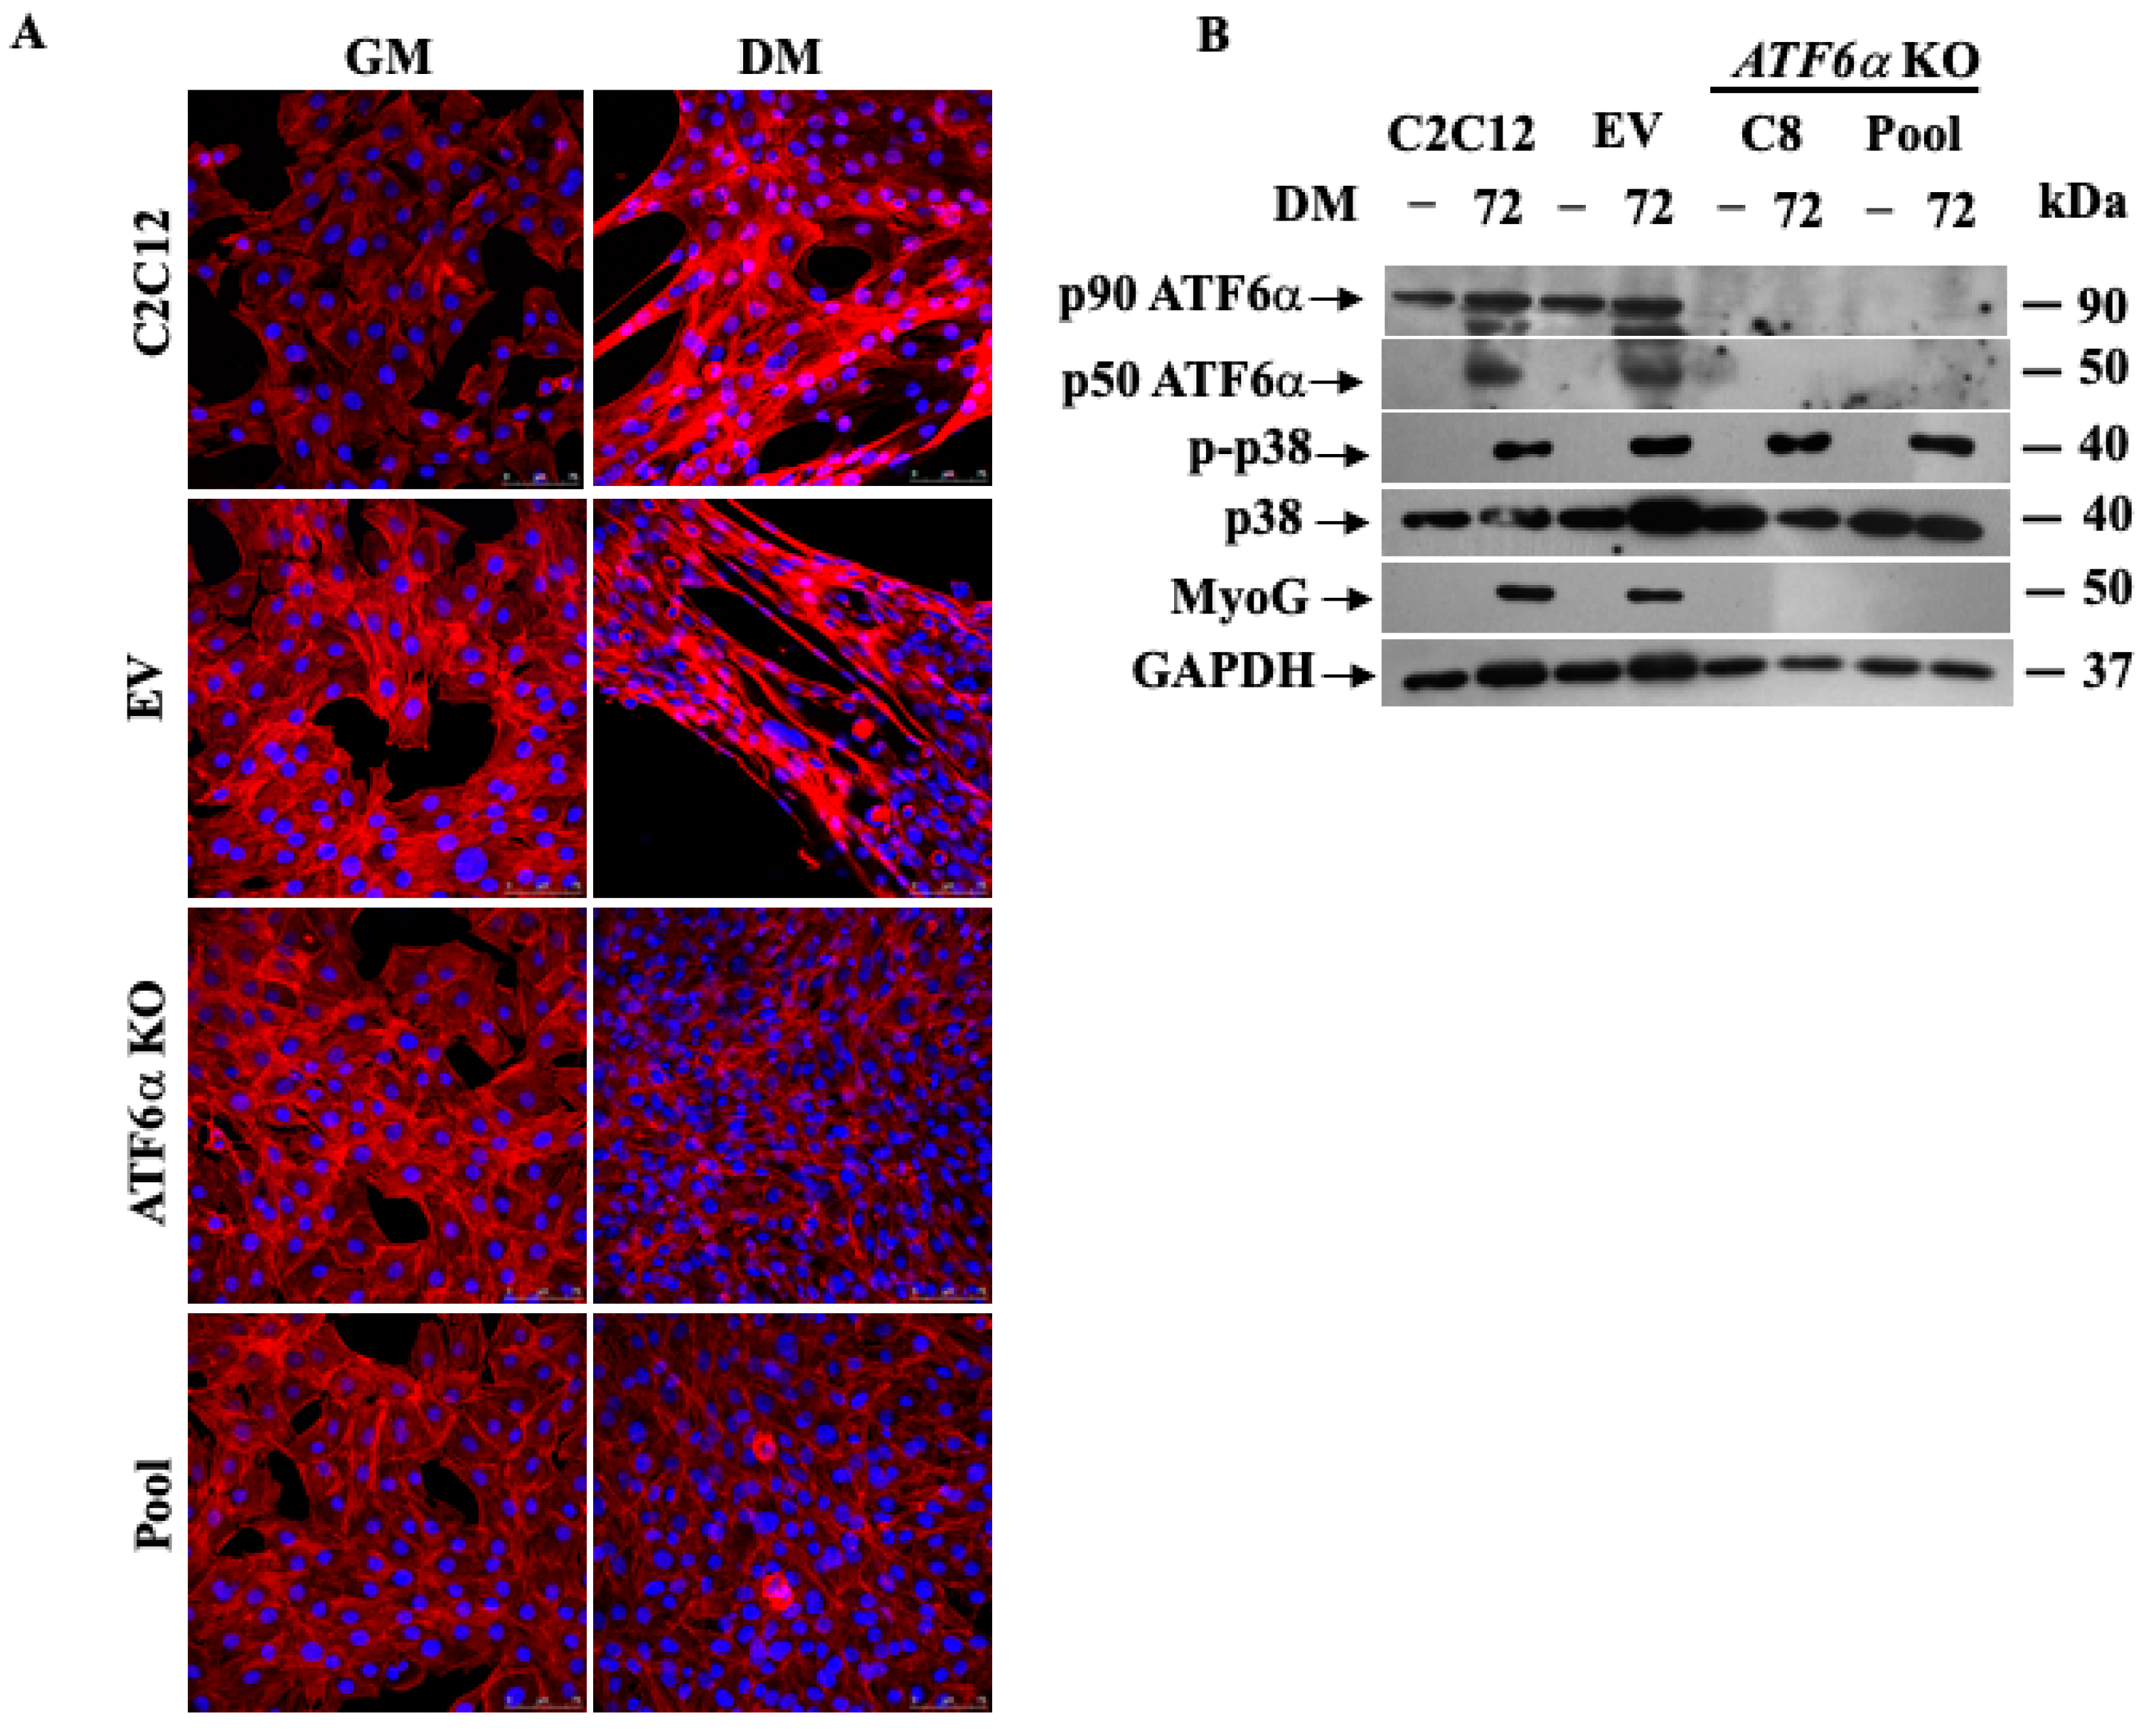
3.4. Genetic Ablation of ATF6α Impairs Myogenesis of C2C12 Myoblasts
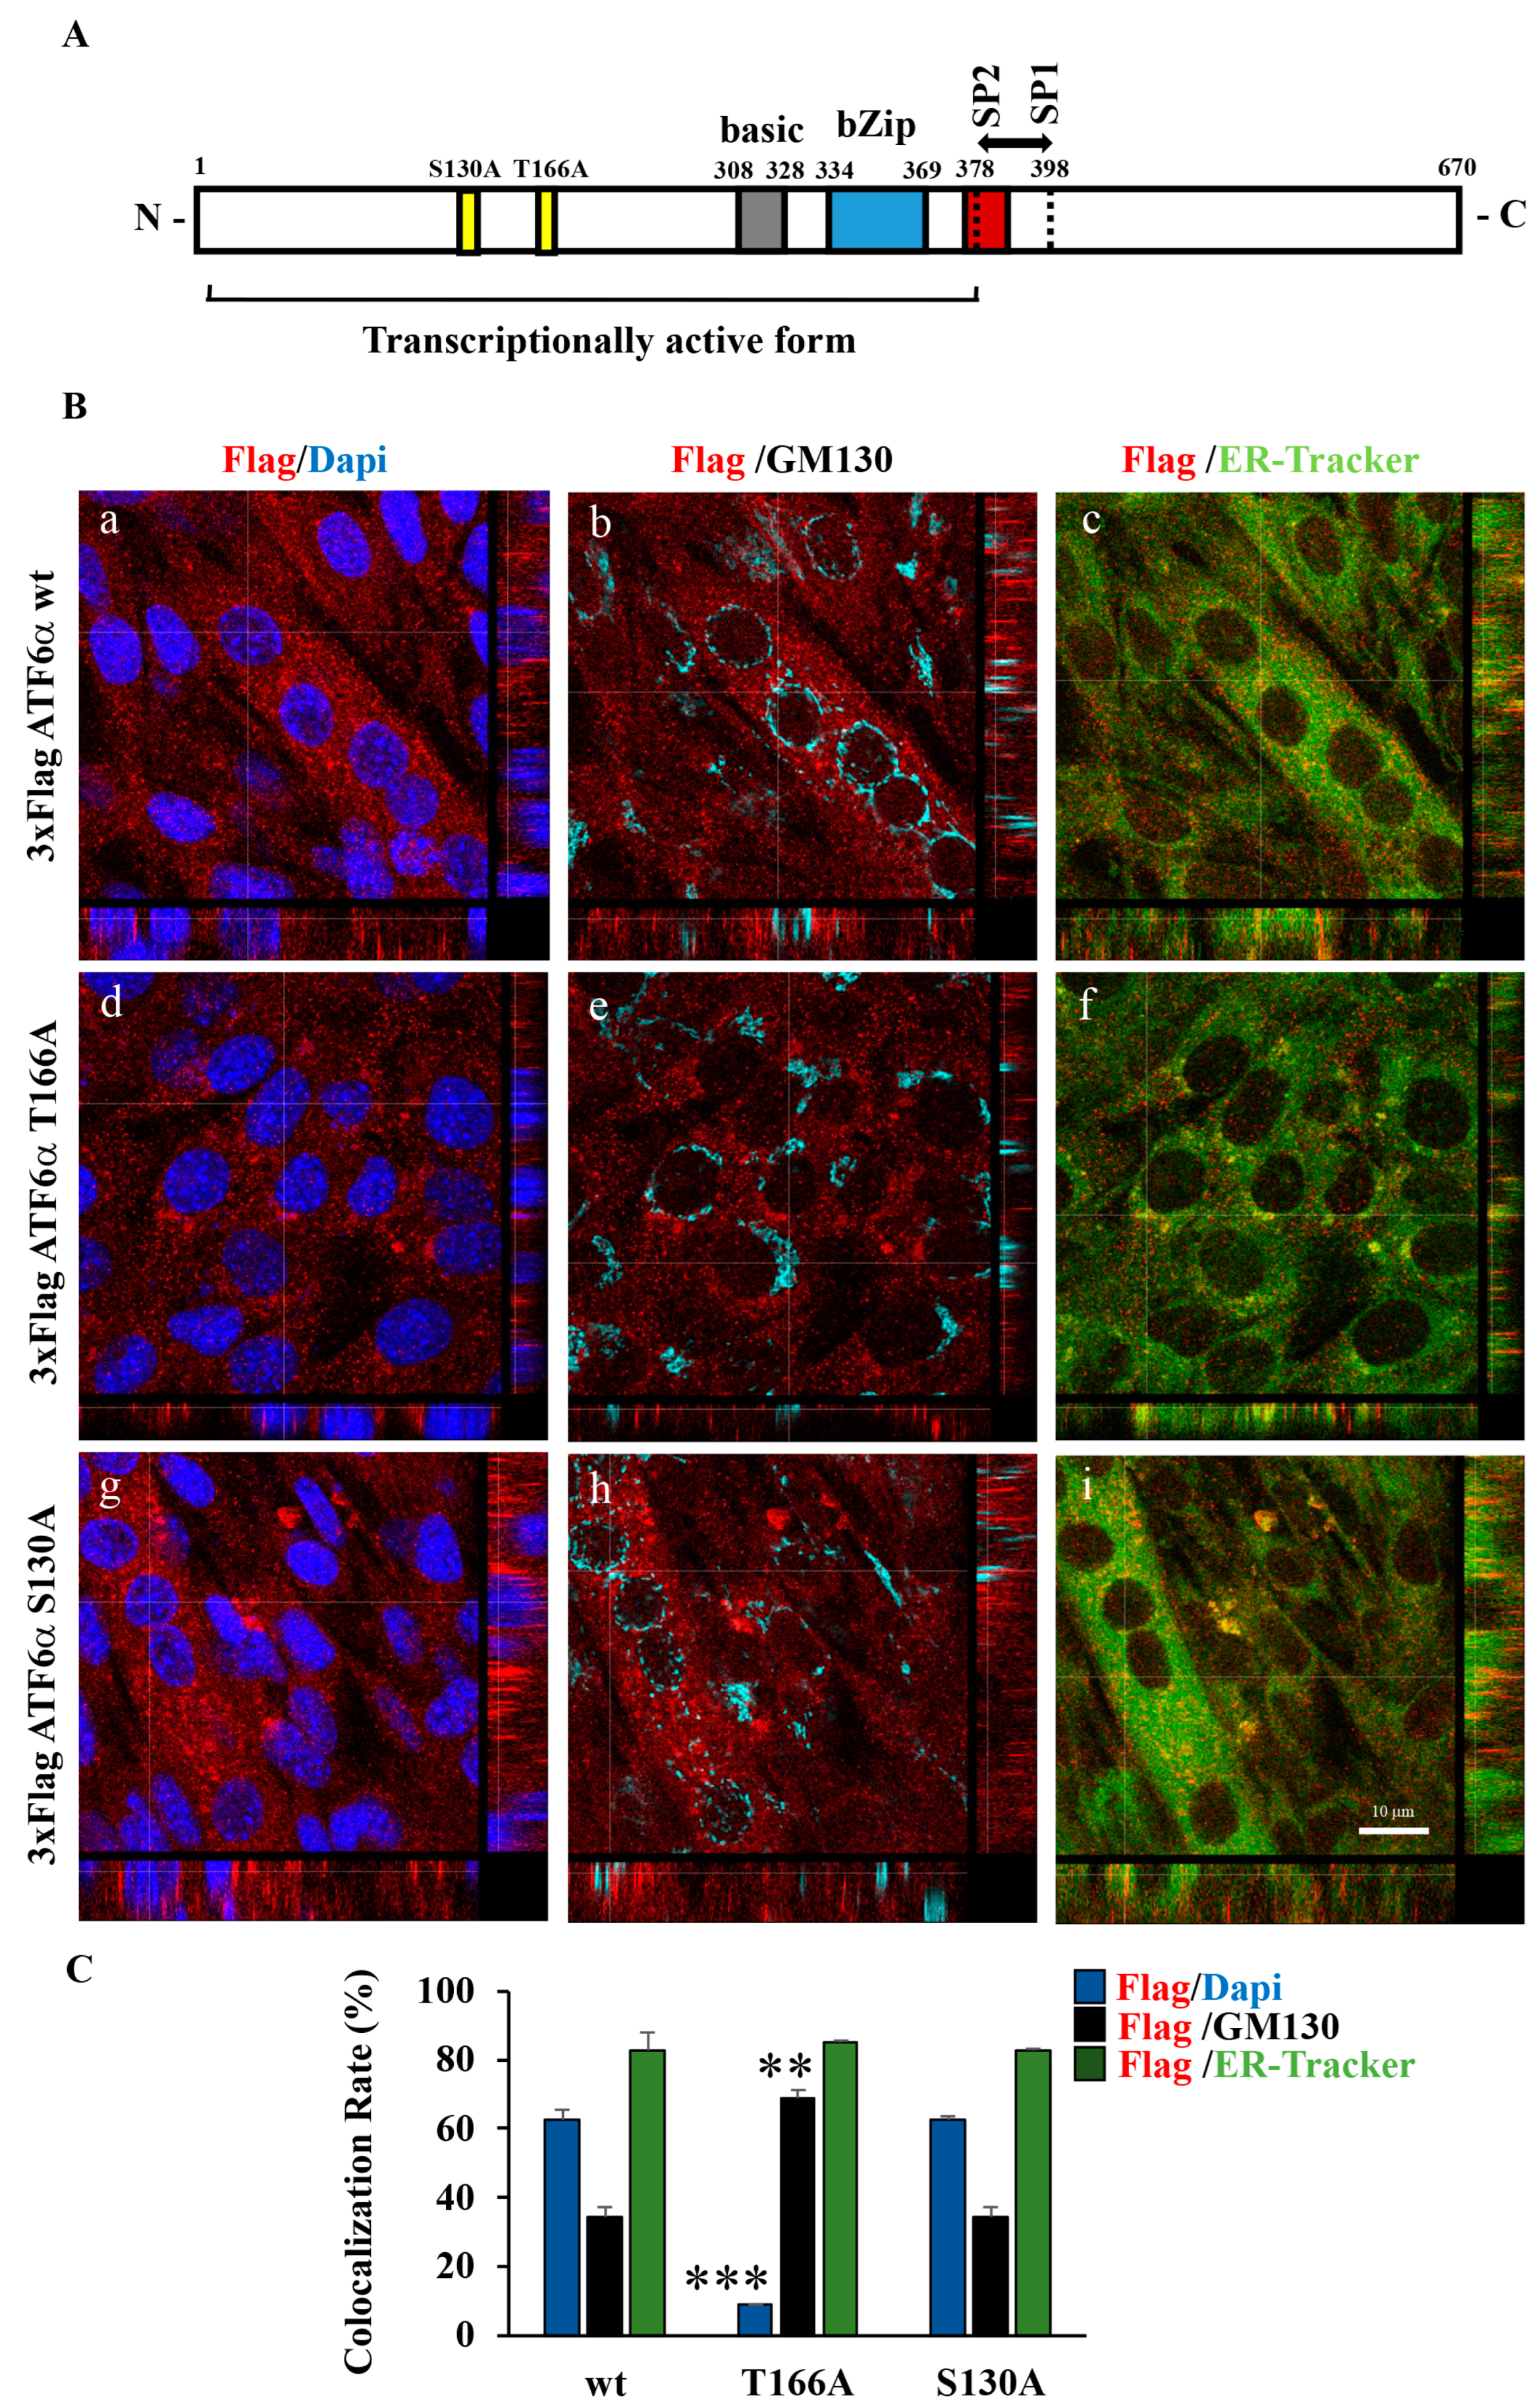
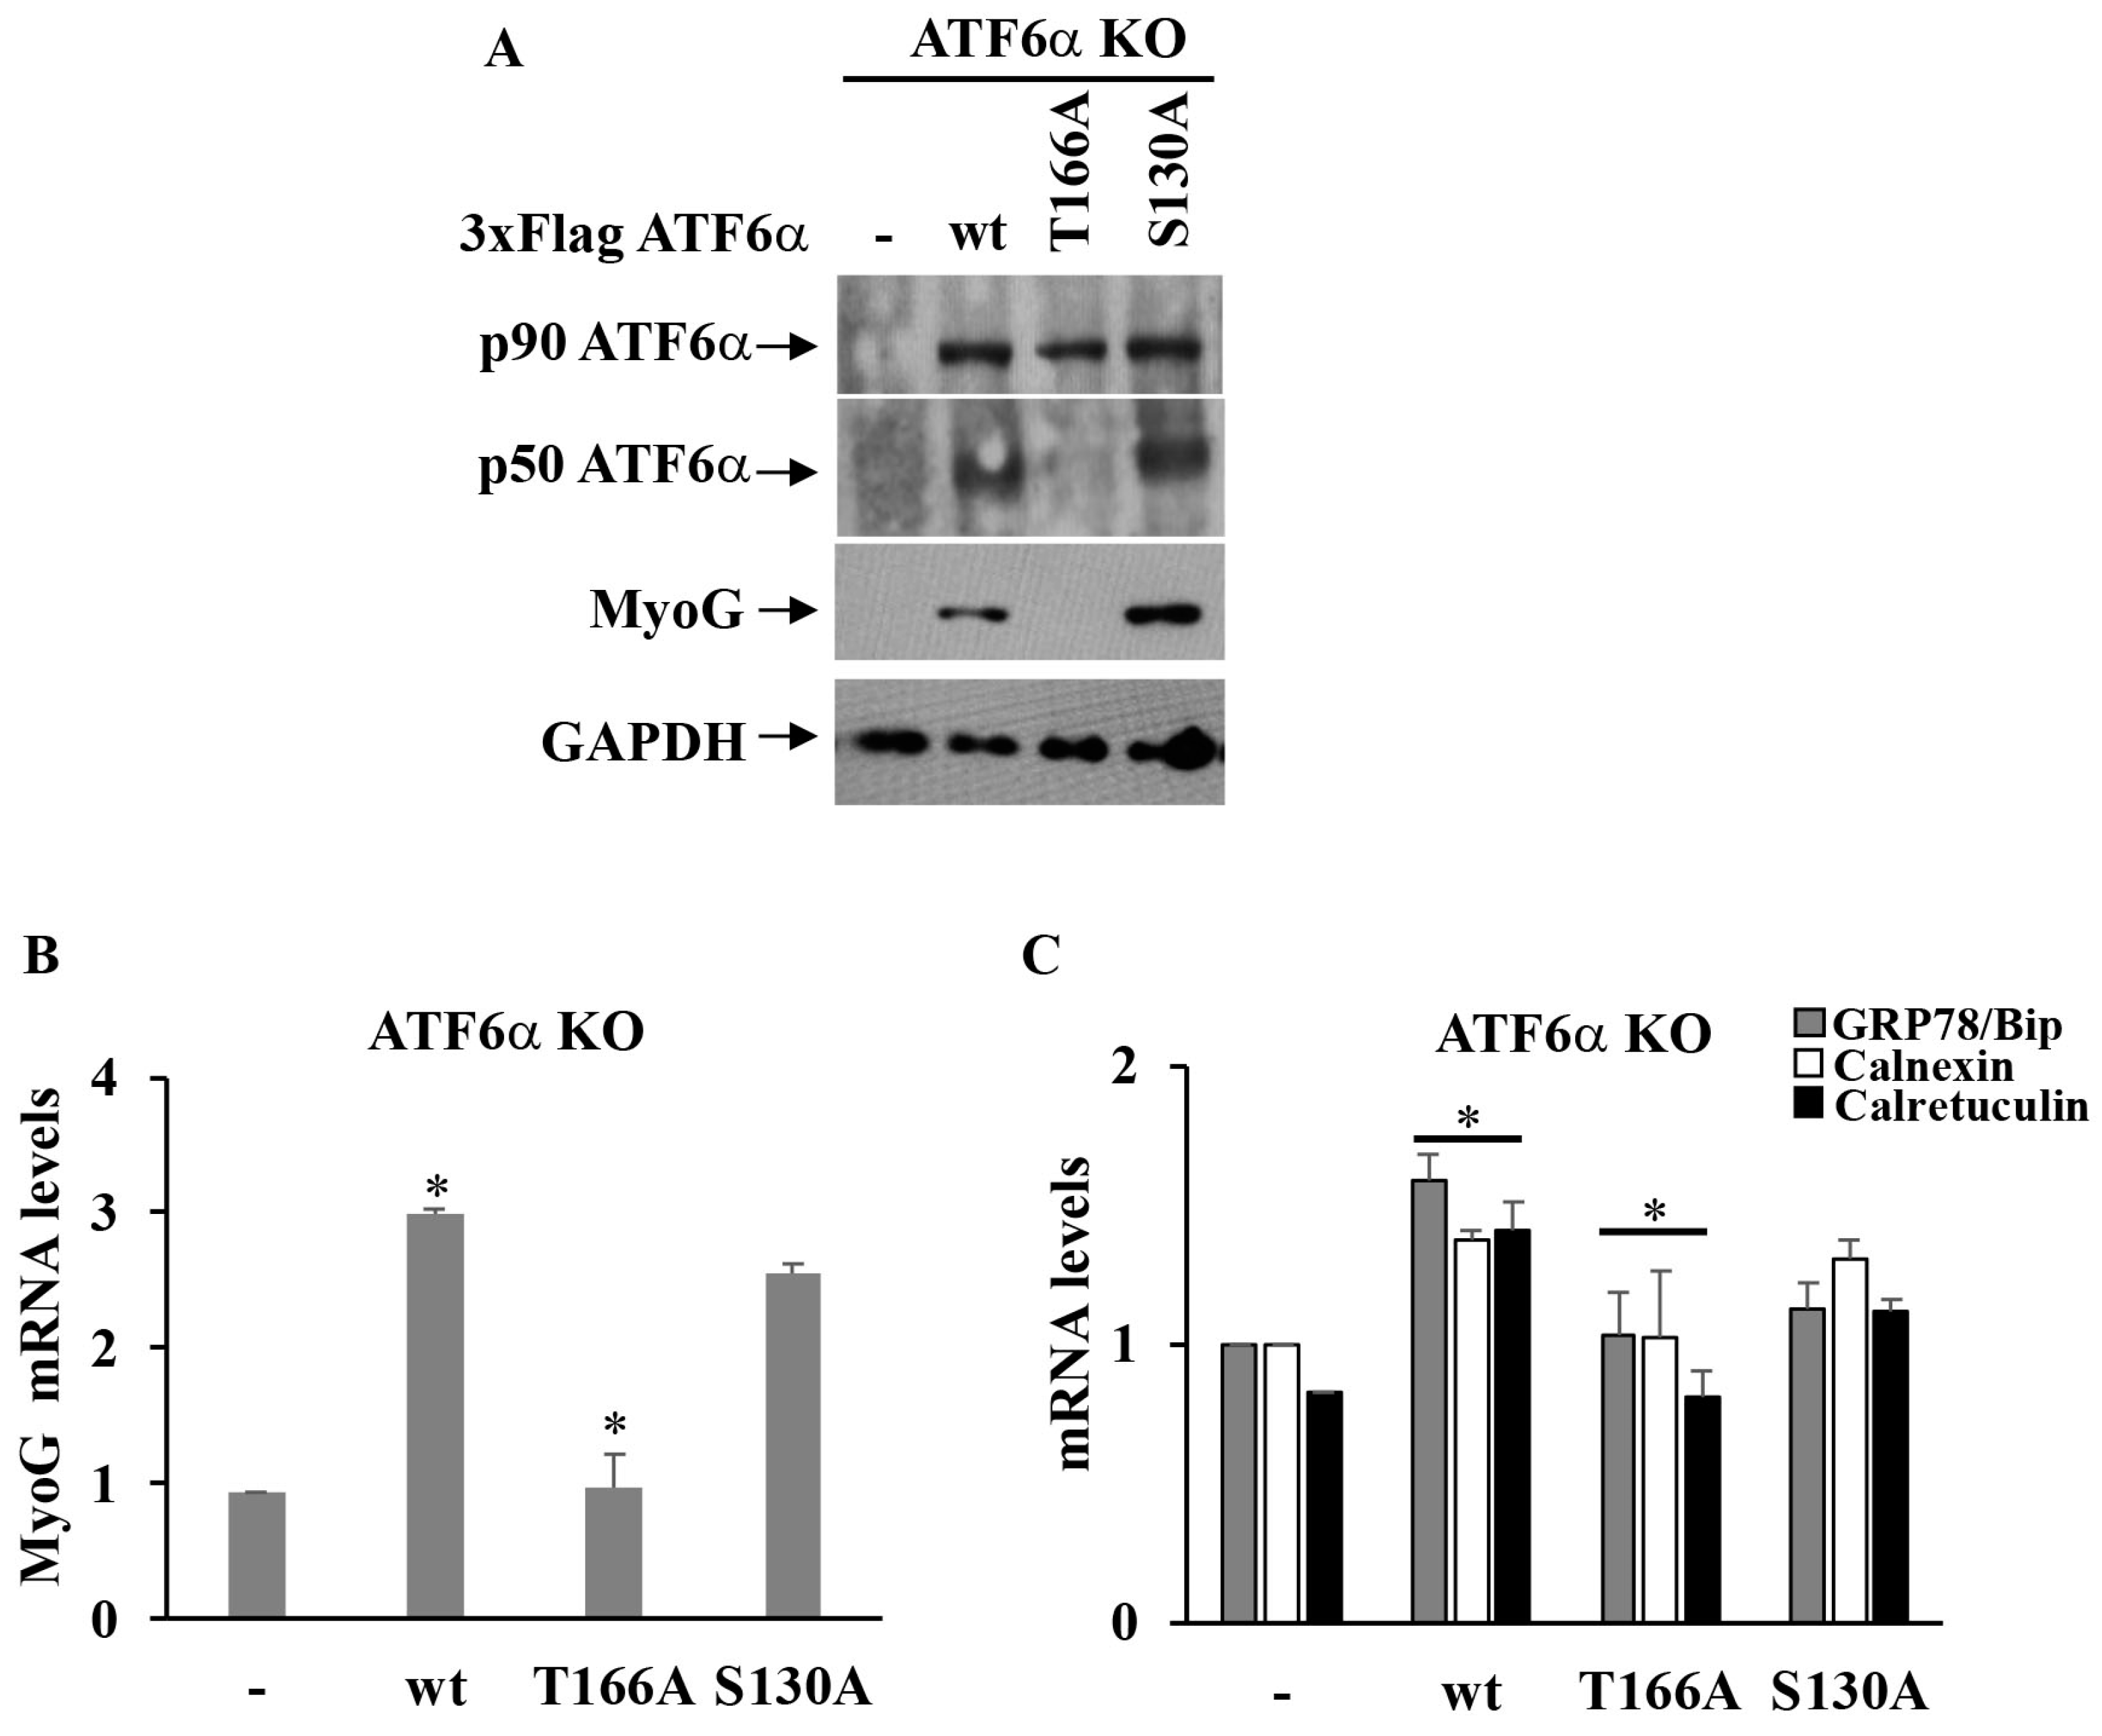
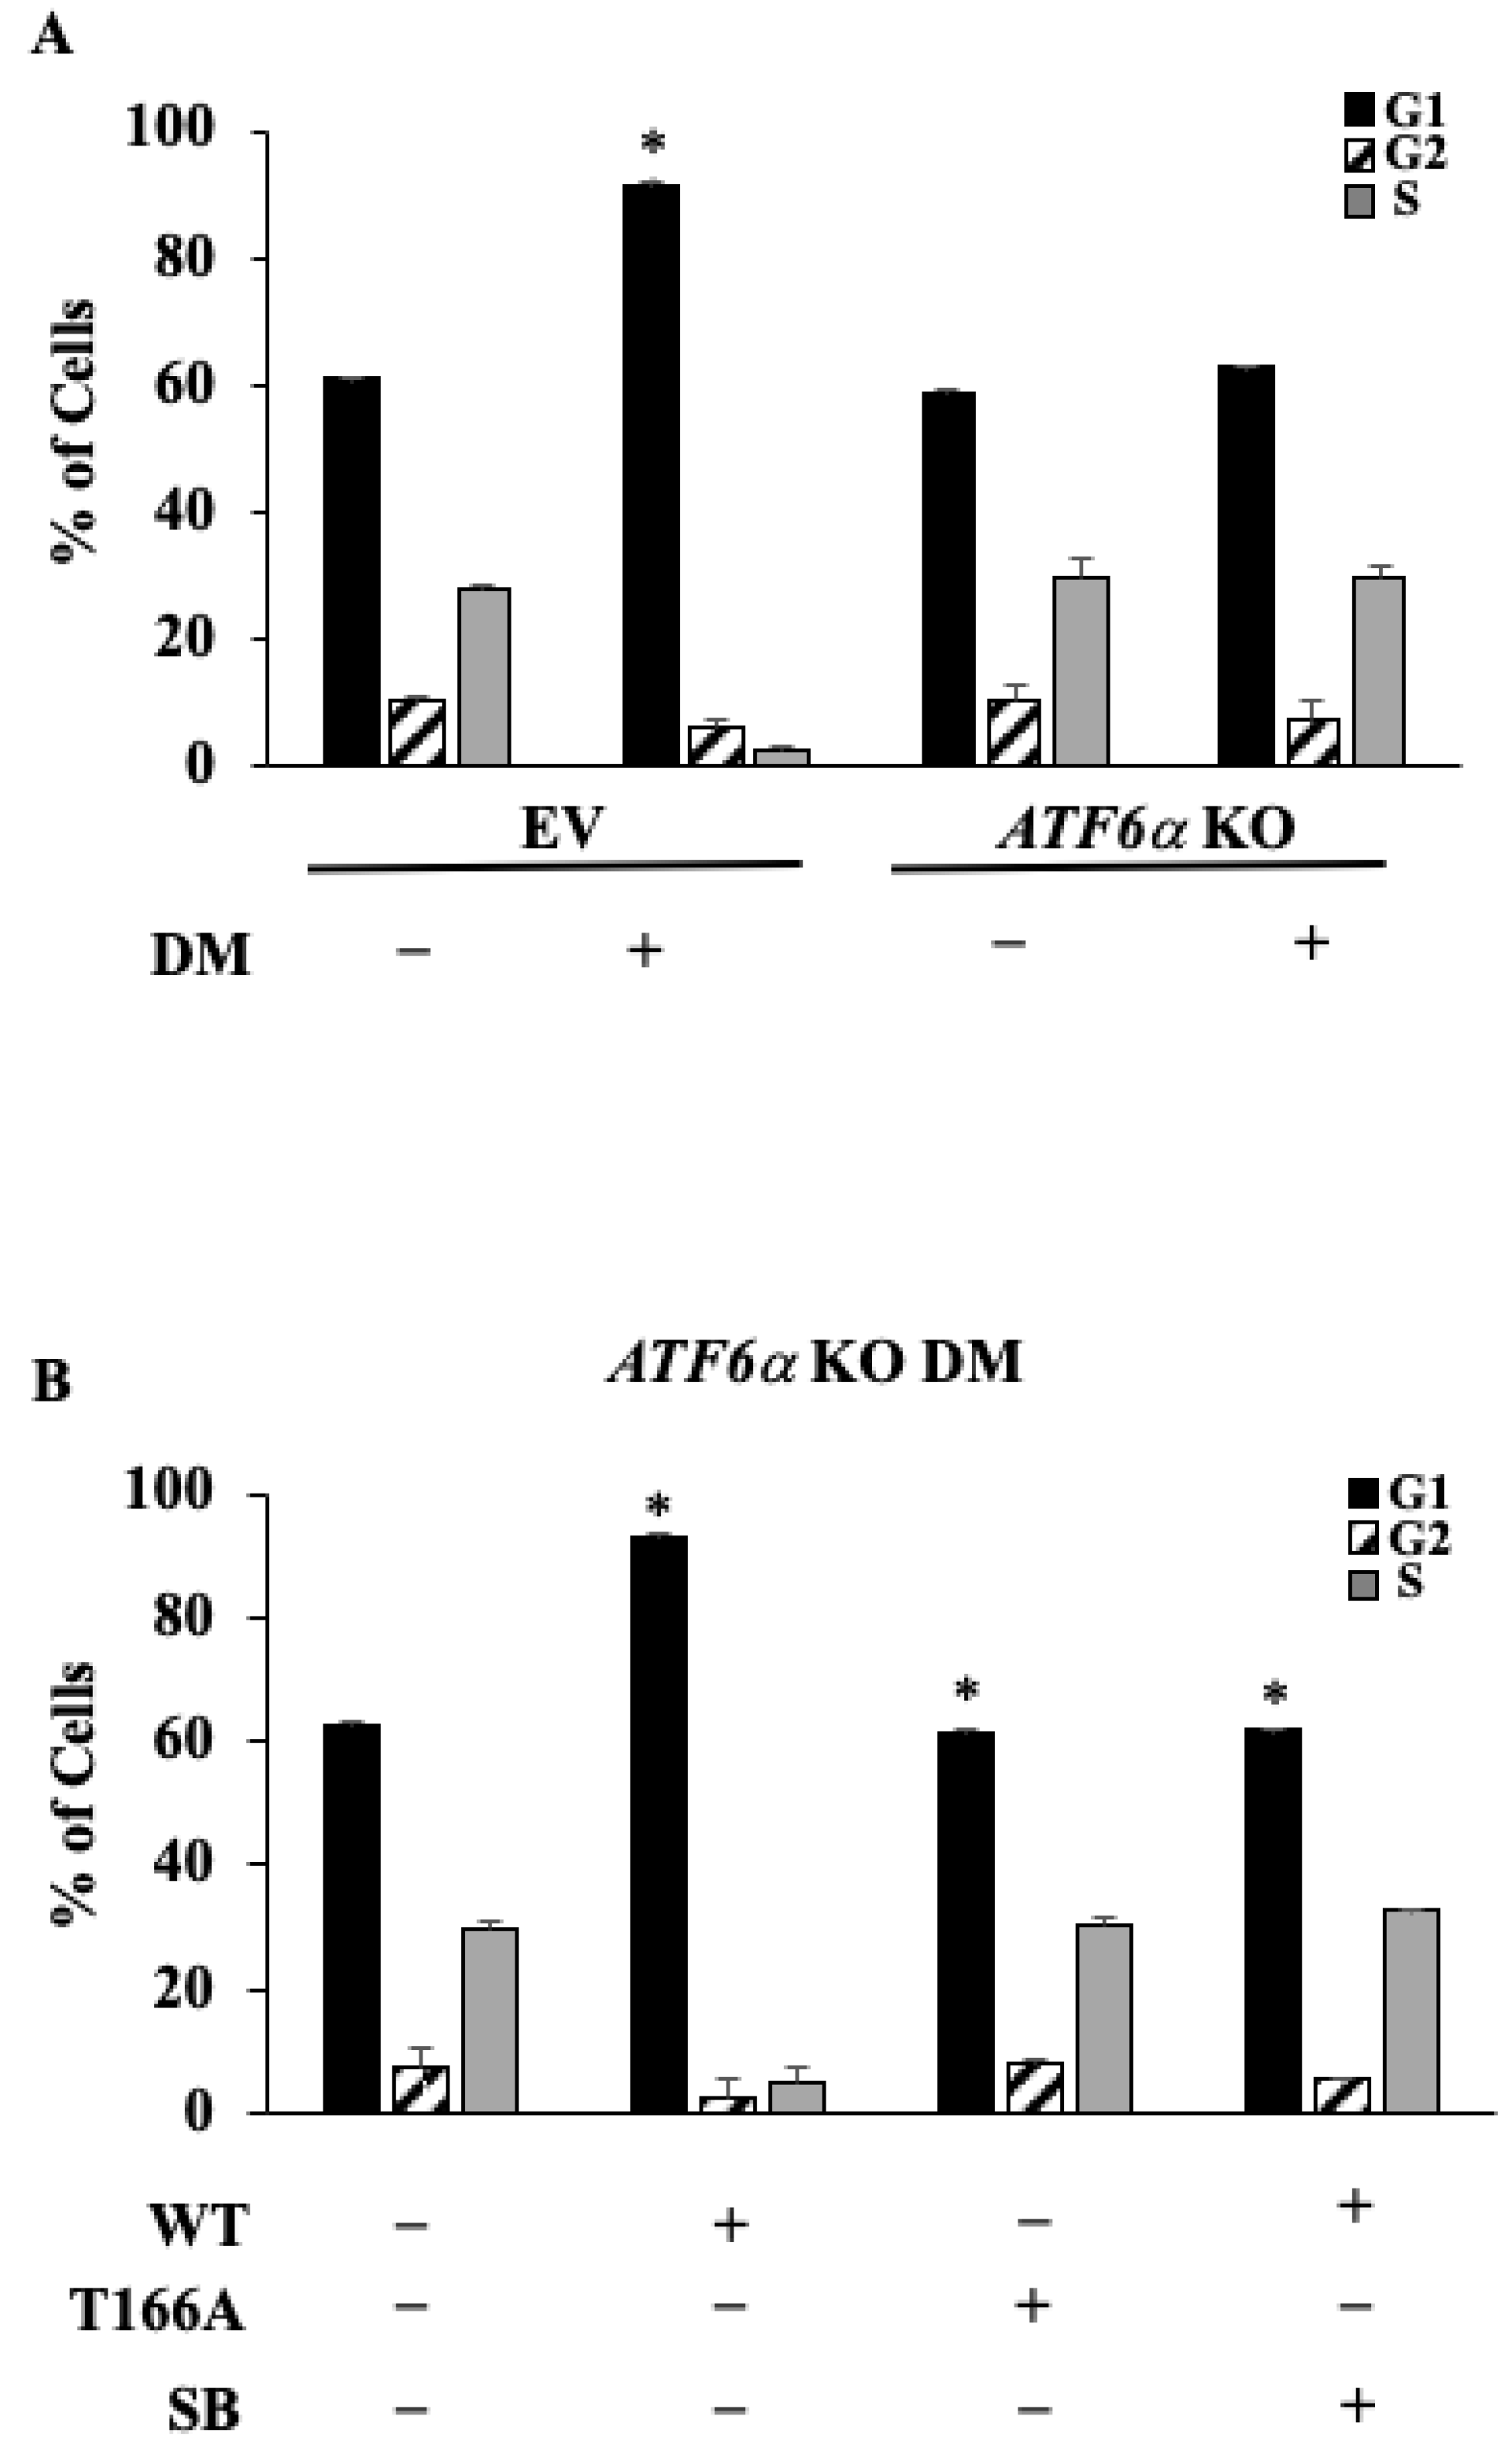
3.5. Myogenesis of C2C12 Requires Phosphorylation by P38 MAPK at the T166 Site of ATF6α
3.6. ATF6α Is Necessary for Cell Cycle Control during Myoblast Differentiation
3.7. p38 MAPK/ATF6α Pathway Regulates Dexamethasone-Induced Myotube Inhibition
4. Discussion
5. Conclusions
Supplementary Materials
Author Contributions
Funding
Informed Consent Statement
Data Availability Statement
Conflicts of Interest
References
- Rossi, D.; Barone, V.; Giacomello, E.; Cusimano, V.; Sorrentino, V. The sarcoplasmic reticulum: An organized patchwork of specialized domains. Traffic 2008, 9, 1044–1049. [Google Scholar] [CrossRef]
- Zito, E.; Ferreiro, A. Calcium and Redox Liaison: A Key Role of Selenoprotein N in Skeletal Muscle. Cells 2021, 10, 1116. [Google Scholar] [CrossRef]
- Wang, M.; Kaufman, R.J. The impact of the endoplasmic reticulum protein-folding environment on cancer development. Nat. Rev. Cancer 2014, 14, 581–597. [Google Scholar] [CrossRef]
- Wu, J.; Kaufman, R.J. From acute ER stress to physiological roles of the Unfolded Protein Response. Cell Death Differ. 2006, 13, 374–384. [Google Scholar] [CrossRef]
- Amodio, G.; Moltedo, O.; Monteleone, F.; D’Ambrosio, C.; Scaloni, A.; Remondelli, P.; Zambrano, N. Proteomic signatures in thapsigargin-treated hepatoma cells. Chem. Res. Toxicol. 2011, 24, 1215–1222. [Google Scholar] [CrossRef]
- Sitia, R.; Braakman, I. Quality control in the endoplasmic reticulum protein factory. Nature 2003, 426, 891–894. [Google Scholar] [CrossRef]
- Kamiya, Y.; Kamiya, D.; Yamamoto, K.; Nyfeler, B.; Hauri, H.P.; Kato, K. Molecular basis of sugar recognition by the human L-type lectins ERGIC-53, VIPL, and VIP36. J. Biol. Chem. 2008, 283, 1857–1861. [Google Scholar] [CrossRef]
- Dancourt, J.; Barlowe, C. Protein sorting receptors in the early secretory pathway. Annu. Rev. Biochem. 2010, 79, 777–802. [Google Scholar] [CrossRef]
- Amodio, G.; Pagliara, V.; Moltedo, O.; Remondelli, P. Structural and Functional Significance of the Endoplasmic Reticulum Unfolded Protein Response Transducers and Chaperones at the Mitochondria-ER Contacts: A Cancer Perspective. Front. Cell Dev. Biol. 2021, 9, 641194. [Google Scholar] [CrossRef]
- Schroder, M.; Kaufman, R.J. ER stress and the unfolded protein response. Mutat. Res. 2005, 569, 29–63. [Google Scholar] [CrossRef]
- Ogata, M.; Hino, S.; Saito, A.; Morikawa, K.; Kondo, S.; Kanemoto, S.; Murakami, T.; Taniguchi, M.; Tanii, I.; Yoshinaga, K.; et al. Autophagy is activated for cell survival after endoplasmic reticulum stress. Mol. Cell. Biol. 2006, 26, 9220–9231. [Google Scholar] [CrossRef]
- Fujita, E.; Kouroku, Y.; Isoai, A.; Kumagai, H.; Misutani, A.; Matsuda, C.; Hayashi, Y.K.; Momoi, T. Two endoplasmic reticulum-associated degradation (ERAD) systems for the novel variant of the mutant dysferlin: Ubiquitin/proteasome ERAD(I) and autophagy/lysosome ERAD(II). Hum. Mol. Genet. 2007, 16, 618–629. [Google Scholar] [CrossRef]
- Hegde, R.S.; Ploegh, H.L. Quality and quantity control at the endoplasmic reticulum. Curr. Opin. Cell Biol. 2010, 22, 437–446. [Google Scholar] [CrossRef] [PubMed]
- Szegezdi, E.; Logue, S.E.; Gorman, A.M.; Samali, A. Mediators of endoplasmic reticulum stress-induced apoptosis. EMBO Rep. 2006, 7, 880–885. [Google Scholar] [CrossRef]
- Bonaldo, P.; Sandri, M. Cellular and molecular mechanisms of muscle atrophy. Dis. Model Mech. 2013, 6, 25–39. [Google Scholar] [CrossRef]
- Bohnert, K.R.; McMillan, J.D.; Kumar, A. Emerging roles of ER stress and unfolded protein response pathways in skeletal muscle health and disease. J. Cell. Physiol. 2018, 233, 67–78. [Google Scholar] [CrossRef]
- Cupelli, L.; Renaul, B.; Leblanc-Straceski, J.; Banks, A.; Ward, D.; Kucherlapati, R.S.; Krauter, K. Assignment of the human myogenic factors 5 and 6 (MYF5, MYF6) gene cluster to 12q21 by in situ hybridization and physical mapping of the locus between D12S350 and D12S106. Cytogenet. Cell Genet. 1996, 72, 250–251. [Google Scholar] [CrossRef]
- Davis, R.L.; Weintraub, H.; Lassar, A.B. Expression of a single transfected cDNA converts fibroblasts to myoblasts. Cell 1987, 51, 987–1000. [Google Scholar] [CrossRef]
- Hasty, P.; Bradley, A.; Morris, J.H.; Edmondson, D.G.; Venuti, J.M.; Olson, E.N.; Klein, W.H. Muscle deficiency and neonatal death in mice with a targeted mutation in the myogenin gene. Nature 1993, 364, 501–506. [Google Scholar] [CrossRef]
- Bentzinger, C.F.; Wang, Y.X.; Rudnicki, M.A. Building muscle: Molecular regulation of myogenesis. Cold Spring Harb. Perspect. Biol. 2012, 4, a008342. [Google Scholar] [CrossRef]
- Gossett, L.A.; Kelvin, D.J.; Sternberg, E.A.; Olson, E.N. A new myocyte-specific enhancer-binding factor that recognizes a conserved element associated with multiple muscle specific genes. Mol. Cell. Biol. 1989, 9, 5022–5503. [Google Scholar] [CrossRef] [PubMed]
- Cuenda, A.; Cohen, P. Stress-activated Protein Kinase-2/p38 and a Rapamycin-sensitive Pathway Are Required for C2C12 Myogenesis. J. Biol. Chem. 1999, 274, 4341–4346. [Google Scholar] [CrossRef] [PubMed]
- Darling, N.J.; Cook, S.J. The role of MAPK signalling pathways in the response to endoplasmic reticulum stress. Biochim. Biophys. Acta 2014, 1843, 2150–2163. [Google Scholar] [CrossRef] [PubMed]
- Puente, L.G.; Voisin, S.; Lee, R.E.; Megeney, L.A. Reconstructing the regulatory kinase pathways of myogenesis from phosphopeptide data. Mol. Cell. Proteom. 2006, 5, 2244–2251. [Google Scholar] [CrossRef] [PubMed]
- Sargsyan, E.; Baryshev, M.; Mkrtchian, S. The physiological unfolded protein response in the thyroid epithelial cells. Biochem. Biophys. Res. Commun. 2004, 322, 570–576. [Google Scholar] [CrossRef]
- Ma, Y.; Shimizu, Y.; Mann, M.J.; Jin, Y.; Hendershot, L.M. Plasma cell differentiation initiates a limited ER stress response by specifically suppressing the PERK-dependent branch of the unfolded protein response. Cell Stress Chaperones 2010, 15, 281–293. [Google Scholar] [CrossRef] [PubMed]
- Nakanishi, K.; Sudo, T.; Morishima, N. Endoplasmic reticulum stress signaling transmitted by ATF6 mediates apoptosis during muscle development. J. Cell Biol. 2005, 169, 555–560. [Google Scholar] [CrossRef]
- Xiong, Y.; Chen, H.; Lin, P.; Wang, A.; Wang, L.; Jin, Y. ATF6 knockdown decreases apoptosis, arrests the S phase of the cell cycle, and increases steroid hormone production in mouse granulosa cells. Am. J. Physiol. Cell Physiol. 2017, 312, C341–C353. [Google Scholar] [CrossRef]
- Alter, J.; Bengal, E. Stress-induced C/EBP homology protein (CHOP) represses MyoD transcription to delay myoblast differentiation. PLoS ONE 2011, 6, e29498. [Google Scholar] [CrossRef]
- Zismanov, V.; Chichkov, V.; Colangelo, V.; Jamet, S.; Wang, S.; Syme, A.; Koromilas, A.E.; Crist, C. Phosphorylation of eIF2alpha Is a Translational Control Mechanism Regulating Muscle Stem Cell Quiescence and Self-Renewal. Cell Stem Cell 2016, 18, 79–90. [Google Scholar] [CrossRef]
- Jin, W.; Peng, J.; Jiang, S. The epigenetic regulation of embryonic myogenesis and adult muscle regeneration by histone methylation modification. Biochem. Biophys. Rep. 2016, 6, 209–219. [Google Scholar] [CrossRef]
- Tokutake, Y.; Yamada, K.; Hayashi, S.; Arai, W.; Watanabe, T.; Yonekura, S. IRE1-XBP1 Pathway of the Unfolded Protein Response Is Required during Early Differentiation of C2C12 Myoblasts. Int. J. Mol. Sci. 2019, 21, 182. [Google Scholar] [CrossRef]
- Acosta-Alvear, D.; Zhou, Y.; Blais, A.; Tsikitis, M.; Lents, N.H.; Arias, C.; Lennon, C.J.; Kluger, Y.; Dynlacht, B.D. XBP1 controls diverse cell type- and condition-specific transcriptional regulatory networks. Mol. Cell 2007, 27, 53–66. [Google Scholar] [CrossRef]
- Siwecka, N.; Rozpedek-Kaminska, W.; Wawrzynkiewicz, A.; Pytel, D.; Diehl, J.A.; Majsterek, I. The Structure, Activation and Signaling of IRE1 and Its Role in Determining Cell Fate. Biomedicines 2021, 9, 156. [Google Scholar] [CrossRef]
- Xie, S.J.; Li, J.H.; Chen, H.F.; Tan, Y.Y.; Liu, S.R.; Zhang, Y.; Xu, H.; Yang, J.H.; Liu, S.; Zheng, L.L.; et al. Inhibition of the JNK/MAPK signaling pathway by myogenesis-associated miRNAs is required for skeletal muscle development. Cell Death Differ. 2018, 25, 1581–1597. [Google Scholar] [CrossRef]
- Gu, R.; Huang, T.; Xiao, J.; Liao, Z.; Li, J.; Lan, H.; Ouyang, J.; Hu, J.; Liao, H. The IRE1alpha Arm of UPR Regulates Muscle Cells Immune Characters by Restraining p38 MAPK Activation. Front. Physiol. 2019, 10, 1198. [Google Scholar] [CrossRef]
- Fidzianska, A.; Goebel, H.H. Human ontogenesis. Cell death in fetal muscle. Acta Neuropathol. 1991, 81, 572–577. [Google Scholar] [CrossRef]
- Olson, E.N. Interplay between proliferation and differentiation within the myogenic lineage. Dev. Biol. 1992, 154, 261–272. [Google Scholar] [CrossRef]
- Luo, S.; Lee, A.S. Requirement of the p38 mitogen-activated protein kinase signalling pathway for the induction of the 78 kDa glucose-regulated protein/immunoglobulin heavy-chain binding protein by azetidine stress: Activating transcription factor 6 as a target for stress-induced phosphorylation. Biochem. J. 2002, 366, 787–795. [Google Scholar] [CrossRef]
- Gade, P.; Ramachandran, G.; Maachani, U.B.; Rizzo, M.A.; Okada, T.; Prywes, R.; Cross, A.S.; Mori, K.; Kalvakolanu, D.V. An IFN-gamma-stimulated ATF6-C/EBP-beta-signaling pathway critical for the expression of Death Associated Protein Kinase 1 and induction of autophagy. Proc. Natl. Acad. Sci. USA 2012, 109, 10316–10321. [Google Scholar] [CrossRef]
- Pagliara, V.; Donadio, G.; De Tommasi, N.; Amodio, G.; Remondelli, P.; Moltedo, O.; Dal Piaz, F. Bioactive Ent-Kaurane Diterpenes Oridonin and Irudonin Prevent Cancer Cells Migration by Interacting with the Actin Cytoskeleton Controller Ezrin. Int. J. Mol. Sci. 2020, 21, 7186. [Google Scholar] [CrossRef] [PubMed]
- Kook, S.H.; Choi, K.C.; Son, Y.O.; Lee, K.Y.; Hwang, I.H.; Lee, H.J.; Chung, W.T.; Lee, C.B.; Park, J.S.; Lee, J.C. Involvement of p38 MAPK-mediated signaling in the calpeptin-mediated suppression of myogenic differentiation and fusion in C2C12 cells. Mol. Cell. Biochem. 2008, 310, 85–92. [Google Scholar] [CrossRef] [PubMed]
- Guo, F.; Han, X.; Wu, Z.; Cheng, Z.; Hu, Q.; Zhao, Y.; Wang, Y.; Liu, C. ATF6a, a Runx2-activable transcription factor, is a novel regulator of chondrocyte hypertrophy. J. Cell Sci. 2015, 129, 717–728. [Google Scholar] [CrossRef]
- Gade, P.; Manjegowda, S.B.; Nallar, S.C.; Maachani, U.B.; Cross, A.S.; Kalvakolanu, D.V. Regulation of the Death-Associated Protein Kinase 1 Expression and Autophagy via ATF6 Requires Apoptosis Signal-Regulating Kinase 1. Mol. Cell. Biol. 2014, 34, 4033–4048. [Google Scholar] [CrossRef]
- Pagliara, V.; Parafati, M.; Adornetto, A.; White, M.C.; Masullo, M.; Grimaldi, M.; Arcone, R. Dibutyryl cAMP- or Interleukin-6-induced astrocytic differentiation enhances mannose binding lectin (MBL)-associated serine protease (MASP)-1/3 expression in C6 glioma cells. Arch. Biochem. Biophys. 2018, 653, 39–49. [Google Scholar] [CrossRef] [PubMed]
- Di Sarno, V.G.P.; Medina-Peris, A.; Ciaglia, T.; Di Donato, M.; Musella, S.; Lauro, G.; Vestuto, V.; Smaldone, G.; Di Matteo, F.; Bifulco, G.; et al. New TRPM8 blockers exert anticancer activity over castration-resistant prostate cancer models. Eur. J. Med. Chem. 2022, 238, 114435. [Google Scholar] [CrossRef]
- Pagliara, V.; De Rosa, M.; Di Donato, P.; Nasso, R.; D’Errico, A.; Cammarota, F.; Poli, A.; Masullo, M.; Arcone, R. Inhibition of Interleukin-6-Induced Matrix Metalloproteinase-2 Expression and Invasive Ability of Lemon Peel Polyphenol Extract in Human Primary Colon Cancer Cells. Molecules 2021, 26, 7076. [Google Scholar] [CrossRef]
- Eletto, D.; Eletto, D.; Boyle, S.; Argon, Y. PDIA6 regulates insulin secretion by selectively inhibiting the RIDD activity of IRE1. FASEB J. 2016, 30, 653–665. [Google Scholar] [CrossRef]
- Amodio, G.; Margarucci, L.; Moltedo, O.; Casapullo, A.; Remondelli, P. Identification of Cysteine Ubiquitylation Sites on the Sec23A Protein of the COPII Complex Required for Vesicle Formation from the ER. Open Biochem. J. 2017, 11, 36–46. [Google Scholar] [CrossRef]
- Rapa, S.F.; Magliocca, G.; Pepe, G.; Amodio, G.; Autore, G.; Campiglia, P.; Marzocco, S. Protective Effect of Pomegranate on Oxidative Stress and Inflammatory Response Induced by 5-Fluorouracil in Human Keratinocytes. Antioxidants 2021, 10, 203. [Google Scholar] [CrossRef]
- Paladino, S.; Lebreton, S.; Tivodar, S.; Campana, V.; Tempre, R.; Zurzolo, C. Different GPI-attachment signals affect the oligomerisation of GPI-anchored proteins and their apical sorting. J. Cell Sci. 2008, 121, 4001–4007. [Google Scholar] [CrossRef] [PubMed]
- Albano, F.; Arcucci, A.; Granato, G.; Romano, S.; Montagnani, S.; De Vendittis, E.; Ruocco, M.R. Markers of mitochondrial dysfunction during the diclofenac-induced apoptosis in melanoma cell lines. Biochimie 2013, 95, 934–945. [Google Scholar] [CrossRef] [PubMed]
- Vestuto, V.; Amodio, G.; Pepe, G.; Basilicata, M.G.; Belvedere, R.; Napolitano, E.; Guarnieri, D.; Pagliara, V.; Paladino, S.; Rodriquez, M.; et al. Cocoa Extract Provides Protection against 6-OHDA Toxicity in SH-SY5Y Dopaminergic Neurons by Targeting PERK. Biomedicines 2022, 10, 2009. [Google Scholar] [CrossRef]
- Harding, H.P.; Zhang, Y.; Ron, D. Protein translation and folding are coupled by an endoplasmic-reticulum-resident kinase. Nature 1999, 397, 271–274. [Google Scholar] [CrossRef] [PubMed]
- Khurana, A.; Dey, C.S. p38 MAPK interacts with actin and modulates filament assembly during skeletal muscle differentiation. Differentiation 2003, 71, 42–50. [Google Scholar] [CrossRef]
- Thuerauf, D.J.; Arnold, N.D.; Zechner, D.; Hanford, D.S.; DeMartin, K.M.; McDonough, P.M.; Prywes, R.; Glembotski, C.C. p38 Mitogen-activated protein kinase mediates the transcriptional induction of the atrial natriuretic factor gene through a serum response element. A potential role for the transcription factor ATF6. J. Biol. Chem. 1998, 273, 20636–20643. [Google Scholar] [CrossRef]
- Hillary, R.F.; FitzGerald, U. A lifetime of stress: ATF6 in development and homeostasis. J. Biomed. Sci. 2018, 25, 48. [Google Scholar] [CrossRef]
- Haze, K.; Yoshida, H.; Yanagi, H.; Yura, T.; Mori, K. Mammalian Transcription Factor ATF6 Is Synthesized as a Transmembrane Protein and Activated by Proteolysis in Response to Endoplasmic Reticulum Stress. Mol. Biol. Cell 1999, 10, 3787–3799. [Google Scholar] [CrossRef]
- Xu, Q.; Yu, L.; Liu, L.; Cheung, C.F.; Li, X.; Yee, S.P.; Yang, X.J.; Wu, Z. p38 Mitogen-activated protein kinase-, calcium-calmodulin-dependent protein kinase-, and calcineurin-mediated signaling pathways transcriptionally regulate myogenin expression. Mol. Biol. Cell 2002, 13, 1940–1952. [Google Scholar] [CrossRef]
- Wang, Y.; Shen, J.; Arenzana, N.; Tirasophon, W.; Kaufman, R.J.; Prywes, R. Activation of ATF6 and an ATF6 DNA Binding Site by the Endoplasmic Reticulum Stress Response. J. Biol. Chem. 2000, 275, 27013–27020. [Google Scholar] [CrossRef]
- Kokame, K.; Kato, H.; Miyata, T. Identification of ERSE-II, a new cis-acting element responsible for the ATF6-dependent mammalian unfolded protein response. J. Biol. Chem. 2001, 276, 9199–9205. [Google Scholar] [CrossRef] [PubMed]
- Malumbres, M.; Barbacid, M. Mammalian cyclin-dependent kinases. Trends Biochem. Sci. 2005, 30, 630–641. [Google Scholar] [CrossRef] [PubMed]
- Yamamoto, K.; Sato, T.; Matsui, T.; Sato, M.; Okada, T.; Yoshida, H.; Harada, A.; Mori, K. Transcriptional induction of mammalian ER quality control proteins is mediated by single or combined action of ATF6alpha and XBP1. Dev. Cell 2007, 13, 365–376. [Google Scholar] [CrossRef] [PubMed]
- Sharma, R.B.; Snyder, J.T.; Alonso, L.C. Atf6alpha impacts cell number by influencing survival, death and proliferation. Mol. Metab. 2019, 27S, S69–S80. [Google Scholar] [CrossRef] [PubMed]
- Morishima, N.; Nakanishi, K.; Nakano, A. Activating transcription factor-6 (ATF6) mediates apoptosis with reduction of myeloid cell leukemia sequence 1 (Mcl-1) protein via induction of WW domain binding protein 1. J. Biol. Chem. 2011, 286, 35227–35235. [Google Scholar] [CrossRef]
- D’Alessandro, R.; Docimo, T.; Graziani, G.; D’Amelia, V.; De Palma, M.; Cappetta, E.; Tucci, M. Abiotic Stresses Elicitation Potentiates the Productiveness of Cardoon Calli as Bio-Factories for Specialized Metabolites Production. Antioxidants 2022, 11, 1041. [Google Scholar] [CrossRef]
- Cappetta, E.; De Palma, M.; D’Alessandro, R.; Aiello, A.; Romano, R.; Graziani, G.; Ritieni, A.; Paolo, D.; Locatelli, F.; Sparvoli, F.; et al. Development of a High Oleic Cardoon Cell Culture Platform by SAD Overexpression and RNAi-Mediated FAD2.2 Silencing. Front. Plant Sci. 2022, 13, 913374. [Google Scholar] [CrossRef]
- Kweon, M.; Lee, H.; Park, C.; Choi, Y.H.; Ryu, J.H. A Chalcone from Ashitaba (Angelica keiskei) Stimulates Myoblast Differentiation and Inhibits Dexamethasone-Induced Muscle Atrophy. Nutrients 2019, 11, 2419. [Google Scholar] [CrossRef]
- Han, Y.; Lee, H.; Li, H.; Ryu, J.H. Corylifol A from Psoralea corylifolia L. Enhances Myogenesis and Alleviates Muscle Atrophy. Int. J. Mol. Sci. 2020, 21, 1571. [Google Scholar] [CrossRef]
- Wu, J.; Ruas, J.L.; Estall, J.L.; Rasbach, K.A.; Choi, J.H.; Ye, L.; Bostrom, P.; Tyra, H.M.; Crawford, R.W.; Campbell, K.P.; et al. The unfolded protein response mediates adaptation to exercise in skeletal muscle through a PGC-1alpha/ATF6alpha complex. Cell Metab. 2011, 13, 160–169. [Google Scholar] [CrossRef]


Disclaimer/Publisher’s Note: The statements, opinions and data contained in all publications are solely those of the individual author(s) and contributor(s) and not of MDPI and/or the editor(s). MDPI and/or the editor(s) disclaim responsibility for any injury to people or property resulting from any ideas, methods, instructions or products referred to in the content. |
© 2023 by the authors. Licensee MDPI, Basel, Switzerland. This article is an open access article distributed under the terms and conditions of the Creative Commons Attribution (CC BY) license (https://creativecommons.org/licenses/by/4.0/).
Share and Cite
Pagliara, V.; Amodio, G.; Vestuto, V.; Franceschelli, S.; Russo, N.A.; Cirillo, V.; Mottola, G.; Remondelli, P.; Moltedo, O. Myogenesis in C2C12 Cells Requires Phosphorylation of ATF6α by p38 MAPK. Biomedicines 2023, 11, 1457. https://doi.org/10.3390/biomedicines11051457
Pagliara V, Amodio G, Vestuto V, Franceschelli S, Russo NA, Cirillo V, Mottola G, Remondelli P, Moltedo O. Myogenesis in C2C12 Cells Requires Phosphorylation of ATF6α by p38 MAPK. Biomedicines. 2023; 11(5):1457. https://doi.org/10.3390/biomedicines11051457
Chicago/Turabian StylePagliara, Valentina, Giuseppina Amodio, Vincenzo Vestuto, Silvia Franceschelli, Nicola Antonino Russo, Vittorio Cirillo, Giovanna Mottola, Paolo Remondelli, and Ornella Moltedo. 2023. "Myogenesis in C2C12 Cells Requires Phosphorylation of ATF6α by p38 MAPK" Biomedicines 11, no. 5: 1457. https://doi.org/10.3390/biomedicines11051457