
ROS Production by a Single Neutrophil Cell and Neutrophil Population upon Bacterial Stimulation
 , , , and
Abstract
:1. Introduction
2. Materials and Methods
3. Results
4. Discussion
5. Conclusions
Author Contributions
Funding
Institutional Review Board Statement
Informed Consent Statement
Data Availability Statement
Conflicts of Interest
References
- Umeda, T.; Takahashi, I.; Danjo, K.; Matsuzaka, M.; Nakaji, S. Changes in neutrophil immune functions under different exercise stresses. Nihon Eiseigaku Zasshi. 2011, 66, 533–542. [Google Scholar] [CrossRef] [PubMed]
- Nexar-Qh, J.; Caleiro Seixas, A.E. Adrenergic and cholinergic influence on the production of reactive oxygen species in human neutrophils. Rev. Peru. Med. Exp. Salud Publica 2019, 36, 54–61. [Google Scholar] [CrossRef] [PubMed]
- Van Gemmeren, T.; Schuppner, R.; Grosse, G.M.; Fering, J.; Gabriel, M.M.; Huber, R.; Worthmann, H.; Lichtinghagen, R.; Weissenborn, K. Early Post-Stroke Infections Are Associated with an Impaired Function of Neutrophil Granulocytes. J. Clin. Med. 2020, 9, 872. [Google Scholar] [CrossRef] [PubMed]
- Barnes, T.C.; Anderson, M.E.; Edwards, S.W.; Moots, R.J. Neutrophil-derived reactive oxygen species in SSc. Rheumatology 2012, 51, 1166–1169. [Google Scholar] [CrossRef]
- Domerecka, W.; Homa-Mlak, I.; Mlak, R.; Michalak, A.; Wilińska, A.; Kowalska-Kępczyńska, A.; Dreher, P.; Cichoż-Lach, H.; Małecka-Massalska, T. Indicator of Inflammation and NETosis—Low-Density Granulocytes as a Biomarker of Autoimmune Hepatitis. J. Clin. Med. 2022, 11, 2174. [Google Scholar] [CrossRef]
- Christoffersson, G.; Phillipson, M. The neutrophil: One cell on many missions or many cells with different agendas? Cell Tissue Res. 2018, 371, 415–423. [Google Scholar] [CrossRef]
- Puga, I.; Cols, M.; Barra, C.M.; He, B.; Cassis, L.; Gentile, M.; Comerma, L.; Chorny, A.; Shan, M.; Cerutti, A.; et al. B cell-helper neutrophils stimulate the diversification and production of immunoglobulin in the marginal zone of the spleen. Nat. Immunol. 2011, 13, 170–180. [Google Scholar] [CrossRef]
- Deniset, J.F.; Surewaard, B.G.; Lee, W.Y.; Kubes, P. Splenic Ly6G high mature and Ly6Gint immature neutrophils contribute to eradication of S. pneumoniae. J. Exp. Med. 2017, 214, 1333–1350. [Google Scholar] [CrossRef]
- Fridlender, Z.G.; Sun, J.; Kim, S.; Kapoor, V.; Cheng, G.; Ling, L.; Worthen, G.S.; Albelda, S.M. Polarization of tumor-associated neutrophil phenotype by TGF-beta: «BN1» versus «BN2» TAN. Cancer Cell 2009, 16, 183–194. [Google Scholar] [CrossRef]
- Abakumova, T.V.; Gening, T.P.; Dolgova, D.R.; Antoneeva, I.I.; Peskov, A.B.; Gening, S.O. Phenotype of circulating neutrophils at different stages of cervical neoplasia. Med. Immunol. 2020, 21, 1127–1138. [Google Scholar] [CrossRef]
- Ma, Y.; Yabluchanskiy, A.; Iyer, R.P.; Cannon, P.L.; Flynn, E.R.; Jung, M.; Henry, J.; Cates, C.A.; Deleon-Pennell, K.Y.; Lindsey, M.L. Temporal neutrophil polarization following myocardial infarction. Cardiovasc. Res. 2016, 110, 51–61. [Google Scholar] [CrossRef] [PubMed]
- Christoffersson, G.; Vagesjo, E.; Vandooren, J.; Liden, M.; Massena, S.; Reinert, R.B.; Brissova, M.; Powers, A.C.; Opdenakker, G.; Phillipson, M. VEGF-A recruits a proangiogenic MMP-9-delivering neutrophil subset that induces angiogenesis in transplanted hypoxic tissue. Blood 2012, 120, 4653–4662. [Google Scholar] [CrossRef]
- Jablonska, J.; Leschner, S.; Westphal, K.; Lienenklaus, S.; Weiss, S. Neutrophils responsive to endogenous IFN-beta regulate tumor angiogenesis and growth in a mouse tumor model. J. Clin. Investig. 2010, 120, 1151–1164. [Google Scholar] [CrossRef] [PubMed]
- Engblom, C.; Pfirschke, C.; Zilionis, R.; Da Silva Martins, J.; Bos, S.A.; Courties, G.; Faget, J.; Zemmour, D.; Klein, A.; Pittet, M.J.; et al. Osteoblasts remotely supply lung tumors with cancer-promoting Sigle cF high neutrophils. Science 2017, 358, eaal5081. [Google Scholar] [CrossRef] [PubMed]
- Massena, S.; Christoffersson, G.; Vagesjo, E.; Seignez, C.; Gustafsson, K.; Binet, F.; Herrera Hidalgo, C.; Giraud, A.; Lomei, J.; Westrom, S.; et al. Identification and characterization of VEGF-A-responsive neutrophils expressing CD49d, VEGFR1, and CXCR4 in mice and humans. Blood 2015, 126, 2016–2026. [Google Scholar] [CrossRef]
- Teuben, M.; Heeres, M.; Blokhuis, T.; Hollman, A.; Vrisekoop, N.; Tan, E.; Pfeifer, R.; Pape, H.C.; Koenderman, L.; Leenen, L.P.N. Instant intra-operative neutropenia despite the emergence of banded (CD16 dim/CD62L bright) neutrophils in peripheral blood—An observational study during extensive trauma-surgery in pigs. Injury 2020, 52, 426–433. [Google Scholar] [CrossRef] [PubMed]
- Saprykin, V.P.; Kuznetsov, S.L. Morphological variants of neutrophilic granulocytes in the blood of practically normal humans. Morphologiia 2001, 120, 37–41. [Google Scholar]
- Pleskova, S.N.; Balalaeva, I.V.; Gushchina, I.I.; Seregeeva, E.A.; Zdobnova, T.A.; Deev, S.M.; Turchin, I.V. Differences in the functional activity of human neutrophilic granulocytes in their interactions with semiconductor quantum dots. Morphologiia 2009, 135, 47–49. [Google Scholar]
- Tsuda, Y.; Takahashi, H.; Kobayashi, M.; Hanafusa, T.; Herndon, D.N.; Suzuki, F. Three different neutrophil subsets exhibited in mice with different susceptibilities to infection by methicillin-resistant Staphylococcus aureus. Immunity 2004, 21, 215–226. [Google Scholar] [CrossRef]
- Gerasimov, I.G.; Ignatov, D. Functional heterogenicity of human blood neutrophils: Generation of oxygen active species. Tsitologiia 2001, 43, 432–436. [Google Scholar]
- Valenta, H.; Erard, M.; Dupré-Crochet, S.; Nüβe, O. The NADPH Oxidase and the Phagosome. Adv. Exp. Med. Biol. 2020, 1246, 153–177. [Google Scholar] [CrossRef] [PubMed]
- Zhang, Y.; Dai, M.; Yuan, Z. Methods for the detection of reactive oxygen species. Anal. Methods 2018, 10, 4625–4638. [Google Scholar] [CrossRef]
- Magazzù, A.; Marcuello, C. Investigation of soft matter nanomechanics by atomic force microscopy and optical tweezers: A comprehensive review. Nanomaterials 2023, 13, 963. [Google Scholar] [CrossRef] [PubMed]
- Pastrana, H.F.; Cartagena-Rivera, A.X.; Raman, A.; Ávila, A. Evaluation of the elastic Young’s modulus and cytotoxicity variations in fibroblasts exposed to car-bon-based nanomaterials. J. Nanobiotechnol. 2019, 17, 32. [Google Scholar] [CrossRef]
- Lachgar, A.; Sojic, N.; Arbault, S.; Bruce, D.; Sarasin, A.; Amatore, C.; Bizzini, B.; Zagury, D.; Vuillaume, M. Amplification of the inflammatory cellular redox state by human immunodeficiency virus type 1-immunosuppressive tat and gp160 proteins. J. Virol. 1999, 73, 1447–1452. [Google Scholar] [CrossRef]
- Arbault, S.; Pantano, P.; Sojic, N.; Amatore, C.; Best-Belpomme, M.; Sarasin, A.; Vuillaume, M. Activation of the NADPH oxidase in human fibroblasts by mechanical intrusion of a single cell with an ultramicroelectrode. Carcinogenesis 1997, 18, 569–574. [Google Scholar] [CrossRef]
- Arbault, S.; Sojic, N.; Bruce, D.; Amatore, C.; Sarasin, A.; Vuillaume, M. Oxidative stress in cancer prone xeroderma pigmentosumfibroblasts. Real-time and single cell monitoring of superoxide and nitric oxide production with microelectrodes. Carcinogenesis 2004, 25, 509–515. [Google Scholar] [CrossRef]
- Amatore, C.; Arbault, S.; Bouton, C.; Drapier, J.-C.; Ghandour, H.; Koh, A.C.W. Real-time amperometric analysis of reactive oxygen and nitrogen species released by single immunostimulated macrophages. Chembiochem 2008, 9, 1472–1480. [Google Scholar] [CrossRef]
- Hu, K.; Li, Y.; Rotenberg, S.A.; Amatore, C.; Mirkin, M.V. Electrochemical measurements of reactive oxygen and nitrogen species inside single phagolysosomes of living macrophages. J. Am. Chem. Soc. 2019, 141, 4564–4568. [Google Scholar] [CrossRef]
- Zhang, X.-W.; Oleinick, A.; Jiang, H.; Liao, Q.-L.; Qiu, Q.-F.; Svir, I.; Liu, Y.-L.; Amatore, C.; Huang, W.-H. lectrochemical monitoring of ROS/RNS homeostasis within individual phagolysosomes inside single macrophages. Angew. Chem. Int. Ed. Engl. 2019, 58, 7753–7756. [Google Scholar] [CrossRef]
- Vaneev, A.; Gorelkin, P.; Garanina, A.S.; Lopatukhina, H.V.; Vodopyanov, S.S.; Alova, A.V.; Raybaya, O.; Akasov, R.A.; Zhang, Y.; Erofeev, A.S.; et al. In vitro and in vivo electrochemical measurement of reactive oxygen species after treatment with anticancer drugs. Anal. Chem. 2020, 92, 8010–8014. [Google Scholar] [CrossRef] [PubMed]
- Obraztsov, I.V.; Godkov, M.A.; Polimova, A.M.; Demin, E.M.; Proskurnina, E.V.; Vladimirov, Y.A. Evaluation of the func-tional activity of whole blood neutrophils by a two stage stimulation: A new approach to the chemiluminescent analysis. Russ. J. Immunol. 2015, 9, 418–425. [Google Scholar]
- Pleskova, S.N.; Kriukov, R.N.; Razumkova, E.V.; Zubkov, S.Y.; Abarbanel, N.A. Features of phagocytosis of opsonized and nonopsonized bacteria Staphylococcus aureus and Escherichia coli by human neutrophil granulocytes, studied by atomic force microscopy. Cell Tissue Biol. 2018, 60, 623–631. [Google Scholar] [CrossRef]
- Dahlgren, C.; Karlsson, A.; Bylund, J. Intracellular neutrophil oxidants: From laboratory curiosity to clinical reality. J. Immunol. 2019, 202, 3127–3134. [Google Scholar] [CrossRef]
- Dan Dunn, J.; Alvarez, L.A.; Zhang, X.; Soldati, T. Reactive oxygen species and mitochondria: A nexus of cellular homeostasis. Redox. Biol. 2015, 6, 472–485. [Google Scholar] [CrossRef]
- Dahlgren, C.; Gabl, M.; Holdfeldt, A.; Winther, M.; Forsman, H. Basic characteristics of the neutrophil receptors that recognize formylated peptides, a danger-associated molecular pattern generated by bacteria and mitochondria. Biochem. Pharmacol. 2016, 114, 22–39. [Google Scholar] [CrossRef]
- Bylund, J.; Brown, K.L.; Movitz, C.; Dahlgren, C.; Karlsson, A. Intracellular generation of superoxide by the phagocyte NADPH oxidase: How, where, and what for? Free Radic. Biol. Med. 2010, 49, 1834–1845. [Google Scholar] [CrossRef]
- Karlsson, A.; Nixon, J.B.; McPhail, L.C. Phorbol myristate acetate induces neutrophil NADPH-oxidase activity by two separate signal transduction pathways: Dependent or independent of phosphatidylinositol 3-kinase. J. Leukoc. Biol. 2000, 67, 396–404. [Google Scholar] [CrossRef]
- Lundqvist, H.; Foilin, P.; Khalfan, L.; Dahlgren, C. Phorbol myristate acetate-induced NADPH oxidase activity in human neutrophils: Only half the story has been told. J. Leukoc. Biol. 1996, 59, 270–279. [Google Scholar] [CrossRef]
- Gupta, E.; Kumar, S.; Srivastava, V.K.; Saxena, J.; Siddiqui, A.J.; Mehta, S.; Kaushik, S.; Jyoti, A. Unravelling the differential Host immuno-inflammatory responses to Staphylococcus aureus and Escherichia coli infections in sepsis. Vaccines 2022, 10, 1648. [Google Scholar] [CrossRef]
- Lee, E.J.; Park, J.S.; Lee, Y.Y.; Kim, D.Y.; Kang, J.L.; Kim, H.S. Anti-inflammatory and anti-oxidant mechanisms of an MMP-8 inhibitor in lipoteichoic acid-stimulated rat primary astrocytes: Involvement of NF-κB, Nrf2, and PPAR-γ signaling pathways. J. Neuroinflamm. 2018, 15, 326. [Google Scholar] [CrossRef] [PubMed]
- Hadley, J.S.; Wang, J.E.; Foster, S.J.; Thiemermann, C.; Hinds, C.J. Peptidoglycan of Staphylococcus aureus upregulates monocyte expression of CD14, toll-like receptor 2 (TLR2), and TLR4 in human blood: Possible implications for riming of lipopolysac-charide signaling. Infect. Immun. 2005, 73, 7613–7619. [Google Scholar] [CrossRef] [PubMed]
- Cheung, G.Y.C.; Joo, H.-S.; Chatterjee, S.S.; Otto, M. Phenol-soluble modulins—Critical determinants of staphylococcal viru-lence. FEMS Microbiol. Rev. 2014, 38, 698–719. [Google Scholar] [CrossRef] [PubMed]


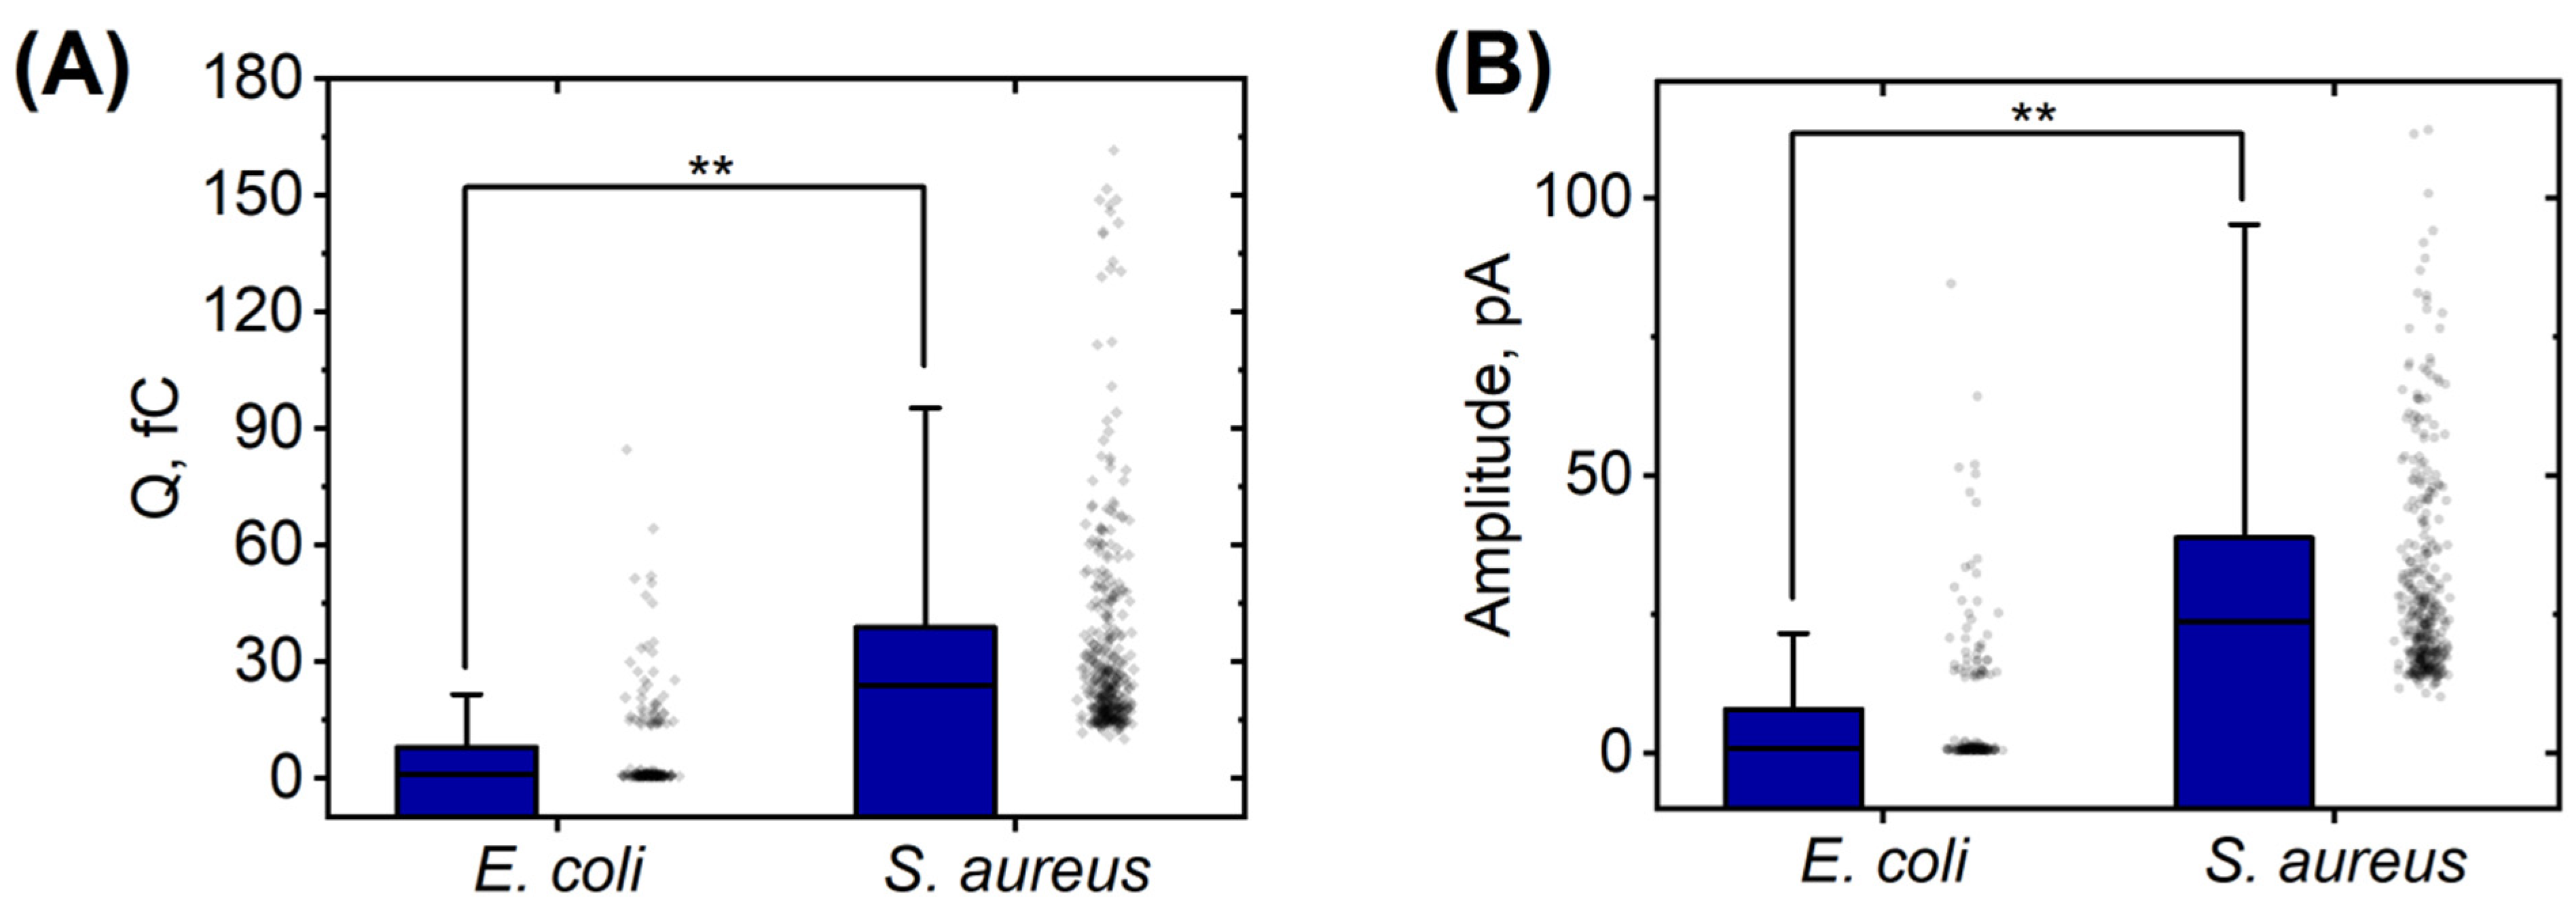
| Strain | Total Cells | Activated Cells | Silent Cells | Average Time of Appearance of Peaks, min | Average Duration of Peaks Appearance, min |
|---|---|---|---|---|---|
| E. coli 321 | 6 | 5 | 1 | 8.7 ± 3.3 | 9.6 ± 3.0 |
| S. aureus 2879 M | 10 | 8 | 2 | 5.4 ± 4.6 | 8.4 ± 4.2 |
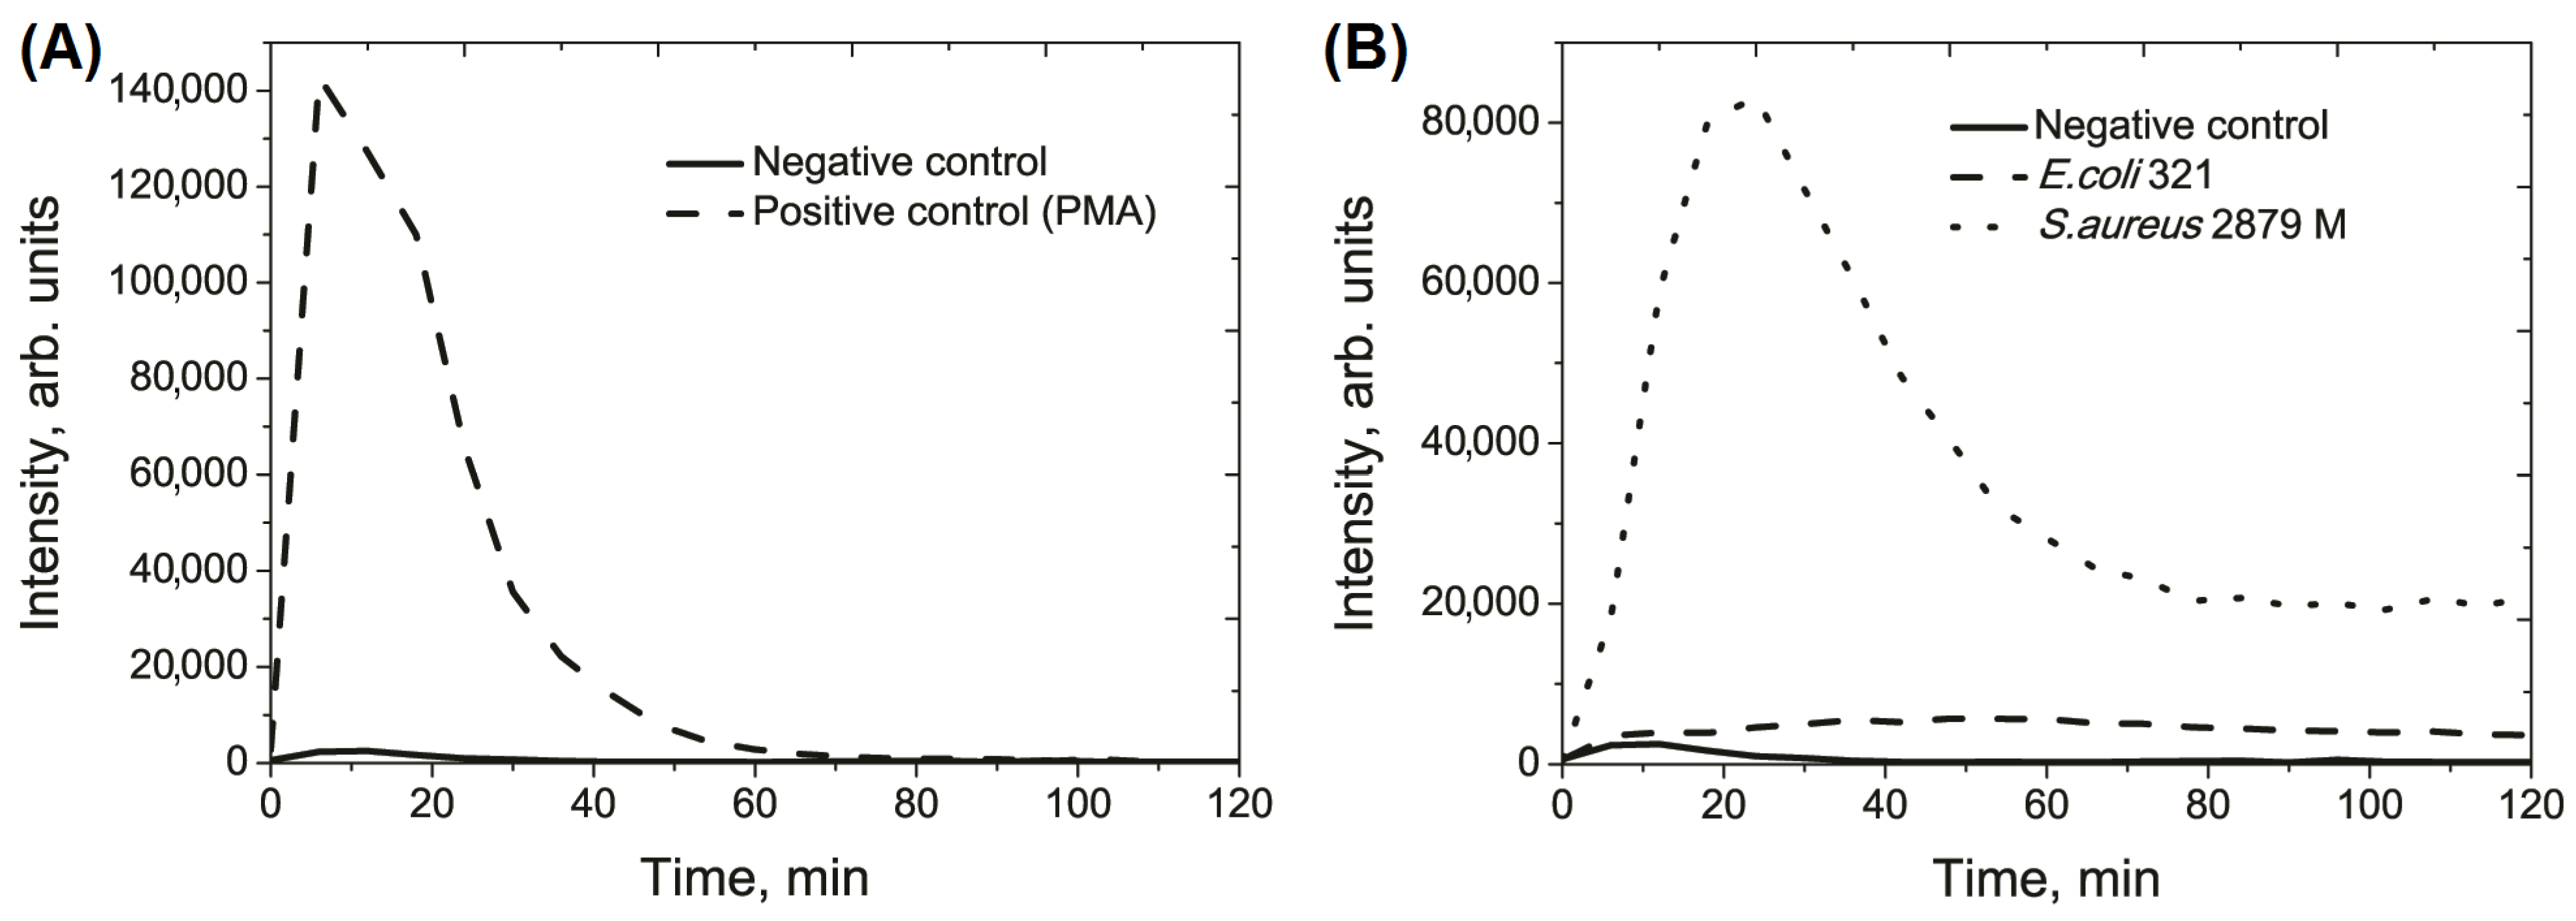
| Parameter | Negative Control | E. coli 321 | S. aureus 2879 M |
|---|---|---|---|
| Integral value of the light sum, arb. units, ×105 | 1.5 ± 0.4 | 5.2 ± 1.3 a | 39.7 ± 4.9 a |
| Height of curve peak, arb. units, ×103 | 5.1 ± 1.7 | 5.9 ± 1.3 | 81.1 ± 12.8 a |
| Time of maximal peak, min | 11.5 ± 2.0 | 57.0 ± 9.3 a | 25.5 ± 2.4 a |
Disclaimer/Publisher’s Note: The statements, opinions and data contained in all publications are solely those of the individual author(s) and contributor(s) and not of MDPI and/or the editor(s). MDPI and/or the editor(s) disclaim responsibility for any injury to people or property resulting from any ideas, methods, instructions or products referred to in the content. |
© 2023 by the authors. Licensee MDPI, Basel, Switzerland. This article is an open access article distributed under the terms and conditions of the Creative Commons Attribution (CC BY) license (https://creativecommons.org/licenses/by/4.0/).
Share and Cite
Pleskova, S.N.; Erofeev, A.S.; Vaneev, A.N.; Gorelkin, P.V.; Bobyk, S.Z.; Kolmogorov, V.S.; Bezrukov, N.A.; Lazarenko, E.V. ROS Production by a Single Neutrophil Cell and Neutrophil Population upon Bacterial Stimulation. Biomedicines 2023, 11, 1361. https://doi.org/10.3390/biomedicines11051361
Pleskova SN, Erofeev AS, Vaneev AN, Gorelkin PV, Bobyk SZ, Kolmogorov VS, Bezrukov NA, Lazarenko EV. ROS Production by a Single Neutrophil Cell and Neutrophil Population upon Bacterial Stimulation. Biomedicines. 2023; 11(5):1361. https://doi.org/10.3390/biomedicines11051361
Chicago/Turabian StylePleskova, Svetlana N., Alexander S. Erofeev, Alexander N. Vaneev, Petr V. Gorelkin, Sergey Z. Bobyk, Vasilii S. Kolmogorov, Nikolay A. Bezrukov, and Ekaterina V. Lazarenko. 2023. "ROS Production by a Single Neutrophil Cell and Neutrophil Population upon Bacterial Stimulation" Biomedicines 11, no. 5: 1361. https://doi.org/10.3390/biomedicines11051361