
Prediabetes, Non-Dipping Profile and Hypertension—A Recipe for Increased Arterial Stiffness

 ,
,
Abstract
:1. Introduction
Aim of the Study
2. Methods
2.1. Groups Depending on Hypertensive Status
- Group A (healthy persons)—subjects were selected by simple random sampling from the list of insured persons in four FMPs without a diagnosis of AH (ICD-10: I10-I15) and with average BP values lower than 130/80 mmHg measured by ABPM.
- Group B (patients with AH without HU)—subjects from four FMPs with a diagnosis of AH (ICD-10: I10-I15) confirmed by ABPM without measured BP values higher than 180 mmHg and/or 120 mmHg in more than five individual measurements and data about HU in the medical history. AH is defined by exceeding the average of all measured BP values above 130 and/or 80 mmHg by APBM and/or taking at least one antihypertensive drug [16,22].
- Group C (patients with HU)—was formed by simple random sampling of patients from the database of patients from Clinical Hospital Merkur who sought emergency medical help due to high BP values. BP values upon arrival at the institution were measured after five minutes of quiet sitting with a one-minute interval between each measurement (three times), and ABPM was set upon discharge. Only those patients whose BP values were measured by a correctly performed ABPM of more than 180 and/or 120 mmHg in more than five individual measurements for 24 h were included.
2.2. Exclusion Criteria
2.3. PWV and ABPM Measurements
2.4. Other Procedures
2.5. Statistical Analysis
3. Results
4. Discussion
Strengths and Limitations
5. Conclusions
Author Contributions
Funding
Institutional Review Board Statement
Informed Consent Statement
Data Availability Statement
Acknowledgments
Conflicts of Interest
References
- American Diabetes Association 2. Classification and Diagnosis of Diabetes. Diabetes Care 2017, 40, S11–S24. [Google Scholar] [CrossRef] [Green Version]
- Authors/Task Force Members; Ryden, L.; Grant, P.J.; Anker, S.D.; Berne, C.; Cosentino, F.; Danchin, N.; Deaton, C.; Escaned, J.; Hammes, H.P.; et al. ESC Guidelines on Diabetes, Pre-Diabetes, and Cardiovascular Diseases Developed in Collaboration with the EASD. The Task Force on Diabetes, Pre-Diabetes, and Cardiovascular Diseases of the European Society of Cardiology (ESC) and Developed in Collaboration with the European Association for the Study of Diabetes (EASD). Rev. Esp. Cardiol. Engl. Ed. 2014, 67, 136. [Google Scholar] [CrossRef]
- Færch, K.; Vistisen, D.; Johansen, N.B.; Jørgensen, M.E. Cardiovascular Risk Stratification and Management in Pre-Diabetes. Curr. Diabetes Rep. 2014, 14, 493. [Google Scholar] [CrossRef] [PubMed]
- Ford, E.S.; Zhao, G.; Li, C. Pre-Diabetes and the Risk for Cardiovascular Disease. J. Am. Coll. Cardiol. 2010, 55, 1310–1317. [Google Scholar] [CrossRef] [PubMed] [Green Version]
- Gupta, A.K.; Greenway, F.L.; Cornelissen, G.; Pan, W.; Halberg, F. Prediabetes Is Associated with Abnormal Circadian Blood Pressure Variability. J. Hum. Hypertens. 2008, 22, 627–633. [Google Scholar] [CrossRef] [PubMed] [Green Version]
- Roth, G.A.; Mensah, G.A.; Johnson, C.O.; Addolorato, G.; Ammirati, E.; Baddour, L.M.; Barengo, N.C.; Beaton, A.Z.; Benjamin, E.J.; Benziger, C.P.; et al. Global Burden of Cardiovascular Diseases and Risk Factors, 1990–2019. J. Am. Coll. Cardiol. 2020, 76, 2982–3021. [Google Scholar] [CrossRef]
- de Rezende Mikael , L.; de Paiva, A.M.G.; Gomes, M.M.; Sousa, A.L.L.; Jardim, P.C.B.V.; de Oliveira Vitorino, P.V.; Euzébio, M.B.; de Sousa, W.M.; Barroso, W.K.S. Vascular Aging and Arterial Stiffness. Arq. Bras. Cardiol. 2017, 109, 253–258. [Google Scholar] [CrossRef]
- Mihuta, M.S.; Paul, C.; Borlea, A.; Cepeha, C.M.; Velea, I.P.; Mozos, I.; Stoian, D. The Oscillometric Pulse Wave Analysis Is Useful in Evaluating the Arterial Stiffness of Obese Children with Relevant Cardiometabolic Risks. J. Clin. Med. 2022, 11, 5078. [Google Scholar] [CrossRef]
- Vlachopoulos, C.; Aznaouridis, K.; Stefanadis, C. Prediction of Cardiovascular Events and All-Cause Mortality with Arterial Stiffness. J. Am. Coll. Cardiol. 2010, 55, 1318–1327. [Google Scholar] [CrossRef] [Green Version]
- Vasan, R.S.; Short, M.I.; Niiranen, T.J.; Xanthakis, V.; DeCarli, C.; Cheng, S.; Seshadri, S.; Mitchell, G.F. Interrelations between Arterial Stiffness, Target Organ Damage, and Cardiovascular Disease Outcomes. J. Am. Heart Assoc. 2019, 8, e012141. [Google Scholar] [CrossRef] [Green Version]
- Aristizábal-Ocampo, D.; Espíndola-Fernández, D.; Gallo-Villegas, J. Pulse Wave Velocity Reference Values in 3,160 Adults Referred to a Hypertension Clinic for 24-Hour Ambulatory Blood Pressure Monitoring. Clin. Exp. Hypertens. 2019, 41, 759–765. [Google Scholar] [CrossRef] [PubMed]
- Loehr, L.R.; Meyer, M.L.; Poon, A.K.; Selvin, E.; Palta, P.; Tanaka, H.; Pankow, J.S.; Wright, J.D.; Griswold, M.E.; Wagenknecht, L.E.; et al. Prediabetes and Diabetes Are Associated with Arterial Stiffness in Older Adults: The ARIC Study. Am. J. Hypertens. 2016, 29, 1038–1045. [Google Scholar] [CrossRef] [Green Version]
- Horton, W.B.; Jahn, L.A.; Hartline, L.M.; Aylor, K.W.; Patrie, J.T.; Barrett, E.J. Insulin Increases Central Aortic Stiffness in Response to Hyperglycemia in Healthy Humans: A Randomized Four-Arm Study. Diabetes Vasc. Dis. Res. 2021, 18, 147916412110110. [Google Scholar] [CrossRef]
- Zheng, X.; Zhang, R.; Liu, X.; Zhao, H.; Liu, H.; Gao, J.; Wu, Y.; Wu, S. Association between Cumulative Exposure to Ideal Cardiovascular Health and Arterial Stiffness. Atherosclerosis 2017, 260, 56–62. [Google Scholar] [CrossRef] [PubMed] [Green Version]
- Dolan, E.; Stanton, A.A.N.; Thijs, L.M.S. Superiority of Ambulatory over Clinic Blood Pressure Measurement in Predicting Mortality: The Dublin Outcome Study. Hypertension 2005, 46, 156–161. [Google Scholar] [CrossRef] [PubMed] [Green Version]
- Obayashi, K.; Saeki, K.; Kurumatani, N. Nighttime BP in Elderly Individuals with Prediabetes/Diabetes with and without CKD: The HEIJO-KYO Study. Clin. J. Am. Soc. Nephrol. 2016, 11, 867–874. [Google Scholar] [CrossRef] [Green Version]
- Mancia, G.; Rosei, E.A.; Azizi, M.; Burnier, M.; Clement, D.L.; Coca, A.; de Simone, G.; Dominiczak, A.; Kahan, T.; Mahfoud, F.; et al. 2018 ESC/ESH Guidelines for the Management of Arterial Hypertension. Eur. Heart J. 2018, 39, 3021–3104. [Google Scholar]
- Patel, K.K.; Young, L.; Howell, E.H.; Hu, B.; Rutecki, G.; Thomas, G.; Rothberg, M.B. Characteristics and Outcomes of Patients Presenting with Hypertensive Urgency in the Office Setting. JAMA Intern. Med. 2016, 176, 981. [Google Scholar] [CrossRef] [Green Version]
- Astarita, A.; Covella, M.; Vallelonga, F.; Cesareo, M.; Totaro, S.; Ventre, L.; Aprà, F.; Veglio, F.; Milan, A. Hypertensive Emergencies and Urgencies in Emergency Departments: A Systematic Review and Meta-Analysis. J. Hypertens. 2020, 38, 1203–1210. [Google Scholar] [CrossRef]
- Levy, P.D.; Mahn, J.J.; Miller, J.; Shelby, A.; Brody, A.; Davidson, R.; Burla, M.J.; Marinica, A.; Carroll, J.; Purakal, J.; et al. Blood Pressure Treatment and Outcomes in Hypertensive Patients without Acute Target Organ Damage: A Retrospective Cohort. Am. J. Emerg. Med. 2015, 33, 1219–1224. [Google Scholar] [CrossRef]
- Zand, A.; Ibrahim, K.; Patham, B. Prediabetes: Why Should We Care? Methodist DeBakey Cardiovasc. J. 2018, 14, 289–297. [Google Scholar] [CrossRef] [PubMed]
- Cicek, Y.; Durakoglugil, M.E.; Kocaman, S.A.; Cetin, M.; Erdogan, T.; Dogan, S.; Ugurlu, Y.; Canga, A. Non-Dipping Pattern in Untreated Hypertensive Patients Is Related to Increased Pulse Wave Velocity Independent of Raised Nocturnal Blood Pressure. Blood Press. 2013, 22, 34–38. [Google Scholar] [CrossRef] [PubMed]
- O’Brien, E.; Parati, G.; Stergiou, G.; Asmar, R.; Beilin, L.; Bilo, G.; Clement, D.; de la Sierra, A.; de Leeuw, P.; Dolan, E.; et al. European Society of Hypertension Position Paper on Ambulatory Blood Pressure Monitoring. J. Hypertens. 2013, 31, 1731–1768. [Google Scholar] [CrossRef] [PubMed] [Green Version]
- Fagard, R.H. Dipping Pattern of Nocturnal Blood Pressure in Patients with Hypertension. Expert Rev. Cardiovasc. Ther. 2009, 7, 599–605. [Google Scholar] [CrossRef] [PubMed]
- Gaborieau, V.; Delarche, N.; Gosse, P. Ambulatory Blood Pressure Monitoring versus Self-Measurement of Blood Pressure at Home: Correlation with Target Organ Damage. J. Hypertens. 2008, 26, 1919–1927. [Google Scholar] [CrossRef]
- Levey, A.S.; Stevens, L.A.; Schmid, C.H.; Iii, A.F.C.; Feldman, H.I.; Kusek, J.W.; Eggers, P.; Coresh, J. A New Equation to Estimate Glomerular Filtration Rate. Ann. Intern. Med. 2009, 150, 604–612. [Google Scholar] [CrossRef]
- Howard, W.J. Diagnosis and Management of the Metabolic Syndrome: An American Heart Association/National Heart, Lung, and Blood Institute Scientific Statement. Yearb. Endocrinol. 2006, 2006, 113–114. [Google Scholar] [CrossRef]
- Cohen, J. Statistical Power Analysis for the Behavioral Sciences, 2nd ed.; L. Erlbaum Associates: Hillsdale, NJ, USA, 1988; ISBN 978-0-8058-0283-2. [Google Scholar]
- SCORE2 Working Group and ESC Cardiovascular Risk Collaboration. SCORE2 Risk Prediction Algorithms: New Models to Estimate 10-Year Risk of Cardiovascular Disease in Europe. Eur. Heart J. 2021, 42, 2439–2454. [Google Scholar] [CrossRef]
- Gagliardino, J.J.; Salazar, M.R.; Espeche, W.G.; Tolosa Chapasian, P.E.; Gomez Garizoain, D.; Olano, R.D.; Stavile, R.N.; Balbín, E.; Martinez, C.; Leiva Sisnieguez, B.C.; et al. Arterial Stiffness: Its Relation with Prediabetes and Metabolic Syndrome and Possible Pathogenesis. J. Clin. Med. 2021, 10, 3251. [Google Scholar] [CrossRef]
- Kim, J.M.; Kim, S.S.; Kim, I.J.; Kim, J.H.; Kim, B.H.; Kim, M.K.; Lee, S.H.; Lee, C.W.; Kim, M.C.; Ahn, J.H.; et al. Arterial Stiffness Is an Independent Predictor for Risk of Mortality in Patients with Type 2 Diabetes Mellitus: The REBOUND Study. Cardiovasc. Diabetol. 2020, 19, 143. [Google Scholar] [CrossRef]
- Bertram, M.Y.; Vos, T. Quantifying the Duration of Pre-Diabetes. Aust. N. Z. J. Public Health 2010, 34, 311–314. [Google Scholar] [CrossRef] [PubMed]
- Zhang, X.; Gregg, E.W.; Williamson, D.F.; Barker, L.E.; Thomas, W.; Bullard, K.M.; Imperatore, G.; Williams, D.E.; Albright, A.L. A1C Level and Future Risk of Diabetes: A Systematic Review. Diabetes Care 2010, 33, 1665–1673. [Google Scholar] [CrossRef] [Green Version]
- Yasuno, S.; Ueshima, K.; Oba, K.; Fujimoto, A.; Hirata, M.; Ogihara, T.; Saruta, T.; Nakao, K. Is Pulse Pressure a Predictor of New-Onset Diabetes in High-Risk Hypertensive Patients? Diabetes Care 2010, 33, 1122–1127. [Google Scholar] [CrossRef] [PubMed] [Green Version]
- Mainous, A.G.; Tanner, R.J.; Baker, R. Prediabetes Diagnosis and Treatment in Primary Care. J. Am. Board Fam. Med. 2016, 29, 283–285. [Google Scholar] [CrossRef] [PubMed] [Green Version]
- Tuomilehto, J.; Lindström, J.; Eriksson, J.G.; Valle, T.T.; Hämäläinen, H.; Ilanne-Parikka, P.; Keinänen-Kiukaanniemi, S.; Laakso, M.; Louheranta, A.; Rastas, M.; et al. Prevention of Type 2 Diabetes Mellitus by Changes in Lifestyle among Subjects with Impaired Glucose Tolerance. N. Engl. J. Med. 2001, 344, 1343–1350. [Google Scholar] [CrossRef]
- Nusca, A.; Tuccinardi, D.; Albano, M.; Cavallaro, C.; Ricottini, E.; Manfrini, S.; Pozzilli, P.; Di Sciascio, G. Glycemic Variability in the Development of Cardiovascular Complications in Diabetes. Diabetes Metab. Res. Rev. 2018, 34, e3047. [Google Scholar] [CrossRef]
- Tateishi, K.; Saito, Y.; Kitahara, H.; Kobayashi, Y. Impact of Glycemic Variability on Coronary and Peripheral Endothelial Dysfunction in Patients with Coronary Artery Disease. J. Cardiol. 2022, 79, 65–70. [Google Scholar] [CrossRef]
- Yu, J.H.; Han, K.; Park, S.; Lee, D.Y.; Nam, G.E.; Seo, J.A.; Kim, S.G.; Baik, S.H.; Park, Y.G.; Kim, S.M.; et al. Effects of Long-Term Glycemic Variability on Incident Cardiovascular Disease and Mortality in Subjects without Diabetes: A Nationwide Population-Based Study. Medicine 2019, 98, e16317. [Google Scholar] [CrossRef]
- Foreman, Y.D.; van Doorn, W.P.T.M.; Schaper, N.C.; van Greevenbroek, M.M.J.; van der Kallen, C.J.H.; Henry, R.M.A.; Koster, A.; Eussen, S.J.P.M.; Wesselius, A.; Reesink, K.D.; et al. Greater Daily Glucose Variability and Lower Time in Range Assessed with Continuous Glucose Monitoring Are Associated with Greater Aortic Stiffness: The Maastricht Study. Diabetologia 2021, 64, 1880–1892. [Google Scholar] [CrossRef]
- Ceriello, A.; Kilpatrick, E.S. Glycemic Variability: Both Sides of the Story. Diabetes Care 2013, 36, S272–S275. [Google Scholar] [CrossRef] [Green Version]
- Prenner, S.B.; Chirinos, J.A. Arterial Stiffness in Diabetes Mellitus. Atherosclerosis 2015, 238, 370–379. [Google Scholar] [CrossRef]
- Kim, M.K.; Han, K.; Park, Y.-M.; Kwon, H.-S.; Kang, G.; Yoon, K.-H.; Lee, S.-H. Associations of Variability in Blood Pressure, Glucose and Cholesterol Concentrations, and Body Mass Index with Mortality and Cardiovascular Outcomes in the General Population. Circulation 2018, 138, 2627–2637. [Google Scholar] [CrossRef]
- Jerrard-Dunne, P.; Mahmud, A.; Feely, J. Circadian Blood Pressure Variation: Relationship between Dipper Status and Measures of Arterial Stiffness. J. Hypertens. 2007, 25, 1233–1239. [Google Scholar] [CrossRef]
- Ben-Shlomo, Y.; Spears, M.; Boustred, C.; May, M.; Anderson, S.G.; Benjamin, E.J.; Boutouyrie, P.; Cameron, J.; Chen, C.-H.; Cruickshank, J.K.; et al. Aortic Pulse Wave Velocity Improves Cardiovascular Event Prediction. J. Am. Coll. Cardiol. 2014, 63, 636–646. [Google Scholar] [CrossRef]
- Li, X.; Chang, P.; Wang, Q.; Hu, H.; Bai, F.; Li, N.; Yu, J. Effects of Angiotensin-Converting Enzyme Inhibitors on Arterial Stiffness: A Systematic Review and Meta-Analysis of Randomized Controlled Trials. Cardiovasc. Ther. 2020, 2020, 7056184. [Google Scholar] [CrossRef] [Green Version]
- Redon, J. Global Cardiovascular Risk Assessment: Strengths and Limitations. High Blood Press. Cardiovasc. Prev. 2016, 23, 87–90. [Google Scholar] [CrossRef]
- Podrug, M.; Šunjić, B.; Bekavac, A.; Koren, P.; Đogaš, V.; Mudnić, I.; Boban, M.; Jerončić, A. The Effects of Experimental, Meteorological, and Physiological Factors on Short-Term Repeated Pulse Wave Velocity Measurements, and Measurement Difficulties: A Randomized Crossover Study with Two Devices. Front. Cardiovasc. Med. 2023, 9, 993971. [Google Scholar] [CrossRef]


| A | B | |||||||
|---|---|---|---|---|---|---|---|---|
| Variable | All Groups (N = 301) | Group A (N = 77) | Group B (N = 138) | Group C (N = 86) | p | Healthy (N = 151) | Prediabetes (N = 150) | p |
| Women | 153 (50.83%) | 49 (63.64%) | 67 (48.55%) | 37 (43.02%) | 0.064 * | 85 (56.29%) | 68 (45.33%) | 0.057 † |
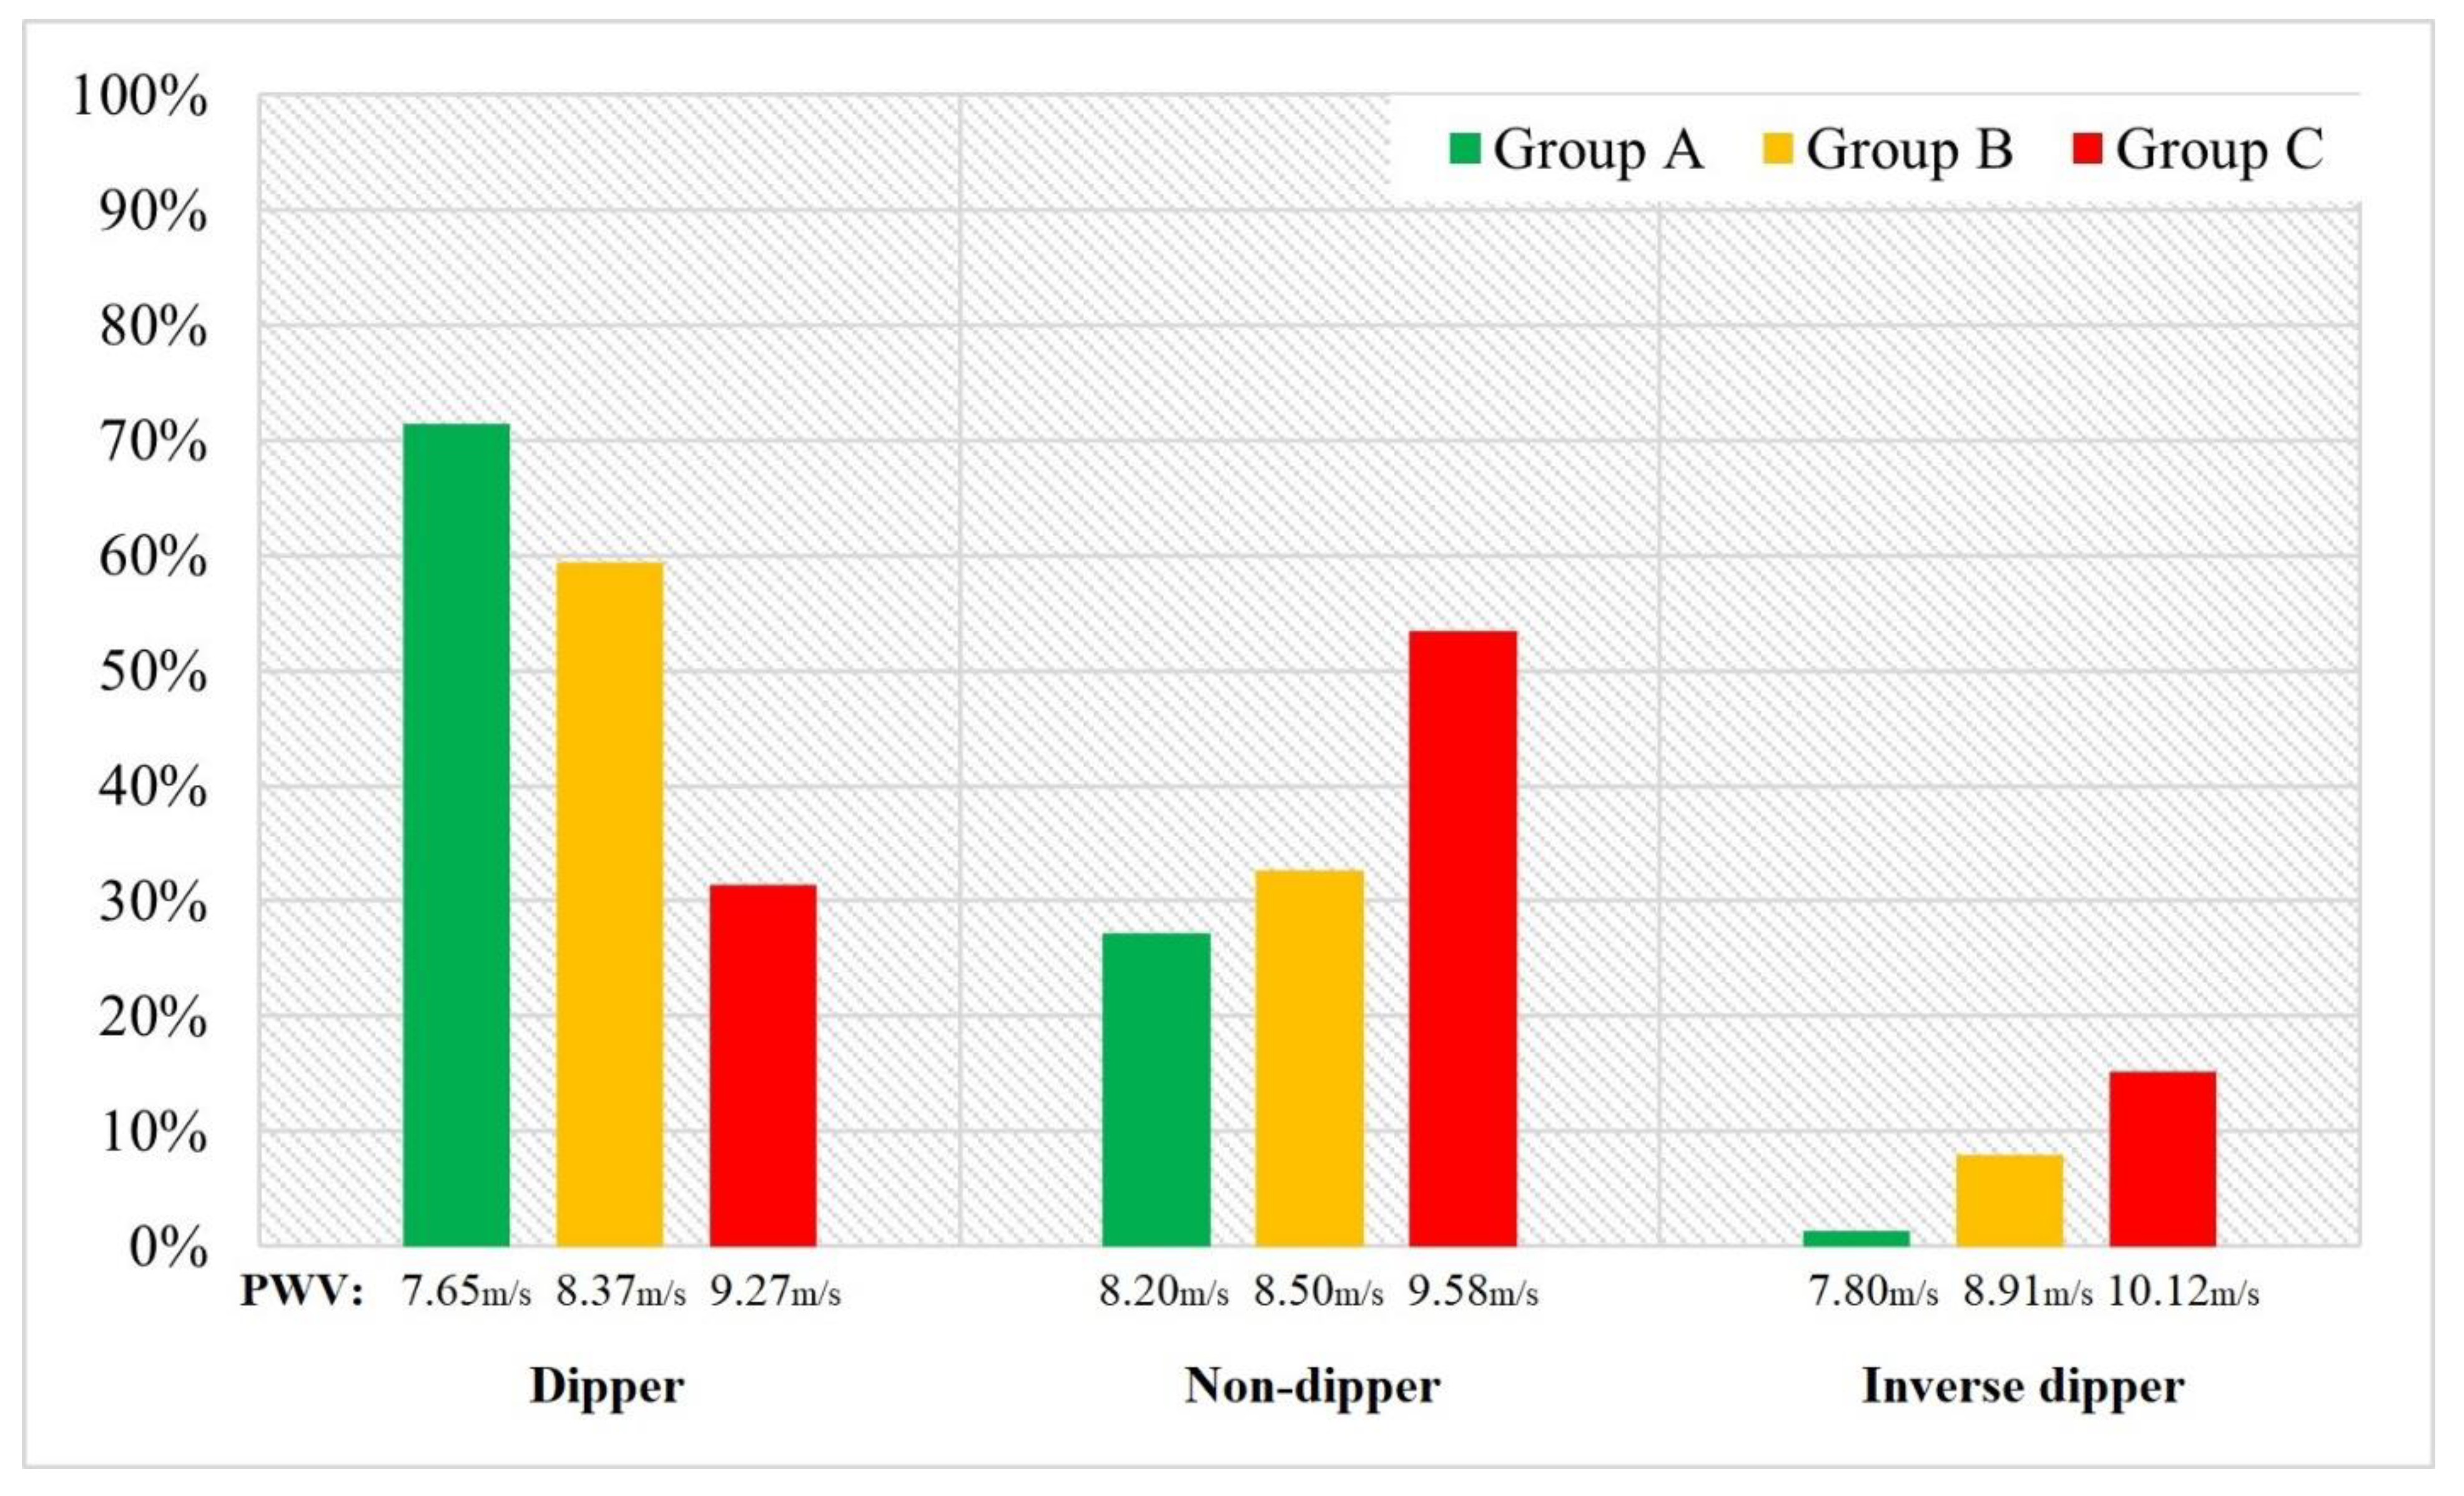
| Dippers | 164 (54.48%) | 55 (71.43%) | 82 (59.42%) | 27 (31.40%) | <0.001 * | 87 (57.61%) | 77 (51.33%) | 0.274 † |
| Metabolic syndrome | 90 (29.90%) | 3 (3.89%) | 39 (28.26%) | 48 (55.81%) | <0.001 * | 20 (13.24%) | 69 (46.00%) | <0.001 † |
| Antihypertensive therapy | 180 (80.36%) ϴ | / | 117 (84.78%) | 63 (73.25%) | 0.119 * | 85 (56.29%) | 98 (65.33%) | 0.108 † |
| Statin therapy | 28 (9.31%) | 3 (3.89%) | 19 (13.77%) | 6 (6.98%) | <0.05 * | 13 (8.61%) | 17 (11.33%) | 0.430 † |
| Current smoking | 110 (36.54%) | 28 (36.37%) | 45 (32.61%) | 37 (43.02%) | <0.05 * | 46 (30.46%) | 64 (42.66%) | <0.05 † |
| Age (years) | 56.37 ± 7.94 | 54.68 ± 7.65 | 57.16 ± 7.61 | 56.72 ± 8.61 | 0.069 * | 55.59 ± 8.56 | 57.53 ± 7.01 | <0.05 ‡ |
| Average SBP (mmHg) | 133.89 ±16.72 | 117.58 ± 7.61 | 134.02 ± 10.52 | 149.41 ± 16.52 | <0.001 * | 130.90 ± 15.62 | 137.51 ± 17.34 | <0.001 ‡ |
| Average DBP (mmHg) | 80.82 ± 11.95 | 71.71 ± 6.73 | 79.48 ± 8.35 | 91.80 ± 12.39 | <0.001 * | 79.36 ± 11.80 | 82.52 ± 12.07 | <0.05 ‡ |
| Average MAP (mmHg) | 98.51 ± 12.81 | 87.00 ± 6.53 | 97.66 ± 8.37 | 111.01 ± 12.26 | <0.001 * | 96.54 ± 12.46 | 100.85 ± 12.97 | <0.01 ‡ |
| Nocturnal indices (%) | 10.83 (4.47–15.44) | 12.12 (7.08–17.47) | 11.16 (5.26–16.38) | 6.18 (2.18–12.14) | <0.001 § | 10.66 (4.76–15.83) | 10.01 (4.17–14.81) | 0.358 § |
| cSBP (mmHg) | 129.82 ± 20.87 | 115.02 ± 11.09 | 124.34 ± 13.10 | 153.39 ± 19.06 | <0.001 * | 124.61 ± 18.29 | 135.60 ± 22.24 | <0.001 ‡ |
| cDBP (mmHg) | 90.04 ± 15.54 | 79.25 ± 9.84 | 87.50 ± 11.27 | 104.65 ± 15.41 | <0.001 * | 87.27 ± 14.62 | 93.07 ± 16.13 | <0.01 ‡ |
| PP (mmHg) | 39.94 ± 12.57 | 36.30 ± 11.68 | 36.85 ± 8.81 | 48.81 ± 14.29 | <0.001 * | 37.24 ± 11.09 | 42.98 ± 13.42 | <0.001 ‡ |
| Heart rate (/min) | 73.43 ± 9.24 | 71.77 ± 7.83 | 72.41 ± 9.55 | 76.69 ± 9.28 | <0.001 * | 73.30 ± 9.91 | 73.71 ± 8.68 | 0.444 ‡ |
| GFR (ml/min/1.73 m2) | 89.83 ± 14.52 | 90.70 ± 13.51 | 89.59 ± 13.43 | 89.43 ± 17.01 | 0.828 * | 90.46 ± 13.44 | 89.19 ± 15.56 | 0.449 ‡ |
| FPG (mmol/L) | 5.76 ± 1.33 | 5.39 ± 0.61 | 5.56 ± 0.77 | 6.41 ± 1.09 | <0.001 * | 5.04 ± 0.32 | 6.48 ± 0.56 | <0.001 ‡ |
| Potassium (mmol/L) | 4.27 ± 0.41 | 4.37 ± 0.34 | 4.30 ± 1.18 | 4.12 ± 0.45 | <0.001 * | 4.30 ± 0.41 | 4.23 ± 0.40 | 0.118 ‡ |
| Total cholesterol (mmol/L) | 5.93 ± 1.18 | 5.94 ± 1.11 | 5.77 ± 1.18 | 6.16 ± 1.23 | 0.062 * | 5.78 ± 1.20 | 6.07 ± 1.15 | <0.05 ‡ |
| Non-HDL c (mmol/L) | 4.44 ± 1.39 | 4.23 ± 1.09 | 4.34 ± 1.13 | 4.77 ± 1.17 | <0.05 * | 4.29 ± 1.16 | 4.58 ± 1.57 | <0.01 ‡ |
| Triglycerides (mmol/L) | 1.62 ± 0.97 | 1.1 (0.9–1.6) | 1.4 (1.1–1.8) | 1.5 (1.1–2.2) | <0.05 § | 1.3 (0.9–1.7) | 1.5 (1.1–2.1) | <0.01 § |
| Uric acid (umol/L) | 335.99 ± 88.34 | 295.49 ± 70.16 | 338.36 ± 84.59 | 373.39 ± 96.86 | <0.001 * | 325.36 ± 83.07 | 348.24 ± 92.93 | 0.063 ‡ |
| BMI (kg/m2) | 28.15 ± 6.94 | 24.71 ± 3.42 | 28.18 ± 4.74 | 30.34 ± 4.66 | <0.001 * | 27.24 ± 5.12 | 28.45 ± 4.51 | <0.05 ‡ |
| WC (cm) | 94.3 ± 3.3 | 88.4 ± 2.8 | 94.2 ± 3.1 | 101.2 ± 4.6 | <0.001 * | 94.0 ± 2.4 | 99.0 ± 3.4 | <0.01 ‡ |
| PWV (m/s) | 8.59 ± 1.32 | 7.79 ± 1.10 | 8.46 ± 1.01 | 9.60 ± 1.34 | <0.001 * | 8.26 ± 1.22 | 8.98 ± 1.31 | <0.001 ‡ |
| AIx (%) | 22 (15–31) | 21 (12–34) | 21 (13–31) | 24 (21–30) | <0.05 § | 22 (13–31) | 23 (18–32) | 0.247 § |
| B | Standard Error | T | p | |
|---|---|---|---|---|
| Intercept | 0.694 | −3.495 | <0.001 | |
| Age | 0.736 | 0.035 | 20.759 | <0.001 |
| SBP | 0.222 | 0.049 | 4.539 | <0.001 |
| DBP | 0.109 | 0.051 | 2.135 | 0.034 |
| Nocturnal indices | −0.107 | 0.459 | −3.280 | 0.001 |
| Heart rate | 0.040 | 0.034 | 1.189 | 0.235 |
| GFR | −0.048 | 0.034 | −1.416 | 0.158 |
| FPG | 0.143 | 0.032 | 4.433 | <0.001 |
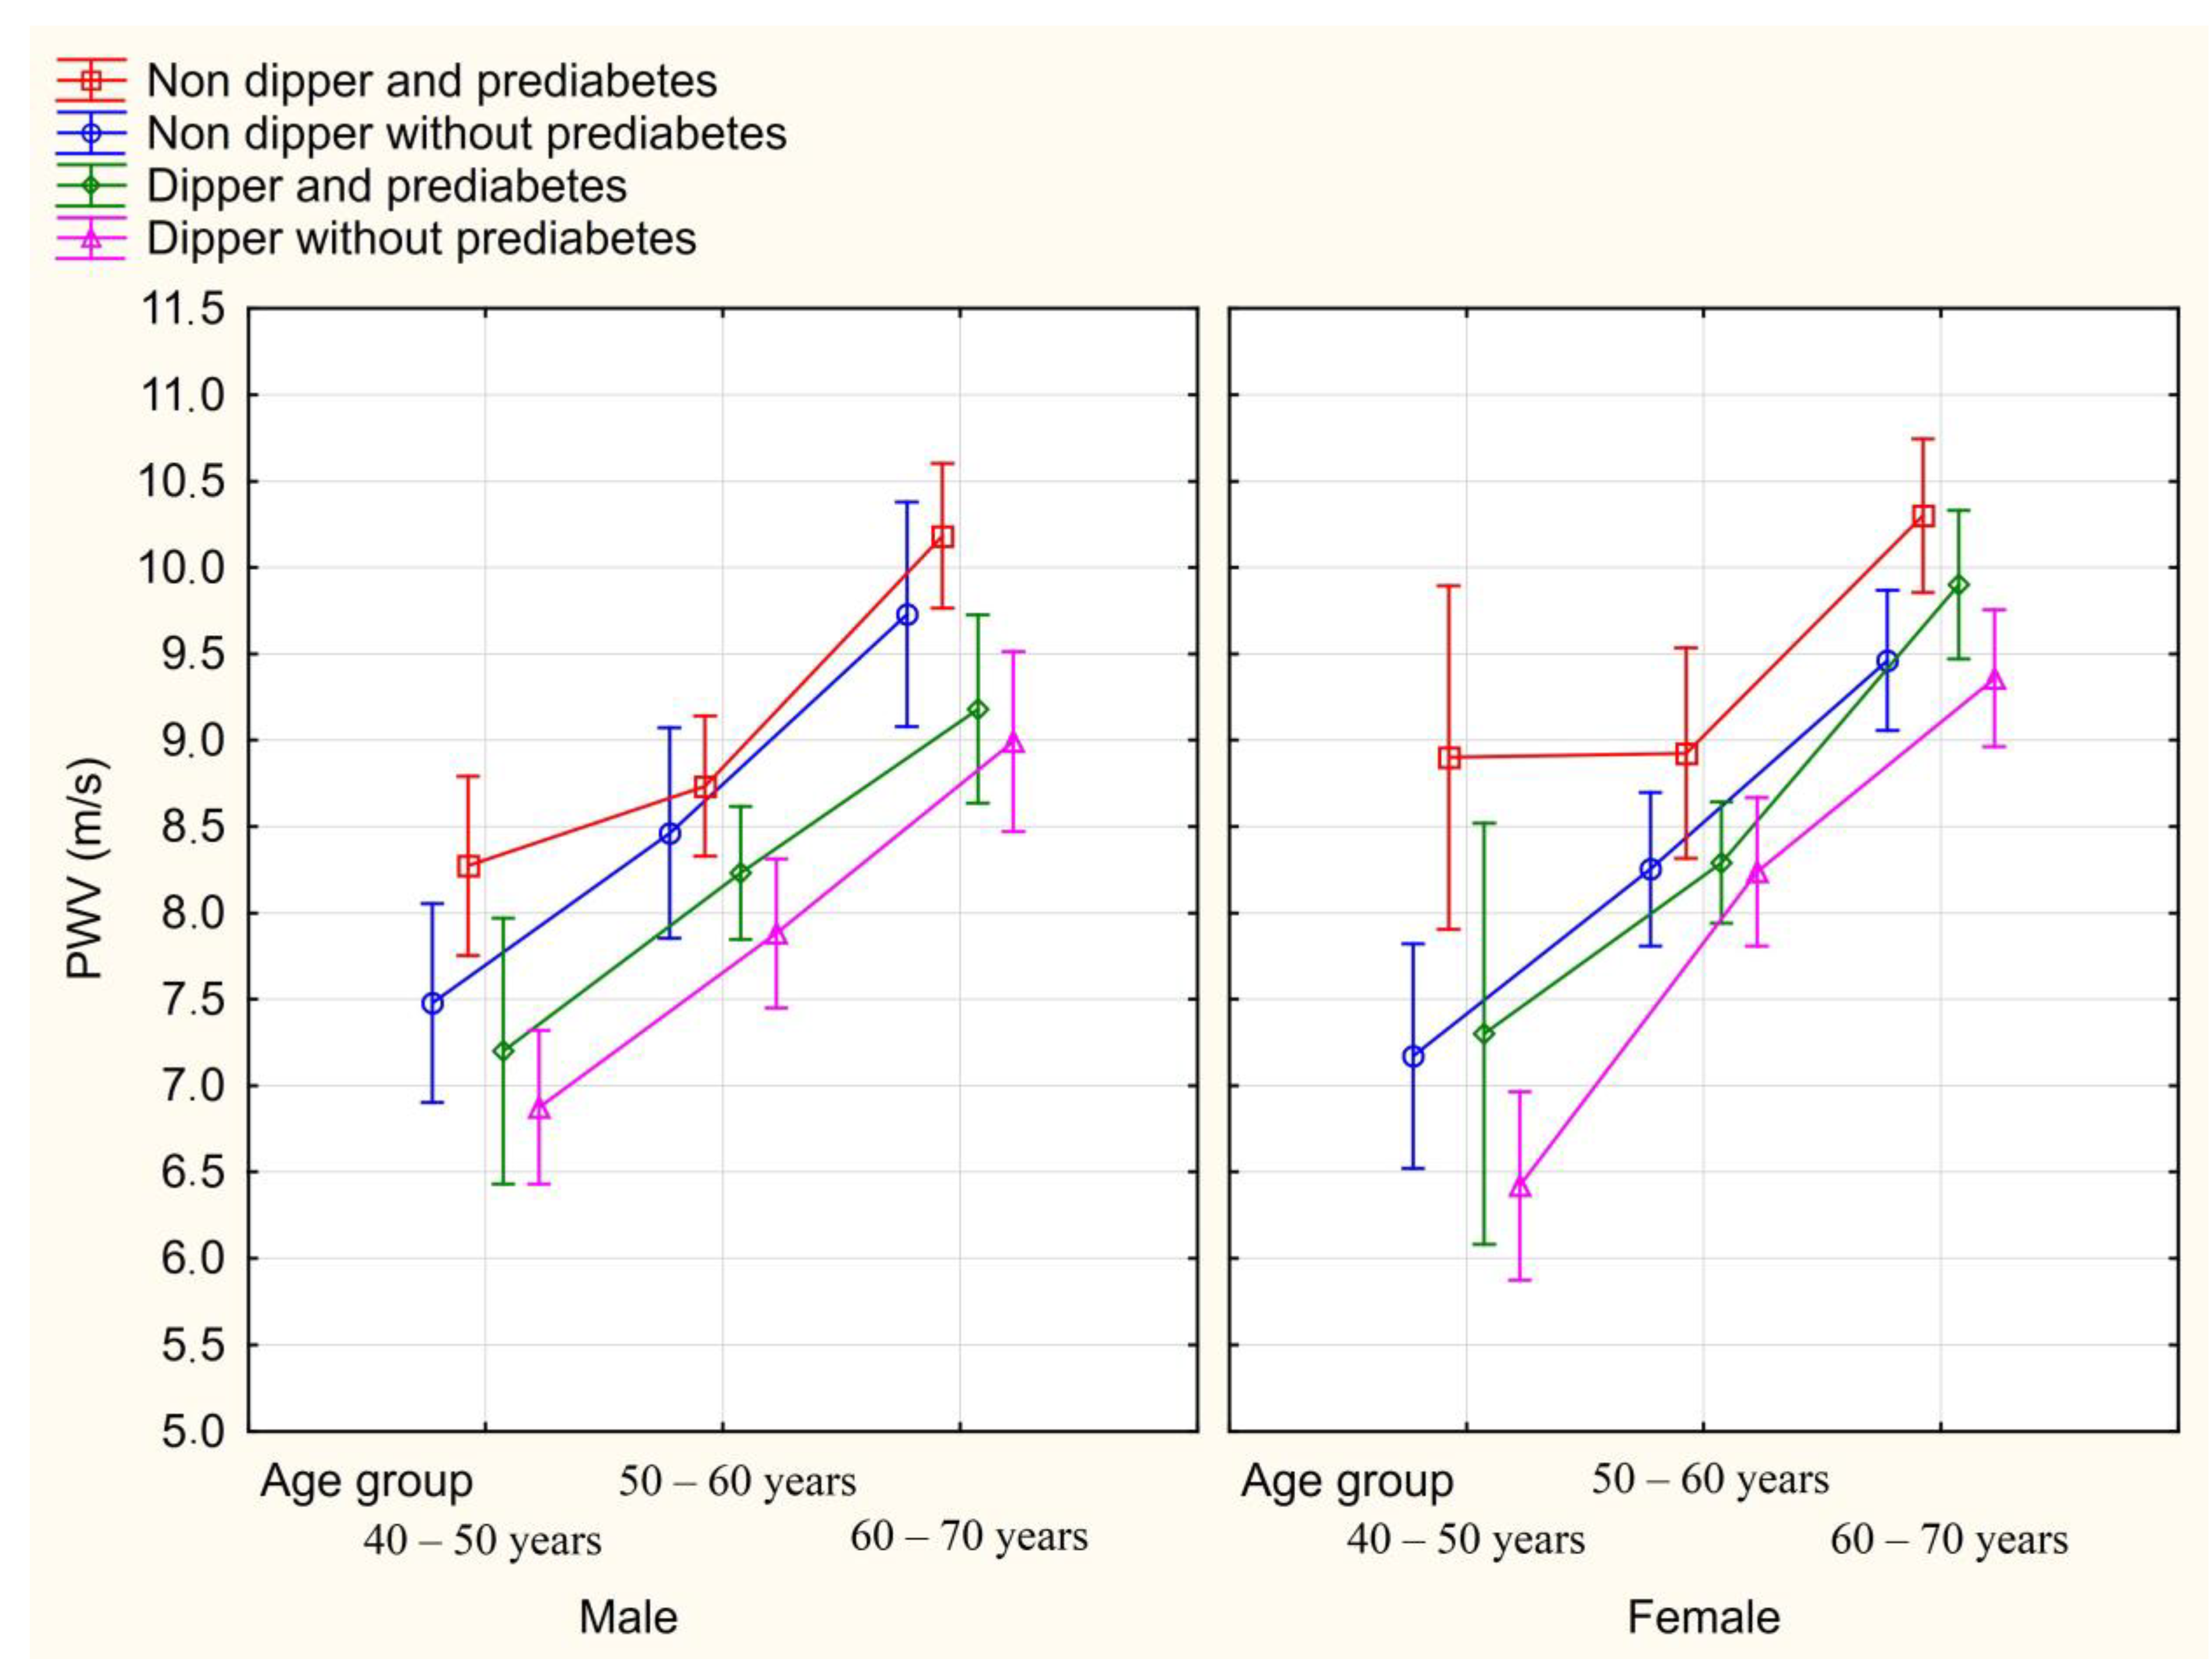
| Gender | Non-Dipper and PreD (N = 72) | Dipper and PreD (N = 64) | Non-Dipper without PreD (N = 77) | Dipper without PreD (N = 87) | p | |
|---|---|---|---|---|---|---|
| Group A (Healthy subjects) | Male | 8.17 ± 1.04 | 7.90 ± 0.56 | 7.82 ± 1.14 | 7.22 ± 0.99 | 0.904 |
| Female | 9.07 ± 1.04 | 8.60 ± 0.93 | 8.34 ± 0.66 | 7.70 ± 1.30 | ||
| Group B (Subjects with controlled hypertension) | Male | 8.37 ± 1.16 | 8.31 ± 1.38 | 8.22 ± 0.93 | 7.98 ± 0.92 | 0.308 |
| Female | 8.90 ± 0.23 | 8.62 ± 0.90 | 8.82 ± 0.91 | 8.32 ± 1.07 | ||
| Group C (Subjects with uncontrolled hypertension) | Male | 9.42 ± 1.25 | 9.05 ± 1.50 | 8.60 ± 0.66 | 8.12 ± 0.59 | 0.572 |
| Female | 10.37 ± 1.42 | 9.90 ± 0.28 | 10.10 ± 0.79 | 9.75 ± 1.04 | ||
| All groups | Male | 9.16 ± 1.42 | 8.46 ± 1.29 | 8.35 ± 0.91 | 7.81 ± 1.01 | 0.769 |
| Female | 9.71 ± 1.39 | 8.60 ± 1.16 | 8.52 ± 1.17 | 8.31 ± 1.30 |
Disclaimer/Publisher’s Note: The statements, opinions and data contained in all publications are solely those of the individual author(s) and contributor(s) and not of MDPI and/or the editor(s). MDPI and/or the editor(s) disclaim responsibility for any injury to people or property resulting from any ideas, methods, instructions or products referred to in the content. |
© 2023 by the authors. Licensee MDPI, Basel, Switzerland. This article is an open access article distributed under the terms and conditions of the Creative Commons Attribution (CC BY) license (https://creativecommons.org/licenses/by/4.0/).
Share and Cite
Jug, J.; Delalić, Đ.; Bralić Lang, V.; Bulum, T.; Prkačin, I. Prediabetes, Non-Dipping Profile and Hypertension—A Recipe for Increased Arterial Stiffness. Biomedicines 2023, 11, 1065. https://doi.org/10.3390/biomedicines11041065
Jug J, Delalić Đ, Bralić Lang V, Bulum T, Prkačin I. Prediabetes, Non-Dipping Profile and Hypertension—A Recipe for Increased Arterial Stiffness. Biomedicines. 2023; 11(4):1065. https://doi.org/10.3390/biomedicines11041065
Chicago/Turabian StyleJug, Juraj, Điđi Delalić, Valerija Bralić Lang, Tomislav Bulum, and Ingrid Prkačin. 2023. "Prediabetes, Non-Dipping Profile and Hypertension—A Recipe for Increased Arterial Stiffness" Biomedicines 11, no. 4: 1065. https://doi.org/10.3390/biomedicines11041065