
Measurement of Aβ Amyloid Plaques and Tau Protein in Postmortem Human Alzheimer’s Disease Brain by Autoradiography Using [18F]Flotaza, [125I]IBETA, [124/125I]IPPI and Immunohistochemistry Analysis Using QuPath

 ,
, 
Abstract
:1. Introduction
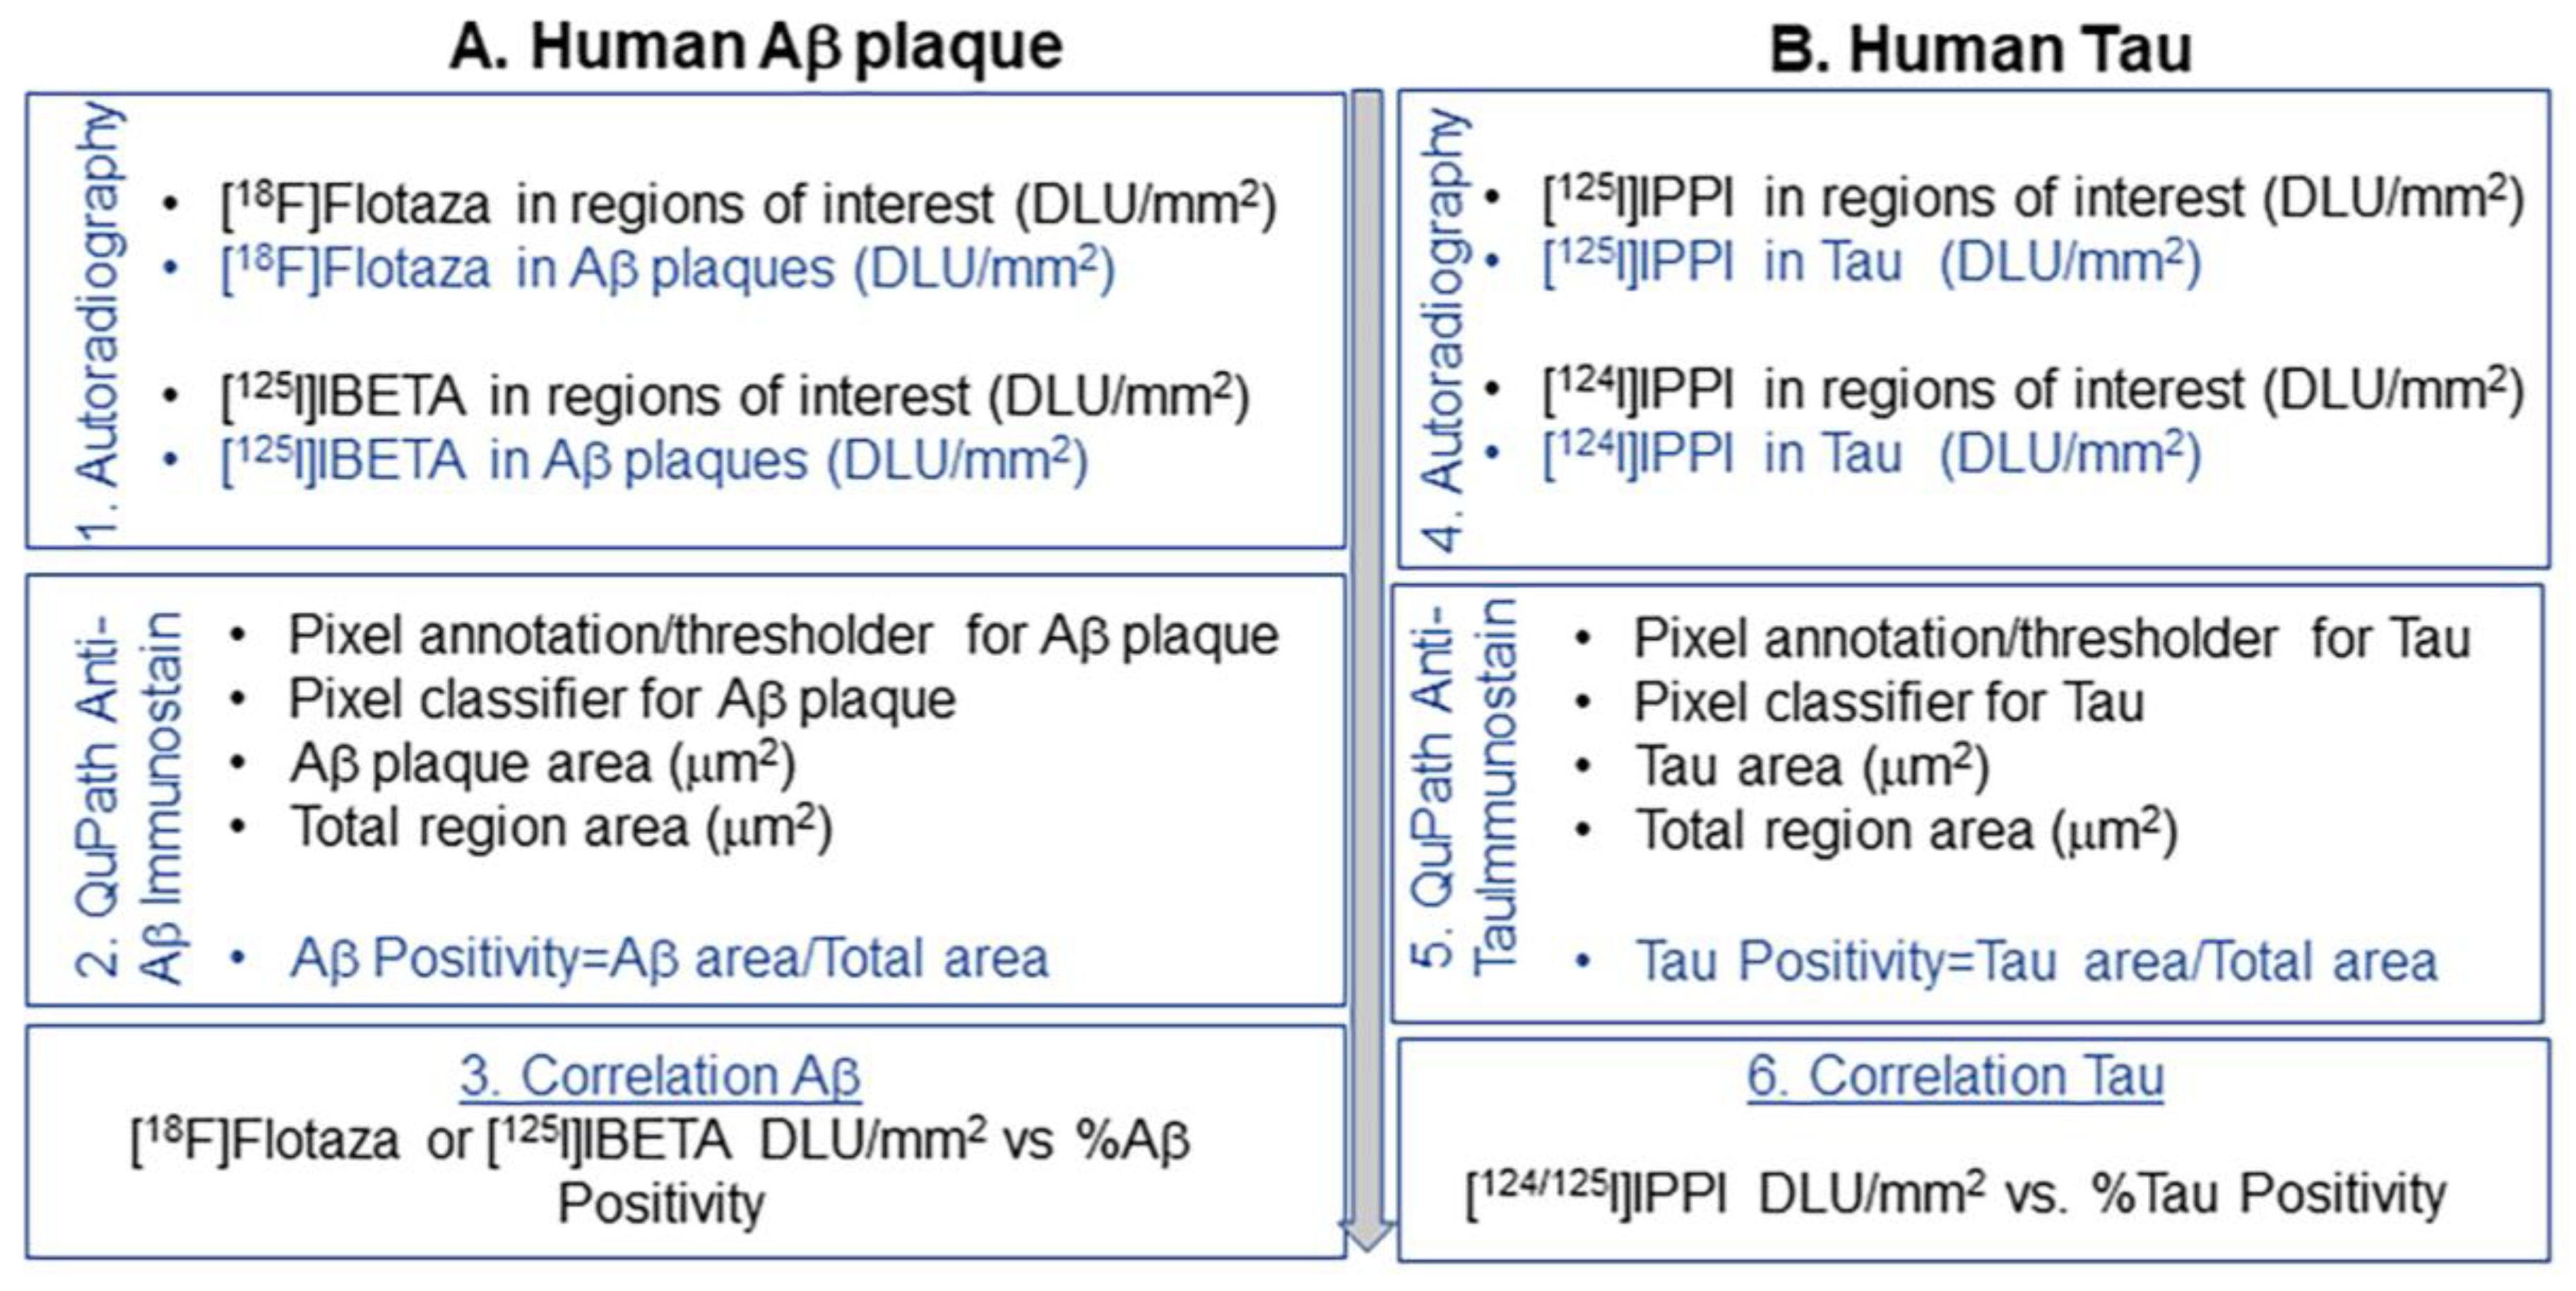
2. Materials and Methods
2.1. General Methods
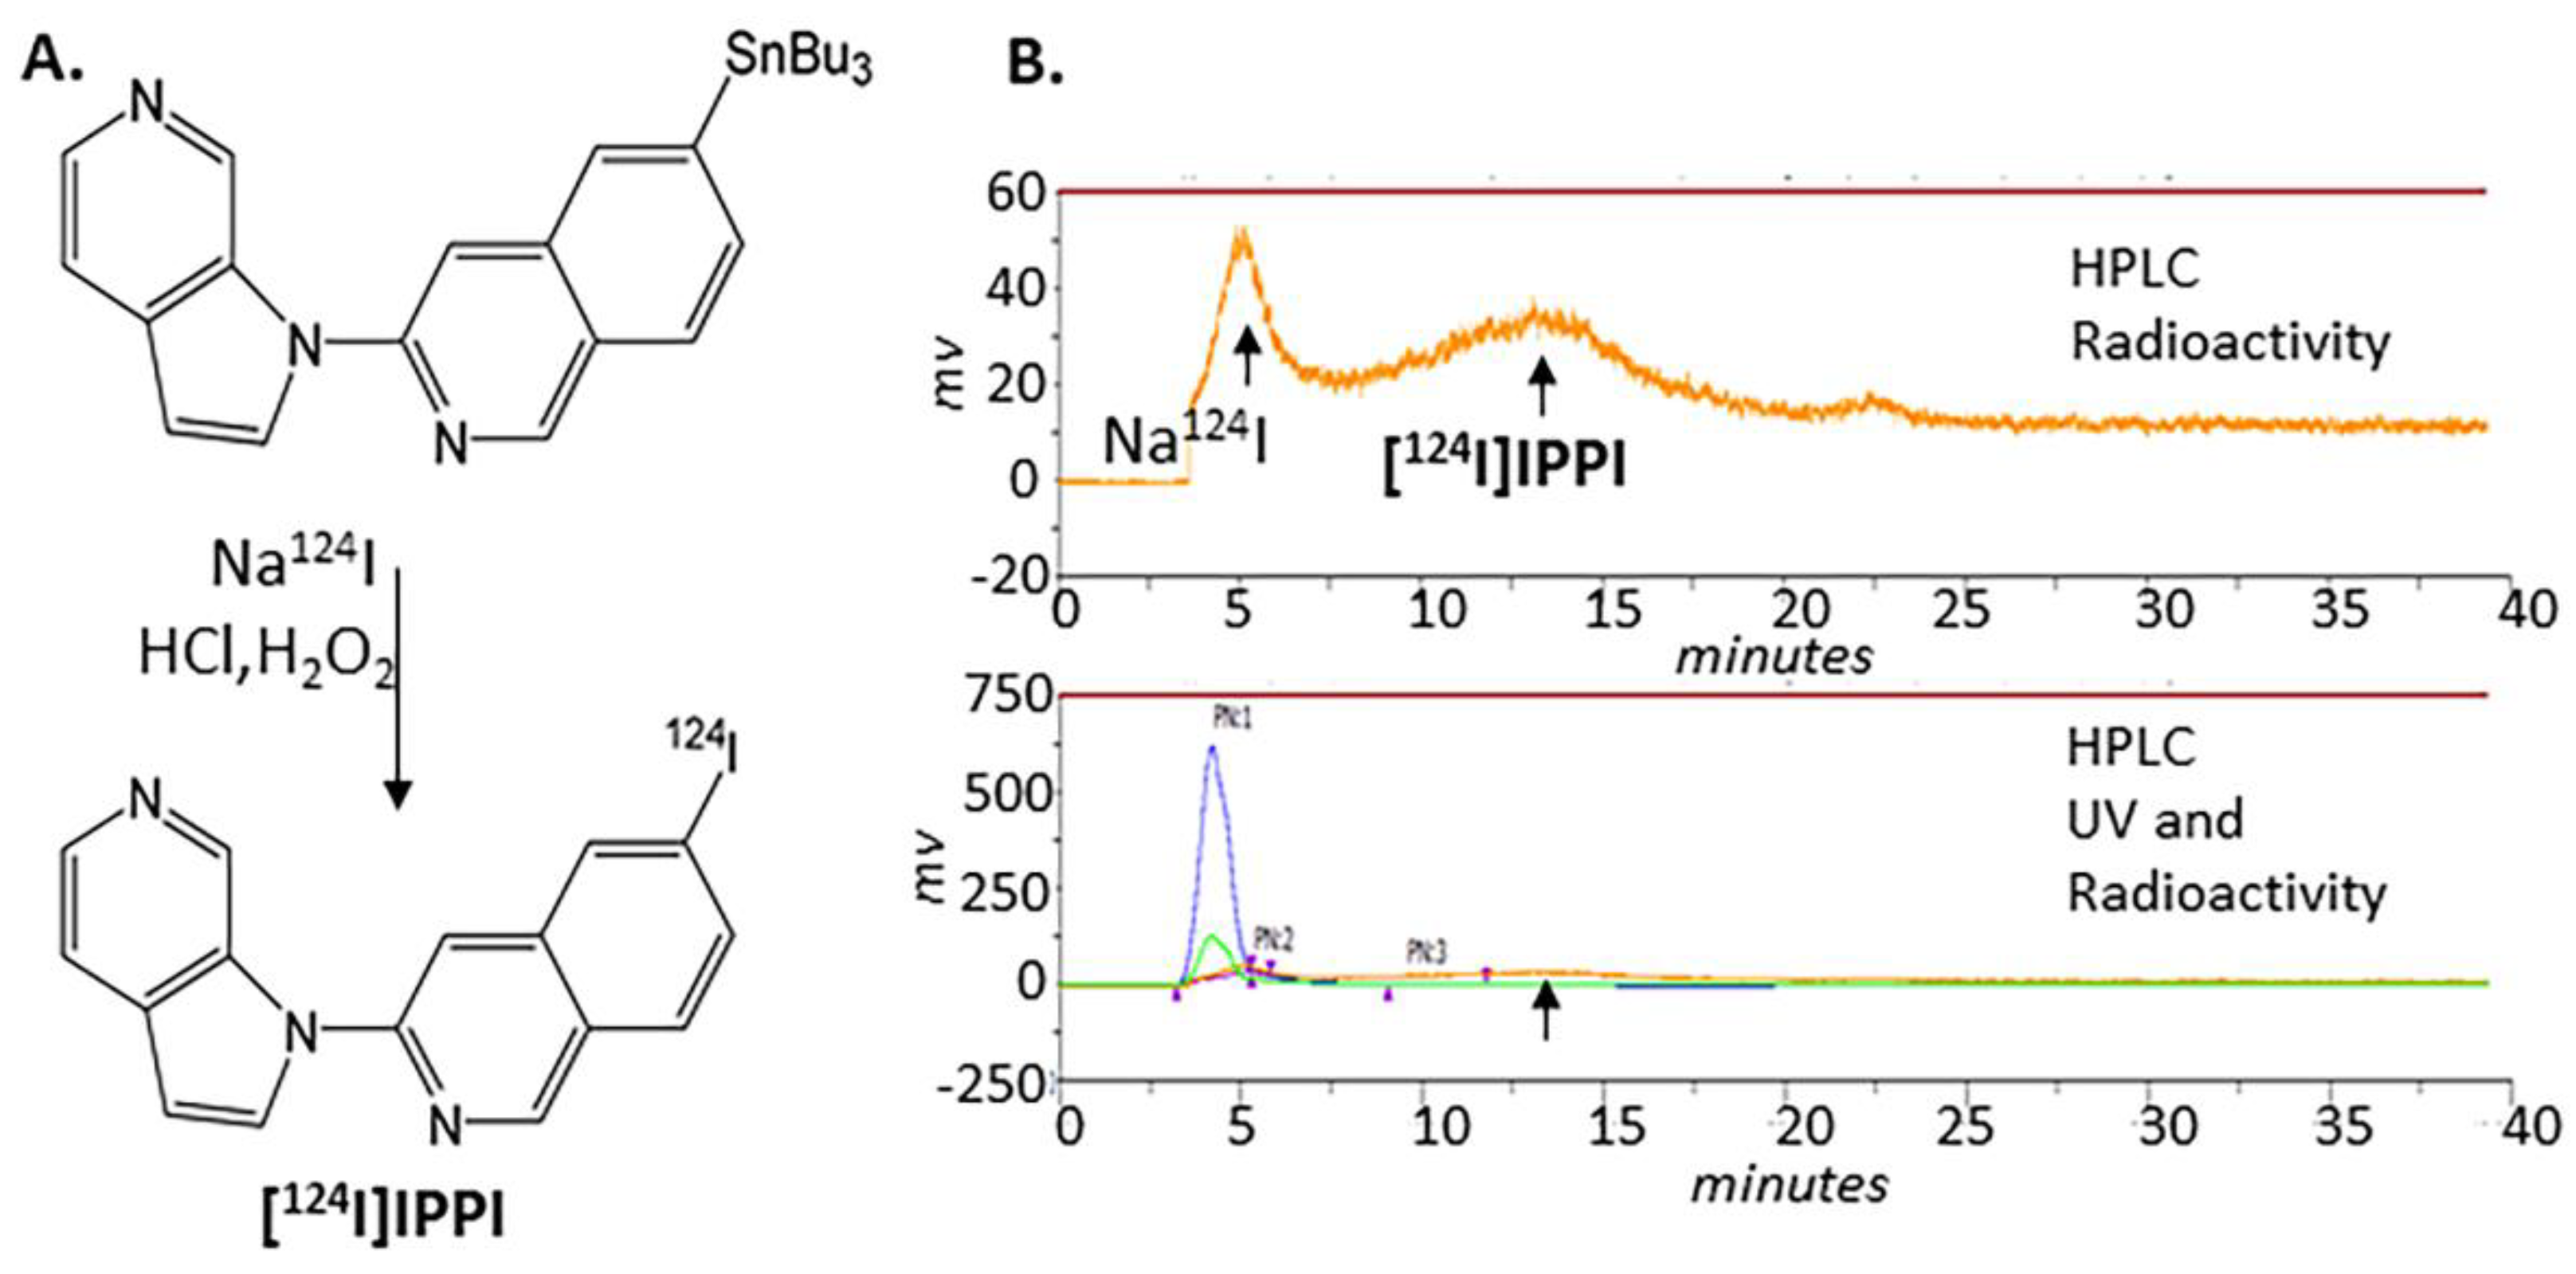
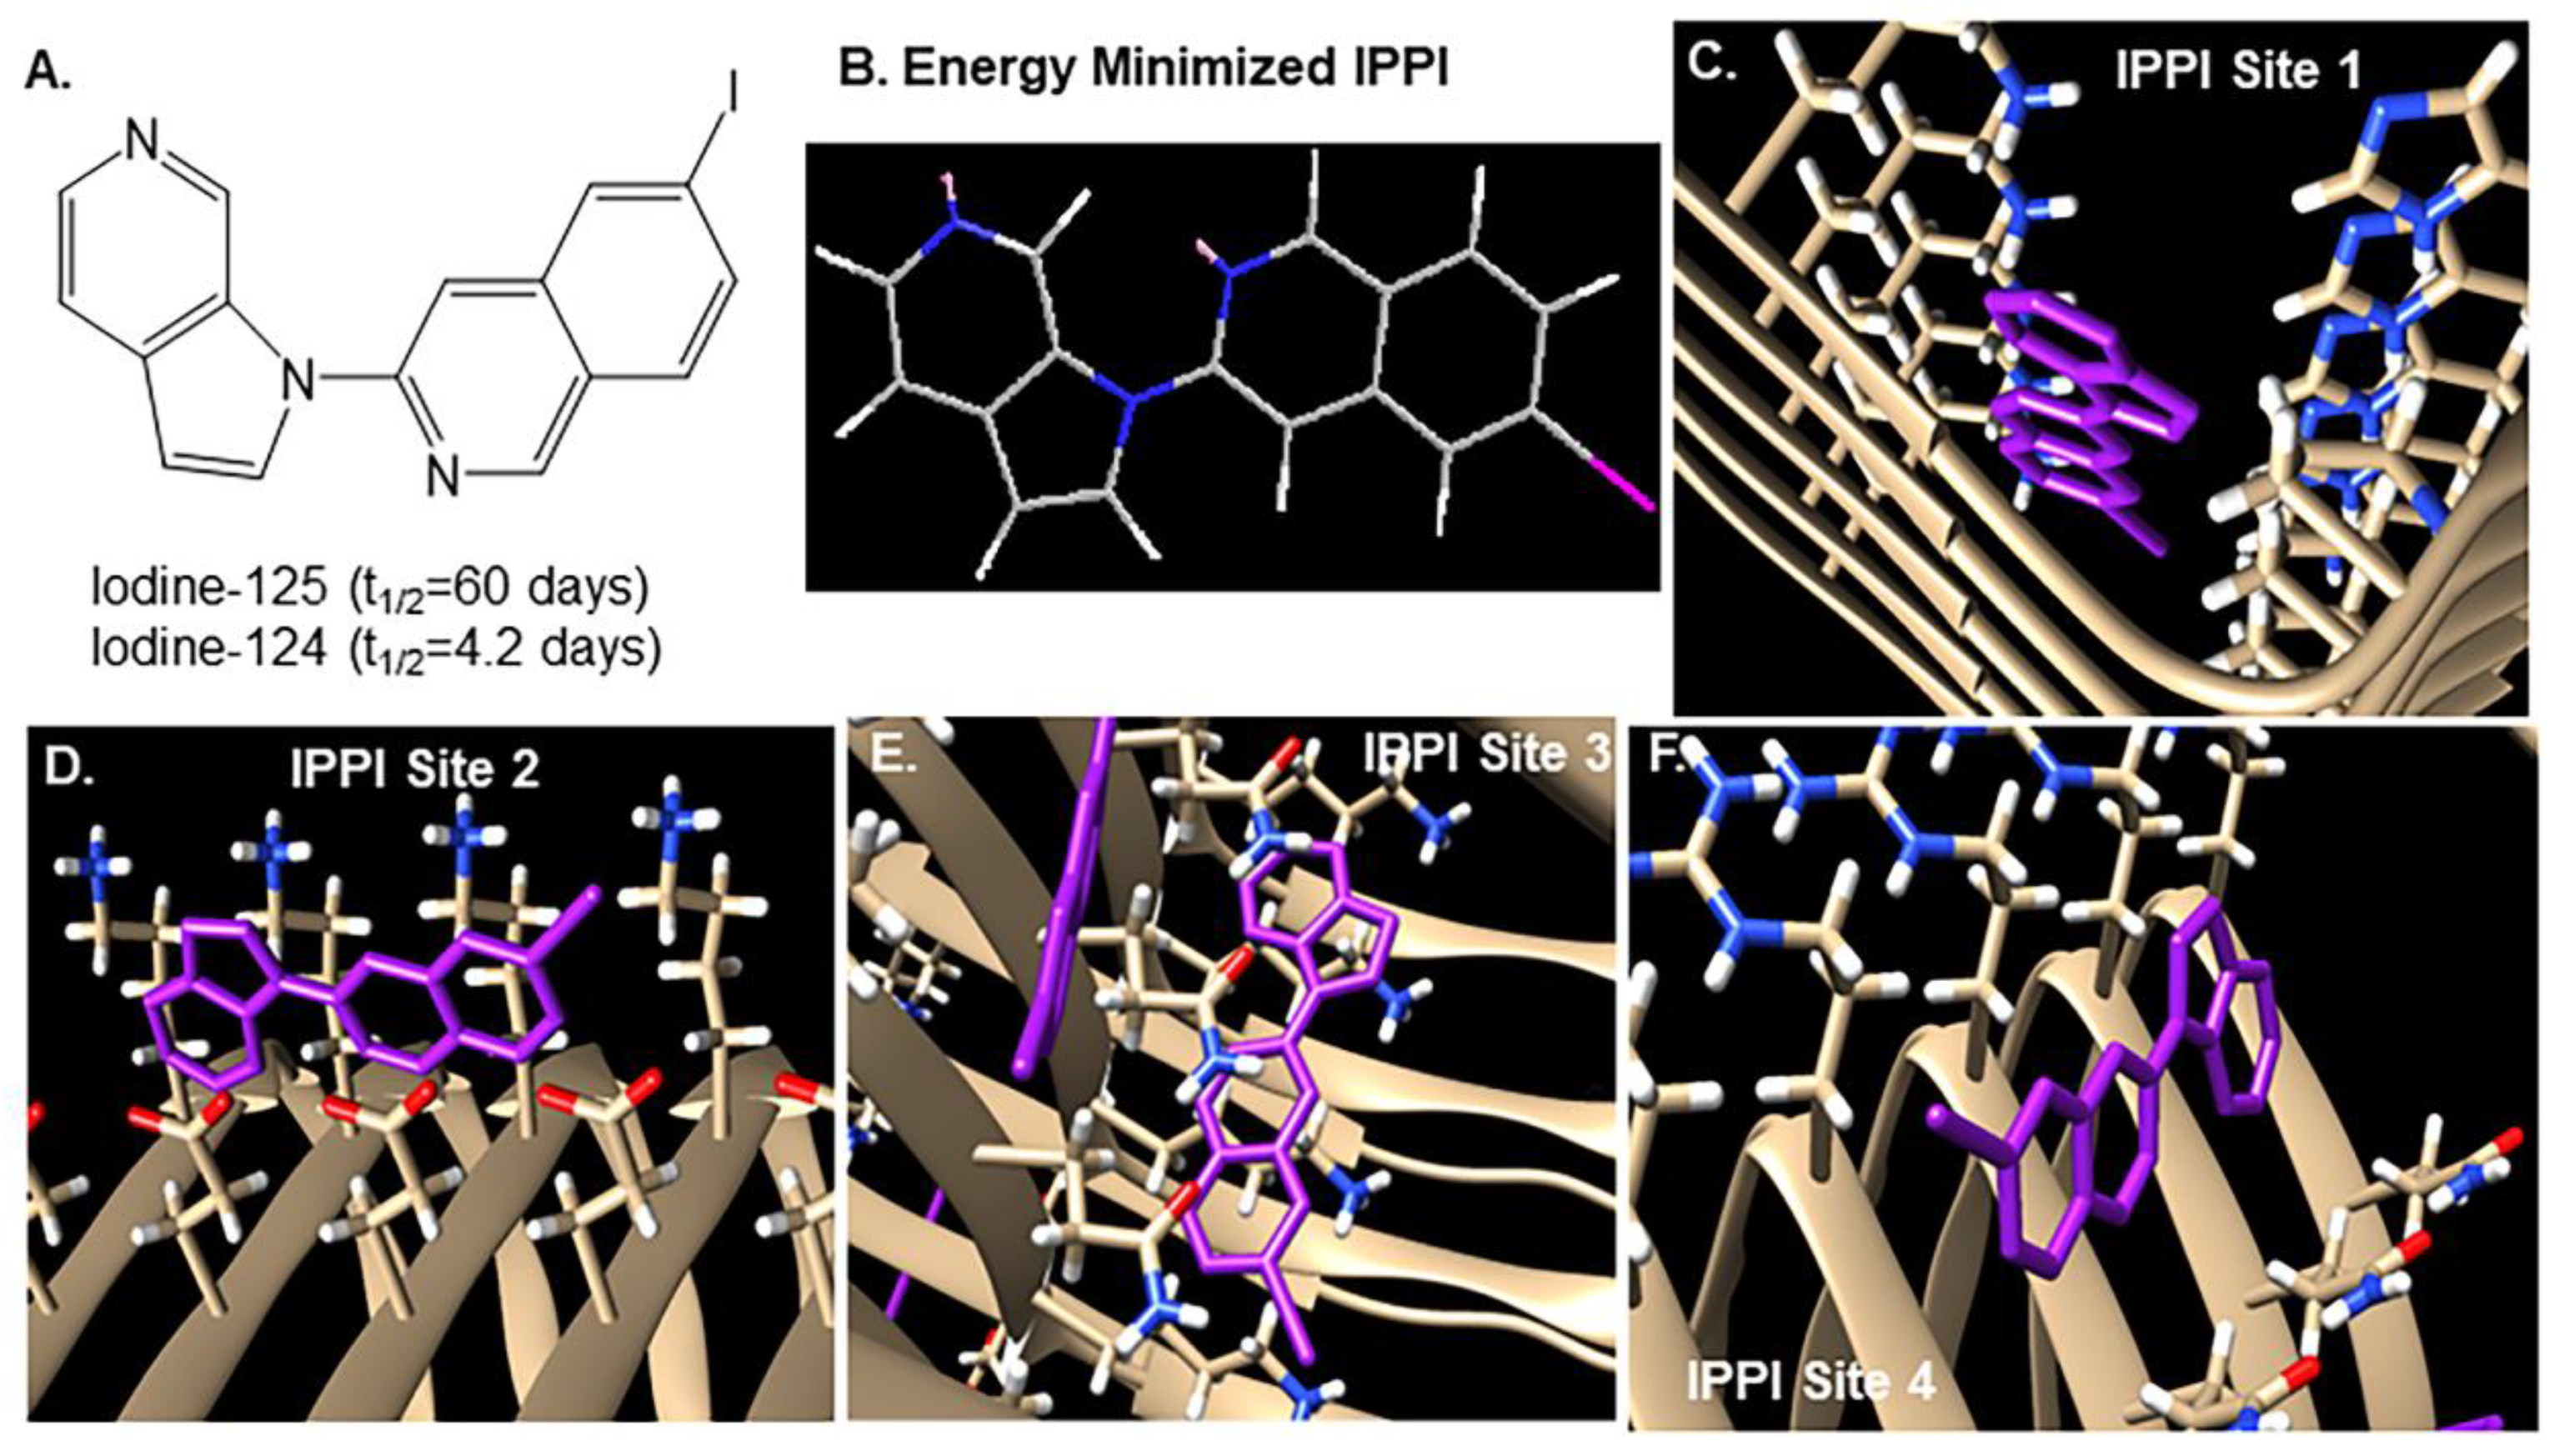
2.2. Radiosynthesis of [124I]IPPI
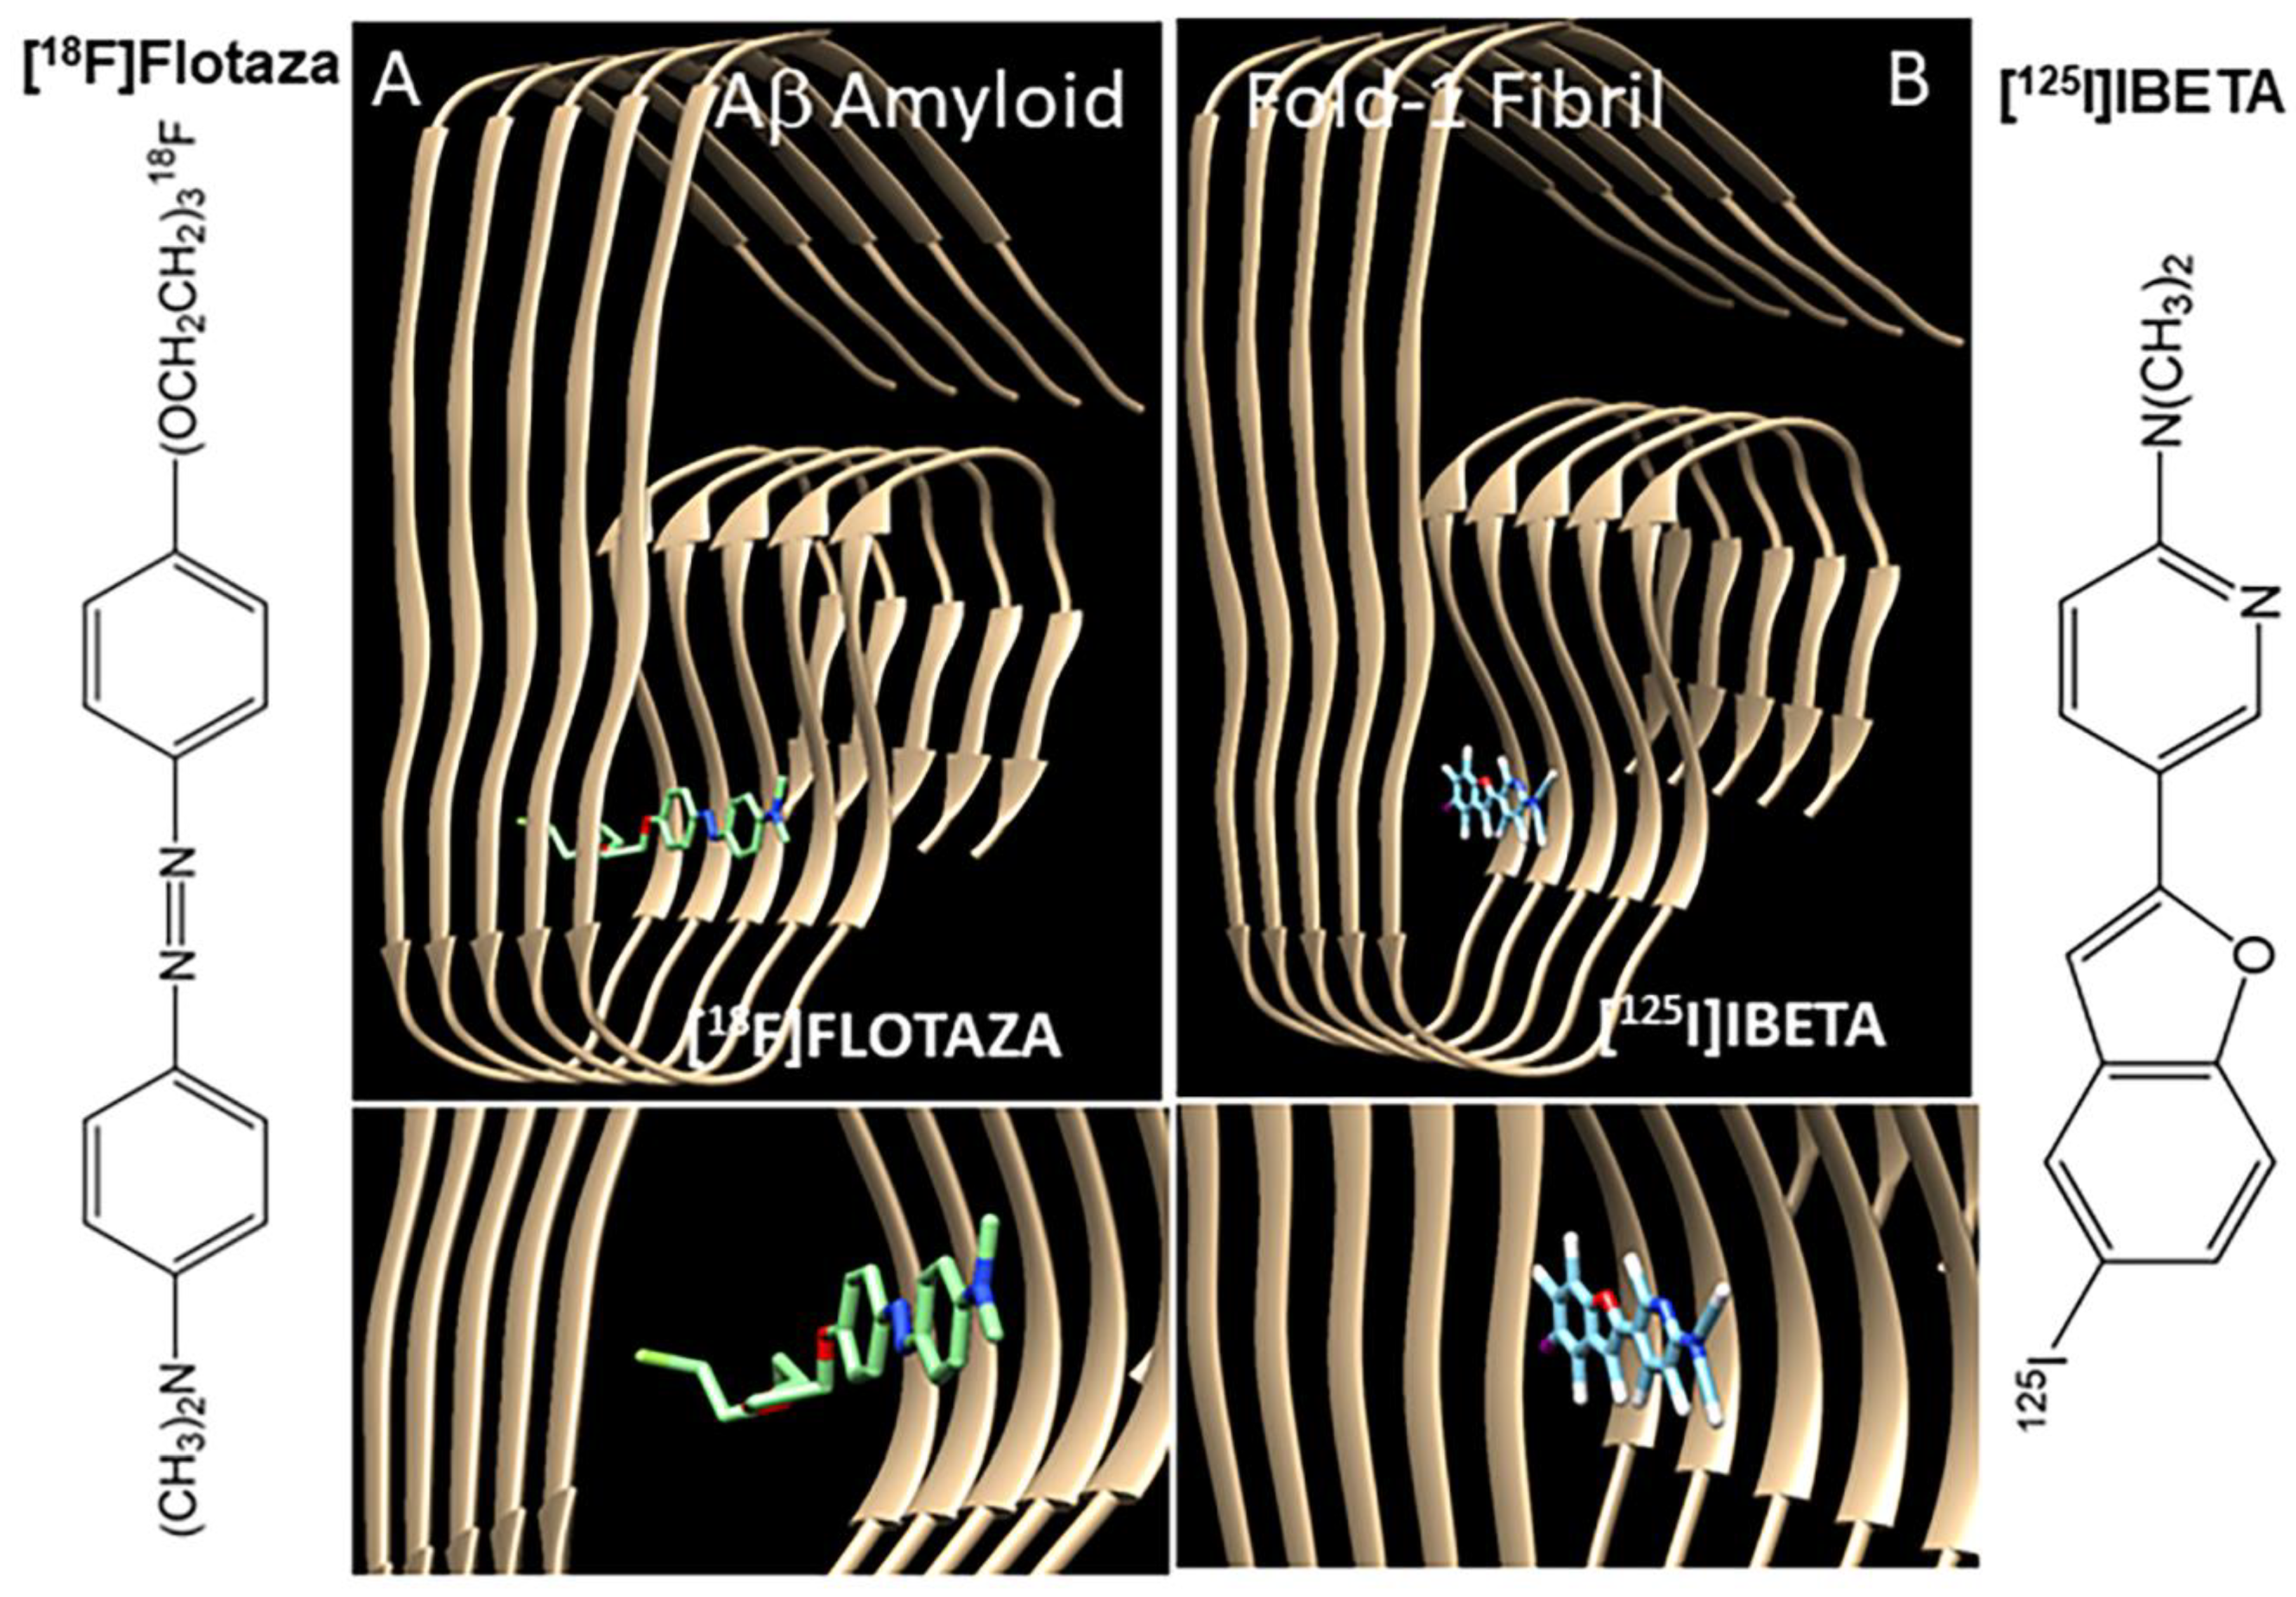
2.3. Molecular Models
2.4. Subjects
2.5. Immunohistochemistry
2.6. Autoradiography
2.6.1. [18F]Flotaza for Aβ
2.6.2. [125I]IBETA for Aβ Plaques
2.6.3. [125I]IPPI and [124I]IPPI for Tau
2.7. Optiquant Image Analysis
2.8. QuPath Image Analysis
3. Results
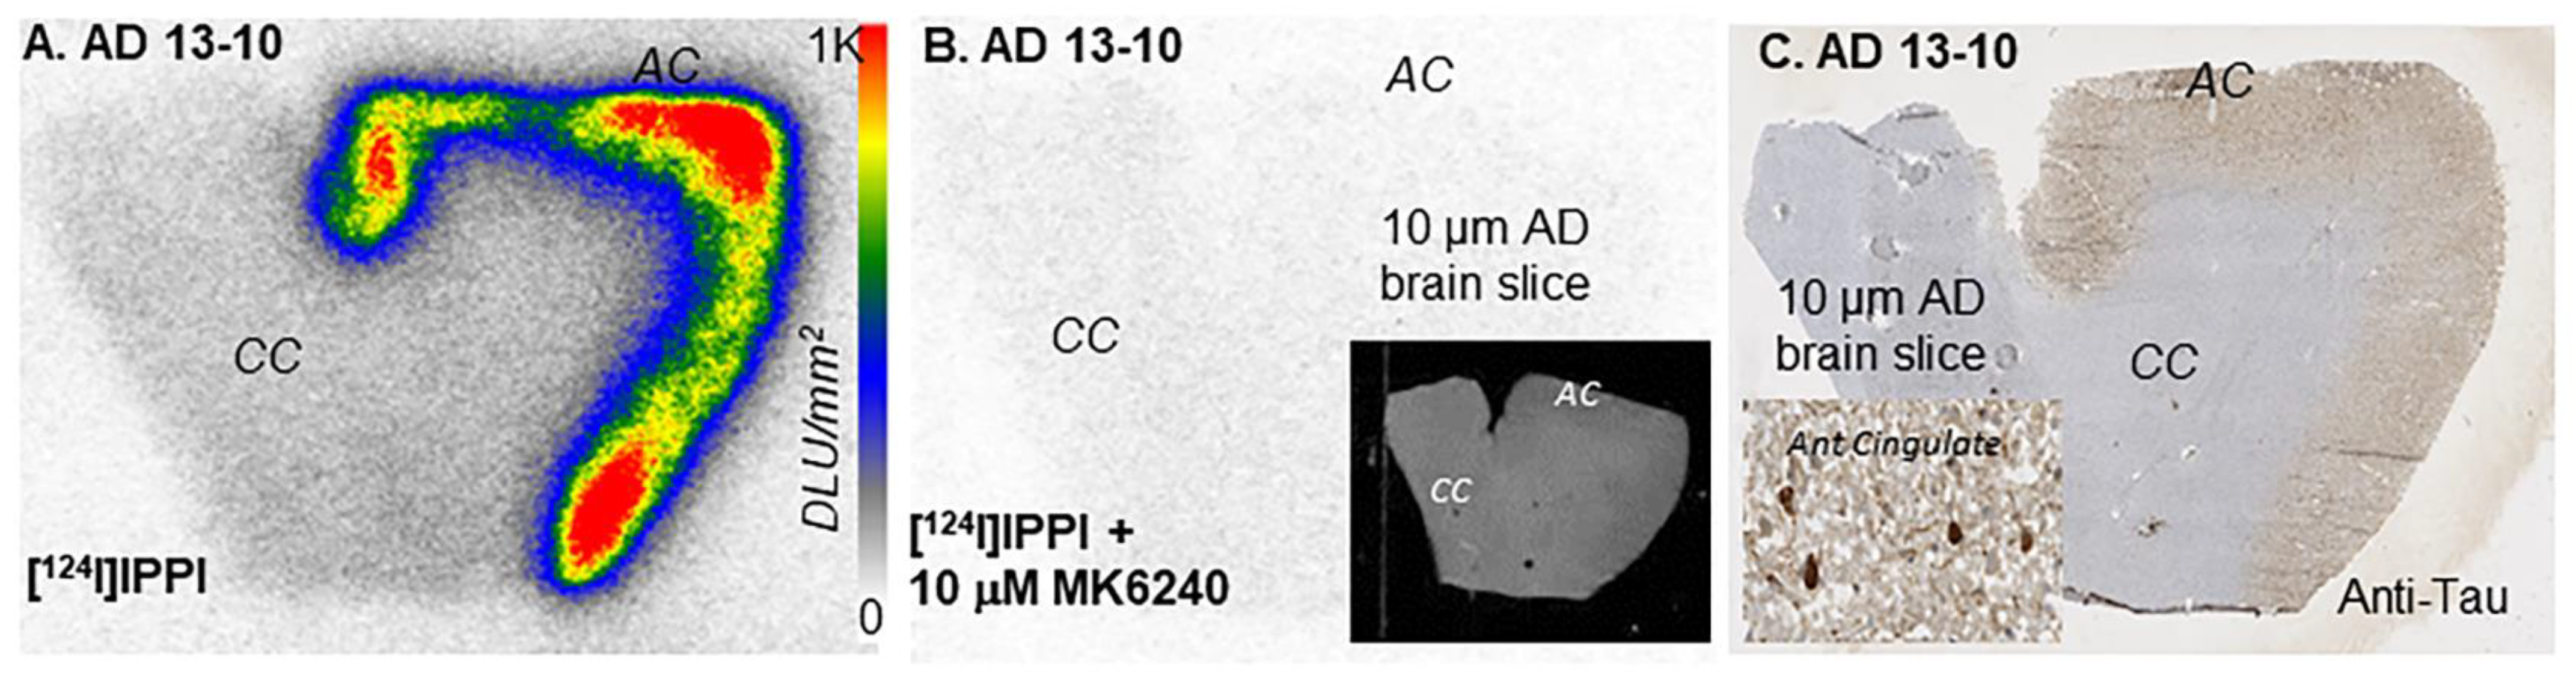
3.1. [124I]IPPI
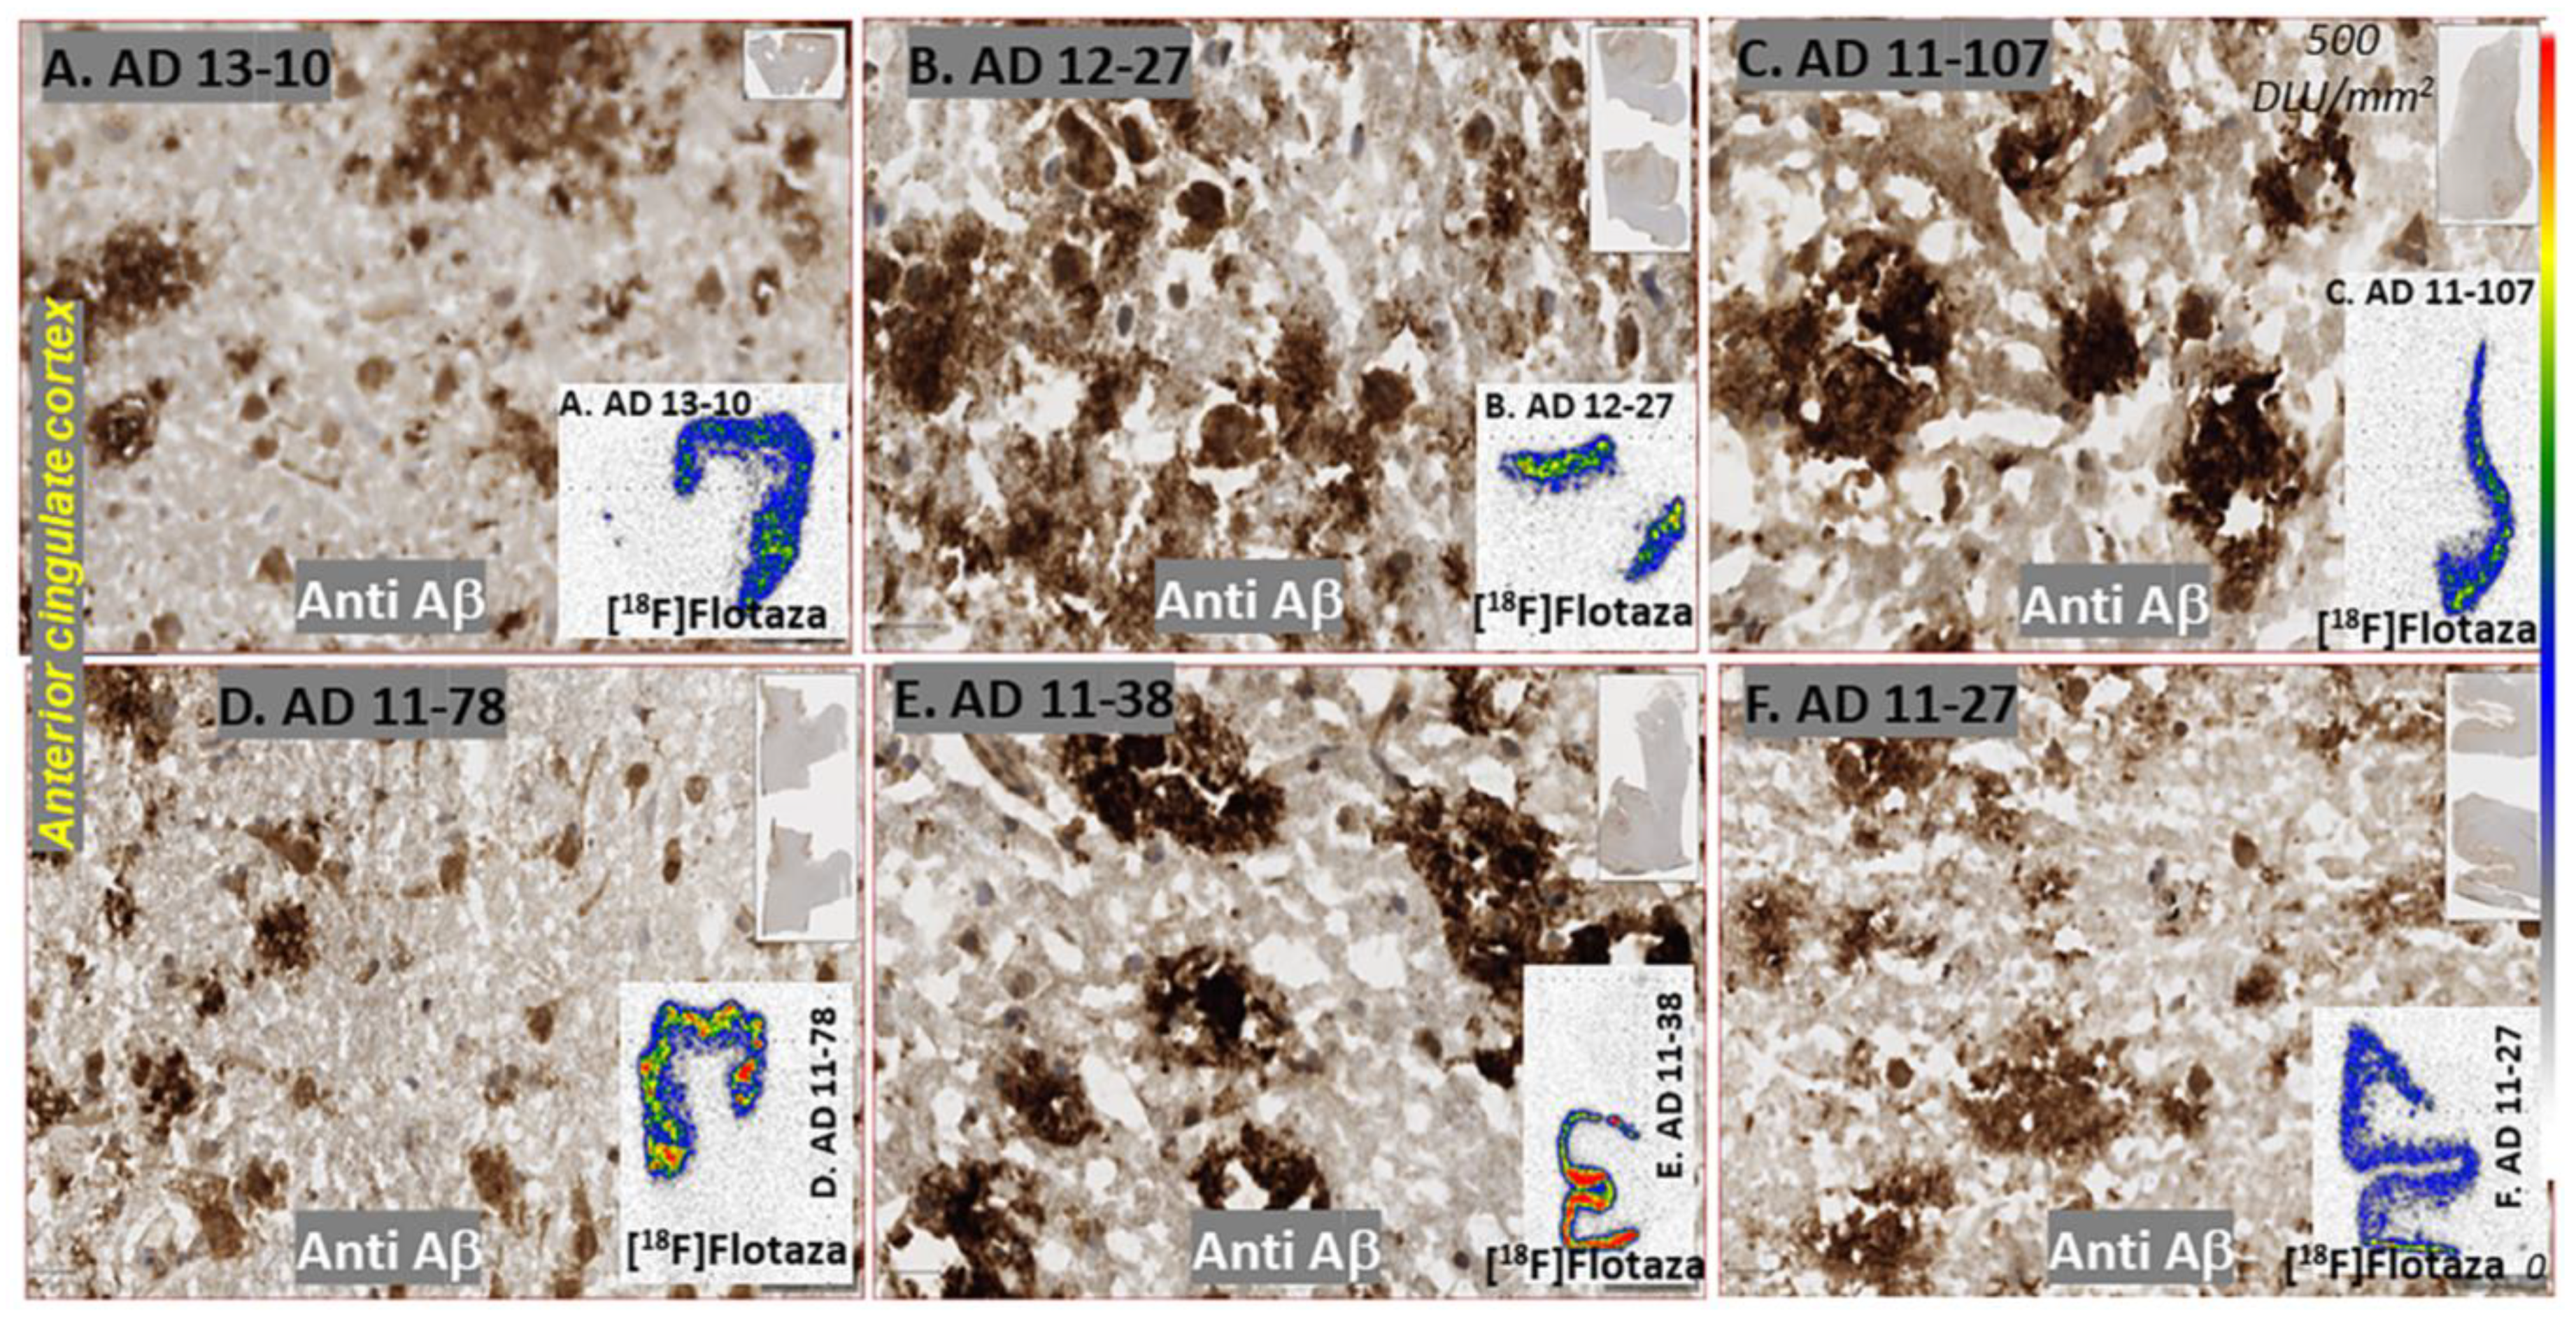
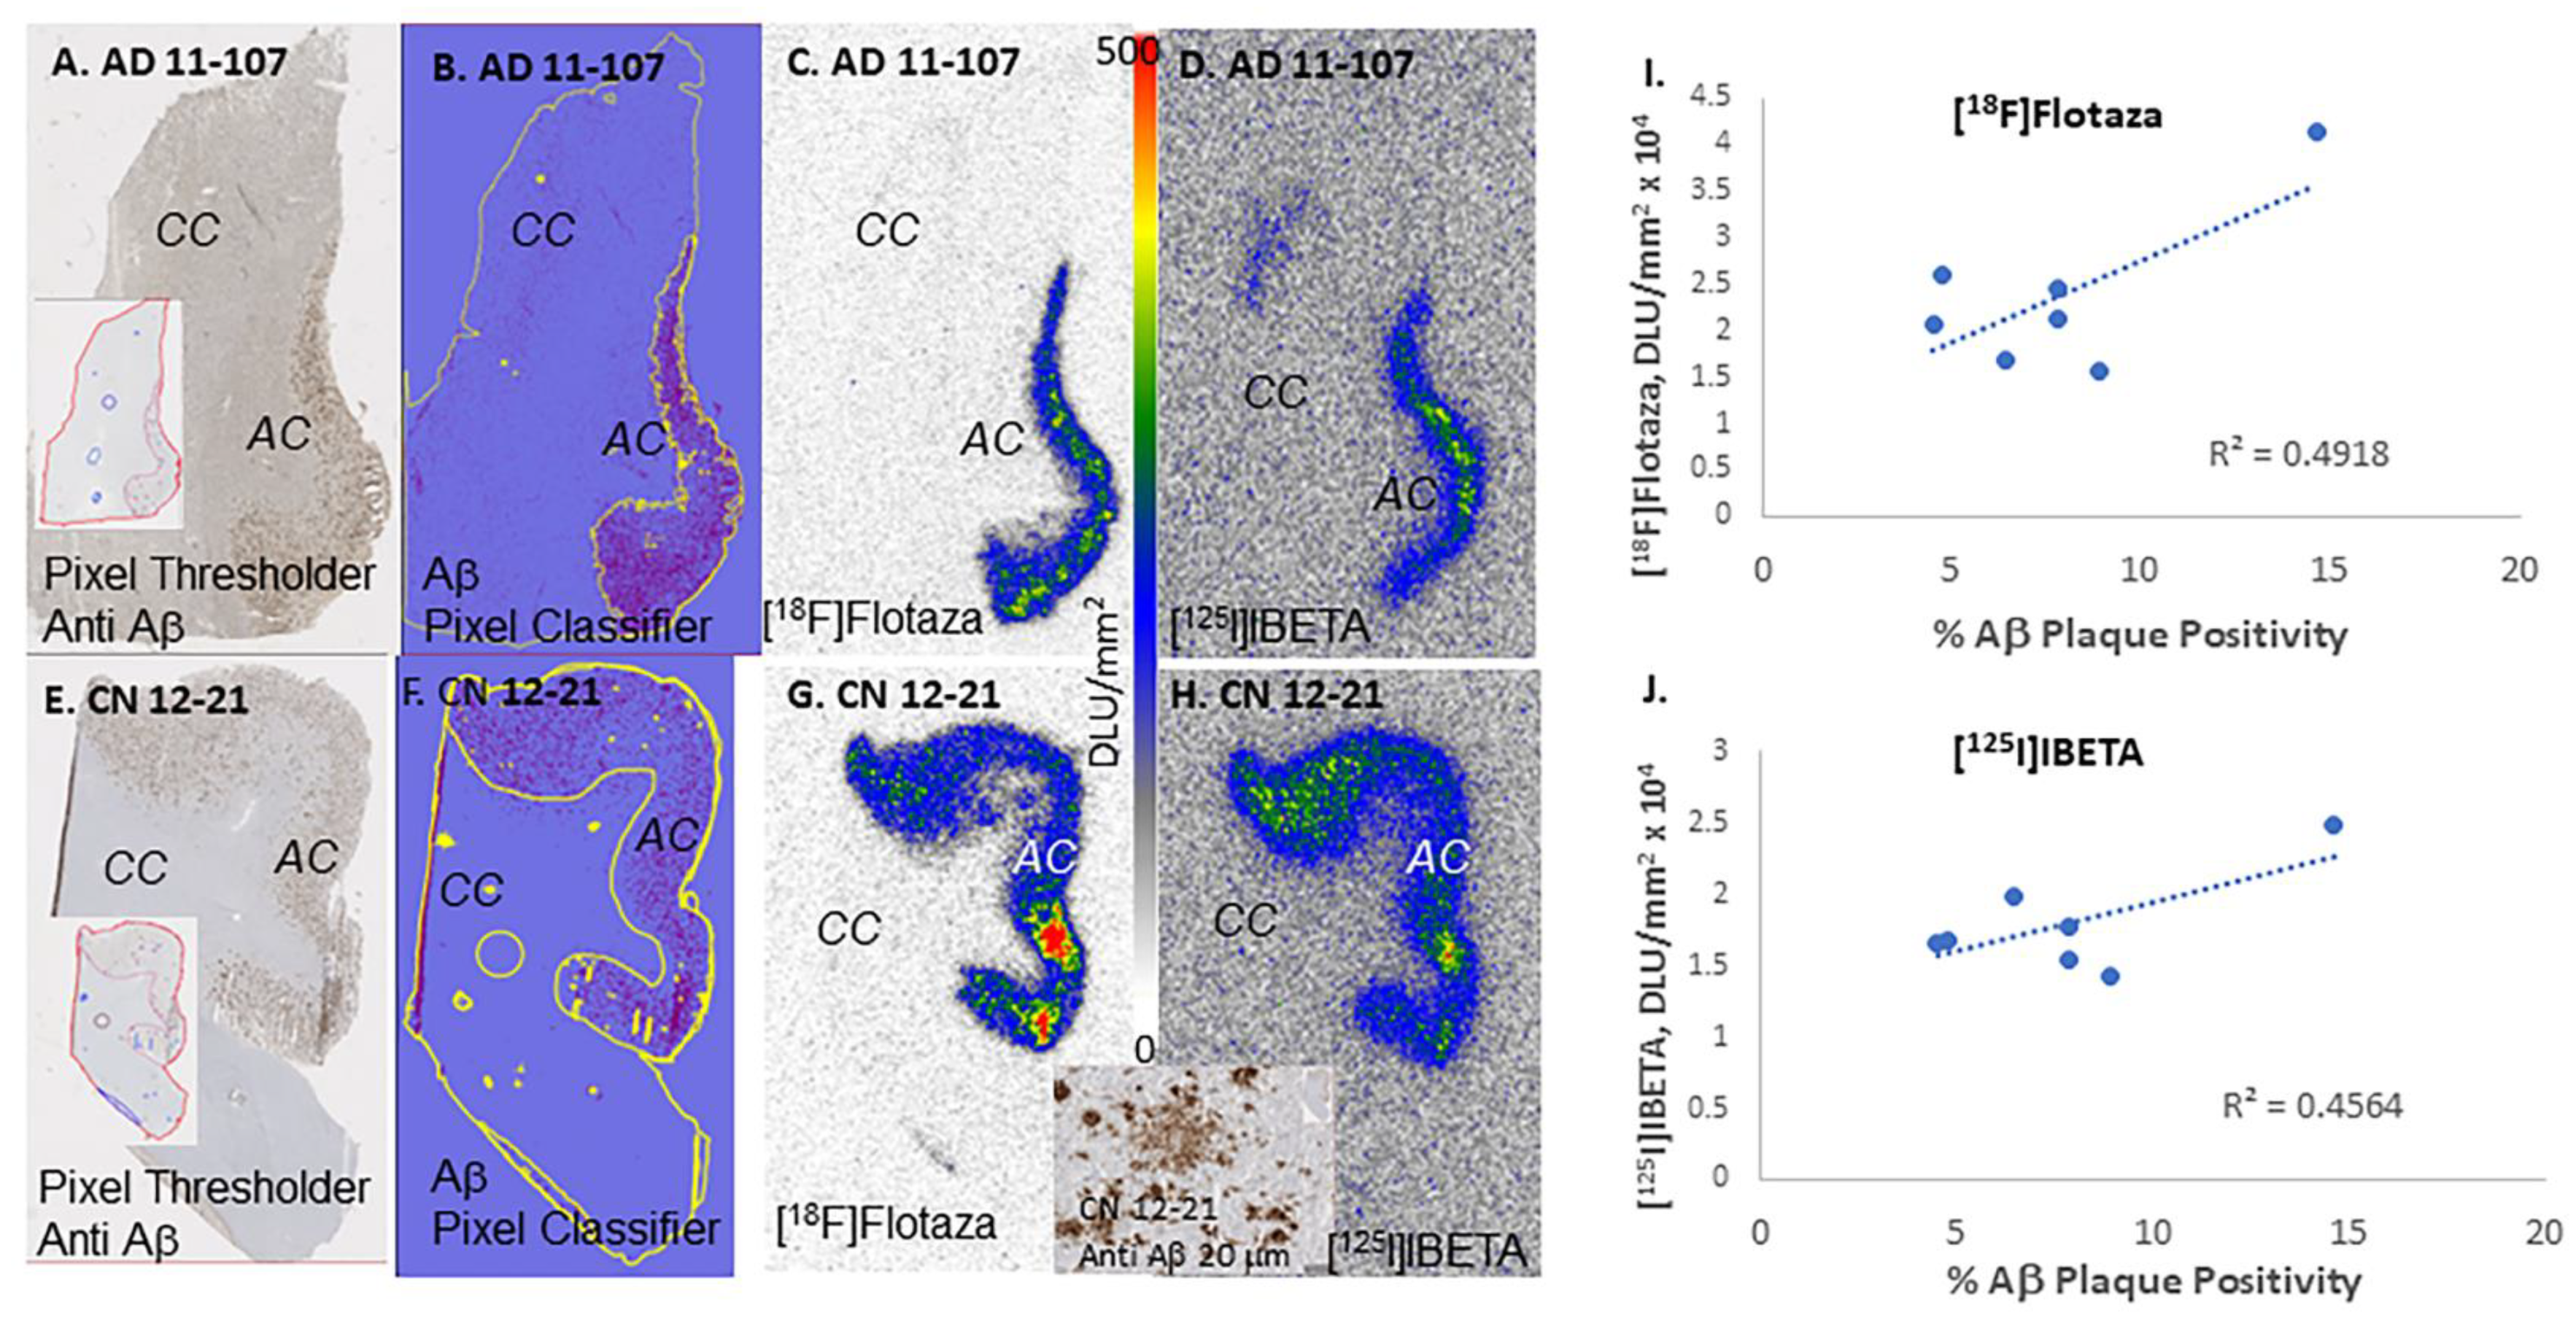
3.2. Aβ Plaques Human Anterior Cingulate
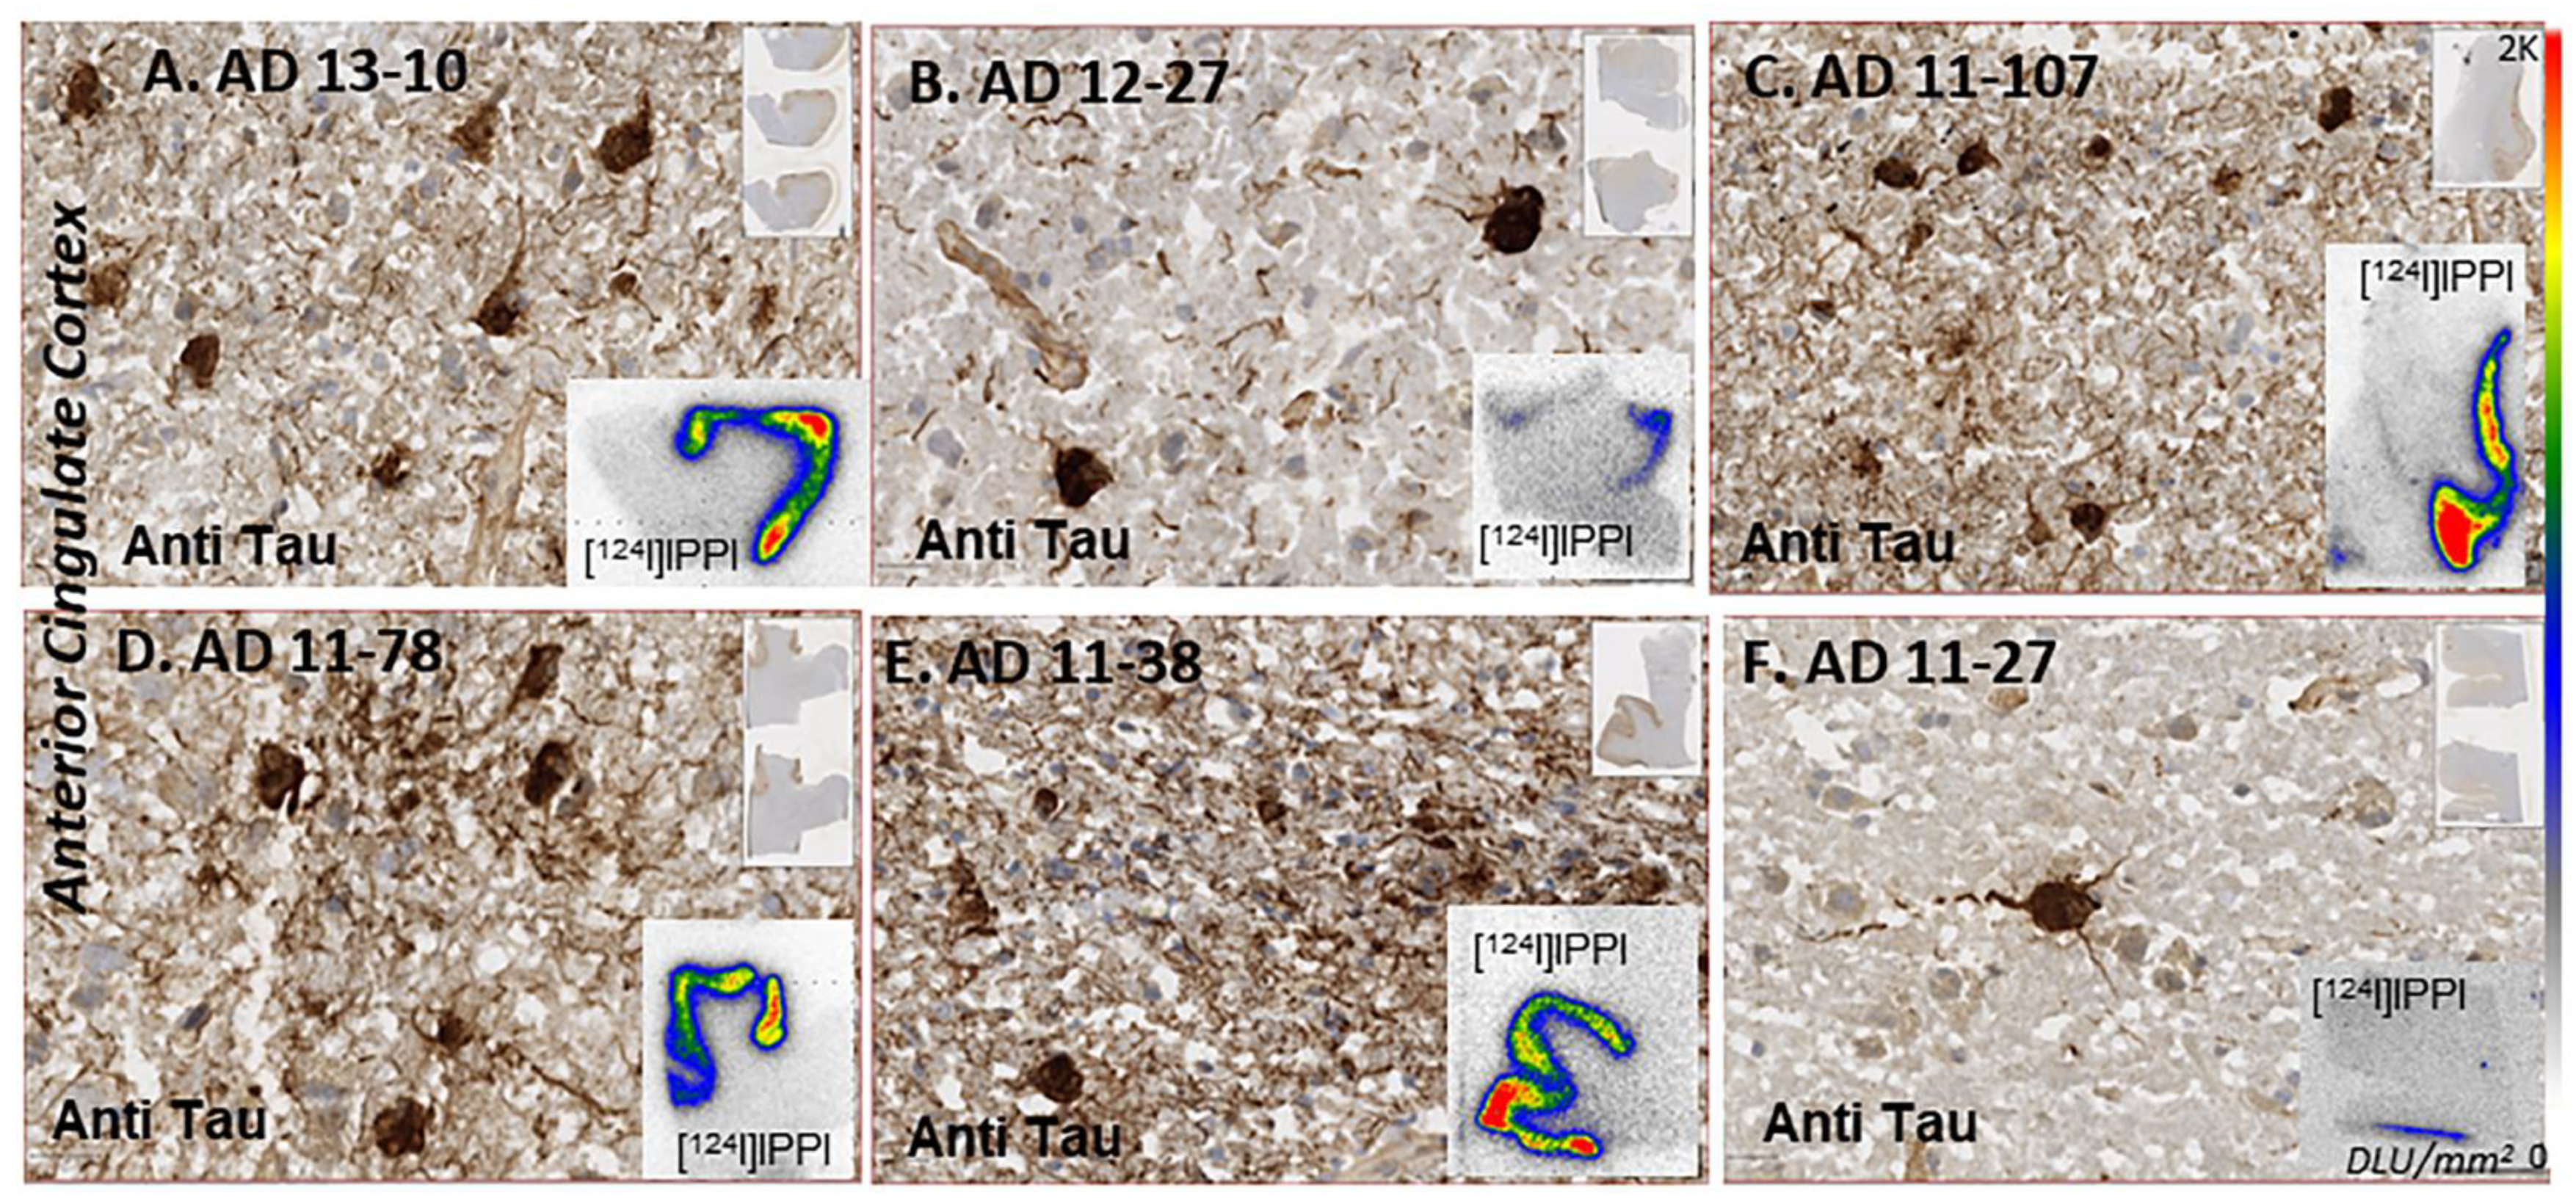
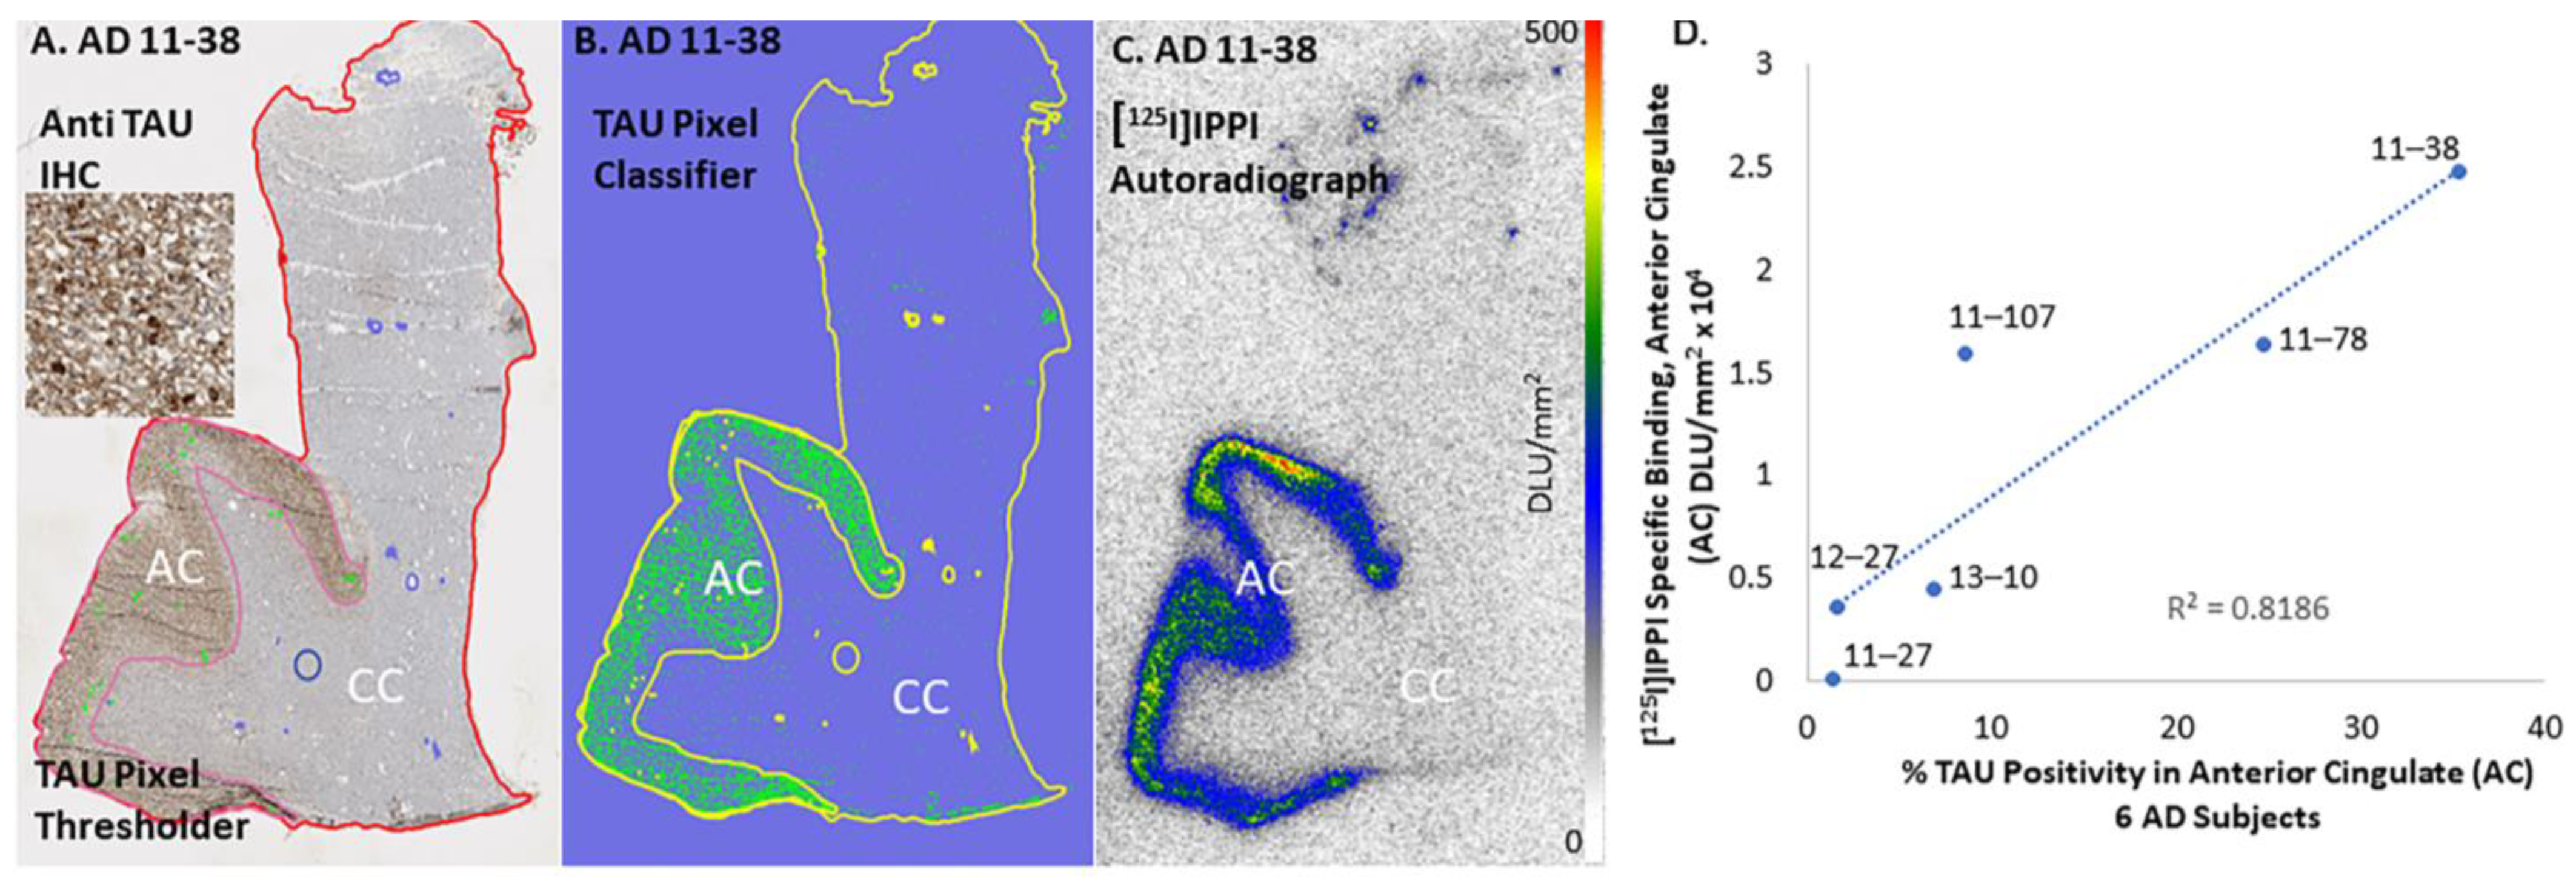
3.3. Tau Human Anterior Cingulate
4. Discussion
5. Conclusions
Author Contributions
Funding
Institutional Review Board Statement
Informed Consent Statement
Data Availability Statement
Acknowledgments
Conflicts of Interest
References
- Braak, H.; Thal, D.R.; Ghebremedhin, E.; Del Tredici, K. Stages of the Pathologic Process in Alzheimer’s Disease: Age Categories From 1 to 100 Years. J. Neuropathol. Exp. Neurol. 2011, 70, 960–969. [Google Scholar] [CrossRef] [PubMed]
- Beach, T.G.; Adler, C.H.; Sue, L.I.; Serrano, G.; Shill, H.A.; Walker, D.G.; Lue, L.; Roher, A.E.; Dugger, B.N.; Maarouf, C.; et al. Arizona Study of Aging and Neurodegenerative Disorders and Brain and Body Donation Program. Neuropathology 2015, 35, 354–389. [Google Scholar] [CrossRef] [PubMed] [Green Version]
- Villemagne, V.L.; Dore, V.; Burnham, S.C.; Masters, C.L.; Rowe, C. Imaging tau and amyloid-β proteinopathies in Alzheimer’s disease and other conditions. Nat. Rev. Neurol. 2018, 14, 225–236. [Google Scholar] [CrossRef]
- Chapleau, M.; Iaccarino, L.; Soleimani-Meigooni, D.; Rabinovici, G.D. The Role of Amyloid PET in Imaging Neurodegenerative Disorders: A Review. J. Nucl. Med. 2022, 63 (Suppl. S1), 13S–19S. [Google Scholar] [CrossRef]
- Cherry, J.D.; Esnault, C.D.; Baucom, Z.H.; Tripodis, Y.; Huber, B.R.; Alvarez, V.E.; Stein, T.D.; Dickson, D.W.; Mckee, A.C. Tau isoforms are differently expressed across the hippocampus in chronic traumatic encephalopathy and Alzheimer’s disease. Acta Neuropathol. Commun. 2021, 9, 86. [Google Scholar] [CrossRef]
- Vizcarra, J.C.; Gearing, M.; Keiser, M.J.; Glass, J.D.; Duggar, B.N.; Gutman, D.A. Validation of machine learning models to detect amyloid pathologies across institutions. Acta Neuropathol. Commun. 2020, 8, 59. [Google Scholar] [CrossRef] [PubMed]
- Willroider, M.; Roeber, S.; Horn, A.K.E.; Arzberger, T.; Scheifele, M.; Respondek, G.; Sabri, O.; Barthel, H.; Patt, M.; Mishchenko, O.; et al. Superiority of Formalin-Fixed Paraffin-Embedded Brain Tissue for in vitro Assessment of Progressive Supranuclear Palsy Tau Pathology With [18F]PI-2620. Front. Neurol. 2021, 12, 684523. [Google Scholar] [CrossRef] [PubMed]
- Dunn, W.D.; Gearing, M.; Park, Y.; Zhang, L.; Hanfelt, J.; Glass, J.D.; Gutman, D.A. Applicability of digital analysis and imaging technology in neuropathology assessment. Neuropathology 2016, 36, 270–282. [Google Scholar] [CrossRef] [Green Version]
- Mukherjee, J.; Liang, C.; Patel, K.K.; Lam, P.Q.; Mondal, R. Development and evaluation [125I]IPPI for tau imaging in post-mortem human Alzheimer’s disease brain. Synapse 2021, 74, e22183. [Google Scholar]
- Kaur, H.; Felix, M.R.; Liang, C.; Mukherjee, J. Development and evaluation [18F]Flotaza for Aβ plaque imaging in post-mortem Alzheimer’s disease brain. Bioorg. Med. Chem. Lett. 2021, 46, 128164. [Google Scholar] [CrossRef]
- Nguyen, G.A.H.; Liang, C.; Mukherjee, J. [124I]IBETA, a new Aβ amyloid plaque PET imaging agent for Alzheimer’s disease. Molecules 2022, 27, 4552. [Google Scholar] [CrossRef] [PubMed]
- Mukherjee, J.; Ladwa, R.M.; Liang, C.; Syed, A.U. Elevated monoamine oxidase-A in anterior cingulate of postmortem human Parkinson’s disease: A potential surrogate biomarker for Lewy bodies? Cells 2022, 11, 4000. [Google Scholar] [CrossRef] [PubMed]
- Reddy, T.T.; Iguban, M.H.; Melkonyan, L.; Shergill, J.; Liang, C.; Mukherjee, J. Development and evaluation of [124/125I]IAZA as a new proteinopathy imaging agent for Alzheimer’s disease. Molecules 2023, 28, 865. [Google Scholar] [CrossRef]
- Aguero, C.; Dhaynaut, M.; Normandin, M.D.; Amaral, A.C.; Guehl, N.J.; Neelamegam, R.; Marquie, M.; Johnson, K.A.; El Fakhri, G.; Frosch, M.P.; et al. Autoradiography validation of novel tau PET tracer [F-18]-MK-6240 on human postmortem brain tissue. Acta Neuropathol. Commun. 2019, 7, 37. [Google Scholar] [CrossRef] [PubMed]
- Liang, C.; Nguyen, G.A.H.; Danh, T.B.; Sandhu, A.K.; Melkonyan, L.L.; Syed, A.U.; Mukherjee, J. Abnormal [ 18 F]NIFENE binding in transgenic 5xFAD mouse model of Alzheimer’s disease: In vivo PET/CT imaging studies of α4β2* nicotinic acetylcholinergic receptors and in vitro correlations with Aβ plaques. Synapse 2023, 77, e22265. [Google Scholar] [CrossRef]
- Dickson, T.C.; Vickers, J.C. The morphological phenotype of b-amyloid plaques and associated neuritic changes in Alzheimer’s disease. Neuroscience 2001, 105, 99–107. [Google Scholar] [CrossRef]
- Serrano-Pozo, A.; Frosch, M.P.; Masliah, E.; Hyman, B.T. Neuropathological alterations in Alzhemer’s disease. Cold Spring Harb Perspect Med. 2011, 1, a006189. [Google Scholar] [CrossRef] [Green Version]
- Sjogren, M.; Davidsson, P.; Tullberg, M.; Minthon, L.; Wallin, A.; Wikkelso, C.; Granérus, A.-K.; Vanderstichele, H.; Vanmechelen, E.; Blennow, K. Both total and phosphorylated tau are increased in Alzheimer’s disease. J. Neurol. Neurosurg. Psychiatry 2001, 70, 624–630. [Google Scholar] [CrossRef] [Green Version]
- Groot, C.; Villeneuve, S.; Smith, R.; Hansson, O.; Ossenkoppele, R. Tau PET Imaging in Neurodegenerative Disorders. J. Nucl. Med. 2022, 63 (Suppl. S1), 20S–26S. [Google Scholar] [CrossRef]
- Bankhead, P.; Loughrey, M.B.; Fernández, J.A.; Dombrowski, Y.; McArt, D.G.; Dunne, P.D.; McQuaid, S.; Gray, R.T.; Murray, L.J.; Coleman, H.G.; et al. QuPath: Open source software for digital pathology image analysis. Sci. Rep. 2017, 7, 16878. [Google Scholar] [CrossRef] [Green Version]
- DeTrue, M.A.; Dickson, D.W. The neuropathological diagnosis of Alzheimer’s disease. Mol. Neurodegener. 2019, 14, 32. [Google Scholar] [CrossRef] [Green Version]
- Trott, O.; Olson, A.J. AutoDock Vina: Improving the speed and accuracy of docking with a new scoring function, efficient optimization, and multithreading. J. Comput. Chem. 2010, 31, 455–461. [Google Scholar] [CrossRef] [PubMed] [Green Version]
- Gremer, L.; Scholzel, D.; Schenck, C.; Reinartz, E.; Labahn, J.; Ravelli, R.B.G.; Tusche, M.; Lopez-Iglesias, C.; Hoyer, W.; Heise, H.; et al. Fibril structure of amyloid-beta (1–42) by cryo-electron microscopy. Science 2017, 358, 116–119. [Google Scholar] [CrossRef] [PubMed] [Green Version]
- Walti, M.A.; Ravotti, F.; Arai, H.; Riek, R. Atomic-resolution structure of a disease-relevant Aβ(1–42) amyloid fibril. Proc. Natl. Acad. Sci. USA 2016, 113, E4976–E4984. [Google Scholar] [CrossRef] [PubMed] [Green Version]
- Reinke, A.A.; Gestwicki, J.E. Insight into Amyloid Structure Using Chemical Probes. Chem. Biol. Drug Des. 2011, 77, 399–411. [Google Scholar] [CrossRef] [PubMed] [Green Version]
- Fitzpatrick, A.W.P.; Falcon, B.; He, S.; Murzin, A.G.; Murshudov, G.; Garringer, H.J.; Crowther, R.A.; Ghetti, B.; Goedert, M.; Scheres, S.H.W. Cryo-EM structures of tau filaments from Alzheimer’s disease. Nature 2017, 547, 185–190. [Google Scholar] [CrossRef] [Green Version]
- Ercan, E.; Eid, S.; Weber, C.; Kowalski, A.; Bichmann, M.; Behrendt, A.; Matthes, F.; Krauss, S.; Reinhardt, P.; Fulle, S.; et al. A validated antibody panel for the characterization of tau post-translational modifications. Mol. Neurodegener. 2017, 12, 87. [Google Scholar] [CrossRef] [Green Version]
- Mendez, P.C.; Surace, E.; Bérgamo, Y.; Calandri, I.; Vázquez, S.; Sevlever, G.; Allegri, R.F. Biomarkers for Alzheimer’s disease. Where we stand and where we are headed. Medicina 2019, 79, 546–551. [Google Scholar]
- Lemoine, L.; Gillberg, P.-G.; Svedberg, M.; Stepanov, V.; Jia, Z.; Huang, J.; Nag, S.; Tian, H.; Ghetti, B.; Okamura, N.; et al. Comparative binding properties of the tau PET tracers THK5117, THK5351, PBB3, and T807 in postmortem Alzheimer brains. Alzheimer Res. Ther. 2017, 9, 96. [Google Scholar] [CrossRef] [Green Version]
- Xiao, Y.; Ma, B.; McElheny, D.; Parthasarathy, S.; Long, F.; Hoshi, M.; Nussinov, R.; Ishii, Y. Aβ(1–42) fibril structure illuminates self-recognition and replication of amyloid in Alzheimer’s disease. Nat. Struct. Mol. Biol. 2015, 22, 499–505. [Google Scholar] [CrossRef] [Green Version]
- D’Andrea, M.R.; Nagele, R.G. Morphology distinct types of amyloid plaques point the way to a better understanding of Alzheimer’s disease pathogenesis. Biotech. Histochem. 2010, 85, 133–147. [Google Scholar] [CrossRef]
- Samra, G.K.; Dang, K.; Ho, H.; Baranwal, A.; Mukherjee, J. Dual targeting agents for Aβ plaque/P-glycoprotein and Aβ plaque/nicotinic acetylcholine α4β2* receptors—Potential approaches to facilitate Aβ plaque removal in Alzheimer’s disease brain. Med. Chem. Res. 2018, 27, 1634–1646. [Google Scholar] [CrossRef] [PubMed]
- Mondal, R.; Campoy, A.-D.T.; Liang, C.; Mukherjee, J. [18F]FDG PET/CT Studies in Transgenic Hualpha-Syn(A53T) Parkinson’s Disease Mouse Model of α-Syncleinopathy. Front. Neurosci. 2021, 15, 676257. [Google Scholar] [CrossRef] [PubMed]
- Campoy, A.-D.T.; Liang, C.; Ladwa, R.M.; Patel, K.K.; Patel, I.H.; Mukherjee, J. [18F]Nifene PET/CT imaging in mice models: Improved methods and preliminary studies of α4β2* nicotinic acetylcholinergic receptors in transgenic A53T mouse model of α-synucleinopathy and post-mortem human Parkinson’s disease. Molecules 2021, 26, 7360. [Google Scholar] [CrossRef] [PubMed]
- Vučcković, M.G.; Li, Q.; Fisher, B.; Nacca, A.; Leahy, R.M.; Walsh, J.P.; Mukherjee, J.; Williams, C.; Jakowec, M.W.; Petzinger, G.M. Exercise elevates dopamine D2 receptor in a mouse model of Parkinson’s disease: In vivo imaging with [18F]fallypride. Mov. Disord. 2010, 25, 2777–2784. [Google Scholar] [CrossRef] [Green Version]
- Leuzy, A.; Chiotis, K.; Lemoine, L.; Gillberg, P.-G.; Almkvist, O.; Rodriguez-Vieitez, E.; Nordberg, A. Tau PET imaging in neurodegenerative tauopathies—Still a challenge. Mol. Psychiatry 2019, 24, 1112–1134. [Google Scholar] [CrossRef] [Green Version]
- Simrén, J.; Leuzy, A.; Karikari, T.K.; Hye, A.; Benedet, A.L.; Lantero-Rodriguez, J.; Mattsson-Carlgren, N.; Schöll, M.; Mecocci, P.; Vellas, B.; et al. The diagnostic and prognostic capabilities of plasma biomarkers in Alzheimer’s disease. Alzheimer Dement. 2021, 17, 1145–1156. [Google Scholar] [CrossRef] [PubMed]
- Janelidze, S.; Mattsson, N.; Palmqvist, S.; Smith, R.; Beach, T.G.; Serrano, G.E.; Chai, X.; Proctor, N.K.; Eichenlaub, U.; Zetterberg, H.; et al. Plasma P-tau181 in Alzheimer’s disease: Relationship to other biomarkers, differential diagnosis, neuropathology and longitudinal progression to Alzheimer’s dementia. Nat. Med. 2020, 26, 379–386. [Google Scholar] [CrossRef]


| ID | Pathology | Gender | Age Expired | Braak Score | Plaque Total 2 | Tangle Total 2 | [18F]Flotaza Aβ 3 | [125I]IBETA Aβ 4 | [125I]IPPI Tau 5 |
|---|---|---|---|---|---|---|---|---|---|
| 10–39 | CN | Male | 93 | I | 0 | 1 | 0 | 0 | 0 |
| 10–63 | CN | Male | 79 | II | 0 | 2.5 | 0 | 0 | 0 |
| 10–70 | CN | Male | 74 | I | 0 | 2 | 0 | 0 | 0 |
| 13–40 | CN | Male | 73 | II | 0 | 2.25 | 0 | 0 | 0 |
| 13–49 | CN | Female | 75 | II | 0 | 2.5 | 0 | 0 | 0 |
| 12–21 | CN 6 | Female | 88 | II | 14 | 3.5 | ++ | ++ | 0 |
| 11–107 | AD | Male | 75 | VI | 14 | 15 | +++ | ++ | +++ |
| 11–27 | AD | Male | 78 | V | 12.5 | 10 | ++ | ++ | + |
| 11–38 | AD | Male | 76 | VI | 14.5 | 15 | ++++ | +++ | +++ |
| 11–78 | AD | Male | 89 | V | 14.5 | 15 | +++ | ++ | +++ |
| 13–10 | AD | Male | 78 | VI | 14 | 14 | +++ | ++ | ++ |
| 12–27 | AD | Female | 86 | VI | 15 | 15 | +++ | ++ | ++ |
Disclaimer/Publisher’s Note: The statements, opinions and data contained in all publications are solely those of the individual author(s) and contributor(s) and not of MDPI and/or the editor(s). MDPI and/or the editor(s) disclaim responsibility for any injury to people or property resulting from any ideas, methods, instructions or products referred to in the content. |
© 2023 by the authors. Licensee MDPI, Basel, Switzerland. This article is an open access article distributed under the terms and conditions of the Creative Commons Attribution (CC BY) license (https://creativecommons.org/licenses/by/4.0/).
Share and Cite
Mondal, R.; Sandhu, Y.K.; Kamalia, V.M.; Delaney, B.A.; Syed, A.U.; Nguyen, G.A.H.; Moran, T.R.; Limpengco, R.R.; Liang, C.; Mukherjee, J. Measurement of Aβ Amyloid Plaques and Tau Protein in Postmortem Human Alzheimer’s Disease Brain by Autoradiography Using [18F]Flotaza, [125I]IBETA, [124/125I]IPPI and Immunohistochemistry Analysis Using QuPath. Biomedicines 2023, 11, 1033. https://doi.org/10.3390/biomedicines11041033
Mondal R, Sandhu YK, Kamalia VM, Delaney BA, Syed AU, Nguyen GAH, Moran TR, Limpengco RR, Liang C, Mukherjee J. Measurement of Aβ Amyloid Plaques and Tau Protein in Postmortem Human Alzheimer’s Disease Brain by Autoradiography Using [18F]Flotaza, [125I]IBETA, [124/125I]IPPI and Immunohistochemistry Analysis Using QuPath. Biomedicines. 2023; 11(4):1033. https://doi.org/10.3390/biomedicines11041033
Chicago/Turabian StyleMondal, Rommani, Yasmin K. Sandhu, Vallabhi M. Kamalia, Brooke A. Delaney, Amina U. Syed, Grace A. H. Nguyen, Taylor R. Moran, Roz R. Limpengco, Christopher Liang, and Jogeshwar Mukherjee. 2023. "Measurement of Aβ Amyloid Plaques and Tau Protein in Postmortem Human Alzheimer’s Disease Brain by Autoradiography Using [18F]Flotaza, [125I]IBETA, [124/125I]IPPI and Immunohistochemistry Analysis Using QuPath" Biomedicines 11, no. 4: 1033. https://doi.org/10.3390/biomedicines11041033