
The Effects of Probiotics on Small Intestinal Microbiota Composition, Inflammatory Cytokines and Intestinal Permeability in Patients with Non-Alcoholic Fatty Liver Disease

 , ,
, ,
Abstract
:1. Introduction
2. Methodology
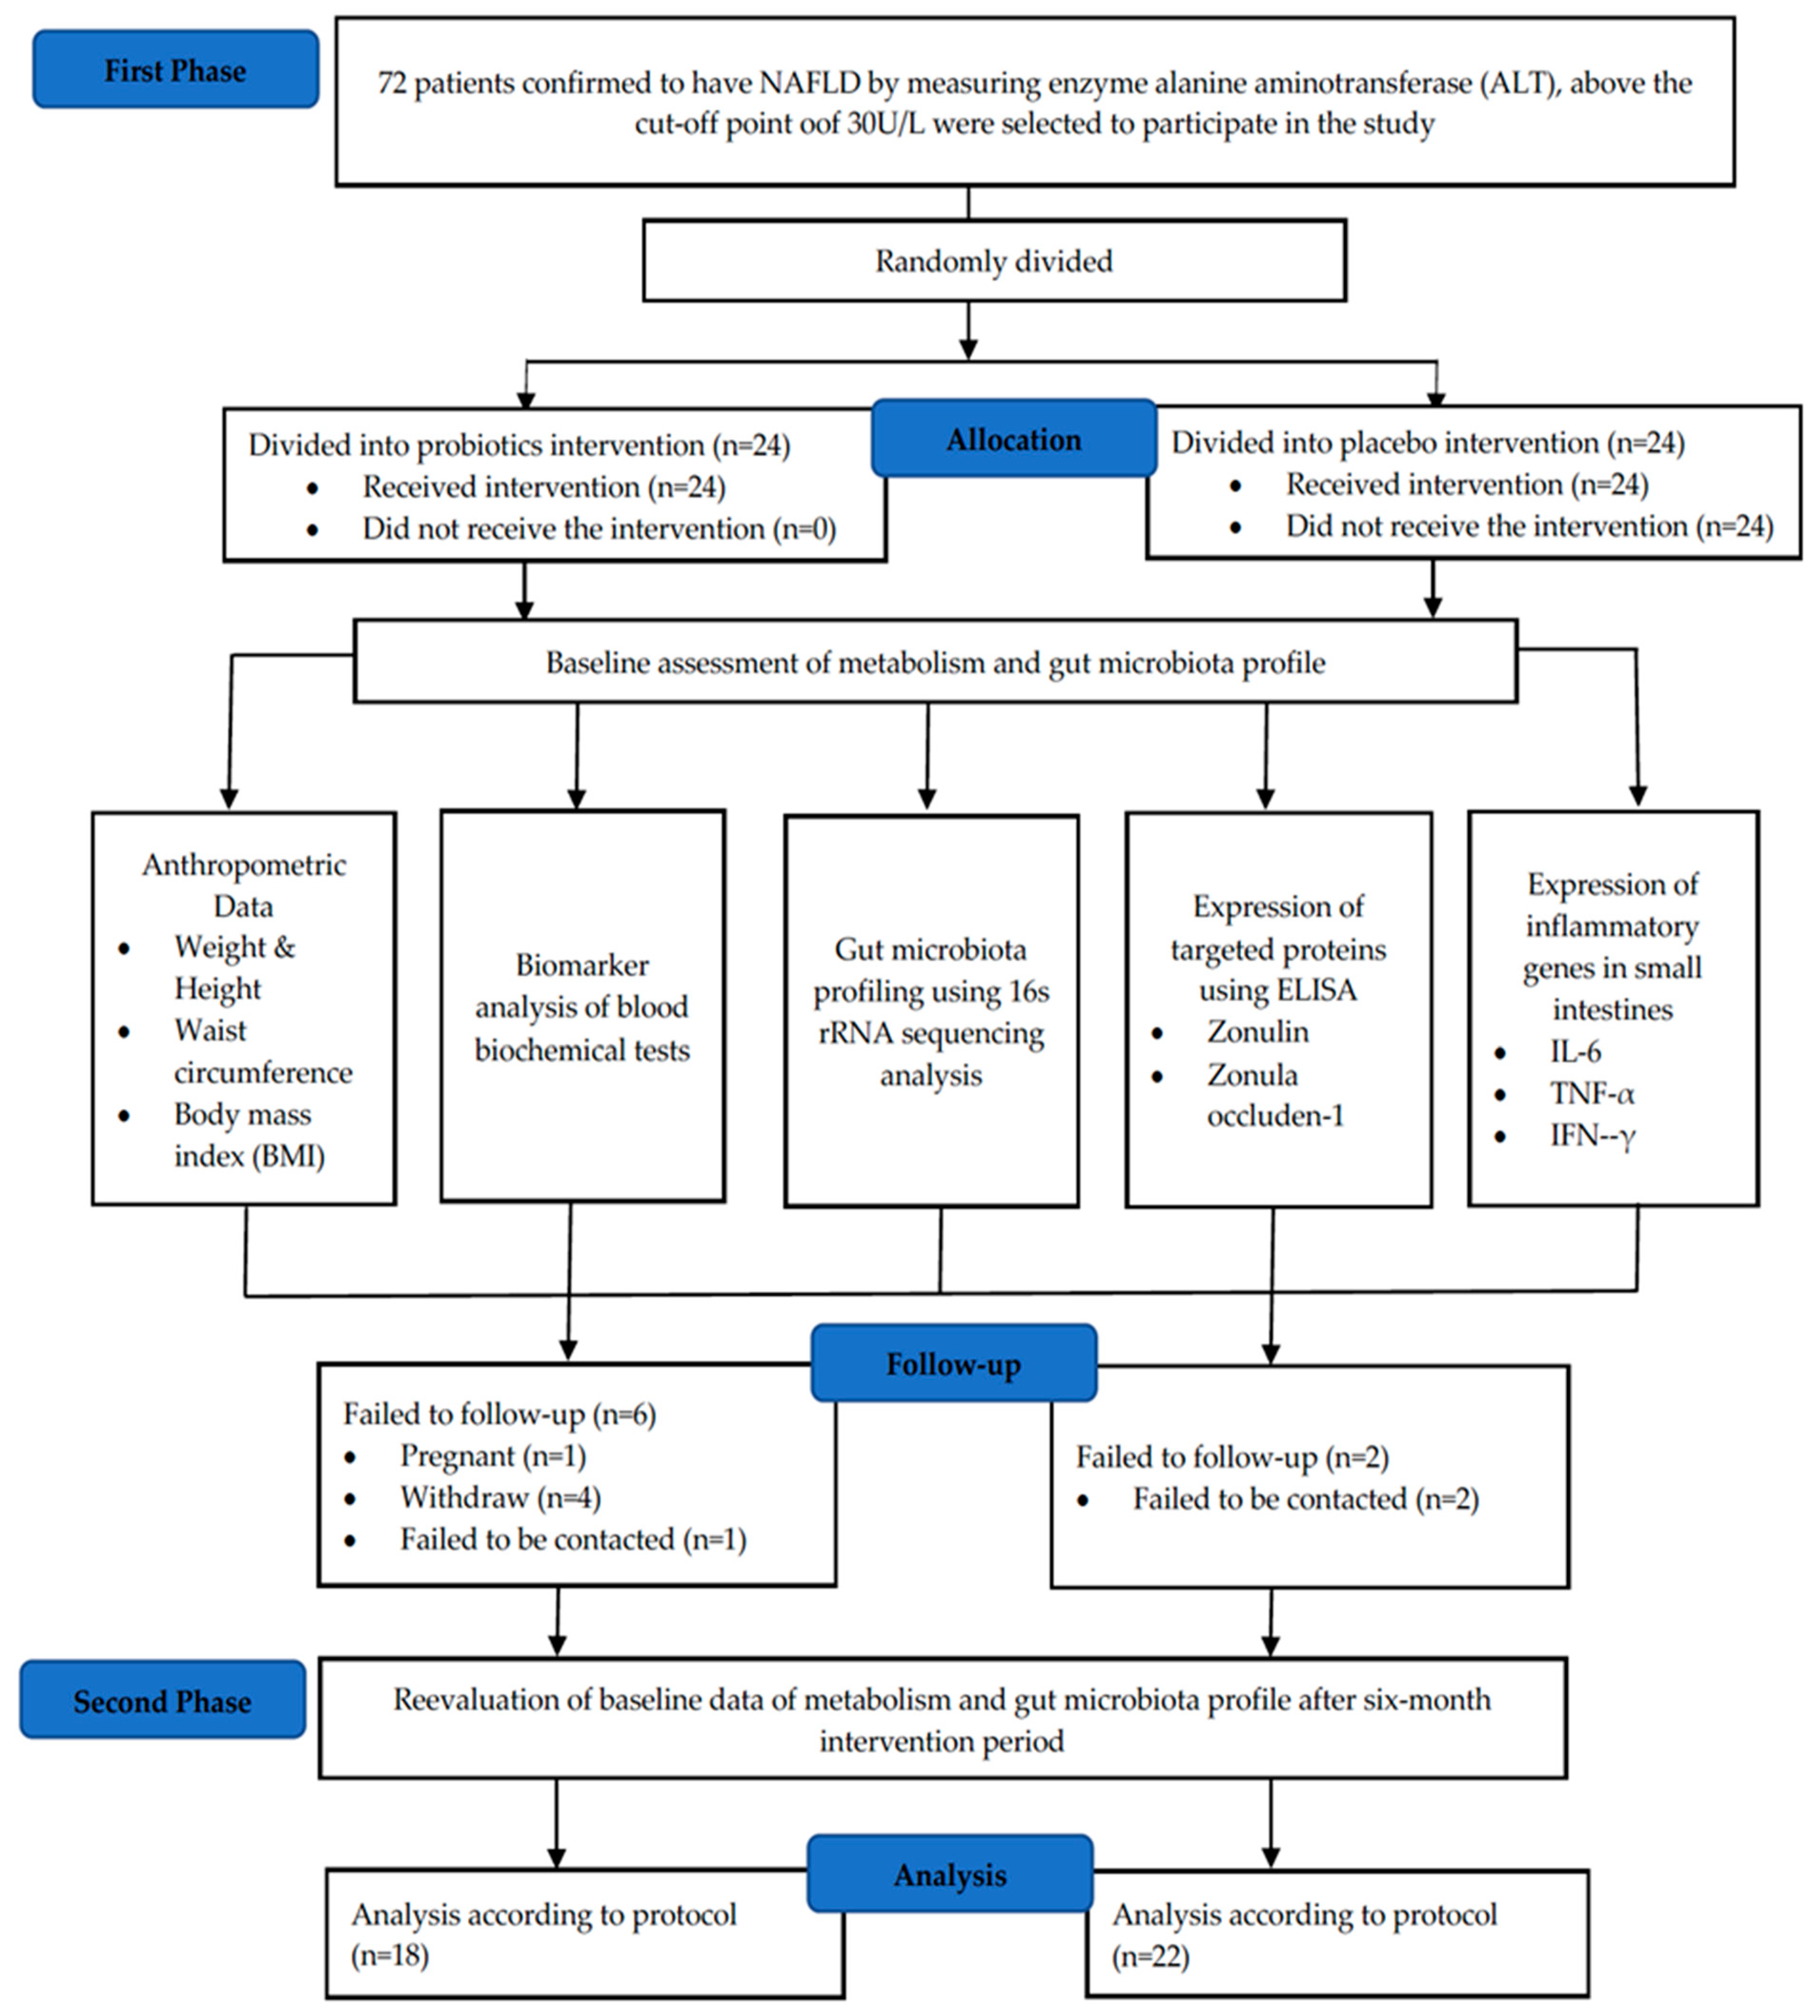
2.1. Study Design
2.2. Sample Size Calculation
2.3. Patients and Sample Collection
2.4. Intervention
2.5. 16S rRNA Sequencing
2.5.1. Illumina Library Generation
2.5.2. Bioinformatics
2.6. RT-qPCR
2.7. ELISA
Serum Zonulin and ZO-1 Concentrations
2.8. Statistical Analysis
3. Results
3.1. Baseline Characteristics
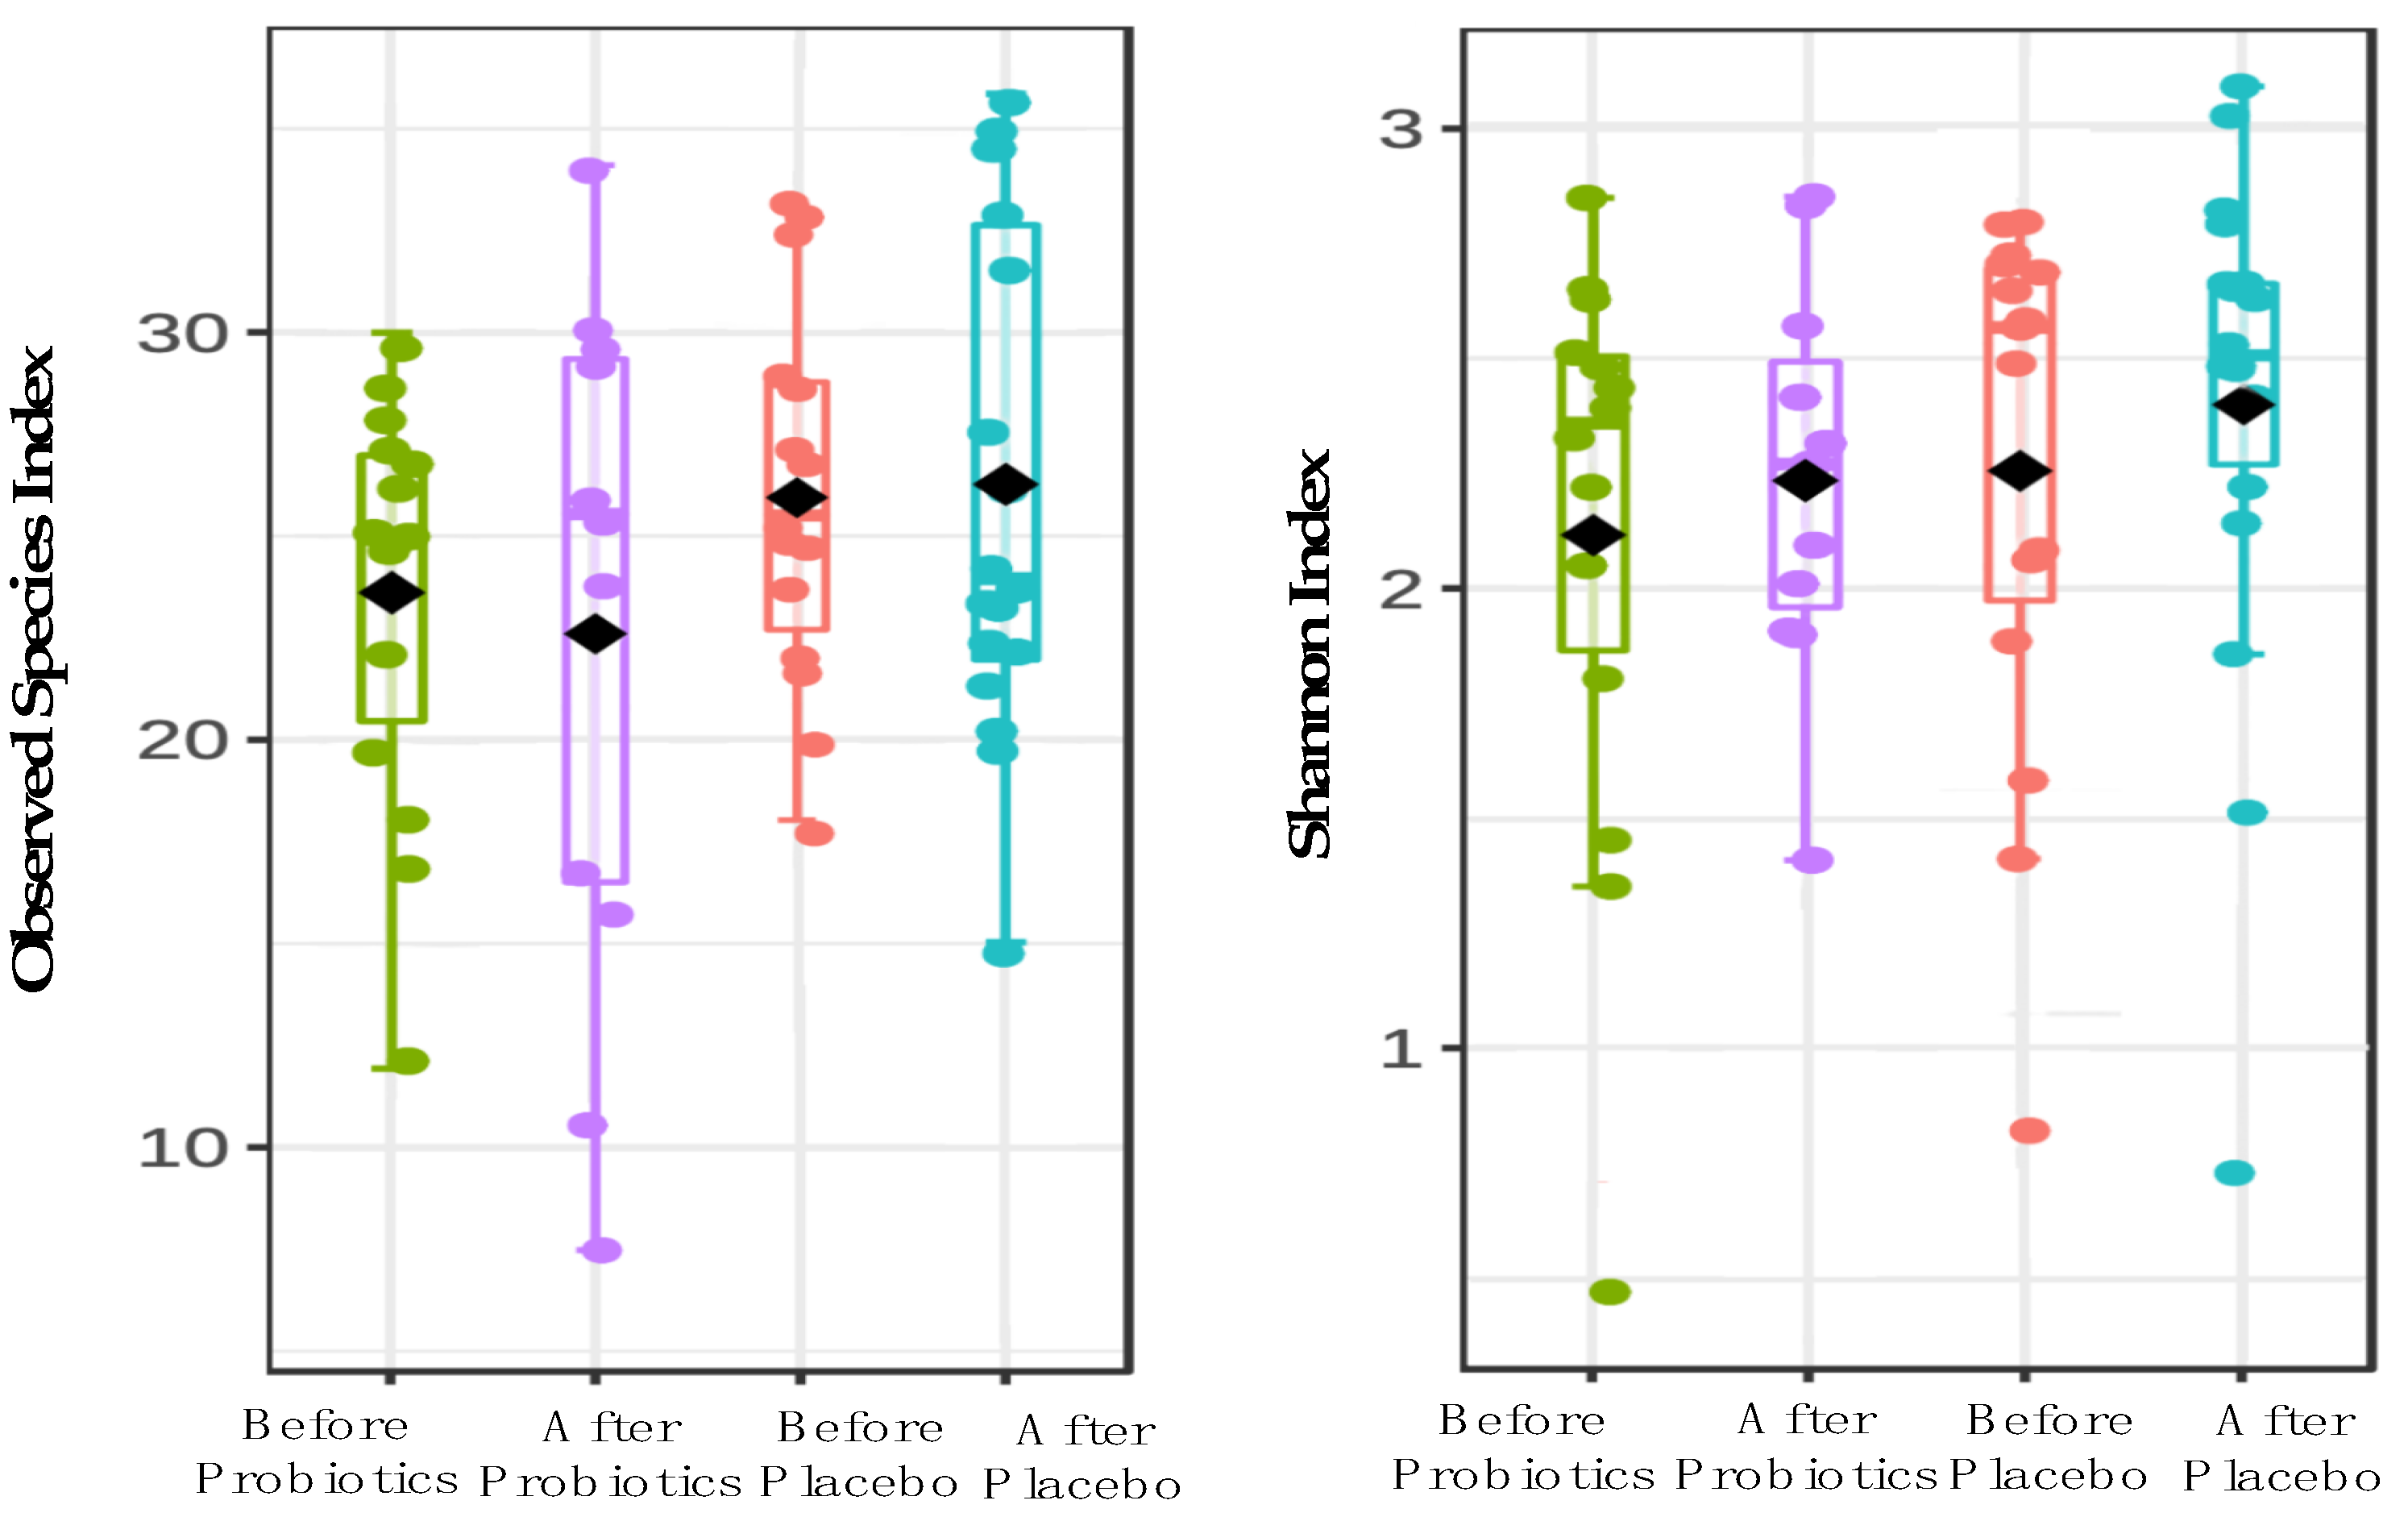
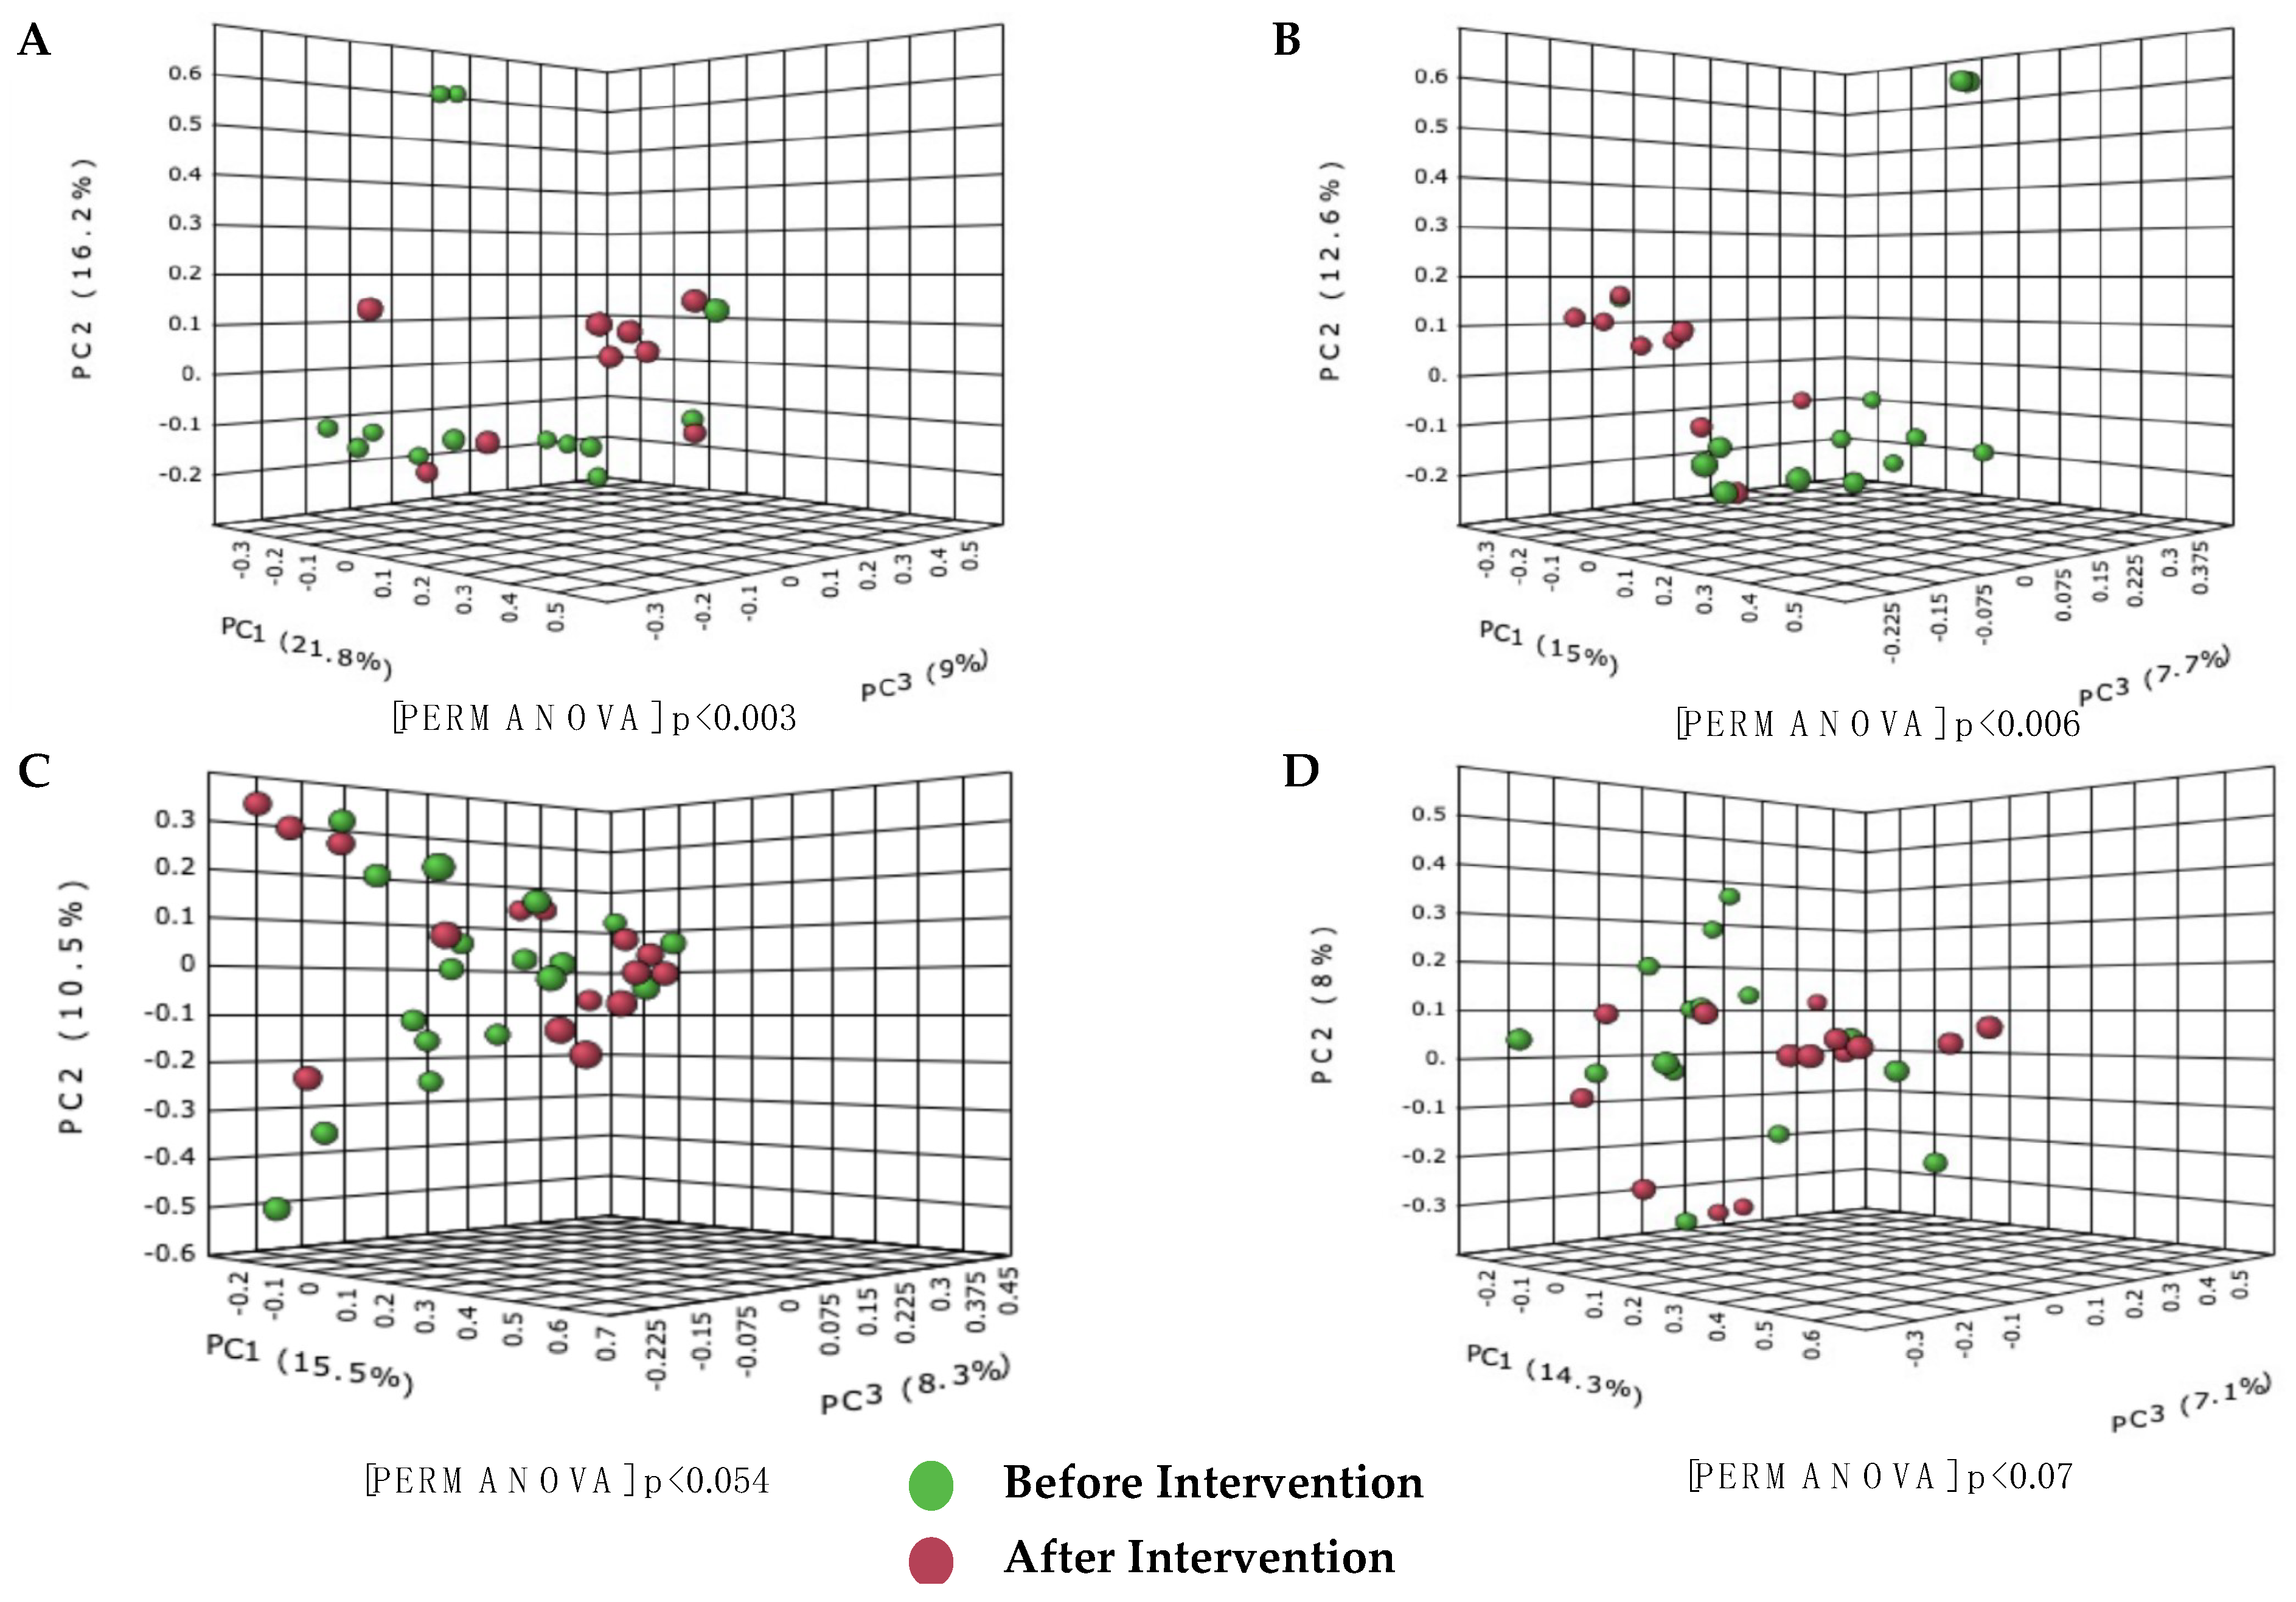
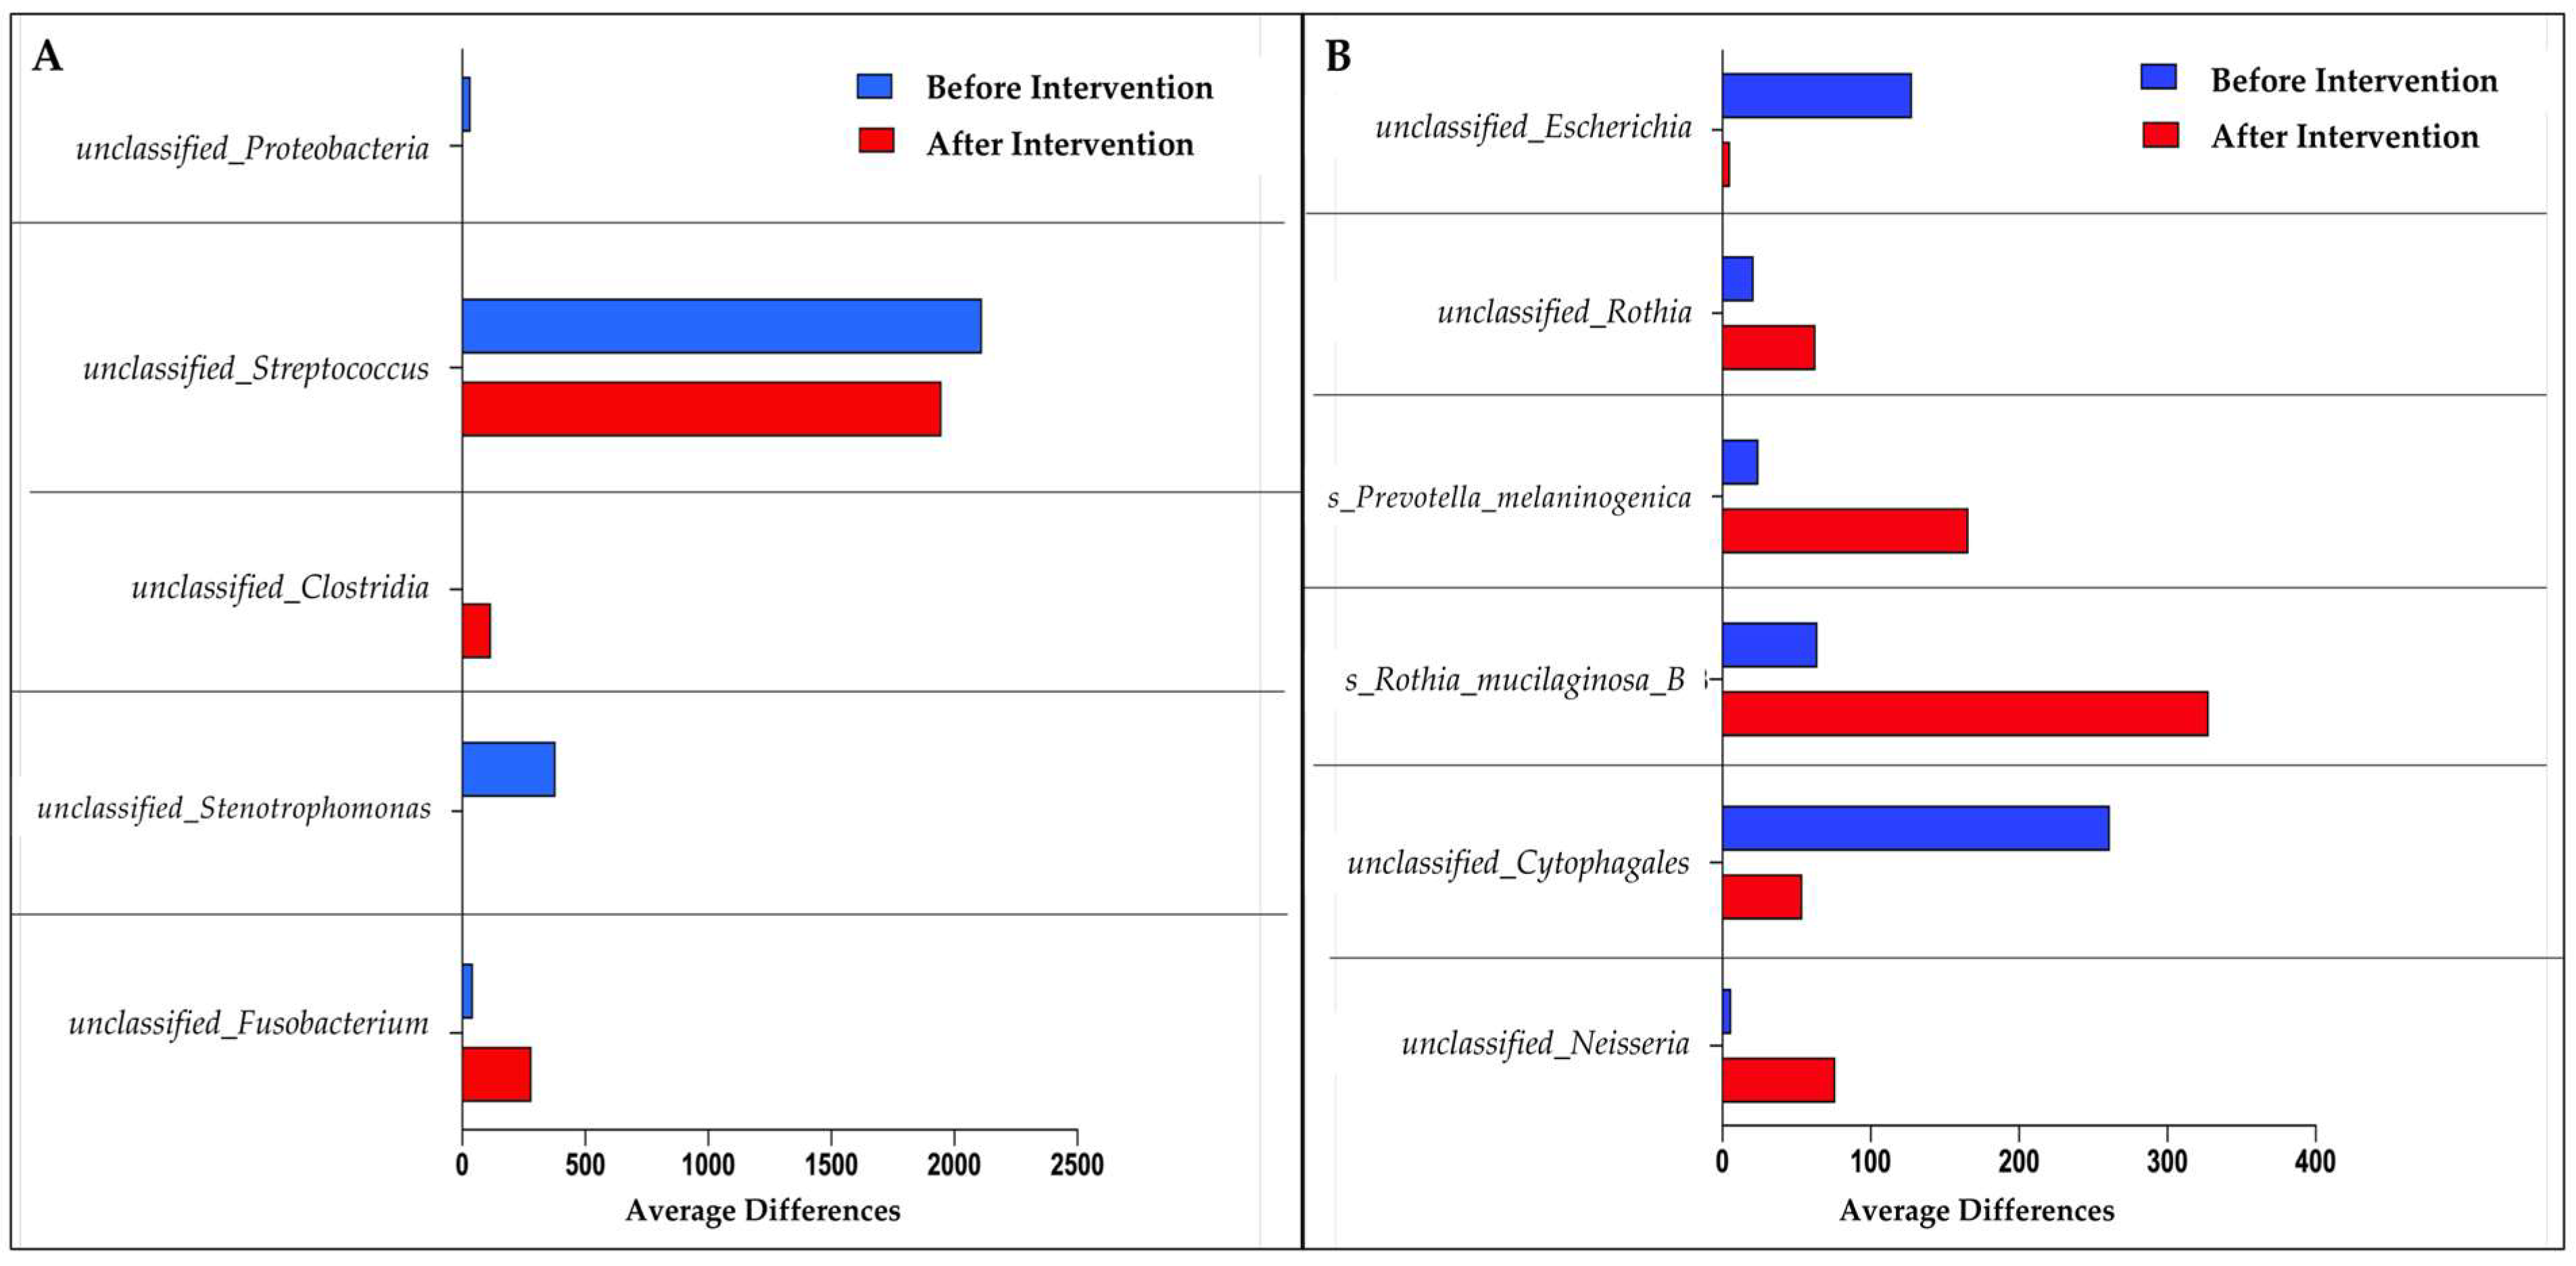
3.2. 16S rRNA Sequencing
3.3. Expression of Small Intestinal Inflammatory Cytokines in Healthy and NAFLD Group
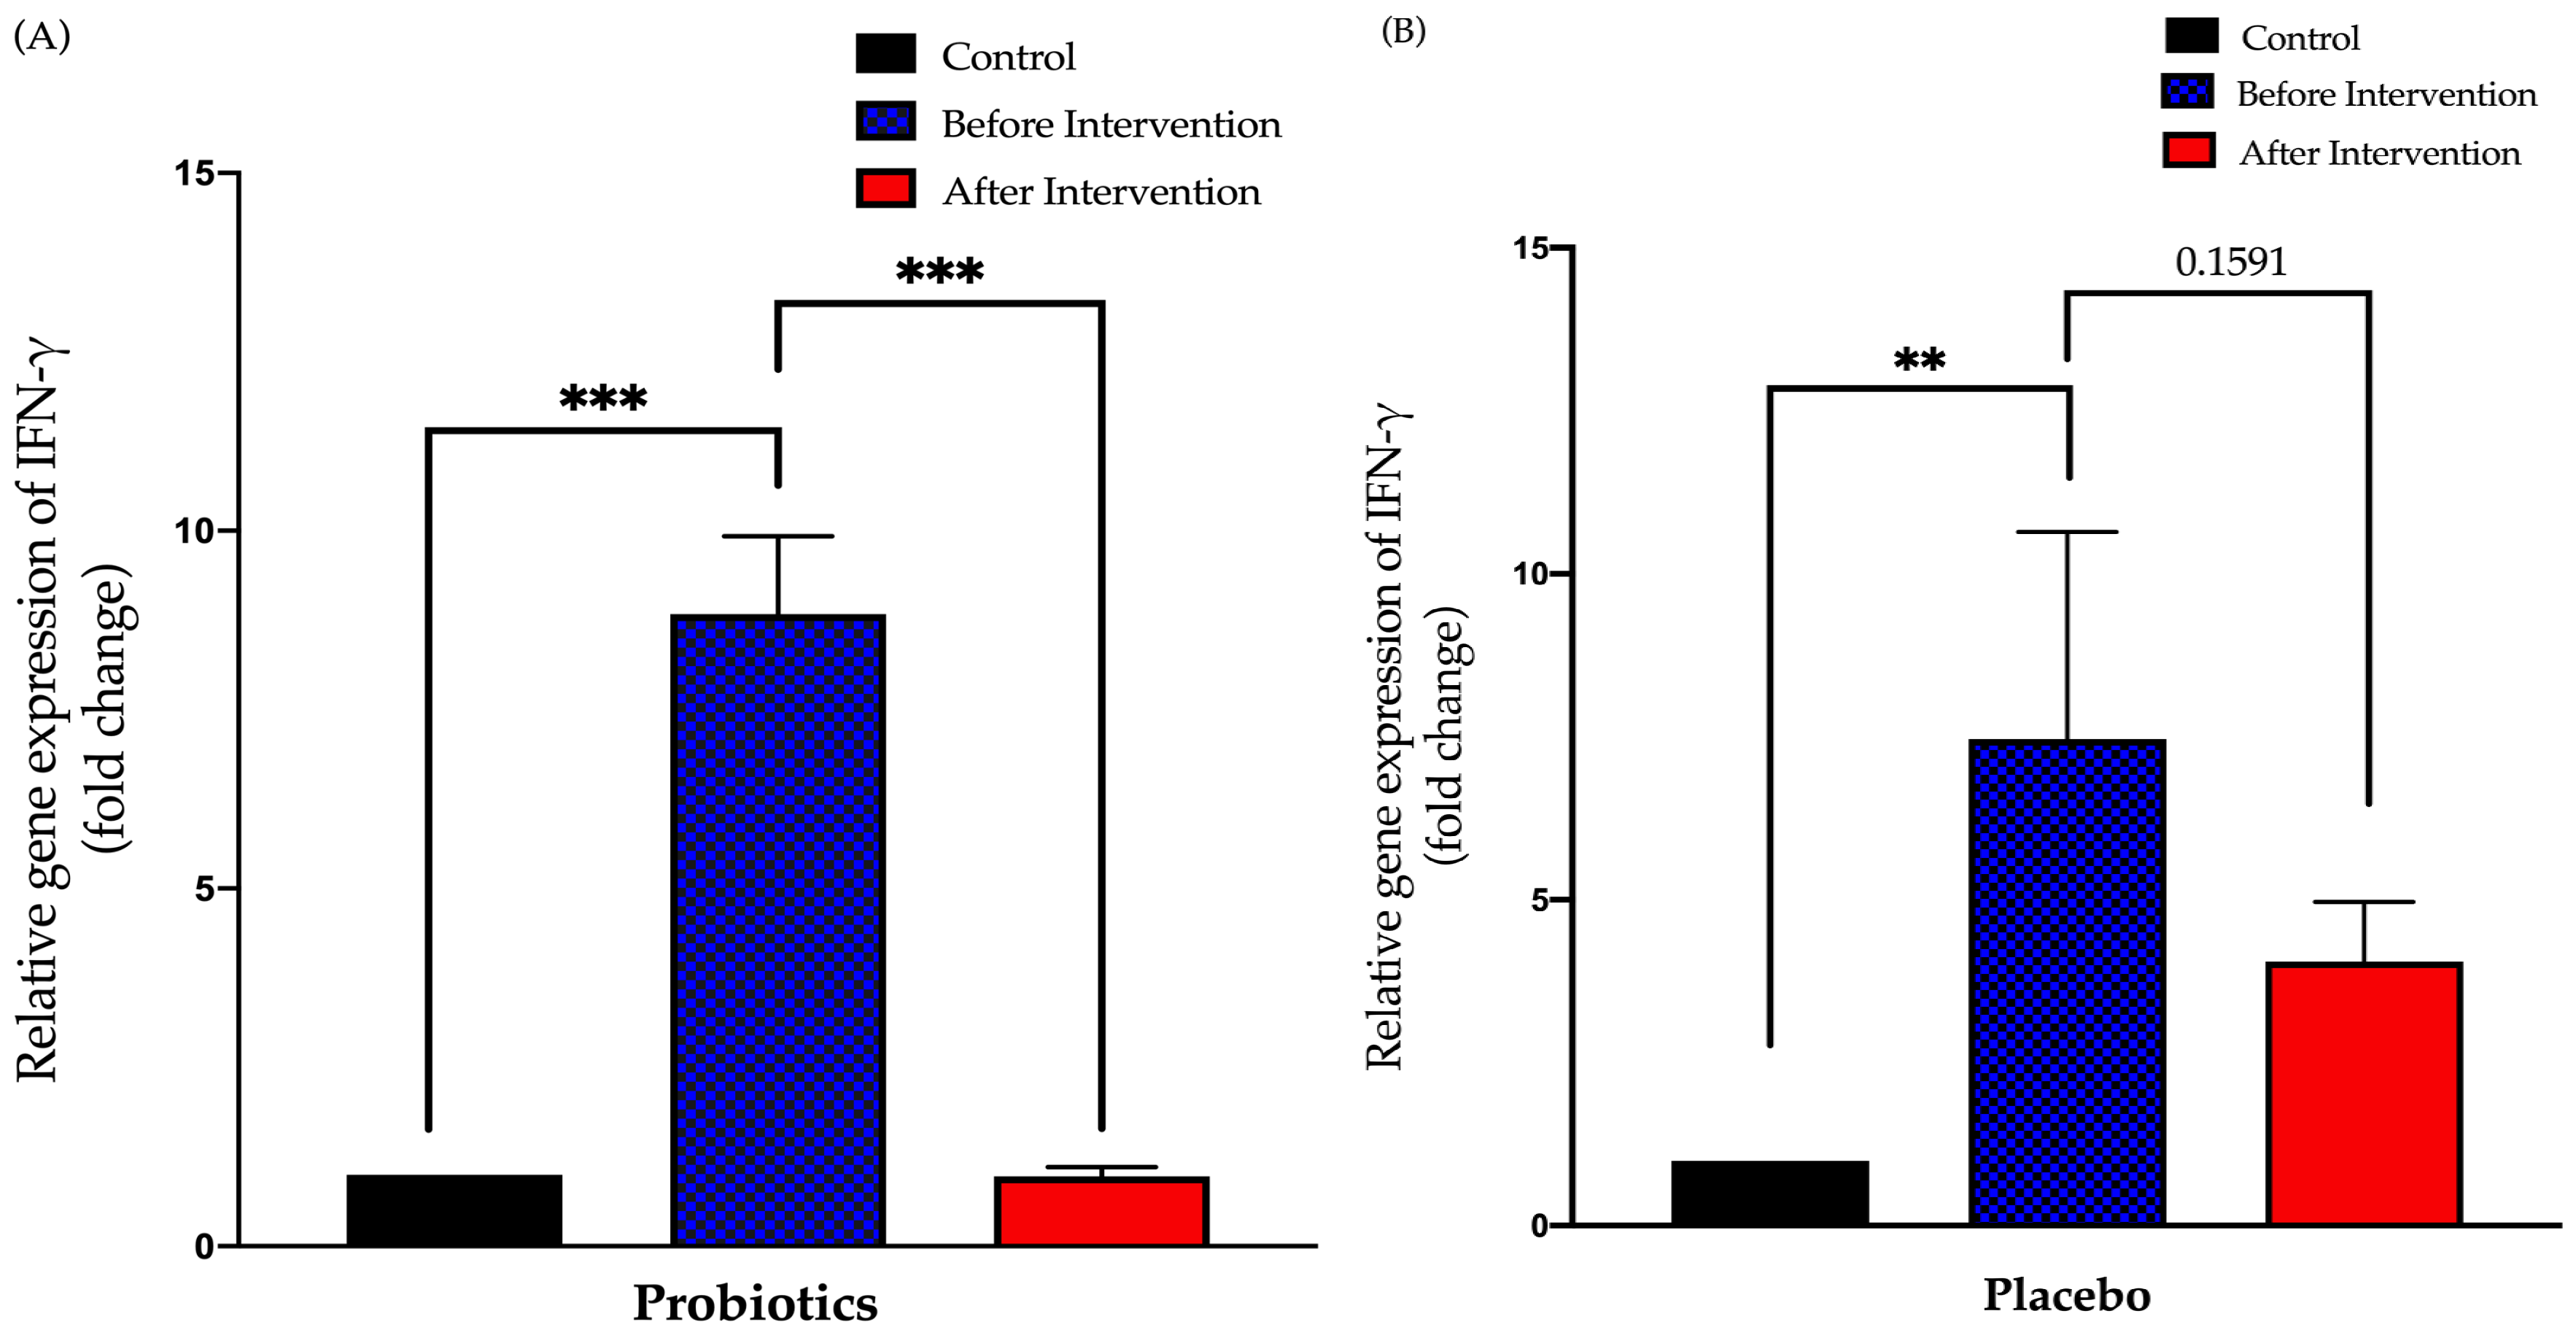
3.3.1. Relative Expression of IFN-γ in Duodenal Tissue
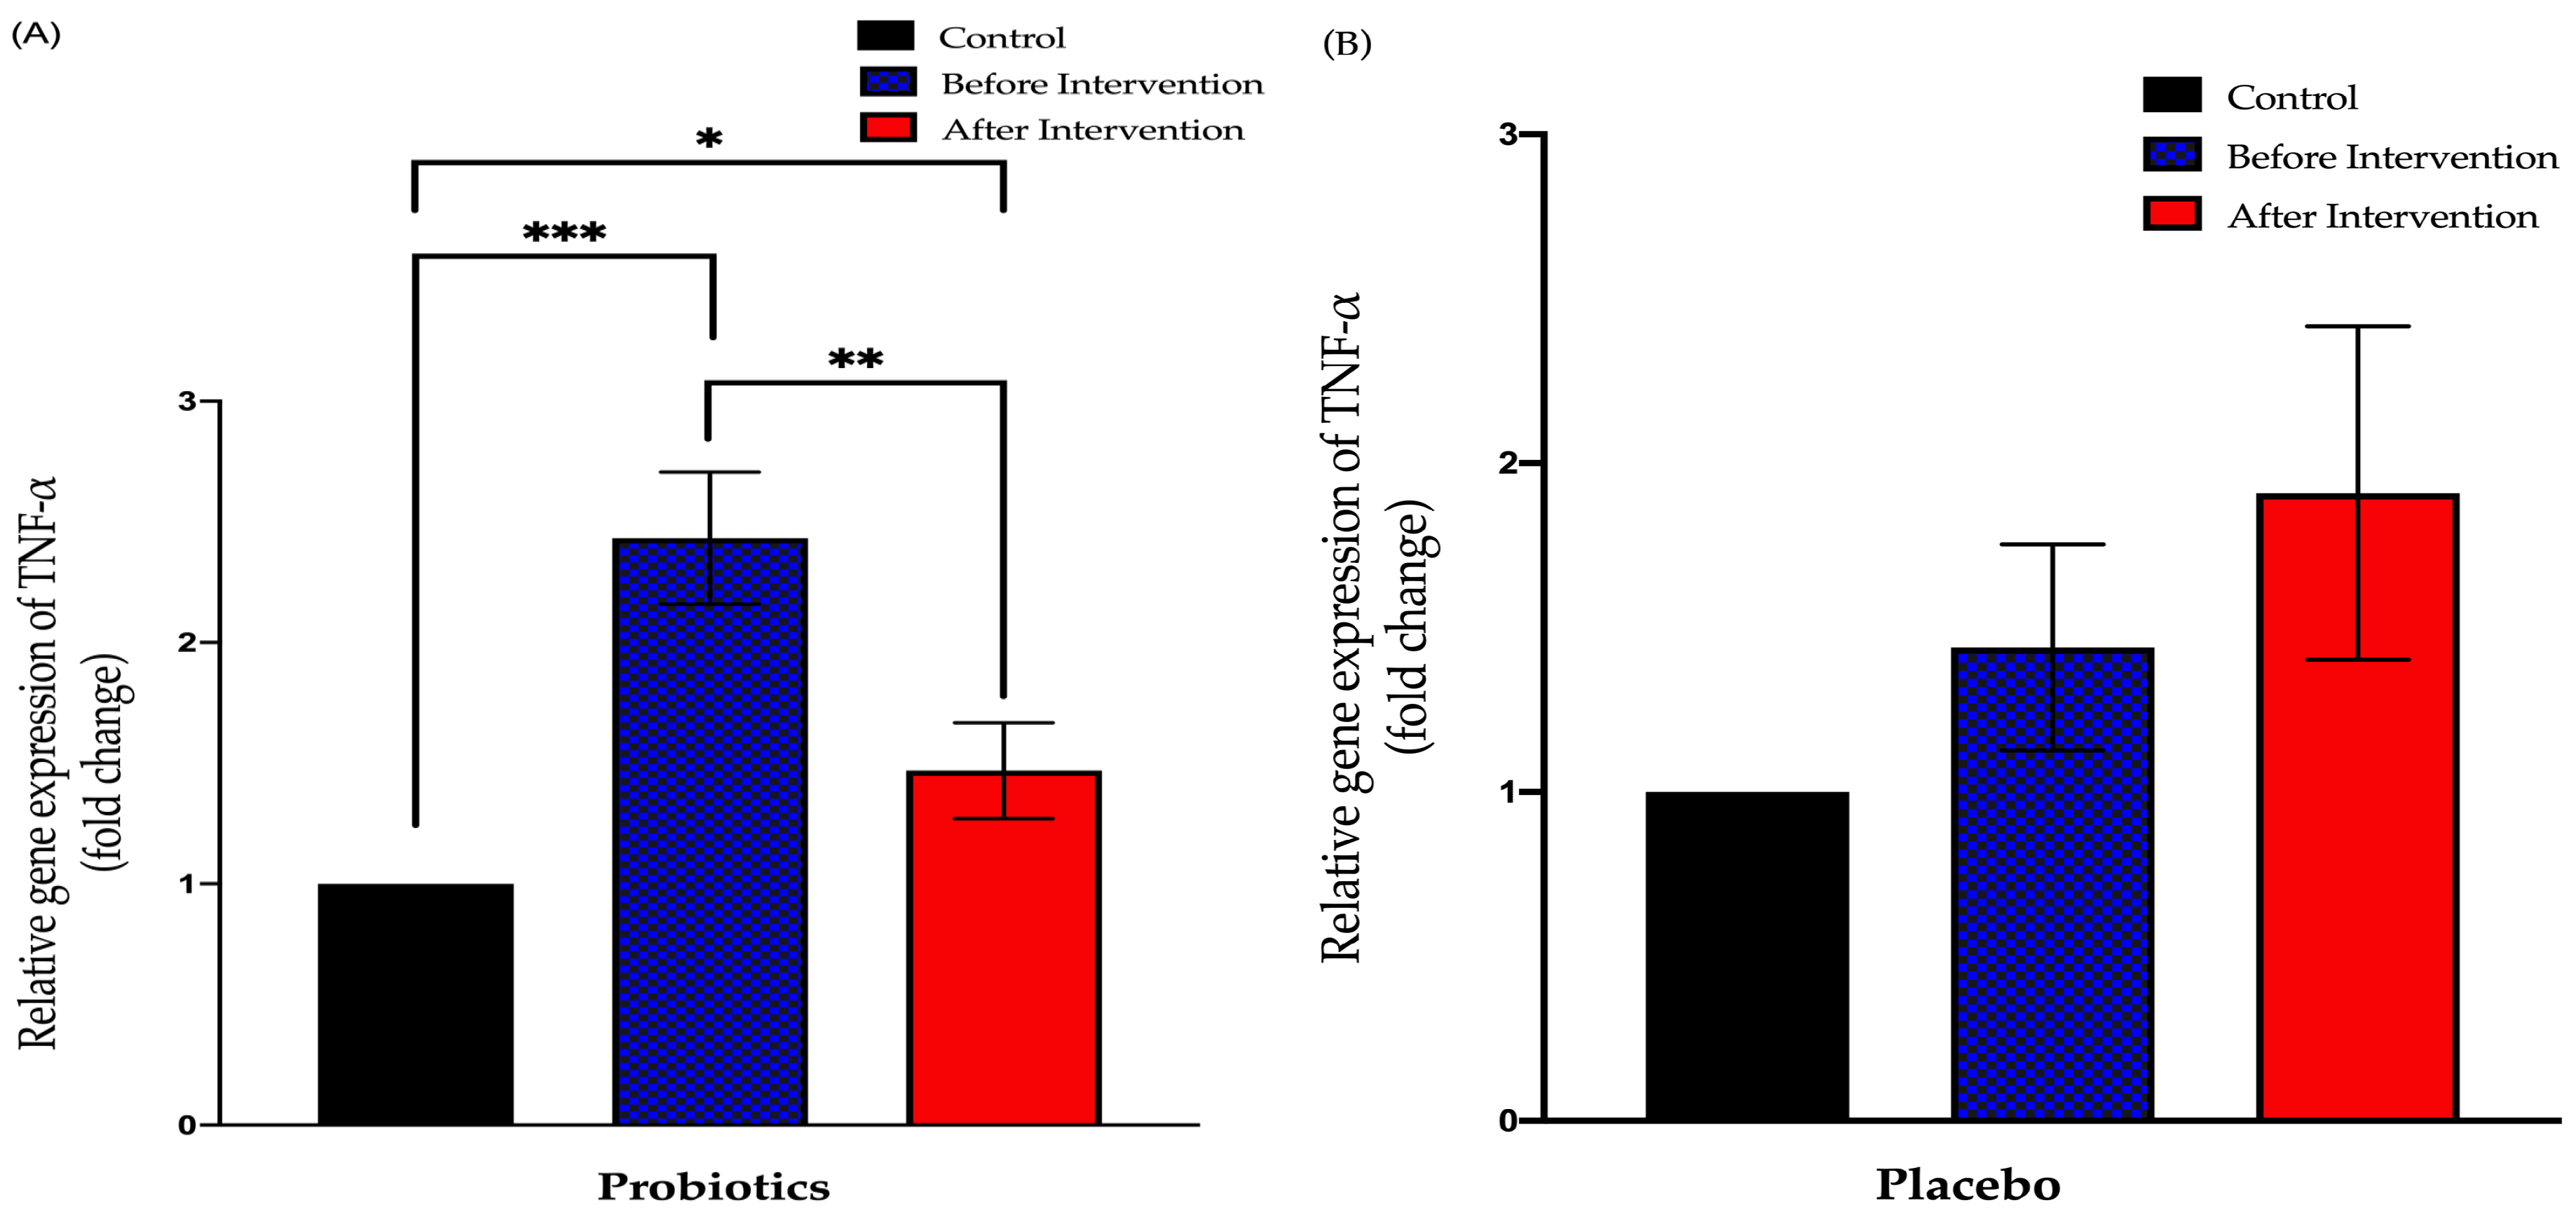
3.3.2. Relative Expression of TNF-α in Duodenal Tissue
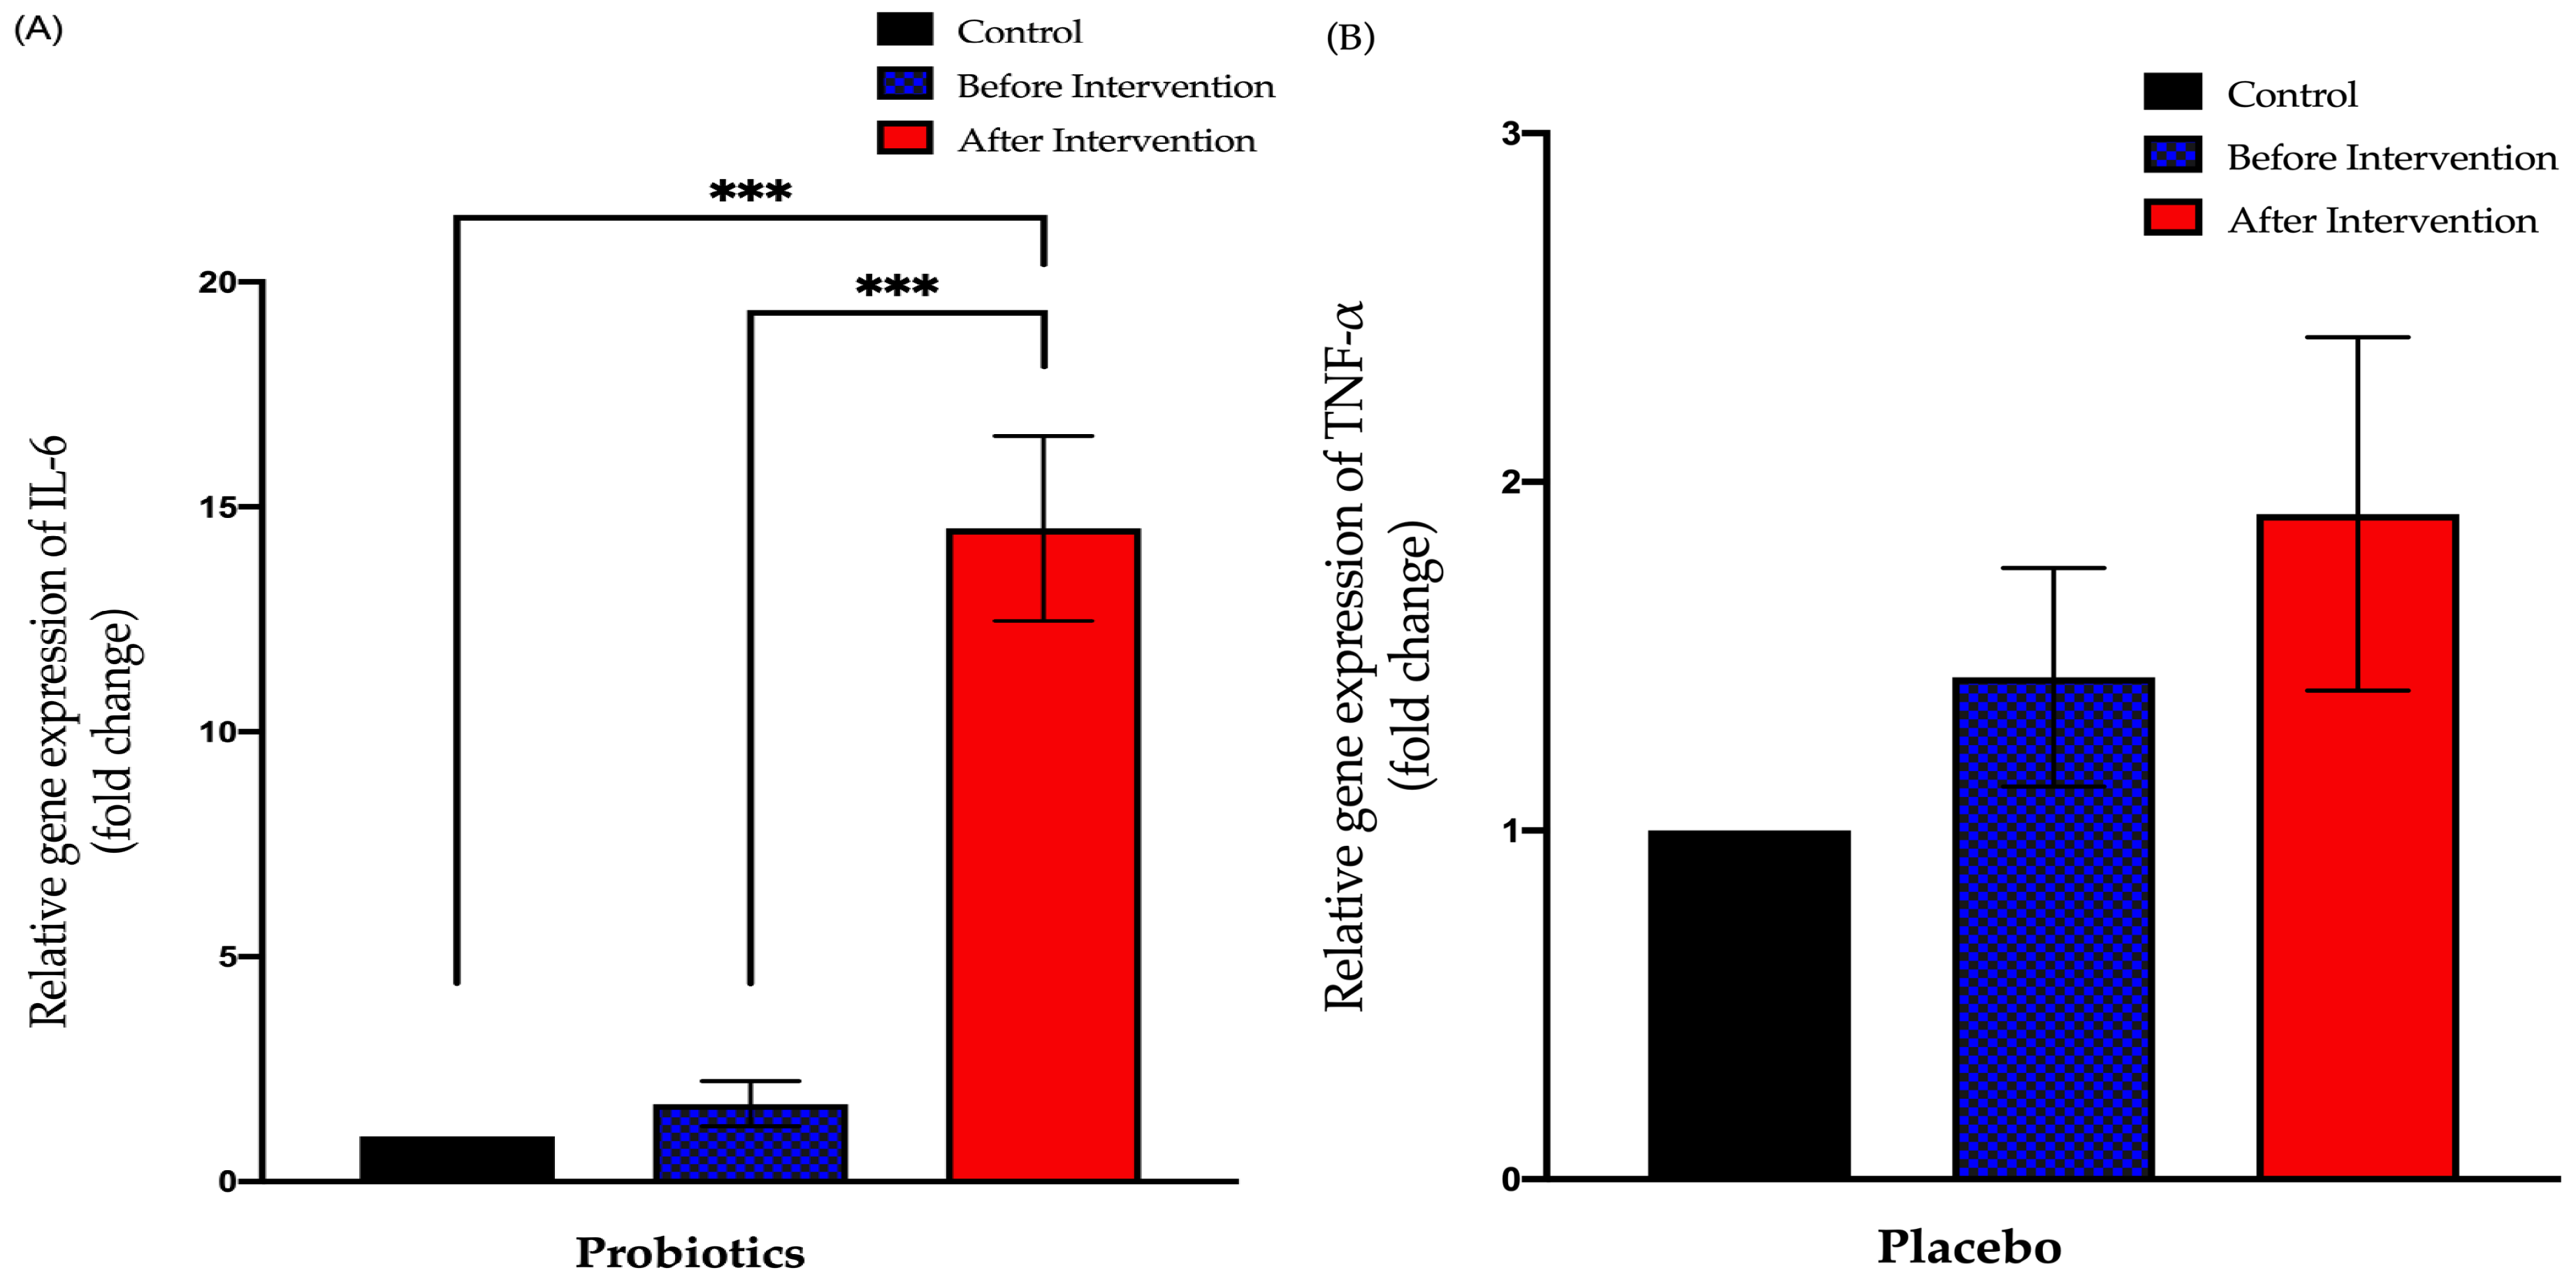
3.3.3. Relative Expression of IL-6 in Duodenal Tissue
3.4. Expression of Tight Junction and Inflammatory Biomarker Protein in NAFLD Group
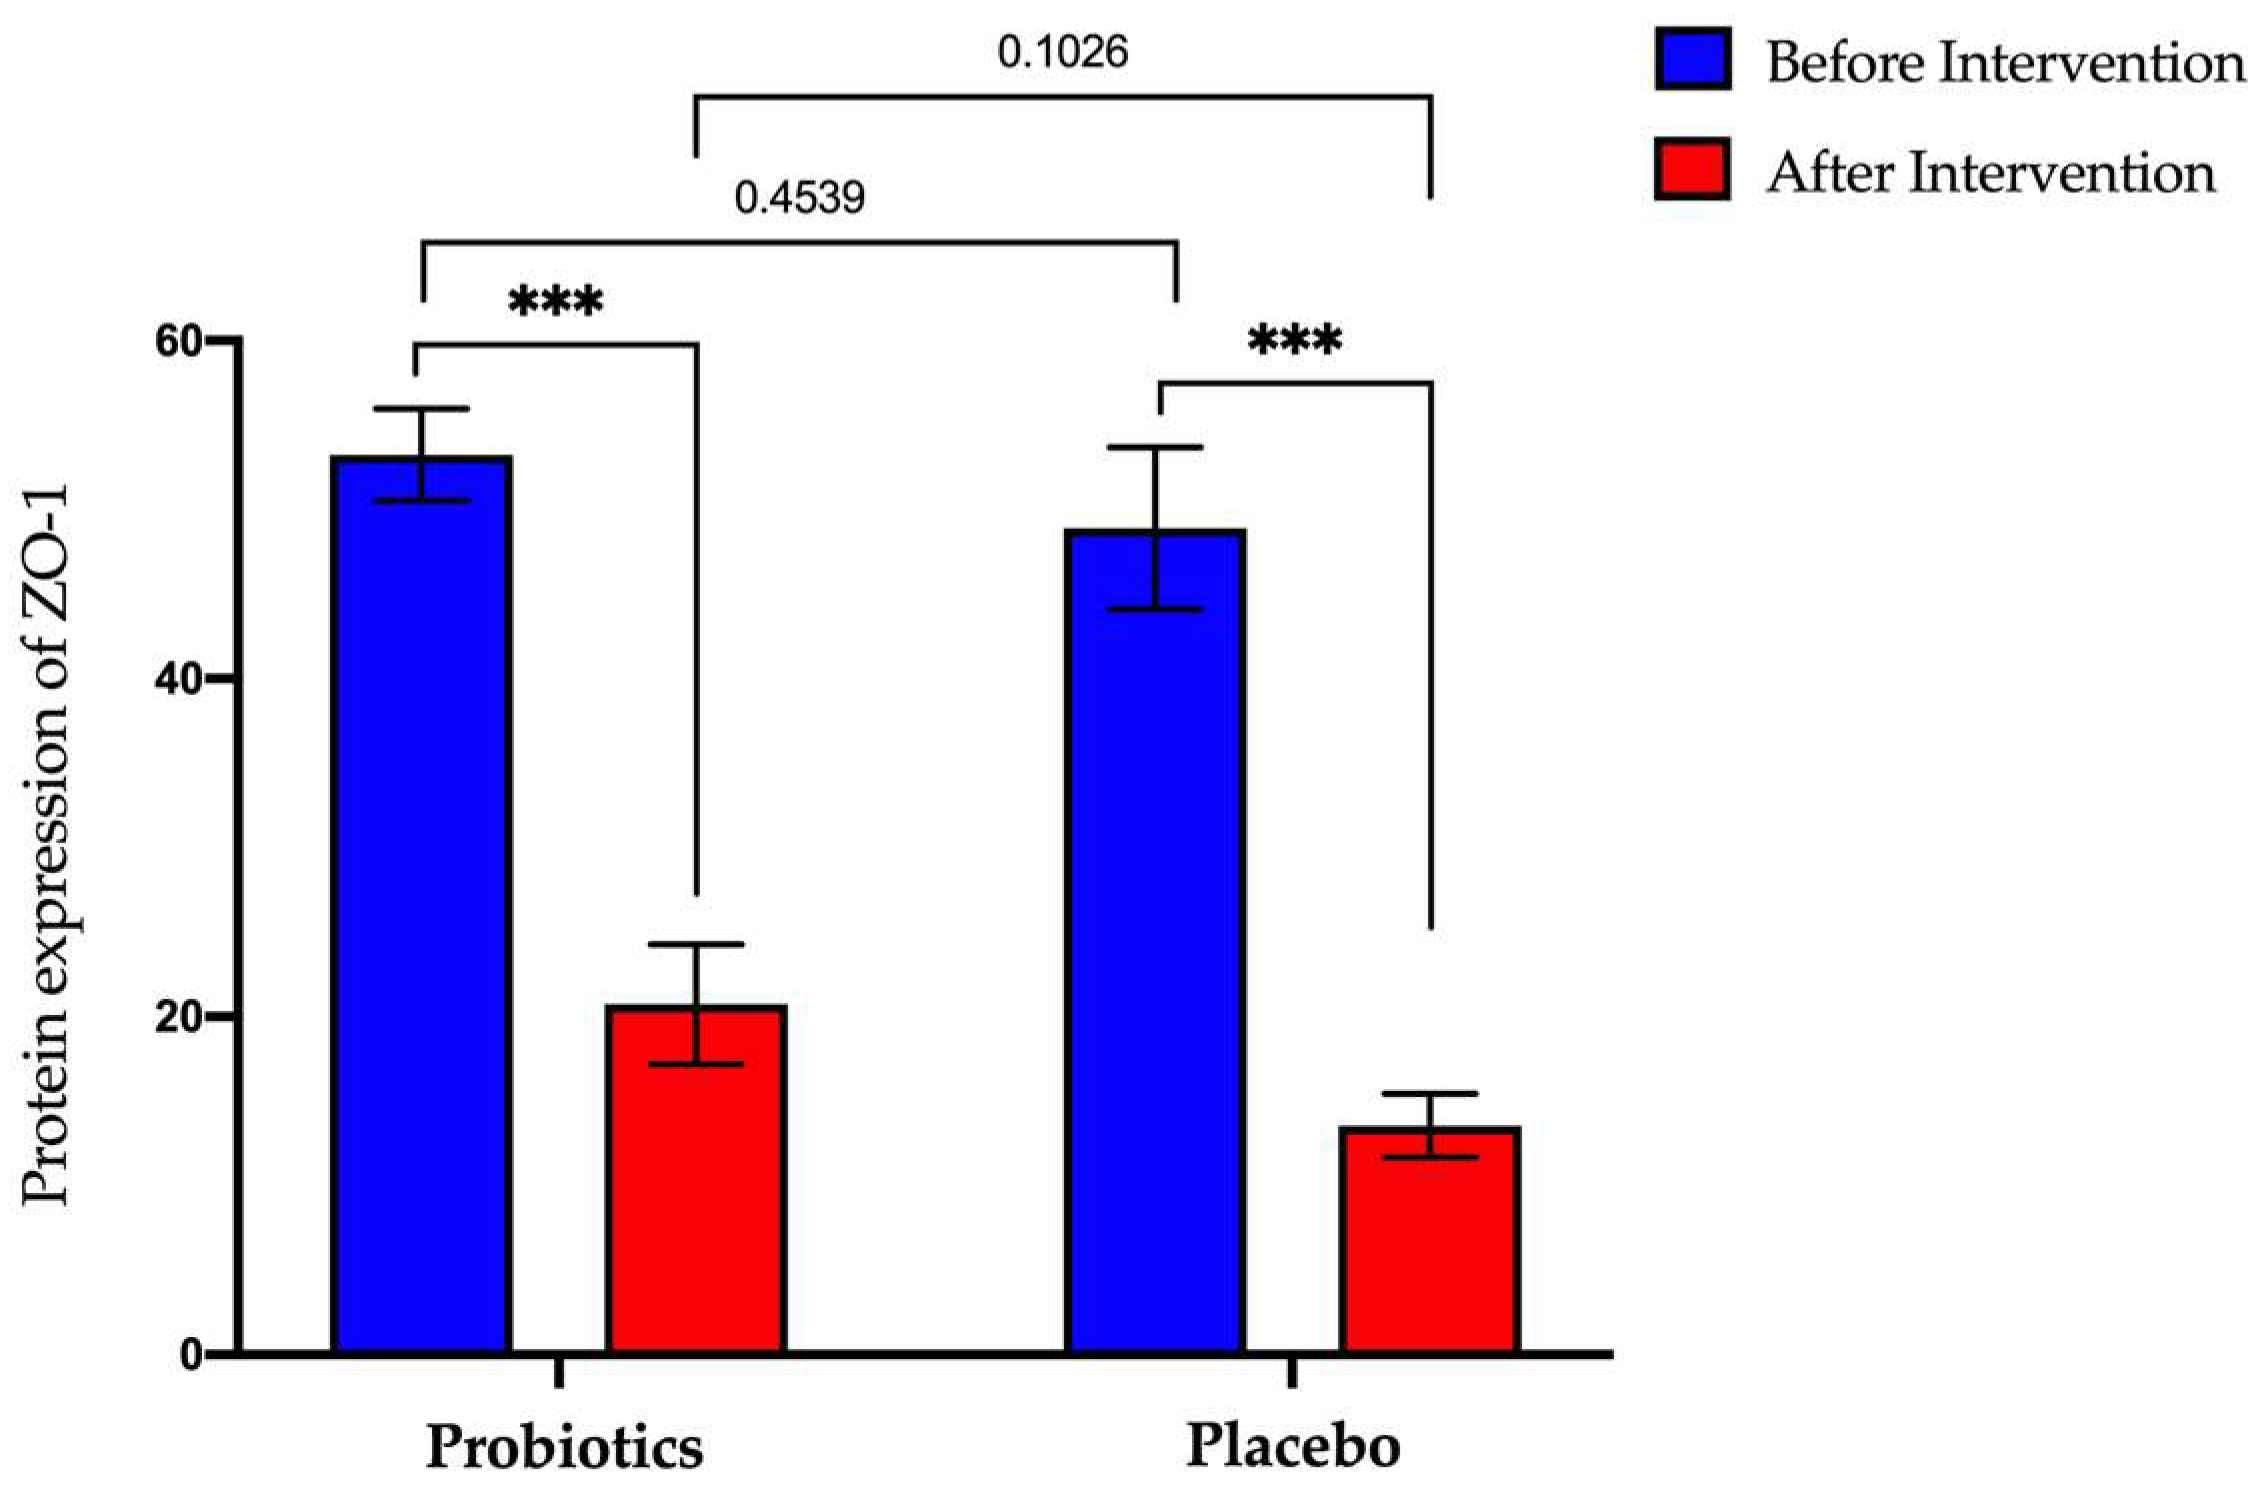
3.4.1. Expression of Zonula-Occluden-1 (ZO-1) Protein in Serum Samples
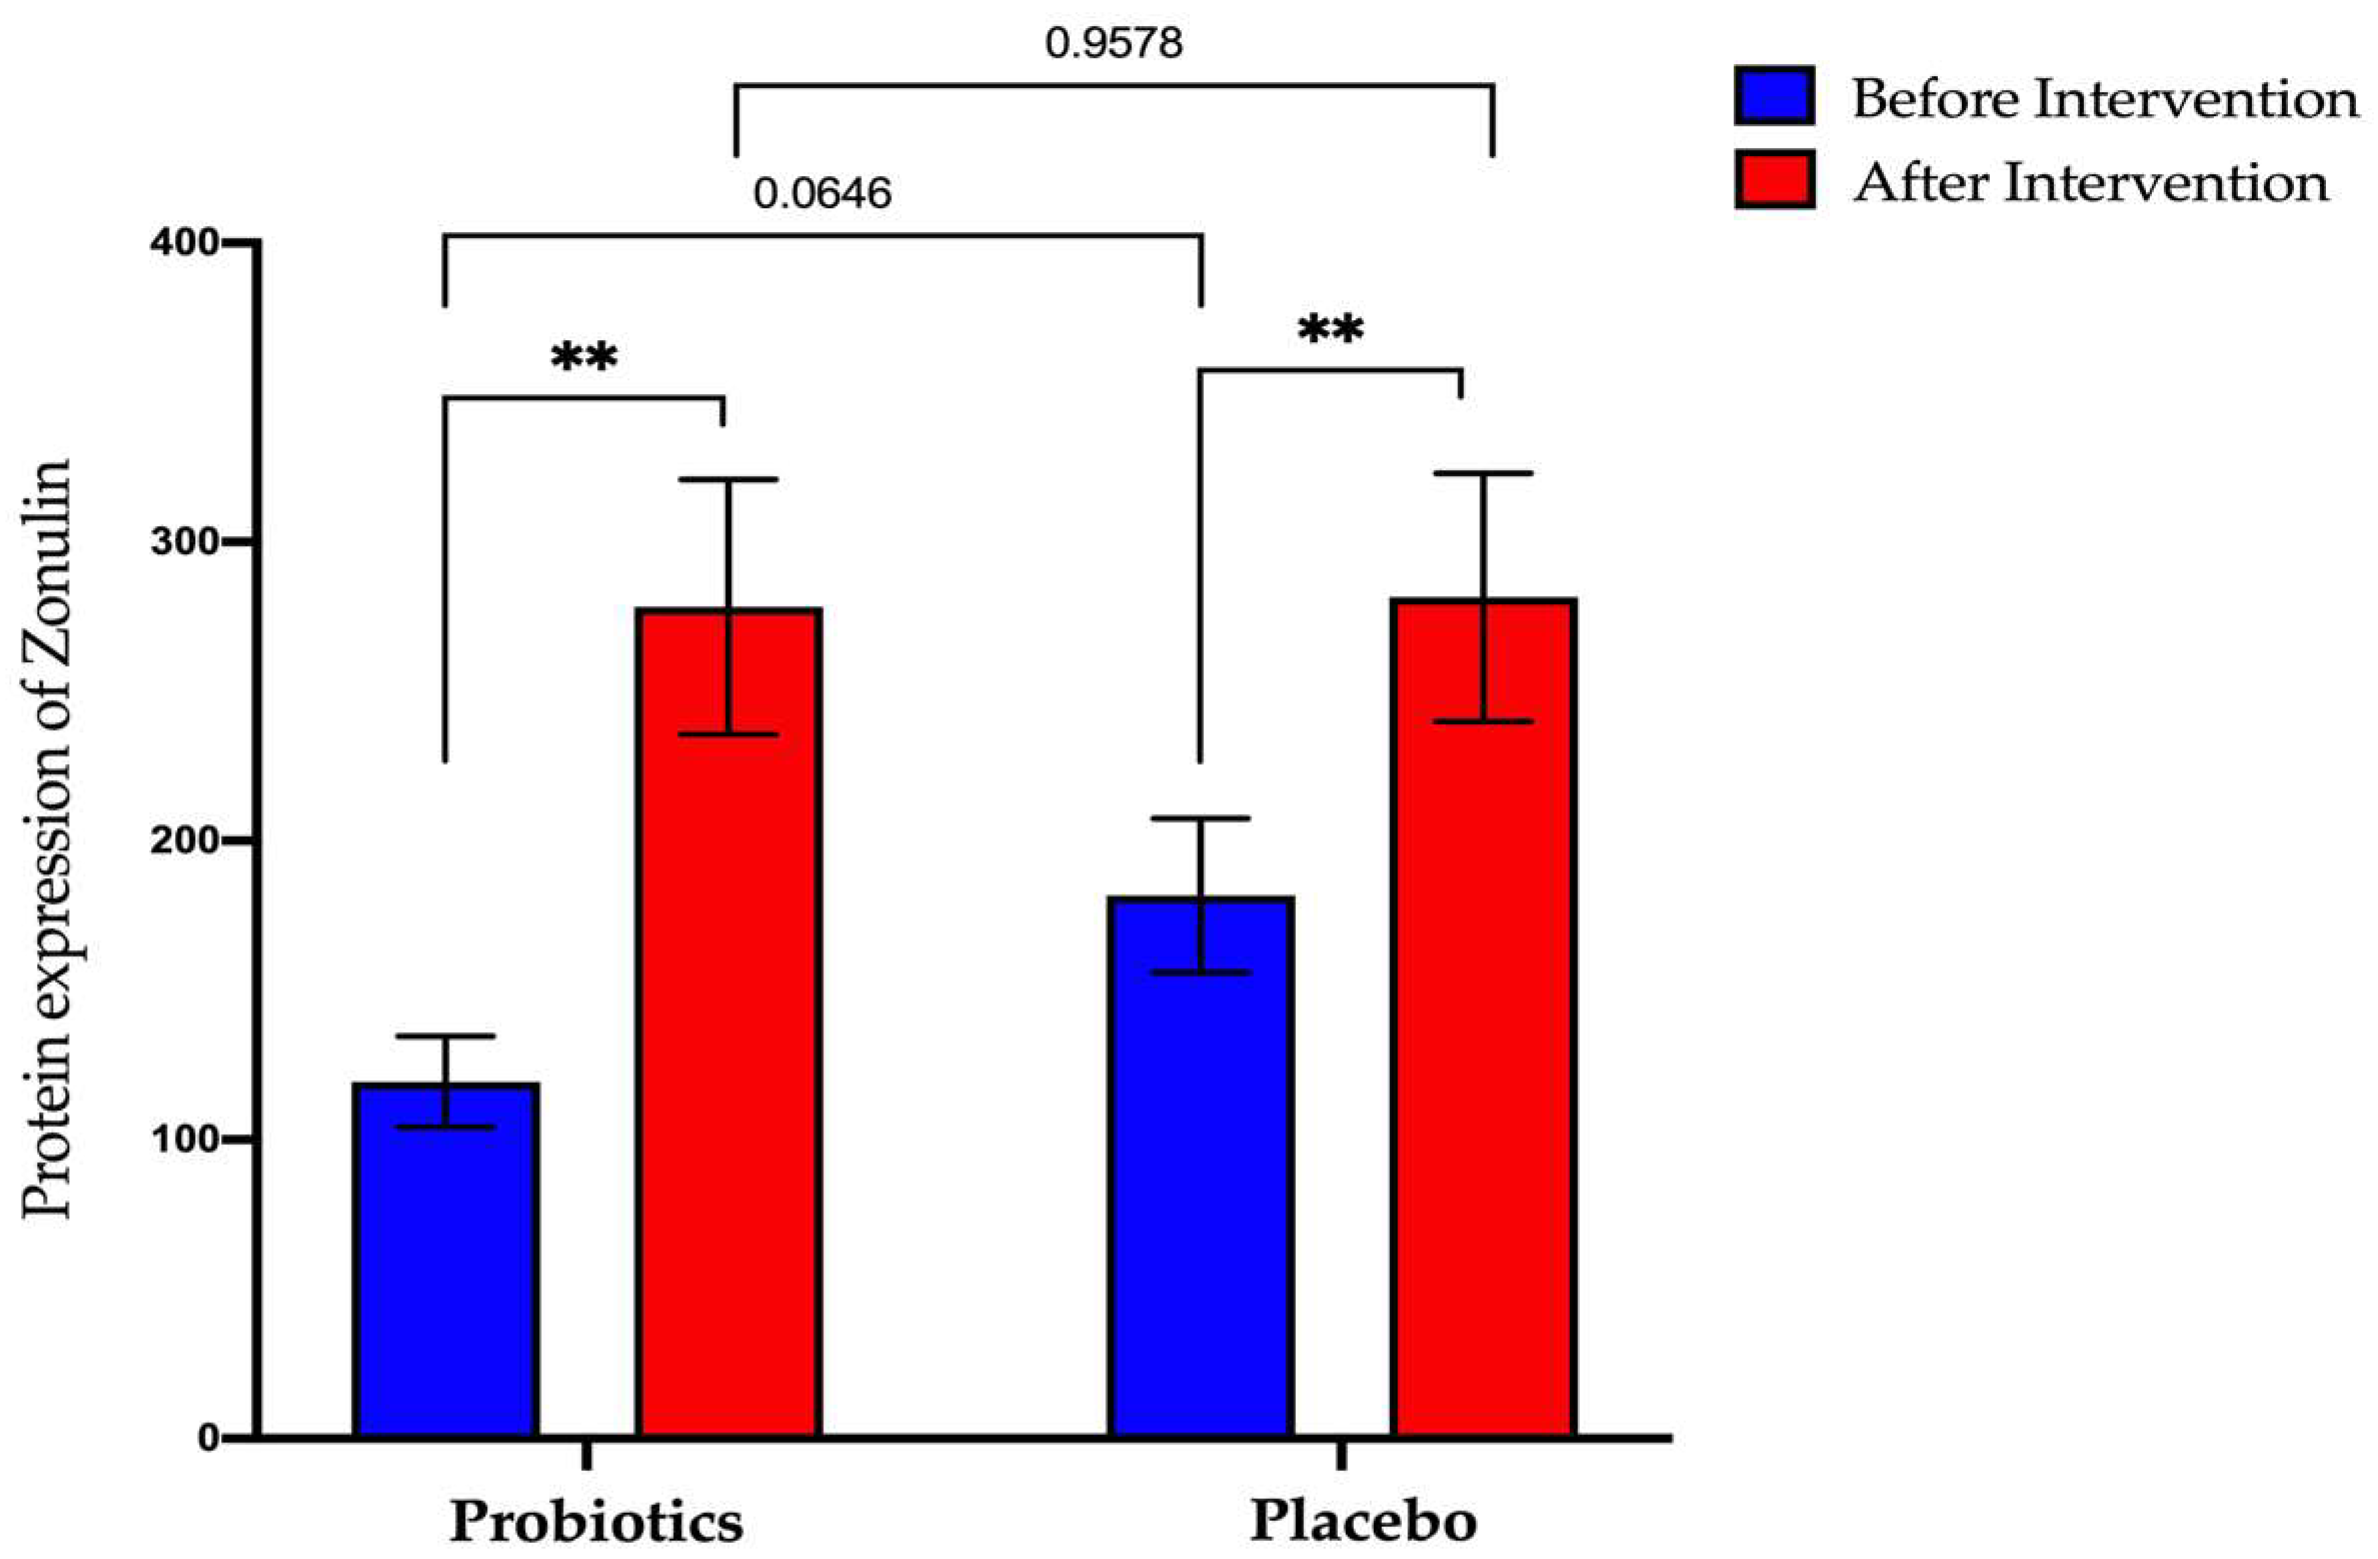
3.4.2. Expression of Zonulin Protein in Serum Samples
4. Discussion
5. Conclusions
Supplementary Materials
Author Contributions
Funding
Institutional Review Board Statement
Informed Consent Statement
Data Availability Statement
Acknowledgments
Conflicts of Interest
References
- Juanola, O.; Martínez-López, S.; Francés, R.; Gómez-Hurtado, I. Non-Alcoholic Fatty Liver Disease: Metabolic, Genetic, Epigenetic and Environmental Risk Factors. Int. J. Environ. Res. Public Health 2021, 18, 5227. [Google Scholar] [CrossRef] [PubMed]
- Powell, E.E.; Wong, V.W.-S.; Rinella, M. Non-alcoholic fatty liver disease. Lancet 2021, 397, 2212–2224. [Google Scholar] [CrossRef] [PubMed]
- Stefan, N.; Häring, H.-U.; Cusi, K. Non-alcoholic fatty liver disease: Causes, diagnosis, cardiometabolic consequences, and treatment strategies. Lancet Diabetes Endocrinol. 2018, 7, 313–324. [Google Scholar] [CrossRef]
- Betrapally, N.; Gillevet, P.M.; Bajaj, J.S. Changes in the Intestinal Microbiome and Alcoholic and Nonalcoholic Liver Diseases: Causes or Effects? Gastroenterology 2016, 150, 1745–1755. [Google Scholar] [CrossRef] [Green Version]
- Ghosh, S.S.; Wang, J.; Yannie, P.J.; Ghosh, S. Intestinal barrier function and metabolic/liver diseases. Liver Res. 2020, 4, 81–87. [Google Scholar] [CrossRef]
- Martín-Mateos, R.; Albillos, A. The Role of the Gut-Liver Axis in Metabolic Dysfunction-Associated Fatty Liver Disease. Front. Immunol. 2021, 12, 660179. [Google Scholar] [CrossRef]
- Poeta, M.; Pierri, L.; Vajro, P. Gut–Liver Axis Derangement in Non-Alcoholic Fatty Liver Disease. Children 2017, 4, 66. [Google Scholar] [CrossRef] [Green Version]
- Paolella, G.; Mandato, C.; Pierri, L.; Poeta, M.; Di Stasi, M.; Vajro, P. Gut-liver axis and probiotics: Their role in non-alcoholic fatty liver disease. World J. Gastroenterol. 2014, 20, 15518–15531. [Google Scholar] [CrossRef]
- Vancamelbeke, M.; Vermeire, S. The intestinal barrier: A fundamental role in health and disease. Expert Rev. Gastroenterol. Hepatol. 2017, 11, 821–834. [Google Scholar] [CrossRef]
- Compare, D.; Coccoli, P.; Rocco, A.; Nardone, O.M.; De Maria, S.; Cartenì, M.; Nardone, G. Gut–liver axis: The impact of gut microbiota on non alcoholic fatty liver disease. Nutr. Metab. Cardiovasc. Dis. 2012, 22, 471–476. [Google Scholar] [CrossRef]
- Duarte, S.M.; Stefano, J.T.; Oliveira, C.P. Microbiota and nonalcoholic fatty liver disease/nonalcoholic steatohepatitis (NAFLD/NASH). Ann. Hepatol. 2019, 18, 416–421. [Google Scholar] [CrossRef]
- Carneros, D.; López-Lluch, G.; Bustos, M. Physiopathology of Lifestyle Interventions in Non-Alcoholic Fatty Liver Disease (NAFLD). Nutrients 2020, 12, 3472. [Google Scholar] [CrossRef] [PubMed]
- Roeb, E. Non-alcoholic fatty liver diseases: Current challenges and future directions. Ann. Transl. Med. 2021, 9, 726. [Google Scholar] [CrossRef] [PubMed]
- Zhu, B.; Chan, S.-L.; Li, J.; Li, K.; Wu, H.; Cui, K.; Chen, H. Non-alcoholic Steatohepatitis Pathogenesis, Diagnosis, and Treatment. Front. Cardiovasc. Med. 2021, 8, 1059. [Google Scholar] [CrossRef] [PubMed]
- Zhao, C.; Lou, F.; Li, X.; Ma, J.; Zhu, Z.; Li, H.; Zhai, Y.; Chen, H.; Zhang, Q.; Liu, Z.; et al. Correlation of CD3+/CD4+, and serum CK-18 fragment levels with glucose and lipid metabolism in elderly type 2 diabetes patients with nonalcoholic fatty liver disease. Am. J. Transl. Res. 2021, 13, 2546–2554. [Google Scholar]
- Ferramosca, A.; Di Giacomo, M.; Zara, V. Antioxidant dietary approach in treatment of fatty liver: New insights and updates. World J. Gastroenterol. 2017, 23, 4146–4157. [Google Scholar] [CrossRef] [PubMed]
- Kumar, D.P.; Caffrey, R.; Marioneaux, J.; Santhekadur, P.K.; Bhat, M.; Alonso, C.; Koduru, S.V.; Philip, B.; Jain, M.R.; Giri, S.R.; et al. The PPAR α/γ Agonist Saroglitazar Improves Insulin Resistance and Steatohepatitis in a Diet Induced Animal Model of Nonalcoholic Fatty Liver Disease. Sci. Rep. 2020, 10, 9330. [Google Scholar] [CrossRef]
- Zhang, C.; Yang, M. Current Options and Future Directions for NAFLD and NASH Treatment. Int. J. Mol. Sci. 2021, 22, 7571. [Google Scholar] [CrossRef]
- Loguercio, C.; Federico, A.; Tuccillo, C.; Terracciano, F.; D’Auria, M.V.; De Simone, C.; Blanco, C.D. Beneficial Effects of a Probiotic VSL#3 on Parameters of Liver Dysfunction in Chronic Liver Diseases. J. Clin. Gastroenterol. 2005, 39, 540–543. [Google Scholar] [CrossRef]
- Leung, C.; Rivera, L.; Furness, J.B.; Angus, P.W. The role of the gut microbiota in NAFLD. Nat. Rev. Gastroenterol. Hepatol. 2016, 13, 412–425. [Google Scholar] [CrossRef]
- Mofidi, F.; Poustchi, H.; Yari, Z.; Nourinayyer, B.; Merat, S.; Sharafkhah, M.; Malekzadeh, R.; Hekmatdoost, A. Synbiotic supplementation in lean patients with non-alcoholic fatty liver disease: A pilot, randomised, double-blind, placebo-controlled, clinical trial. Br. J. Nutr. 2017, 117, 662–668. [Google Scholar] [CrossRef] [Green Version]
- Ministry of Health Malaysia. Clinical Practice Guidelines on Management of Obesity. 2004. Available online: http://www.moh.gov.my (accessed on 6 January 2021).
- Castro-Mejía, J.L.; Khakimov, B.; Krych, Ł.; Bülow, J.; Bechshøft, R.L.; Højfeldt, G.; Mertz, K.H.; Garne, E.S.; Schacht, S.R.; Ahmad, H.F.; et al. Physical fitness in community-dwelling older adults is linked to dietary intake, gut microbiota, and metabolomic signatures. Aging Cell 2020, 19, e13105. [Google Scholar] [CrossRef] [Green Version]
- Wei, S.S.; Yen, C.M.; Marshall, I.P.; Hamid, H.A.; Kamal, S.S.; Nielsen, D.S.; Ahmad, H.F. Gut microbiome and metabolome of sea cucumber (Stichopus ocellatus) as putative markers for monitoring the marine sediment pollution in Pahang, Malaysia. Mar. Pollut. Bull. 2022, 182, 114022. [Google Scholar] [CrossRef]
- Oberacker, P.; Stepper, P.; Bond, D.M.; Höhn, S.; Focken, J.; Meyer, V.; Schelle, L.; Sugrue, V.J.; Jeunen, G.-J.; Moser, T.; et al. Bio-On-Magnetic-Beads (BOMB): Open platform for high-throughput nucleic acid extraction and manipulation. PLOS Biol. 2019, 17, e3000107. [Google Scholar] [CrossRef] [Green Version]
- Chen, Y.; Ji, F.; Guo, J.; Shi, D.; Fang, D.; Li, L. Dysbiosis of small intestinal microbiota in liver cirrhosis and its association with etiology. Sci. Rep. 2016, 6, 34055. [Google Scholar] [CrossRef] [Green Version]
- Martin, M. Cutadapt removes adapter sequences from high-throughput sequencing reads. EMBnet. J. 2011, 17, 10–12. [Google Scholar] [CrossRef]
- Callahan, B.J.; McMurdie, P.J.; Rosen, M.J.; Han, A.W.; Johnson, A.J.; Holmes, S.P. DADA2: High-resolution sample inference from Illumina amplicon data. Nat. Methods 2016, 13, 581–583. [Google Scholar] [CrossRef] [PubMed] [Green Version]
- Bolyen, E.; Rideout, J.R.; Dillon, M.R.; Bokulich, N.A.; Abnet, C.C.; Al-Ghalith, G.A.; Alexander, H.; Alm, E.J.; Arumugam, M.; Asnicar, F.; et al. Reproducible, Interactive, Scalable and Extensible Microbiome Data Science Using QIIME 2. Nat. Biotechnol. 2019, 37, 852–857. [Google Scholar] [CrossRef] [PubMed]
- Bokulich, N.A.; Kaehler, B.D.; Rideout, J.R.; Dillon, M.; Bolyen, E.; Knight, R.; Huttley, G.A.; Gregory Caporaso, J. Optimizing taxonomic classification of marker-gene amplicon sequences with QIIME 2’s q2-feature-classifier plugin. Microbiome 2018, 6, 90. [Google Scholar] [CrossRef] [PubMed]
- Park, E.-J.; Lee, Y.-S.; Kim, S.M.; Park, G.-S.; Lee, Y.H.; Jeong, D.Y.; Kang, J.; Lee, H.-J. Beneficial Effects of Lactobacillus plantarum Strains on Non-Alcoholic Fatty Liver Disease in High Fat/High Fructose Diet-Fed Rats. Nutrients 2020, 12, 542. [Google Scholar] [CrossRef] [PubMed] [Green Version]
- Chong, P.L.; Laight, D.; Aspinall, R.J.; Higginson, A.; Cummings, M.H. A randomised placebo controlled trial of VSL#3® probiotic on biomarkers of cardiovascular risk and liver injury in non-alcoholic fatty liver disease. BMC Gastroenterol. 2021, 21, 144. [Google Scholar] [CrossRef]
- Jaswal, R.; Pathak, A.; Chauhan, A. Metagenomic Evaluation of Bacterial and Fungal Assemblages Enriched within Diffusion Chambers and Microbial Traps Containing Uraniferous Soils. Microorganisms 2019, 7, 324. [Google Scholar] [CrossRef] [PubMed] [Green Version]
- Siew, S.W.; Musa, S.M.; Sabri, N.; Asras, M.F.F.; Ahmad, H.F. Evaluation of pre-treated healthcare wastes during COVID-19 pandemic reveals pathogenic microbiota, antibiotics residues, and antibiotic resistance genes against beta-lactams. Environ. Res. 2023, 219, 115139. [Google Scholar] [CrossRef] [PubMed]
- Dhariwal, A.; Chong, J.; Habib, S.; King, I.L.; Agellon, L.B.; Xia, J. MicrobiomeAnalyst: A web-based tool for comprehensive statistical, visual and meta-analysis of microbiome data. Nucleic Acids Res. 2017, 45, W180–W188. [Google Scholar] [CrossRef] [PubMed]
- Vallianou, N.; Stratigou, T.; Christodoulatos, G.S.; Dalamaga, M. Understanding the Role of the Gut Microbiome and Microbial Metabolites in Obesity and Obesity-Associated Metabolic Disorders: Current Evidence and Perspectives. Curr. Obes. Rep. 2019, 8, 317–332. [Google Scholar] [CrossRef]
- Mordor Intelligence. Probiotics Market- Growth, Trends, COVID-19 Impact and Forecasts (2022–2027). 2022. Available online: www.mordorintelligence.com (accessed on 6 January 2021).
- Wong, C.B.; Odamaki, T.; Xiao, J.-Z. Insights into the reason of Human-Residential Bifidobacteria (HRB) being the natural inhabitants of the human gut and their potential health-promoting benefits. FEMS Microbiol. Rev. 2020, 44, 369–385. [Google Scholar] [CrossRef]
- Salvetti, E.; Torriani, S.; Felis, G.E. The Genus Lactobacillus: A Taxonomic Update. Probiotics Antimicrob. Proteins 2012, 4, 217–226. [Google Scholar] [CrossRef]
- Dempsey, E.; Corr, S.C. Lactobacillus spp. for Gastrointestinal Health: Current and Future Perspectives. Front. Immunol. 2022, 13, 840245. [Google Scholar] [CrossRef]
- Jayasimhan, S.; Yap, N.-Y.; Roest, Y.; Rajandram, R.; Chin, K.-F. Efficacy of microbial cell preparation in improving chronic constipation: A randomized, double-blind, placebo-controlled trial. Clin. Nutr. 2013, 32, 928–934. [Google Scholar] [CrossRef] [Green Version]
- Ghafar, M.Y.A.; Yaakup, H.; Ali, R.A.R.; Shah, S.A. Evaluation of the Efficacy of Probiotics (MCP® BCMC® Strains) Treating Constipation in Elderly Patients with Multiple Chronic Co-Morbidities: A Randomized Control Trial. J. Nutr. Health Aging 2020, 24, 1066–1072. [Google Scholar] [CrossRef]
- Ibrahim, A.; Ali, R.A.R.; Manaf, M.R.A.; Ahmad, N.; Tajurruddin, F.W.; Qin, W.Z.; Desa, S.H.; Ibrahim, N.M. Multi-strain probiotics (Hexbio) containing MCP BCMC strains improved constipation and gut motility in Parkinson’s disease: A randomised controlled trial. PLoS ONE 2020, 15, e0244680. [Google Scholar] [CrossRef] [PubMed]
- Firouzi, S.; Majid, H.A.; Ismail, A.; Kamaruddin, N.A.; Barakatun-Nisak, M.-Y. Effect of multi-strain probiotics (multi-strain microbial cell preparation) on glycemic control and other diabetes-related outcomes in people with type 2 diabetes: A randomized controlled trial. Eur. J. Nutr. 2016, 56, 1535–1550. [Google Scholar] [CrossRef] [PubMed]
- Firouzi, S.; Mohd-Yusof, B.N.; Majid, H.A.; Ismail, A.; Kamaruddin, N.A. Effect of microbial cell preparation on renal profile and liver function among type 2 diabetics: A randomized controlled trial. BMC Complement. Altern. Med. 2015, 15, 433. [Google Scholar] [CrossRef] [Green Version]
- Hasain, Z.; Ali, R.A.R.; Ahmad, H.F.; Rauf, U.F.A.; Oon, S.F.; Mokhtar, N.M. The Roles of Probiotics in the Gut Microbiota Composition and Metabolic Outcomes in Asymptomatic Post-Gestational Diabetes Women: A Randomized Controlled Trial. Nutrients 2022, 14, 3878. [Google Scholar] [CrossRef]
- Zaharuddin, L.; Mokhtar, N.M.; Nawawi, K.N.M.; Ali, R.A.R. A randomized double-blind placebo-controlled trial of probiotics in post-surgical colorectal cancer. BMC Gastroenterol. 2019, 19, 131. [Google Scholar] [CrossRef] [PubMed] [Green Version]
- Golkhalkhali, B.; Rajandram, R.; Paliany, A.S.; Ho, G.F.; Ishak, W.Z.W.; Johari, C.S.; Chin, K.F. Strain-specific probiotic (microbial cell preparation) and omega-3 fatty acid in modulating quality of life and inflammatory markers in colorectal cancer patients: A randomized controlled trial. Asia-Pacific J. Clin. Oncol. 2017, 14, 179–191. [Google Scholar] [CrossRef]
- Tan, C.K.; Said, S.; Rajandram, R.; Wang, Z.; Roslani, A.C.; Chin, K.F. Pre-surgical Administration of Microbial Cell Preparation in Colorectal Cancer Patients: A Randomized Controlled Trial. World J. Surg. 2016, 40, 1985–1992. [Google Scholar] [CrossRef]
- Malik, A.A.; Rajandram, R.; Tah, P.C.; Hakumat-Rai, V.-R.; Chin, K.-F. Microbial cell preparation in enteral feeding in critically ill patients: A randomized, double-blind, placebo-controlled clinical trial. J. Crit. Care 2015, 32, 182–188. [Google Scholar] [CrossRef]
- Mokhtar, N.; Jaafar, N.; Alfian, E.; Rathi, N.M.; Rani, R.A.; Ali, R.R. Clinical assessment and cytokines level in constipation-predominant irritable bowel syndrome participants treated with Lactobacillus-containing cultured milk drink. Acta Gastro Enterol. Belg. 2021, 84, 585–591. [Google Scholar] [CrossRef]
- Hasain, Z.; Ali, R.A.R.; Razak, S.A.; Azizan, K.A.; El-Omar, E.; Razalli, N.H.; Mokhtar, N.M. Gut Microbiota Signature Among Asian Post-gestational Diabetes Women Linked to Macronutrient Intakes and Metabolic Phenotypes. Front. Microbiol. 2021, 12, 680622. [Google Scholar] [CrossRef]
- Scorletti, E.; Afolabi, P.R.; Miles, E.A.; Smith, D.E.; Almehmadi, A.; AlShathry, A.; Childs, C.E.; Del Fabbro, S.; Bilson, J.; Moyses, H.E.; et al. Synbiotics Alter Fecal Microbiomes, But Not Liver Fat or Fibrosis, in a Randomized Trial of Patients With Nonalcoholic Fatty Liver Disease. Gastroenterology 2020, 158, 1597–1610.e7. [Google Scholar] [CrossRef] [PubMed]
- Pot, B.; Vandenplas, Y. Factors that influence clinical efficacy of live biotherapeutic products. Eur. J. Med. Res. 2021, 26, 40. [Google Scholar] [CrossRef] [PubMed]
- Behrouz, V.; Aryaeian, N.; Zahedi, M.J.; Jazayeri, S. Effects of probiotic and prebiotic supplementation on metabolic parameters, liver aminotransferases, and systemic inflammation in nonalcoholic fatty liver disease: A randomized clinical trial. J. Food Sci. 2020, 85, 3611–3617. [Google Scholar] [CrossRef]
- Musazadeh, V.; Roshanravan, N.; Dehghan, P.; Ahrabi, S.S. Effect of Probiotics on Liver Enzymes in Patients With Non-alcoholic Fatty Liver Disease: An Umbrella of Systematic Review and Meta-Analysis. Front. Nutr. 2022, 9, 1094. [Google Scholar] [CrossRef] [PubMed]
- Masroor, M.; Haque, Z. HbA1C as a Biomarker of Non-alcoholic Fatty Liver Disease: Comparison with Anthropometric Parameters. J. Clin. Transl. Hepatol. 2021, 9, 15. [Google Scholar] [CrossRef] [PubMed]
- Chamberlain, J.J.; Rhinehart, A.S.; Shaefer, C.F.; Neuman, A. Diagnosis and Management of Diabetes: Synopsis of the 2016 American Diabetes Association Standards of Medical Care in Diabetes. Ann. Intern. Med. 2016, 164, 542–552. [Google Scholar] [CrossRef]
- Sepideh, A.; Karim, P.; Hossein, A.; Leila, R.; Hamdollah, M.; E, G.M.; Mojtaba, S.; Mohammad, S.; Ghader, G.; Moayed, A.S. Effects of Multistrain Probiotic Supplementation on Glycemic and Inflammatory Indices in Patients with Nonalcoholic Fatty Liver Disease: A Double-Blind Randomized Clinical Trial. J. Am. Coll. Nutr. 2015, 35, 500–505. [Google Scholar] [CrossRef]
- Delik, A.; Dinçer, S.; Ülger, Y.; Akkız, H.; Karaoğullarından, Ü. Metagenomic identification of gut microbiota distribution on the colonic mucosal biopsy samples in patients with non-alcoholic fatty liver disease. Gene 2022, 833, 146587. [Google Scholar] [CrossRef]
- Fitriakusumah, Y.; Lesmana, C.R.A.; Bastian, W.P.; Jasirwan, C.O.M.; Hasan, I.; Simadibrata, M.; Kurniawan, J.; Sulaiman, A.S.; Gani, R.A. The role of Small Intestinal Bacterial Overgrowth (SIBO) in Non-alcoholic Fatty Liver Disease (NAFLD) patients evaluated using Controlled Attenuation Parameter (CAP) Transient Elastography (TE): A tertiary referral center experience. BMC Gastroenterol. 2019, 19, 43. [Google Scholar] [CrossRef] [Green Version]
- Zhu, L.; Baker, S.S.; Gill, C.; Liu, W.; Alkhouri, R.; Baker, R.D.; Gill, S.R. Characterization of gut microbiomes in nonalcoholic steatohepatitis (NASH) patients: A connection between endogenous alcohol and NASH. Hepatology 2013, 57, 601–609. [Google Scholar] [CrossRef]
- Rizzatti, G.; Lopetuso, L.R.; Gibiino, G.; Binda, C.; Gasbarrini, A. Proteobacteria: A Common Factor in Human Diseases. BioMed Res. Int. 2017, 2017, 9351507. [Google Scholar] [CrossRef] [PubMed] [Green Version]
- Vasques-Monteiro, I.M.L.; Silva-Veiga, F.M.; Miranda, C.S.; Gonçalves, C.B.D.A.; Daleprane, J.B.; Souza-Mello, V. A rise in Proteobacteria is an indicator of gut-liver axis-mediated nonalcoholic fatty liver disease in high-fructose-fed adult mice. Nutr. Res. 2021, 91, 26–35. [Google Scholar] [CrossRef] [PubMed]
- Caussy, C.; Tripathi, A.; Humphrey, G.; Bassirian, S.; Singh, S.; Faulkner, C.; Bettencourt, R.; Rizo, E.; Richards, L.; Xu, Z.Z.; et al. A gut microbiome signature for cirrhosis due to nonalcoholic fatty liver disease. Nat. Commun. 2019, 10, 1406. [Google Scholar] [CrossRef] [PubMed] [Green Version]
- Binda, C.; Lopetuso, L.R.; Rizzatti, G.; Gibiino, G.; Cennamo, V.; Gasbarrini, A. Actinobacteria: A relevant minority for the maintenance of gut homeostasis. Dig. Liver Dis. 2018, 50, 421–428. [Google Scholar] [CrossRef] [PubMed]
- Zeybel, M.; Altay, O.; Arif, M.; Li, X.; Yang, H.; Fredolini, C.; Akyildiz, M.; Saglam, B.; Gonenli, M.G.; Ural, D.; et al. Combined metabolic activators therapy ameliorates liver fat in nonalcoholic fatty liver disease patients. Mol. Syst. Biol. 2021, 17, e10459. [Google Scholar] [CrossRef]
- Setshedi, M.; Wands, J.R.; De Monte, S.M. Alcohol Enzyme Polymorphisms. Oxidative Med. Cell. Longev. 2010, 3, 178–185. [Google Scholar] [CrossRef] [Green Version]
- Alazawi, W.; Bernabe, E.; Tai, D.; Janicki, T.; Kemos, P.; Samsuddin, S.; Syn, W.-K.; Gillam, D.; Turner, W. Periodontitis is associated with significant hepatic fibrosis in patients with non-alcoholic fatty liver disease. PLoS ONE 2017, 12, e0185902. [Google Scholar] [CrossRef] [Green Version]
- Willis, A.D. Rarefaction, alpha diversity, and statistics. Front. Microbiol. 2019, 10, 2407. [Google Scholar] [CrossRef] [Green Version]
- Pan, X.; Wen, S.W.; Kaminga, A.C.; Liu, A. Gut metabolites and inflammation factors in non-alcoholic fatty liver disease: A systematic review and meta-analysis. Sci. Rep. 2020, 10, 8848. [Google Scholar] [CrossRef]
- Vital, M.; Howe, A.C.; Tiedje, J.M. Revealing the Bacterial Butyrate Synthesis Pathways by Analyzing (Meta)genomic Data. Mbio 2014, 5, e00889-14. [Google Scholar] [CrossRef] [Green Version]
- Woodhouse, C.A.; Patel, V.C.; Singanayagam, A.; Shawcross, D.L. Review article: The gut microbiome as a therapeutic target in the pathogenesis and treatment of chronic liver disease. Aliment. Pharmacol. Ther. 2017, 47, 192–202. [Google Scholar] [CrossRef] [Green Version]
- Rinninella, E.; Raoul, P.; Cintoni, M.; Franceschi, F.; Miggiano, G.A.; Gasbarrini, A.; Mele, M.C. What Is the Healthy Gut Microbiota Composition? A Changing Ecosystem across Age, Environment, Diet, and Diseases. Microorganisms 2019, 7, 14. [Google Scholar] [CrossRef] [Green Version]
- Federico, A.; Dallio, M.; Godos, J.; Loguercio, C.; Salomone, F. Targeting gut-liver axis for the treatment of nonalcoholic steatohepatitis: Translational and clinical evidence. Transl. Res. 2015, 167, 116–124. [Google Scholar] [CrossRef]
- Vuik, F.; Dicksved, J.; Lam, S.Y.; Fuhler, G.M.; Van Der Laan, L.; Van De Winkel, A.; Konstantinov, S.R.; Spaander, M.; Peppelenbosch, M.P.; Engstrand, L.; et al. Composition of the mucosa-associated microbiota along the entire gastrointestinal tract of human individuals. United Eur. Gastroenterol. J. 2019, 7, 897–907. [Google Scholar] [CrossRef] [Green Version]
- Katsarou, A.; Moustakas, I.I.; Pyrina, I.; Lembessis, P.; Koutsilieris, M.; Chatzigeorgiou, A. Metabolic inflammation as an instigator of fibrosis during non-alcoholic fatty liver disease. World J. Gastroenterol. 2020, 26, 1993–2011. [Google Scholar] [CrossRef]
- Iwaki, M.; Kessoku, T.; Ozaki, A.; Kasai, Y.; Kobayashi, T.; Nogami, A.; Honda, Y.; Ogawa, Y.; Imajo, K.; Yoneda, M.; et al. Gut microbiota composition associated with hepatic fibrosis in non-obese patients with non-alcoholic fatty liver disease. J. Gastroenterol. Hepatol. 2021, 36, 2275–2284. [Google Scholar] [CrossRef] [PubMed]
- Loomba, R.; Seguritan, V.; Li, W.; Long, T.; Klitgord, N.; Bhatt, A.; Dulai, P.S.; Caussy, C.; Bettencourt, R.; Highlander, S.K.; et al. Gut Microbiome-Based Metagenomic Signature for Non-invasive Detection of Advanced Fibrosis in Human Nonalcoholic Fatty Liver Disease. Cell Metab. 2017, 25, 1054–1062. [Google Scholar] [CrossRef]
- Tsai, M.-C.; Liu, Y.-Y.; Lin, C.-C.; Wang, C.-C.; Wu, Y.-J.; Yong, C.-C.; Chen, K.-D.; Chuah, S.-K.; Yao, C.-C.; Huang, P.-Y.; et al. Gut Microbiota Dysbiosis in Patients with Biopsy-Proven Nonalcoholic Fatty Liver Disease: A Cross-Sectional Study in Taiwan. Nutrients 2020, 12, 820. [Google Scholar] [CrossRef] [Green Version]
- Shen, F.; Zheng, R.-D.; Sun, X.-Q.; Ding, W.-J.; Wang, X.-Y.; Fan, J.-G. Gut microbiota dysbiosis in patients with non-alcoholic fatty liver disease. Hepatobiliary Pancreat. Dis. Int. 2017, 16, 375–381. [Google Scholar] [CrossRef]
- Lützhøft, D.O.; Sinioja, T.; Christoffersen, B.; Jakobsen, R.R.; Geng, D.; Bin Ahmad, H.F.; Straarup, E.M.; Pedersen, K.-M.; Kot, W.; Pedersen, H.D.; et al. Marked gut microbiota dysbiosis and increased imidazole propionate are associated with a NASH Göttingen Minipig model. BMC Microbiol. 2022, 22, 287. [Google Scholar] [CrossRef]
- Tang, Q.; Jin, G.; Wang, G.; Liu, T.; Liu, X.; Wang, B.; Cao, H. Current Sampling Methods for Gut Microbiota: A Call for More Precise Devices. Front. Cell. Infect. Microbiol. 2020, 10, 151. [Google Scholar] [CrossRef] [PubMed]
- Albillos, A.; de Gottardi, A.; Rescigno, M. The gut-liver axis in liver disease: Pathophysiological basis for therapy. J. Hepatol. 2020, 72, 558–577. [Google Scholar] [CrossRef] [Green Version]
- Jiang, W.; Wu, N.; Wang, X.; Chi, Y.; Zhang, Y.; Qiu, X.; Hu, Y.; Li, J.; Liu, Y. Dysbiosis gut microbiota associated with inflammation and impaired mucosal immune function in intestine of humans with non-alcoholic fatty liver disease. Sci. Rep. 2015, 5, srep08096. [Google Scholar] [CrossRef] [PubMed] [Green Version]
- Abhari, K.; Saadati, S.; Yari, Z.; Hosseini, H.; Hedayati, M.; Abhari, S.; Alavian, S.M.; Hekmatdoost, A. The effects of Bacillus coagulans supplementation in patients with non-alcoholic fatty liver disease: A randomized, placebo-controlled, clinical trial. Clin. Nutr. ESPEN 2020, 39, 53–60. [Google Scholar] [CrossRef]
- Darabi, Z.; Darand, M.; Yari, Z.; Hedayati, M.; Faghihi, A.; Agah, S.; Hekmatdoost, A. Inflammatory markers response to citrulline supplementation in patients with non-alcoholic fatty liver disease: A randomized, double blind, placebo-controlled, clinical trial. BMC Res. Notes 2019, 12, 89. [Google Scholar] [CrossRef]
- Kobyliak, N.; Abenavoli, L.; Mykhalchyshyn, G.; Kononenko, L.; Boccuto, L.; Kyriienko, D.; Dynnyk, O. A Multi-strain Probiotic Reduces the Fatty Liver Index, Cytokines and Aminotransferase levels in NAFLD Patients: Evidence from a Randomized Clinical Trial. J. Gastrointest. Liver Dis. 2018, 27, 41–49. [Google Scholar] [CrossRef] [Green Version]
- Wueest, S.; Konrad, D. The controversial role of IL-6 in adipose tissue on obesity-induced dysregulation of glucose metabolism. Am. J. Physiol. Metab. 2020, 319, E607–E613. [Google Scholar] [CrossRef]
- Guo, Y.; Wang, B.; Wang, T.; Gao, L.; Yang, Z.-J.; Wang, F.-F.; Shang, H.-W.; Hua, R.; Xu, J.-D. Biological characteristics of IL-6 and related intestinal diseases. Int. J. Biol. Sci. 2021, 17, 204–219. [Google Scholar] [CrossRef]
- Luo, Y.; Zheng, S.G. Hall of Fame among Pro-inflammatory Cytokines: Interleukin-6 Gene and Its Transcriptional Regulation Mechanisms. Front. Immunol. 2016, 7, 604. [Google Scholar] [CrossRef] [Green Version]
- A Kuhn, K.; Schulz, H.M.; Regner, E.H.; Severs, E.L.; Hendrickson, J.D.; Mehta, G.; Whitney, A.K.; Ir, D.; Ohri, N.; E Robertson, C.; et al. Bacteroidales recruit IL-6-producing intraepithelial lymphocytes in the colon to promote barrier integrity. Mucosal Immunol. 2017, 11, 357–368. [Google Scholar] [CrossRef] [Green Version]
- Kawashima, T.; Ikari, N.; Kouchi, T.; Kowatari, Y.; Kubota, Y.; Shimojo, N.; Tsuji, N.M. The molecular mechanism for activating IgA production by Pediococcus acidilactici K15 and the clinical impact in a randomized trial. Sci. Rep. 2018, 8, 5065. [Google Scholar] [CrossRef] [Green Version]
- Vinderola, G.; Matar, C.; Perdigon, G. Role of Intestinal Epithelial Cells in Immune Effects Mediated by Gram-Positive Probiotic Bacteria: Involvement of Toll-Like Receptors. Clin. Vaccine Immunol. 2005, 12, 1075–1084. [Google Scholar] [CrossRef] [Green Version]
- De Munck, T.J.I.; Xu, P.; Verwijs, H.J.A.; Masclee, A.A.M.; Jonkers, D.; Verbeek, J.; Koek, G.H. Intestinal permeability in human nonalcoholic fatty liver disease: A systematic review and meta-analysis. Liver Int. 2020, 40, 2906–2916. [Google Scholar] [CrossRef]
- Graziani, C.; Talocco, C.; de Sire, R.; Petito, V.; Lopetuso, L.R.; Gervasoni, J.; Persichilli, S.; Franceschi, F.; Ojetti, V.; Gasbarrini, A.; et al. Intestinal permeability in physiological and pathological conditions: Major determinants and assessment modalities. Eur. Rev. Med. Pharmacol. Sci. 2019, 23, 795–810. [Google Scholar]
- Fasano, A.; Not, T.; Wang, W.; Uzzau, S.; Berti, I.; Tommasini, A.; Goldblum, S.E. Zonulin, a newly discovered modulator of intestinal permeability, and its expression in coeliac disease. Lancet 2000, 355, 1518–1519. [Google Scholar] [CrossRef] [PubMed]
- Hendy, O.M.; Elsabaawy, M.M.; Aref, M.M.; Khalaf, F.M.; Oda, A.M.A.; El Shazly, H.M. Evaluation of circulating zonulin as a potential marker in the pathogenesis of nonalcoholic fatty liver disease. Apmis 2017, 125, 607–613. [Google Scholar] [CrossRef] [PubMed]
- Kim, B.; Kwon, J.; Kim, M.-S.; Park, H.; Ji, Y.; Holzapfel, W.; Hyun, C.-K. Protective effects of Bacillus probiotics against high-fat diet-induced metabolic disorders in mice. PLoS ONE 2018, 13, e0210120. [Google Scholar] [CrossRef] [Green Version]
- Pacifico, L.; Bonci, E.; Marandola, L.; Romaggioli, S.; Bascetta, S.; Chiesa, C. Increased circulating zonulin in children with biopsy-proven nonalcoholic fatty liver disease. World J. Gastroenterol. 2014, 20, 17107–17114. [Google Scholar] [CrossRef]
- Nor, M.H.M.; Ayob, N.; Mokhtar, N.M.; Ali, R.A.R.; Tan, G.C.; Wong, Z.; Shafiee, N.H.; Wong, Y.P.; Mustangin, M.; Nawawi, K.N.M. The Effect of Probiotics (MCP® BCMC® Strains) on Hepatic Steatosis, Small Intestinal Mucosal Immune Function, and Intestinal Barrier in Patients with Non-Alcoholic Fatty Liver Disease. Nutrients 2021, 13, 3192. [Google Scholar] [CrossRef]
- Miele, L.; Valenza, V.; La Torre, G.; Montalto, M.; Cammarota, G.; Ricci, R.; Mascianà, R.; Forgione, A.; Gabrieli, M.L.; Perotti, G.; et al. Increased intestinal permeability and tight junction alterations in nonalcoholic fatty liver disease. Hepatology 2009, 49, 1877–1887. [Google Scholar] [CrossRef]
- Briskey, D.; Heritage, M.; Jaskowski, L.-A.; Peake, J.; Gobe, G.; Subramaniam, V.N.; Crawford, D.; Campbell, C.; Vitetta, L. Probiotics modify tight-junction proteins in an animal model of nonalcoholic fatty liver disease. Ther. Adv. Gastroenterol. 2016, 9, 463–472. [Google Scholar] [CrossRef] [PubMed] [Green Version]
- Krawczyk, M.; Maciejewska, D.; Ryterska, K.; Czerwińka-Rogowska, M.; Jamioł-Milc, D.; Skonieczna-Żydecka, K.; Milkiewicz, P.; Raszeja-Wyszomirska, J.; Stachowska, E. Gut Permeability Might be Improved by Dietary Fiber in Individuals with Nonalcoholic Fatty Liver Disease (NAFLD) Undergoing Weight Reduction. Nutrients 2018, 10, 1793. [Google Scholar] [CrossRef] [PubMed] [Green Version]
- Paul, J.; Veenstra, T.D. Separation of Serum and Plasma Proteins for In-Depth Proteomic Analysis. Separations 2022, 9, 89. [Google Scholar] [CrossRef]
- Pawlik-Sobecka, L.; Sołkiewicz, K.; Kokot, I.; Kiraga, A.; Płaczkowska, S.; Schlichtinger, A.M.; Kratz, E.M. The Influence of Serum Sample Storage Conditions on Selected Laboratory Parameters Related to Oxidative Stress: A Preliminary Study. Diagnostics 2020, 10, 51. [Google Scholar] [CrossRef] [Green Version]
- Lazar, K.L.; Patapoff, T.W.; Sharma, V.K. Cold denaturation of monoclonal antibodies. Mabs 2010, 2, 42–52. [Google Scholar] [CrossRef] [Green Version]
- Kueltzo, L.A.; Wang, W.; Randolph, T.W.; Carpenter, J.F. Effects of Solution Conditions, Processing Parameters, and Container Materials on Aggregation of a Monoclonal Antibody during Freeze-Thawing. J. Pharm. Sci. 2008, 97, 1801–1812. [Google Scholar] [CrossRef]
- Leng, S.X.; McElhaney, J.E.; Walston, J.D.; Xie, D.; Fedarko, N.S.; Kuchel, G.A. ELISA and Multiplex Technologies for Cytokine Measurement in Inflammation and Aging Research. J. Gerontol. Ser. A 2008, 63, 879–884. [Google Scholar] [CrossRef] [PubMed] [Green Version]
- Garber, T.R.; Gonias, S.L.; Webb, D.J.; Roet, K.C.; Bossers, K.; Franssen, E.H.; Ruitenberg, M.J.; Verhaagen, J.; Leng, S.X.; McElhaney, J.E.; et al. Interleukin-4 and IL-10 Bind Covalently to Activated Human alpha2-Macroglobulin by a Mechanism That Requires Cys949. J. Interf. Cytokine Res. 2000, 20, 125–132. [Google Scholar] [CrossRef]
- Bauman, T.M.; Ricke, E.A.; Drew, S.A.; Huang, W.; Ricke, W.A. Quantitation of Protein Expression and Co-localization Using Multiplexed Immunohistochemical Staining and Multispectral Imaging. J. Vis. Exp. 2016, 110, e53837. [Google Scholar] [CrossRef]
- Ferrier, C.M.; de Witte, H.H.; Straatman, H.; van Tienoven, D.H.; van Geloof, W.L.; Rietveld, F.J.R.; Sweep, C.G.J.; Ruiter, D.J.; van Muijen, G.N.P. Comparison of immunohistochemistry with immunoassay (ELISA) for the detection of components of the plasminogen activation system in human tumour tissue. Br. J. Cancer 1999, 79, 1534–1541. [Google Scholar] [CrossRef] [Green Version]
- Hasain, Z.; Roos, N.A.C.; Rahmat, F.; Mustapa, M.; Ali, R.A.R.; Mokhtar, N.M. Diet and Pre-Intervention Washout Modifies the Effects of Probiotics on Gestational Diabetes Mellitus: A Comprehensive Systematic Review and Meta-Analysis of Randomized Controlled Trials. Nutrients 2021, 13, 3045. [Google Scholar] [CrossRef] [PubMed]


| Characteristics | Total (n = 40) | Probiotics (n = 18) | Placebo (n = 22) | p-Value |
|---|---|---|---|---|
| Age (years) | 52.23 ± 12.89 | 55.00 ± 11.07 | 49.95 ± 14.05 | 0.22 |
| Gender, n (%) | ||||
| Men | 29 (72.5) | 12 (66.7) | 17 (77.3) | 0.50 |
| Women | 11 (27.5) | 6 (33.3) | 5 (22.7) | |
| Ethnicity, n (%) | ||||
| Malay | 25 (65.2) | 12 (66.7) | 13 (59.1) | 0.79 |
| Chinese | 11 (27.5) | 4 (22.2) | 7 (31.8) | |
| Indian | 4 (10.0) | 2 (11.1) | 2 (9.1) |
| Probiotics (n = 18) | p-Value | Placebo (n = 22) | p-Value | |||
|---|---|---|---|---|---|---|
| Baseline | End of Study | Baseline | End of Study | |||
| Body mass index, kg/m2 | 28.25 ± 4.36 | 28.01 ± 4.08 | 0.68 | 28.29 ± 3.91 | 29.19 ± 5.17 | 0.14 |
| Waist circumference, cm | 95.86 ± 9.74 | 94.61 ± 10.05 | 0.25 | 97.84 ± 11.45 | 97.61 ± 11.11 | 0.88 |
| ALT (IU/L) | 78.67 ± 52.45 | 86.17 ± 75.02 | 0.54 | 78.45 ± 41.18 | 78.32 ± 43.89 | 0.98 |
| AST (IU/L) | 47.61 ± 16.82 | 46.28 ± 23.37 | 0.77 | 50.59 ± 21.64 | 46.86 ± 26.77 | 0.31 |
| GGT (IU/L) | 21.90 ± 13.33 | 17.90 ± 124.70 | 0.96 | 19.50 ± 205.9 | 16.90 ± 207.4 | 0.84 |
| Triglycerides (mmol/L) | 2.10 ± 0.85 | 2.07 ± 0.98 | 0.57 | 2.11 ± 0.77 | 2.42 ± 1.47 | 0.34 |
| Total cholesterol (mmol/L) | 5.91 ± 0.92 | 5.62 ± 0.92 | <0.0001 | 5.63 ± 0.92 | 5.72 ± 1.46 | 0.65 |
| Glucose (mmol/L) | 5.44 ± 1.40 | 5.76 ± 1.21 | 0.22 | 5.61 ± 1.53 | 5.10 ± 1.53 | 0.05 |
| Bilirubin (mmol/L) | 17.81 ± 8.31 | 16.91 ± 9.39 | 0.37 | 16.46 ± 6.23 | 17.28 ± 11.28 | 0.45 |
| Alpha-2-macroglobulin (mmol/L) | 1.57 ± 0.46 | 1.53 ± 0.43 | 0.37 | 1.80 ± 0.68 | 1.81 ± 0.68 | 0.82 |
| Apolipoprotein (mmol/L) | 1.52 ± 0.25 | 1.41 ± 0.38 | 0.22 | 1.50 ± 0.23 | 1.30 ± 0.38 | 0.0019 |
| Fasting glucose, mg/dL | 5.13 (0.96) | 5.6 (1.09) | 0.06 | 5.50 (1.53) | 5.14 (0.68) | 0.28 |
Disclaimer/Publisher’s Note: The statements, opinions and data contained in all publications are solely those of the individual author(s) and contributor(s) and not of MDPI and/or the editor(s). MDPI and/or the editor(s) disclaim responsibility for any injury to people or property resulting from any ideas, methods, instructions or products referred to in the content. |
© 2023 by the authors. Licensee MDPI, Basel, Switzerland. This article is an open access article distributed under the terms and conditions of the Creative Commons Attribution (CC BY) license (https://creativecommons.org/licenses/by/4.0/).
Share and Cite
Ayob, N.; Muhammad Nawawi, K.N.; Mohamad Nor, M.H.; Raja Ali, R.A.; Ahmad, H.F.; Oon, S.F.; Mohd Mokhtar, N. The Effects of Probiotics on Small Intestinal Microbiota Composition, Inflammatory Cytokines and Intestinal Permeability in Patients with Non-Alcoholic Fatty Liver Disease. Biomedicines 2023, 11, 640. https://doi.org/10.3390/biomedicines11020640
Ayob N, Muhammad Nawawi KN, Mohamad Nor MH, Raja Ali RA, Ahmad HF, Oon SF, Mohd Mokhtar N. The Effects of Probiotics on Small Intestinal Microbiota Composition, Inflammatory Cytokines and Intestinal Permeability in Patients with Non-Alcoholic Fatty Liver Disease. Biomedicines. 2023; 11(2):640. https://doi.org/10.3390/biomedicines11020640
Chicago/Turabian StyleAyob, Nurainina, Khairul Najmi Muhammad Nawawi, Mohamad Hizami Mohamad Nor, Raja Affendi Raja Ali, Hajar Fauzan Ahmad, Seok Fang Oon, and Norfilza Mohd Mokhtar. 2023. "The Effects of Probiotics on Small Intestinal Microbiota Composition, Inflammatory Cytokines and Intestinal Permeability in Patients with Non-Alcoholic Fatty Liver Disease" Biomedicines 11, no. 2: 640. https://doi.org/10.3390/biomedicines11020640