
c-Met+ Cytotoxic T Lymphocytes Exhibit Enhanced Cytotoxicity in Mice and Humans In Vitro Tumor Models
 , and
, and 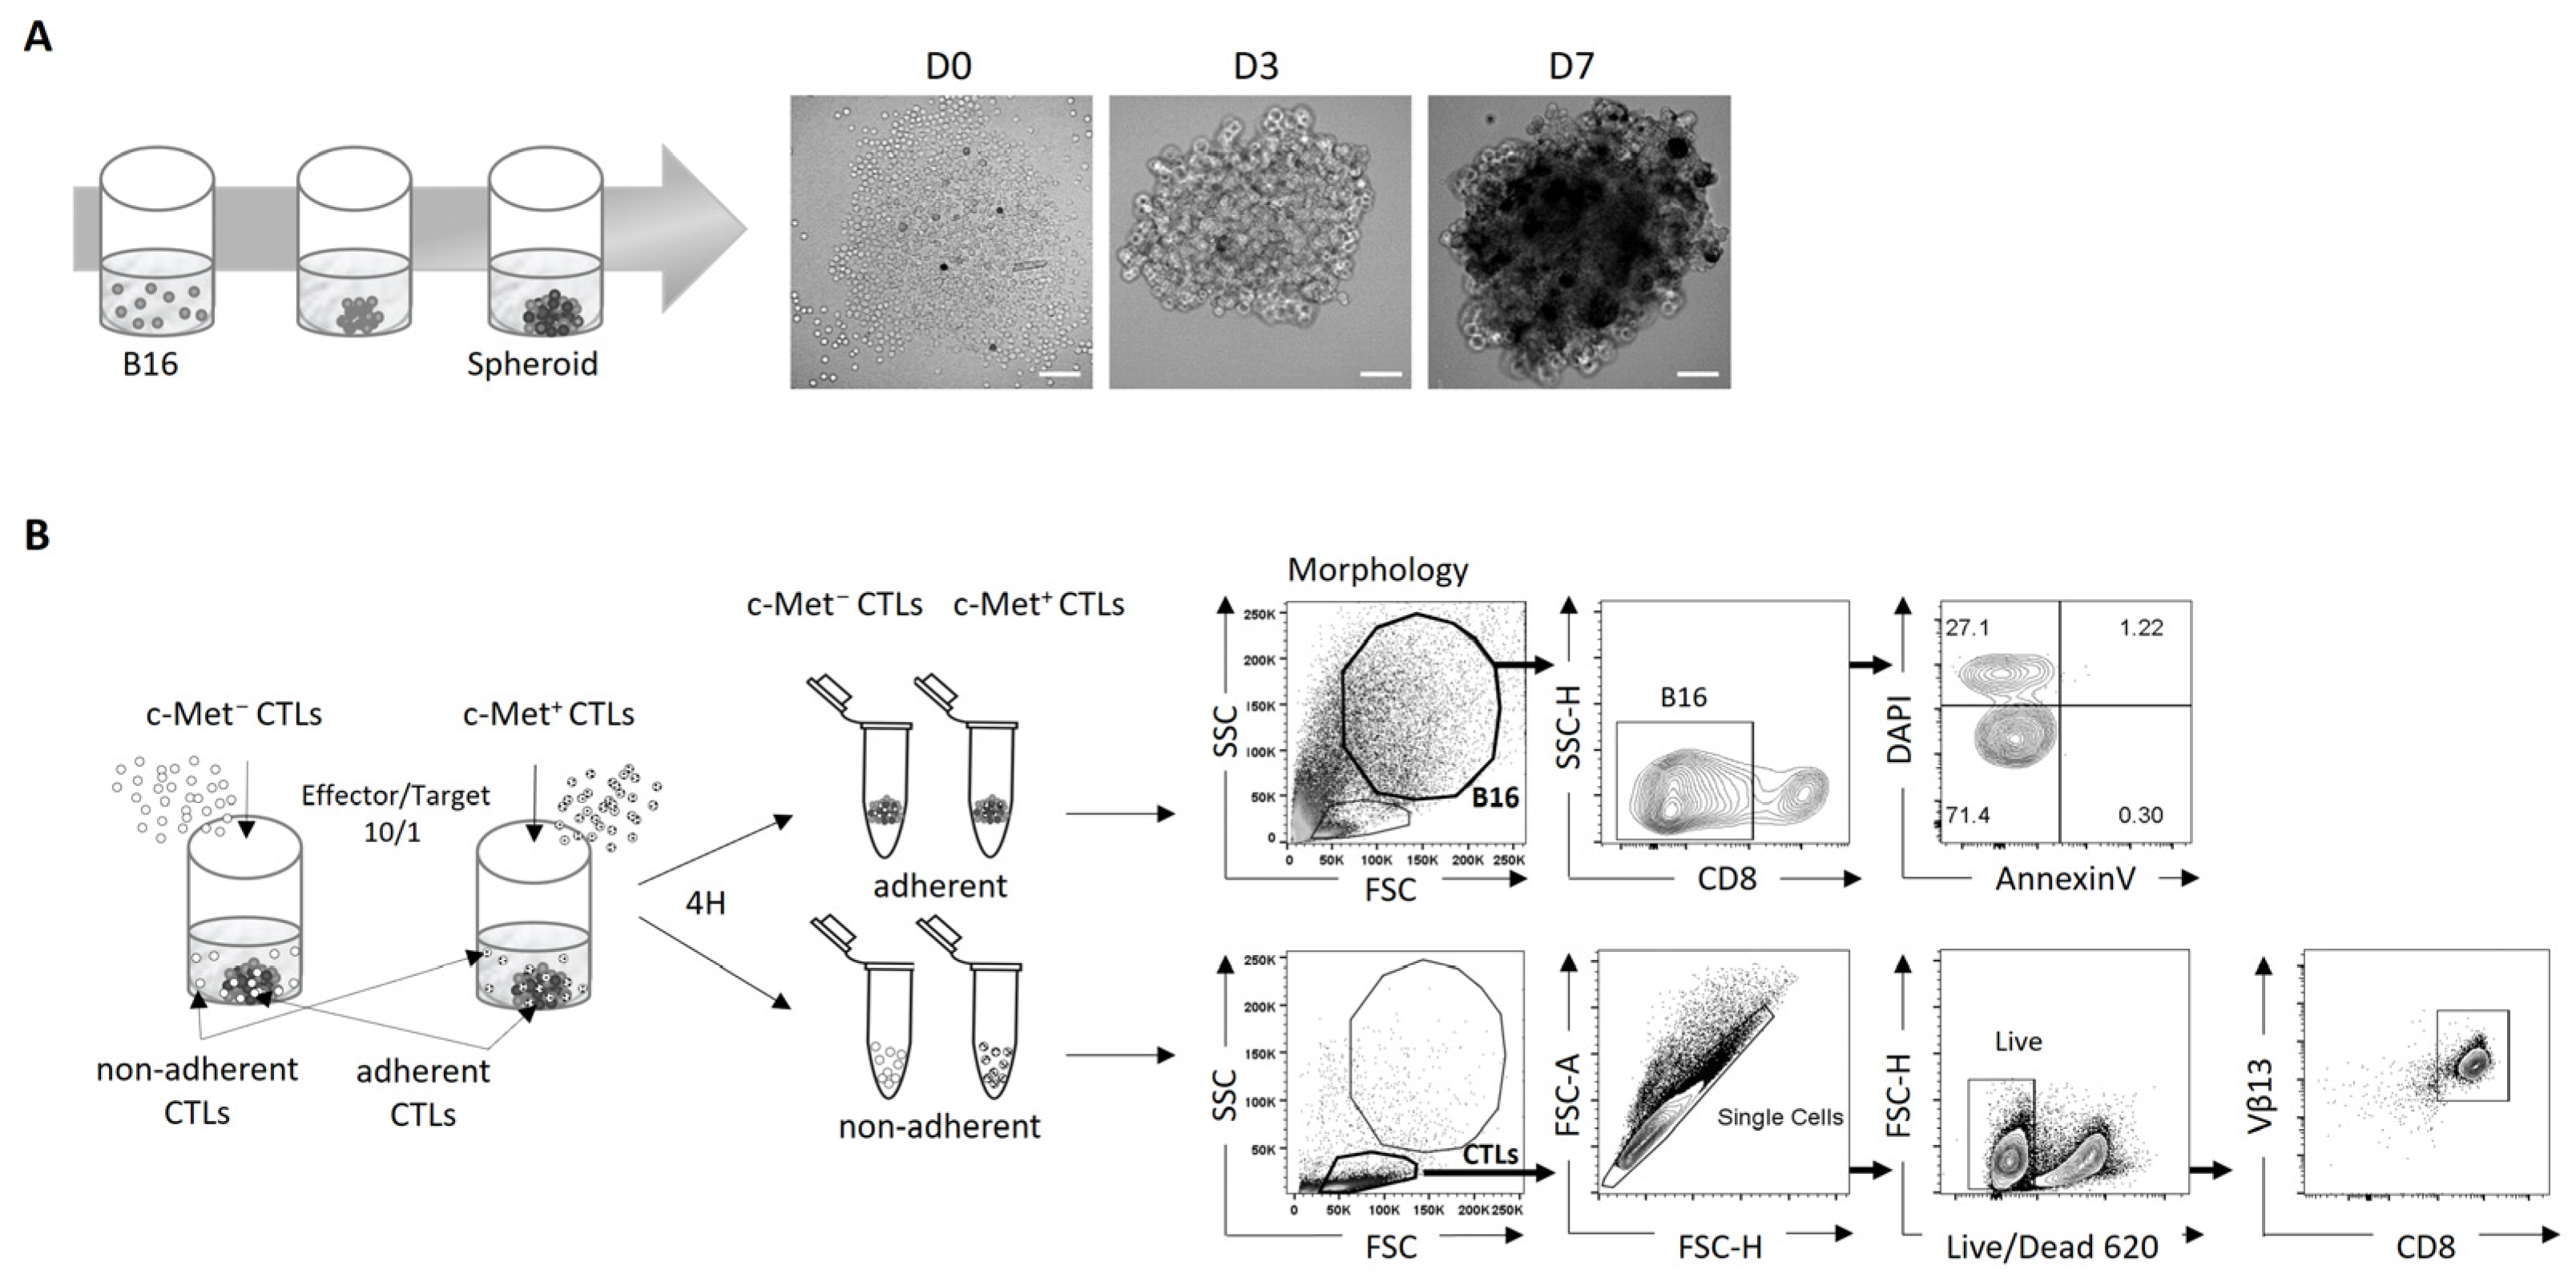
Abstract
:1. Introduction
2. Methods
2.1. Reagents
2.2. Spheroids Preparation
2.3. Cells and Cultures
2.4. CTL Stimulation
2.5. Human CTL Clones and T2 Cells
2.6. Flow Cytometry
2.7. RT-PCR
2.8. In Vitro Cytotoxicity Assay
2.9. Western Blotting
2.10. Statistical Analysis
3. Results
3.1. Using 3D B16 Spheroids to Study the Phenotype and Function of Tumor-Specific c-Met+ CTLs
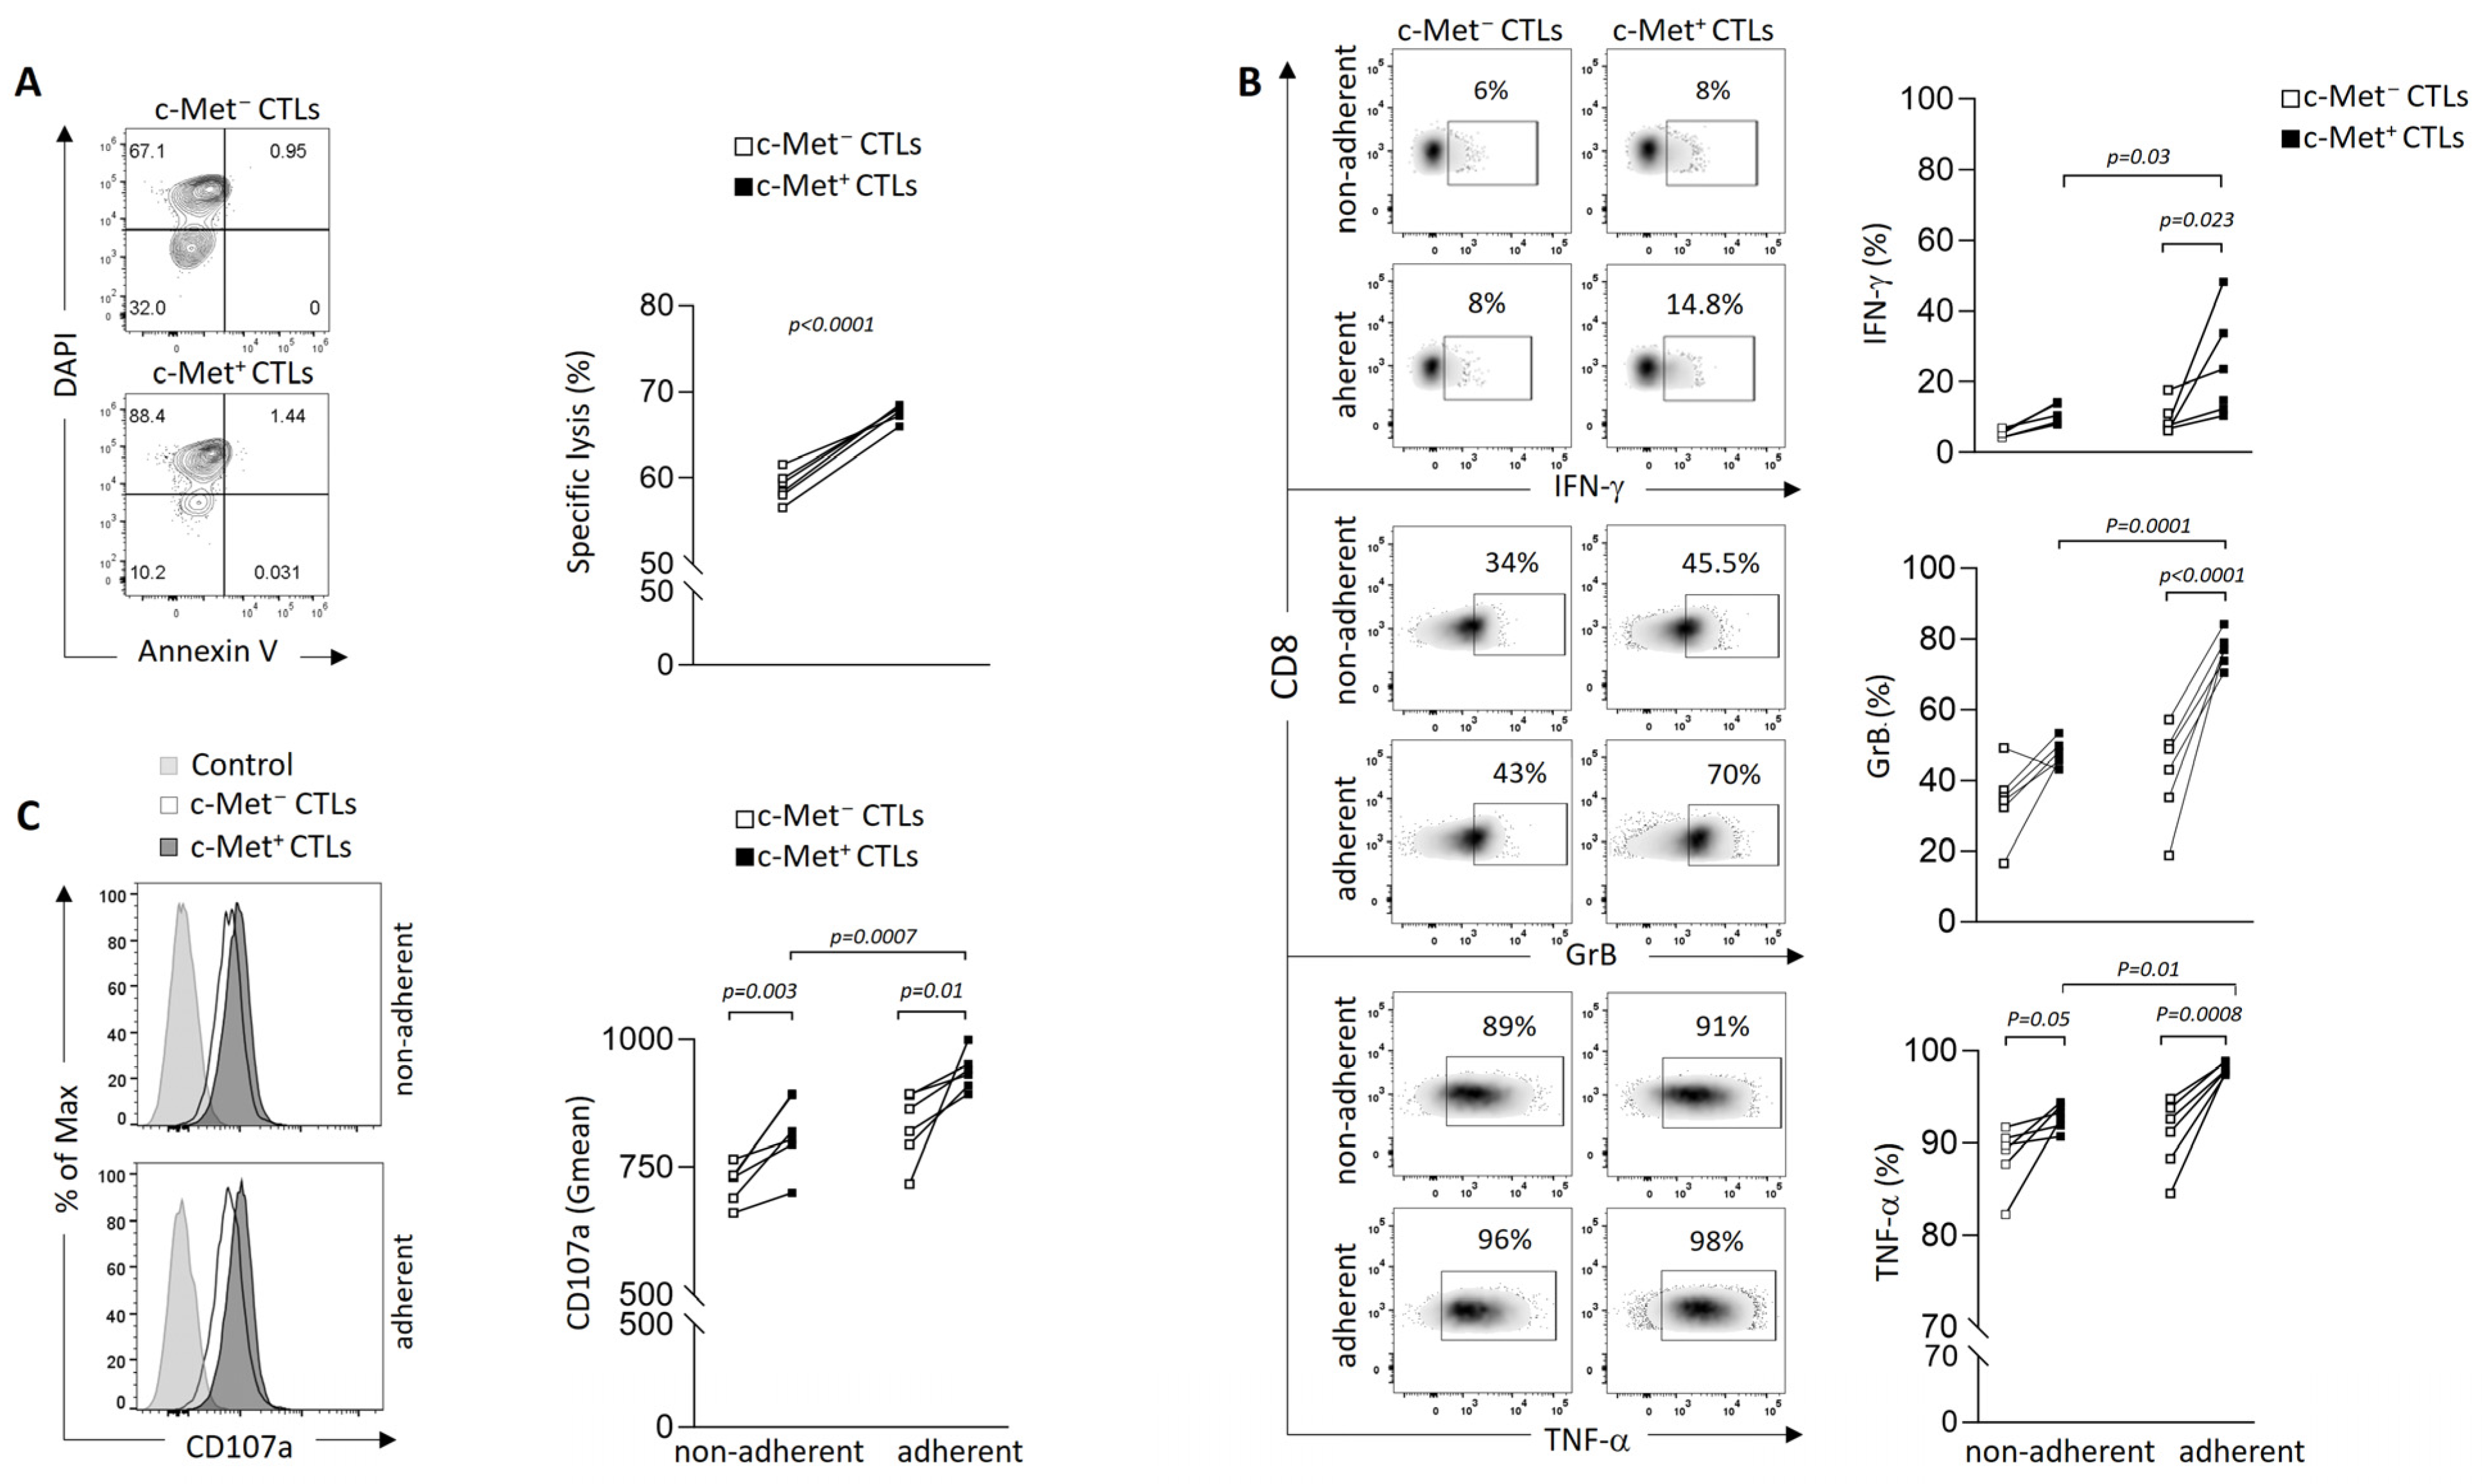
3.2. Phenotypic and Function of c-Met+ CTLs in Contact with 3D B16 Spheroids
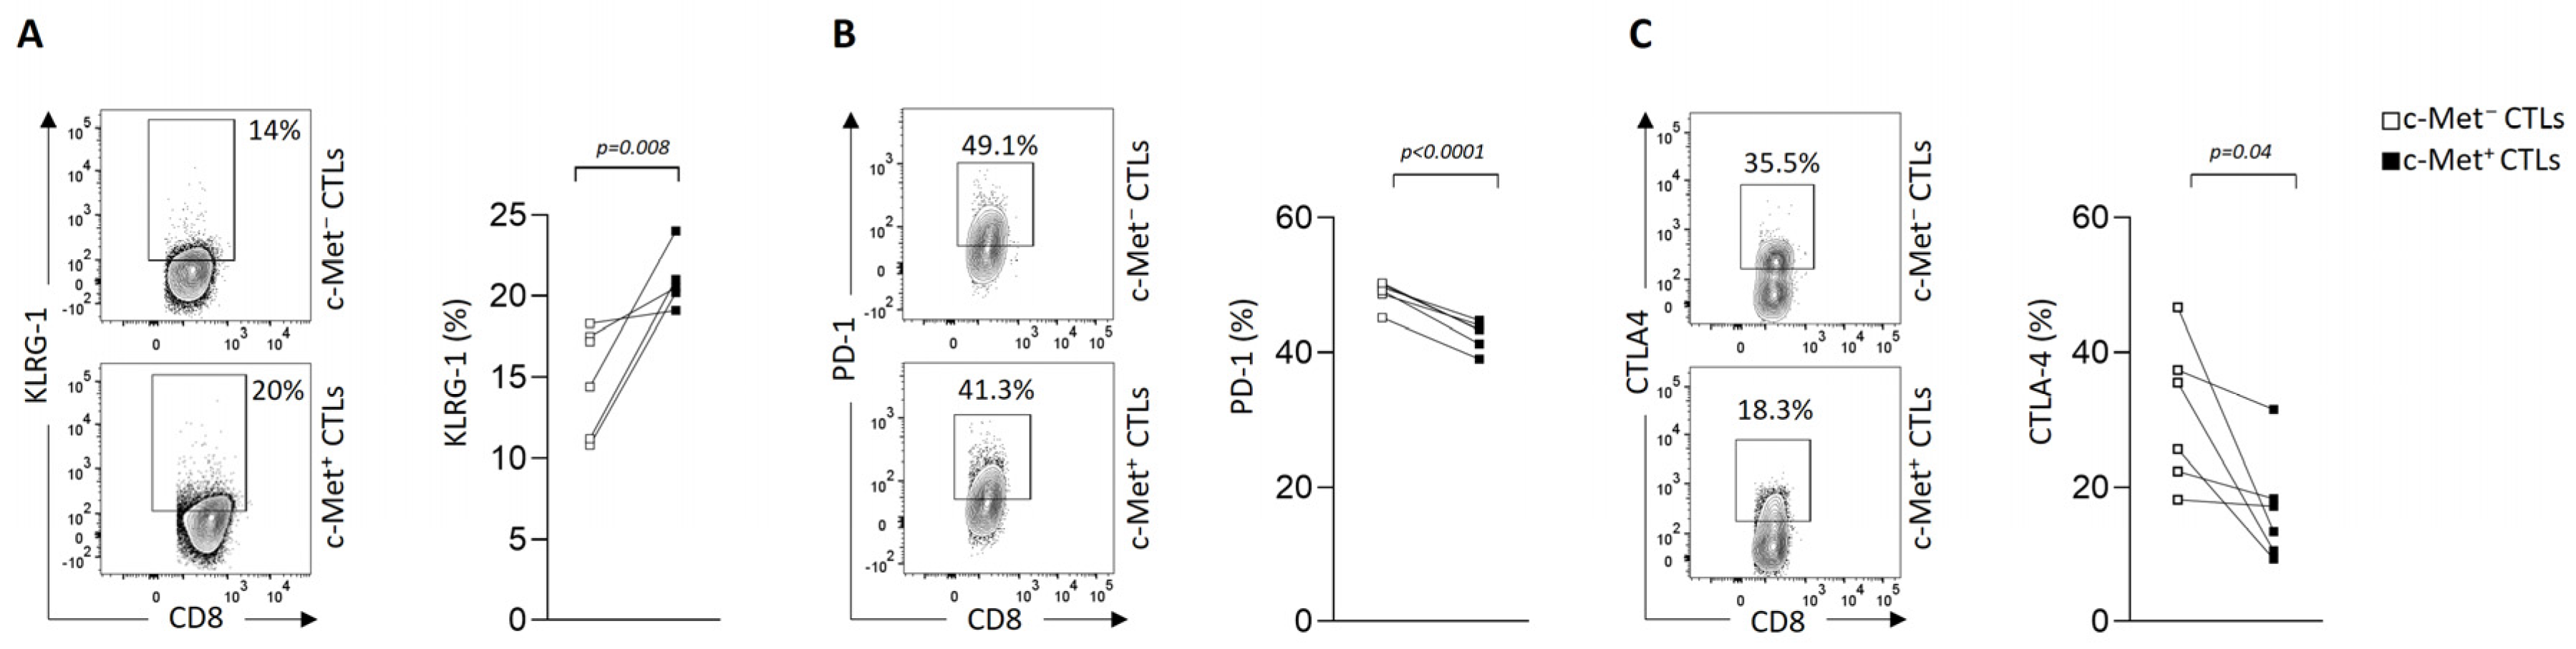
3.3. Modulation of Immune Checkpoint Expression by c-Met+ CTLs in Contact with 3D B16 Spheroids
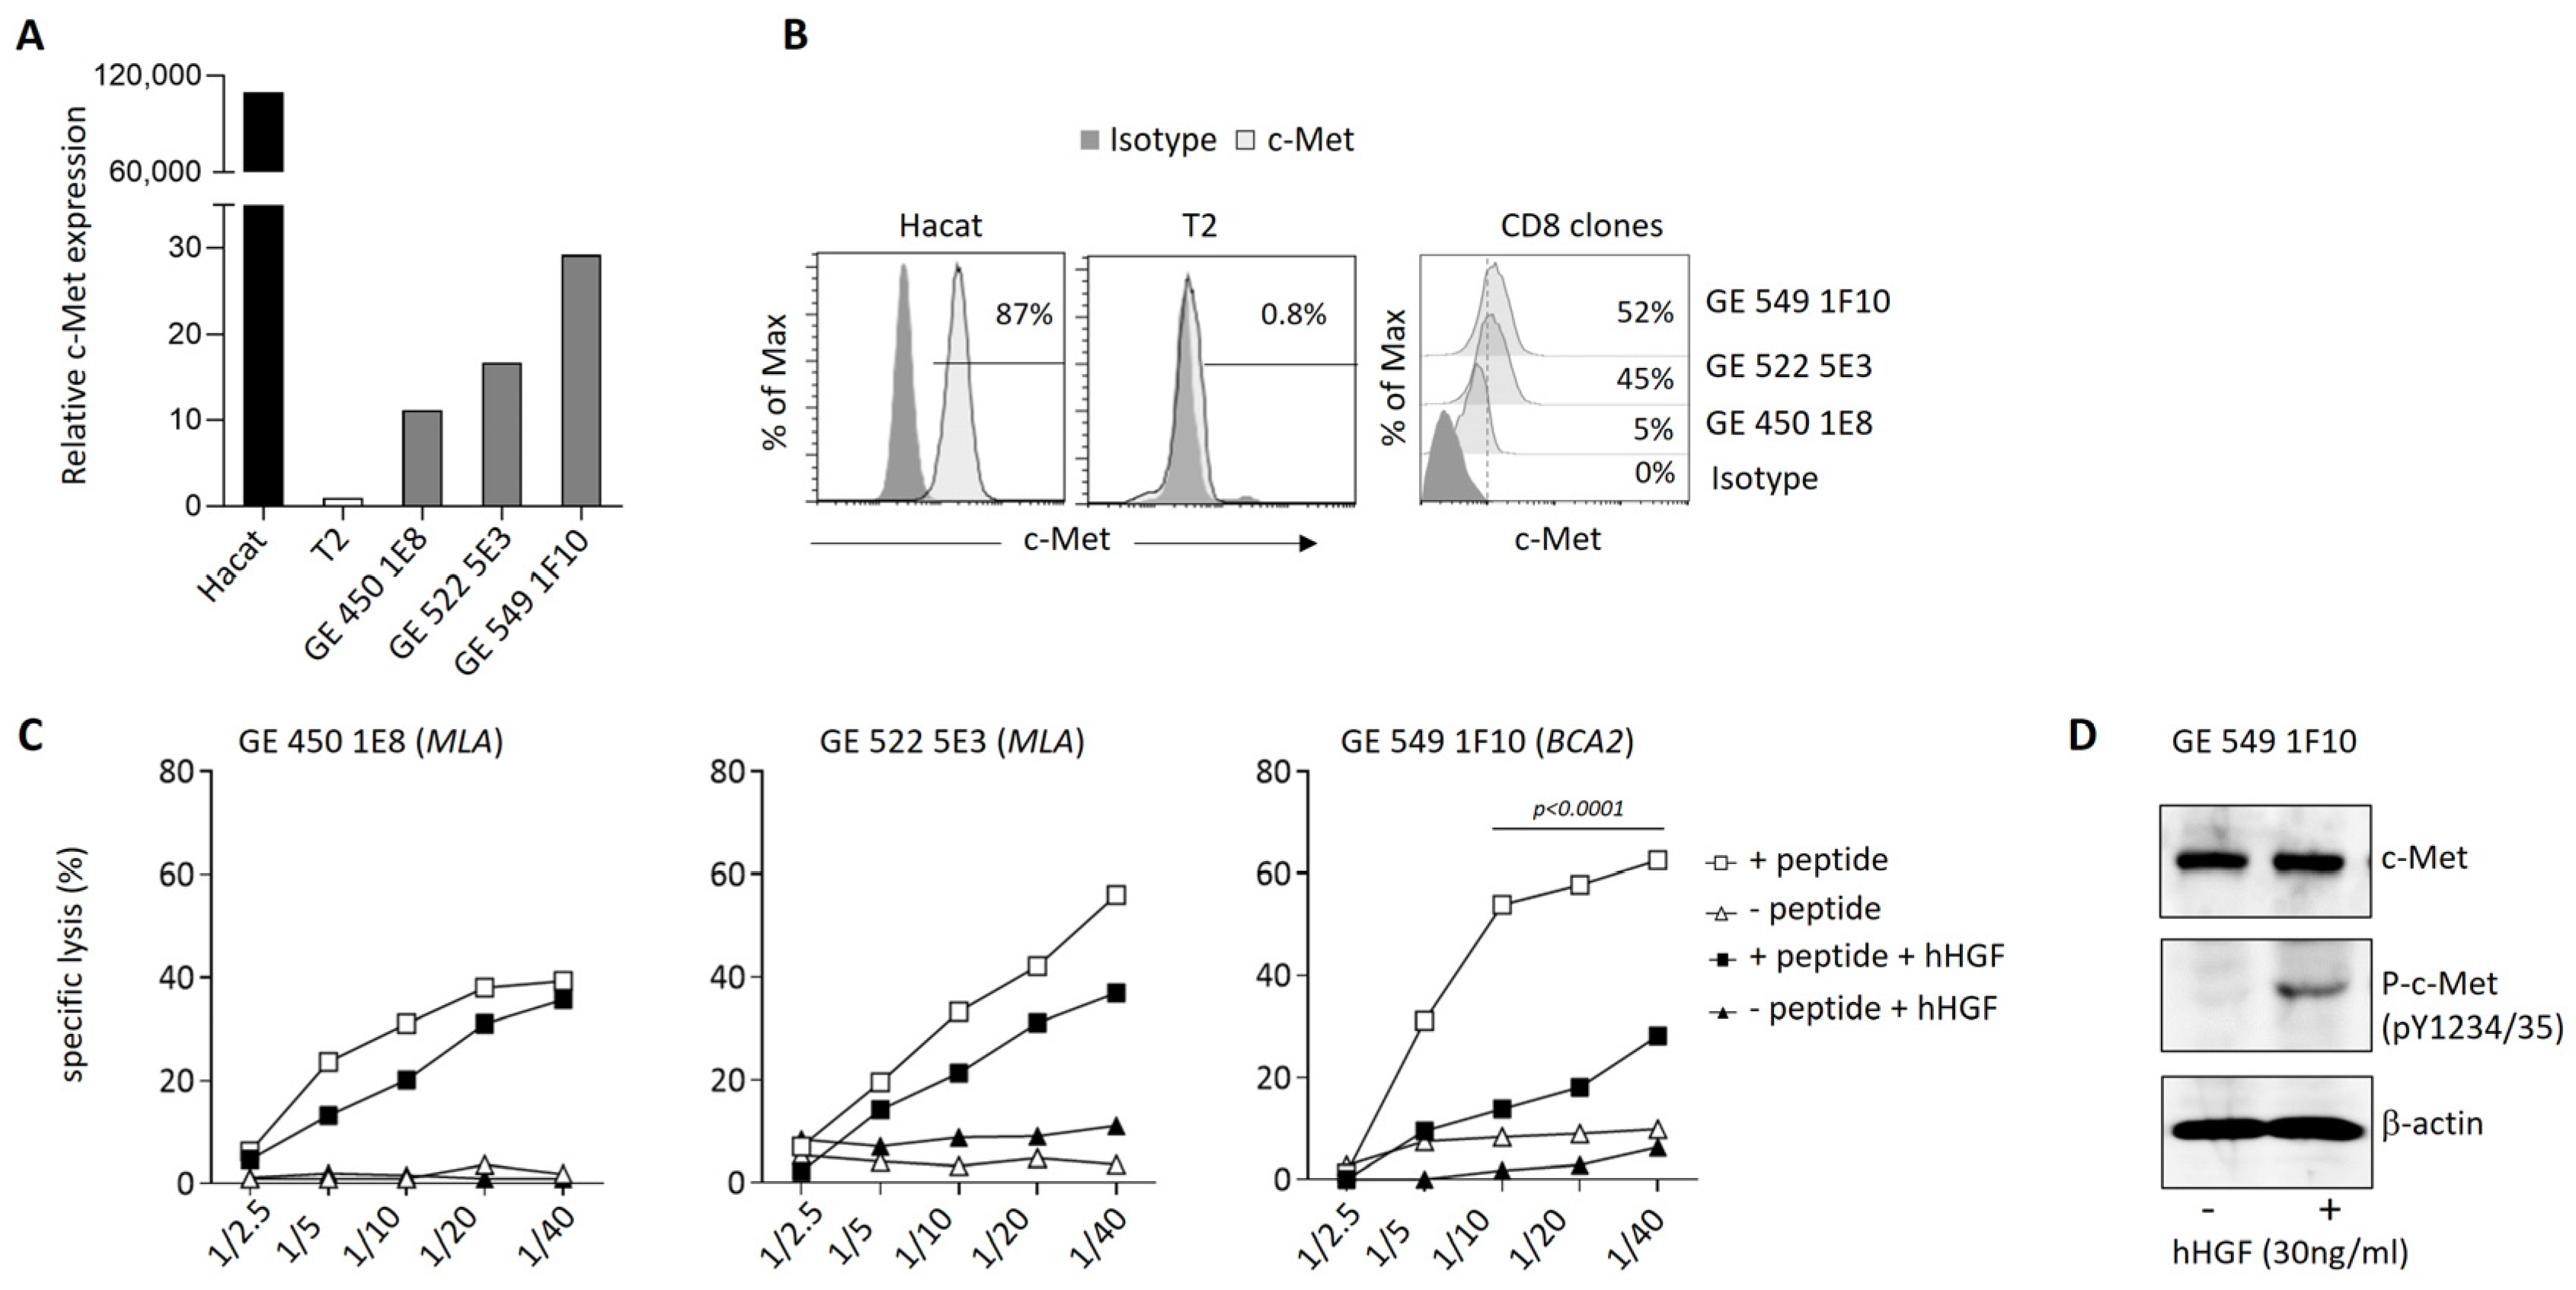
3.4. Modulation of c-Met Expression, Phenotype, and Function by HGF on Human T Cell Clones
4. Discussion
- Preventing the extracellular binding of HGF through neutralizing antibodies or biological antagonists;
- Blocking the phosphorylation of tyrosine residues in the kinase domain with small-molecule inhibitors;
- Disrupting c-Met kinase-dependent signaling through relevant signal transducers or downstream signaling components [42].
Supplementary Materials
Author Contributions
Funding
Institutional Review Board Statement
Informed Consent Statement
Data Availability Statement
Acknowledgments
Conflicts of Interest
References
- Matsumoto, K.; Date, K.; Ohmichi, H.; Nakamura, T. Hepatocyte growth factor in lung morphogenesis and tumor invasion: Role as a mediator in epithelium-mesenchyme and tumor-stroma interactions. Cancer Chemother. Pharmacol. 1996, 38, S42–S47. [Google Scholar] [CrossRef] [PubMed]
- Nakamura, T.; Matsumoto, K.; Kiritoshi, A.; Tano, Y.; Nakamura, T. Induction of hepatocyte growth factor in fibroblasts by tumor-derived factors affects invasive growth of tumor cells: In vitro analysis of tumor-stromal interactions. Cancer Res. 1997, 57, 3305–3313. [Google Scholar]
- Lee, W.Y.; Chen, H.H.; Chow, N.-H.; Su, W.-C.; Lin, P.-W.; Guo, H.-R. Prognostic significance of co-expression of RON and MET receptors in node-negative breast cancer patients. Clin. Cancer Res. 2005, 11, 2222–2228. [Google Scholar] [CrossRef]
- Sawada, K.; Radjabi, A.R.; Shinomiya, N.; Kistner, E.; Kenny, H.; Becker, A.R.; Turkyilmaz, M.A.; Salgia, R.; Yamada, S.D.; Vande Woude, G.F.; et al. c-Met overexpression is a prognostic factor in ovarian cancer and an effective target for inhibition of peritoneal dissemination and invasion. Cancer Res. 2007, 67, 1670–1679. [Google Scholar] [CrossRef]
- Masuya, D.; Huang, C.; Liu, D.; Nakashima, T.; Kameyama, K.; Haba, R.; Ueno, M.; Yokomise, H. The tumour-stromal interaction between intratumoral c-Met and stromal hepatocyte growth factor associated with tumour growth and prognosis in non-small-cell lung cancer patients. Br. J. Cancer 2004, 90, 1555–1562. [Google Scholar] [CrossRef]
- Catenacci, D.V.; Ang, A.; Liao, W.-L.; Shen, J.; O’Day, E.; Loberg, R.D.; Cecchi, F.; Hembrough, T.; Ruzzo, A.; Graziano, F. MET tyrosine kinase receptor expression and amplification as prognostic biomarkers of survival in gastroesophageal adenocarcinoma. Cancer 2017, 123, 1061–1070. [Google Scholar] [CrossRef]
- Heo, M.H.; Kim, H.K.; Lee, H.; Kim, K.-M.; Lee, J.; Park, S.H.; Park, J.O.; Lim, H.Y.; Kang, W.K.; Park, Y.S.; et al. The Clinical Impact of c-MET Over-Expression in Advanced Biliary Tract Cancer (BTC). J. Cancer 2017, 8, 1395–1399. [Google Scholar] [CrossRef]
- Gayyed, M.F.; El-Maqsoud, N.M.R.A.; El-Heeny, A.A.E.-H.; Mohammed, M.F. c-MET expression in colorectal adenomas and primary carcinomas with its corresponding metastases. J. Gastrointest. Oncol. 2015, 6, 618–627. [Google Scholar]
- Peltola, K.J.; Penttilä, P.; Rautiola, J.; Joensuu, H.; Hänninen, E.; Ristimäki, A. Bono, Correlation of c-Met Expression and Outcome in Patients With Renal Cell Carcinoma Treated With Sunitinib. Clin. Genitourin. Cancer 2017, 15, 487–494. [Google Scholar] [CrossRef]
- Reis, H.; Metzenmacher, M.; Goetz, M.; Savvidou, N.; Darwiche, K.; Aigner, C.; Herold, T.; Eberhardt, W.E.; Skiba, C.; Hense, J.; et al. MET Expression in Advanced Non-Small-Cell Lung Cancer: Effect on Clinical Outcomes of Chemotherapy, Targeted Therapy, and Immunotherapy. Clin. Lung Cancer 2018, 19, e441–e463. [Google Scholar] [CrossRef]
- Zhou, Y.; Song, K.Y.; Giubellino, A. The Role of MET in Melanoma and Melanocytic Lesions. Am. J. Pathol. 2019, 189, 2138–2148. [Google Scholar] [CrossRef]
- Goyal, L.; Muzumdar, M.D.; Zhu, A.X. Targeting the HGF/c-MET pathway in hepatocellular carcinoma. Clin. Cancer Res. 2013, 19, 2310–2318. [Google Scholar] [CrossRef]
- Hack, S.P.; Bruey, J.-M.; Koeppen, H. HGF/MET-directed therapeutics in gastroesophageal cancer: A review of clinical and biomarker development. Oncotarget 2014, 5, 2866–2880. [Google Scholar] [CrossRef]
- Papaccio, F.; Della Corte, C.M.; Viscardi, G.; Di Liello, R.; Esposito, G.; Sparano, F.; Ciardiello, F.; Morgillo, F. HGF/MET and the Immune System: Relevance for Cancer Immunotherapy. Int. J. Mol. Sci. 2018, 19, 3595. [Google Scholar] [CrossRef]
- Benkhoucha, M.; Santiago-Raber, M.L.; Schneiter, G.; Chofflon, M.; Funakoshi, H.; Nakamura, T.; Lalive, P.H. Hepatocyte growth factor inhibits CNS autoimmunity by inducing tolerogenic dendritic cells and CD25+Foxp3+ regulatory T cells. Proc. Natl. Acad. Sci. USA 2010, 107, 6424–6429. [Google Scholar] [CrossRef]
- Okunishi, K.; Dohi, M.; Nakagome, K.; Tanaka, R.; Mizuno, S.; Matsumoto, K.; Miyazaki, J.I.; Nakamura, T.; Yamamoto, K. A novel role of hepatocyte growth factor as an immune regulator through suppressing dendritic cell function. J. Immunol. 2005, 175, 4745–4753. [Google Scholar] [CrossRef]
- Baek, J.H.; Birchmeier, C.; Zenke, M.; Hieronymus, T. The HGF receptor/Met tyrosine kinase is a key regulator of dendritic cell migration in skin immunity. J. Immunol. 2012, 189, 1699–1707. [Google Scholar] [CrossRef]
- Benkhoucha, M.; Molnarfi, N.; Dunand-Sauthier, I.; Merkler, D.; Schneiter, G.; Bruscoli, S.; Riccardi, C.; Tabata, Y.; Funakoshi, H.; Nakamura, T.; et al. Hepatocyte growth factor limits autoimmune neuroinflammation via glucocorticoid-induced leucine zipper expression in dendritic cells. J. Immunol. 2014, 193, 2743–2752. [Google Scholar] [CrossRef]
- Finisguerra, V.; Di Conza, G.; Di Matteo, M.; Serneels, J.; Costa, S.; Thompson, A.A.R.; Wauters, E.; Walmsley, S.; Prenen, H.; Granot, Z.; et al. MET is required for the recruitment of anti-tumoural neutrophils. Nature 2015, 522, 349–353. [Google Scholar] [CrossRef]
- Yen, B.L.; Yen, M.-L.; Hsu, P.-J.; Liu, K.-J.; Wang, C.-J.; Bai, C.-H.; Sytwu, H.-K. Multipotent human mesenchymal stromal cells mediate expansion of myeloid-derived suppressor cells via hepatocyte growth factor/c-met and STAT3. Stem Cell Rep. 2013, 1, 139–151. [Google Scholar] [CrossRef]
- Jin, J.; Goldschneider, I.; Lai, L. In vivo administration of the recombinant IL-7/hepatocyte growth factor beta hybrid cytokine efficiently restores thymopoiesis and naive T cell generation in lethally irradiated mice after syngeneic bone marrow transplantation. J. Immunol. 2011, 186, 1915–1922. [Google Scholar] [CrossRef]
- Komarowska, I.; Coe, D.; Wang, G.; Haas, R.; Mauro, C.; Kishore, M.; Cooper, D.; Nadkarni, S.; Fu, H.; Steinbruchel, D.A.; et al. Hepatocyte Growth Factor Receptor c-Met Instructs T Cell Cardiotropism and Promotes T Cell Migration to the Heart via Autocrine Chemokine Release. Immunity 2015, 42, 1087–1099. [Google Scholar] [CrossRef]
- Benkhoucha, M.; Molnarfi, N.; Kaya, G.; Belnoue, E.; Bjarnadóttir, K.; Dietrich, P.Y.; Walker, P.R.; Martinvalet, D.; Derouazi, M.; Lalive, P.H. Identification of a novel population of highly cytotoxic c-Met-expressing CD8(+) T lymphocytes. EMBO Rep. 2017, 18, 1545–1558. [Google Scholar] [CrossRef]
- Hargadon, K.M.; Johnson, C.E.; Williams, C.J. Immune checkpoint blockade therapy for cancer: An overview of FDA-approved immune checkpoint inhibitors. Int. Immunopharmacol. 2018, 62, 29–39. [Google Scholar] [CrossRef]
- Havel, J.J.; Chowell, D.; Chan, T.A. The evolving landscape of biomarkers for checkpoint inhibitor immunotherapy. Nat. Rev. Cancer 2019, 19, 133–150. [Google Scholar] [CrossRef]
- Weber, E.W.; Maus, M.V.; Mackall, C.L. The Emerging Landscape of Immune Cell Therapies. Cell 2020, 181, 46–62. [Google Scholar] [CrossRef]
- Kirtane, K.; Elmariah, H.; Chung, C.H.; Abate-Daga, D. Adoptive cellular therapy in solid tumor malignancies: Review of the literature and challenges ahead. J. Immunother. Cancer 2021, 9, e002723. [Google Scholar] [CrossRef]
- Kuhn, N.F.; Purdon, T.J.; van Leeuwen, D.G.; Lopez, A.V.; Curran, K.J.; Daniyan, A.F.; Brentjens, R.J. CD40 Ligand-Modified Chimeric Antigen Receptor T Cells Enhance Antitumor Function by Eliciting an Endogenous Antitumor Response. Cancer Cell 2019, 35, 473–488.e6. [Google Scholar] [CrossRef]
- Costa, E.C.; Moreira, A.F.; De Melo-Diogo, D.; Gaspar, V.M.; Carvalho, M.P.; Correia, I.J. 3D tumor spheroids: An overview on the tools and techniques used for their analysis. Biotechnol. Adv. 2016, 34, 1427–1441. [Google Scholar] [CrossRef]
- Filipiak-Duliban, A.; Brodaczewska, K.; Kajdasz, A.; Kieda, C. Spheroid Culture Differentially Affects Cancer Cell Sensitivity to Drugs in Melanoma and RCC Models. Int. J. Mol. Sci. 2022, 23, 1166. [Google Scholar] [CrossRef]
- Overwijk, W.W.; Theoret, M.R.; Finkelstein, S.E.; Surman, D.R.; de Jong, L.A.; Vyth-Dreese, F.A.; Dellemijn, T.A.; Antony, P.A.; Spiess, P.J.; Palmer, D.C.; et al. Tumor regression and autoimmunity after reversal of a functionally tolerant state of self-reactive CD8+ T cells. J. Exp. Med. 2003, 198, 569–580. [Google Scholar] [CrossRef] [PubMed]
- Dutoit, V.; Herold-Mende, C.; Hilf, N.; Schoor, O.; Beckhove, P.; Bucher, J.; Dorsch, K.; Flohr, S.; Fritsche, J.; Lewandrowski, P.; et al. Exploiting the glioblastoma peptidome to discover novel tumour-associated antigens for immunotherapy. Brain 2012, 135, 1042–1054. [Google Scholar] [CrossRef] [PubMed]
- Salter, R.D.; Howell, D.N.; Cresswell, P. Genes regulating HLA class I antigen expression in T-B lymphoblast hybrids. Immunogenetics 1985, 21, 235–246. [Google Scholar] [CrossRef]
- Juarez-Moreno, K.; Chávez-García, D.; Hirata, G.; Vazquez-Duhalt, R. Monolayer (2D) or spheroids (3D) cell cultures for nanotoxicological studies? Comparison of cytotoxicity and cell internalization of nanoparticles. Toxicol. In Vitro 2022, 85, 105461. [Google Scholar] [CrossRef] [PubMed]
- Kaech, S.M.; Cui, W. Transcriptional control of effector and memory CD8+ T cell differentiation. Nat. Rev. Immunol. 2012, 12, 749–761. [Google Scholar] [CrossRef]
- Benkhoucha, M.; Tran, N.L.; Breville, G.; Senoner, I.; Jandus, C.; Lalive, P. c-Met enforces proinflammatory and migratory features of human activated CD4(+) T cells. Cell. Mol. Immunol. 2021, 18, 2051–2053. [Google Scholar] [CrossRef]
- Molnarfi, N.; Benkhoucha, M.; Funakoshi, H.; Nakamura, T.; Lalive, P.H. Hepatocyte growth factor: A regulator of inflammation and autoimmunity. Autoimmun. Rev. 2015, 14, 293–303. [Google Scholar] [CrossRef]
- Burgess, T.; Coxon, A.; Meyer, S.; Sun, J.; Rex, K.; Tsuruda, T.; Chen, Q.; Ho, S.-Y.; Li, L.; Kaufman, S.; et al. Fully human monoclonal antibodies to hepatocyte growth factor with therapeutic potential against hepatocyte growth factor/c-Met-dependent human tumors. Cancer Res. 2006, 66, 1721–1729. [Google Scholar] [CrossRef]
- Robinson, K.W.; Sandler, A.B. The role of MET receptor tyrosine kinase in non-small cell lung cancer and clinical development of targeted anti-MET agents. Oncologist 2013, 18, 115–122. [Google Scholar] [CrossRef]
- Toschi, L.; Jänne, P.A. Single-agent and combination therapeutic strategies to inhibit hepatocyte growth factor/MET signaling in cancer. Clin. Cancer Res. 2008, 14, 5941–5946. [Google Scholar] [CrossRef]
- Benkhoucha, M.; Molnarfi, N.; Schneiter, G.; Walker, P.R.; Lalive, P.H. The neurotrophic hepatocyte growth factor attenuates CD8+ cytotoxic T-lymphocyte activity. J. Neuroinflammation 2013, 10, 154. [Google Scholar] [CrossRef] [PubMed]
- Mo, H.N.; Liu, P. Targeting MET in cancer therapy. Chron. Dis. Transl. Med. 2017, 3, 148–153. [Google Scholar] [CrossRef] [PubMed]


Disclaimer/Publisher’s Note: The statements, opinions and data contained in all publications are solely those of the individual author(s) and contributor(s) and not of MDPI and/or the editor(s). MDPI and/or the editor(s) disclaim responsibility for any injury to people or property resulting from any ideas, methods, instructions or products referred to in the content. |
© 2023 by the authors. Licensee MDPI, Basel, Switzerland. This article is an open access article distributed under the terms and conditions of the Creative Commons Attribution (CC BY) license (https://creativecommons.org/licenses/by/4.0/).
Share and Cite
Benkhoucha, M.; Tran, N.L.; Senoner, I.; Breville, G.; Fritah, H.; Migliorini, D.; Dutoit, V.; Lalive, P.H. c-Met+ Cytotoxic T Lymphocytes Exhibit Enhanced Cytotoxicity in Mice and Humans In Vitro Tumor Models. Biomedicines 2023, 11, 3123. https://doi.org/10.3390/biomedicines11123123
Benkhoucha M, Tran NL, Senoner I, Breville G, Fritah H, Migliorini D, Dutoit V, Lalive PH. c-Met+ Cytotoxic T Lymphocytes Exhibit Enhanced Cytotoxicity in Mice and Humans In Vitro Tumor Models. Biomedicines. 2023; 11(12):3123. https://doi.org/10.3390/biomedicines11123123
Chicago/Turabian StyleBenkhoucha, Mahdia, Ngoc Lan Tran, Isis Senoner, Gautier Breville, Hajer Fritah, Denis Migliorini, Valérie Dutoit, and Patrice H. Lalive. 2023. "c-Met+ Cytotoxic T Lymphocytes Exhibit Enhanced Cytotoxicity in Mice and Humans In Vitro Tumor Models" Biomedicines 11, no. 12: 3123. https://doi.org/10.3390/biomedicines11123123