
Impact of Behavioral Assessment and Re-Test as Functional Trainings That Modify Survival, Anxiety and Functional Profile (Physical Endurance and Motor Learning) of Old Male and Female 3xTg-AD Mice and NTg Mice with Normal Aging


Abstract
:1. Introduction
2. Materials and Methods
2.1. Animals
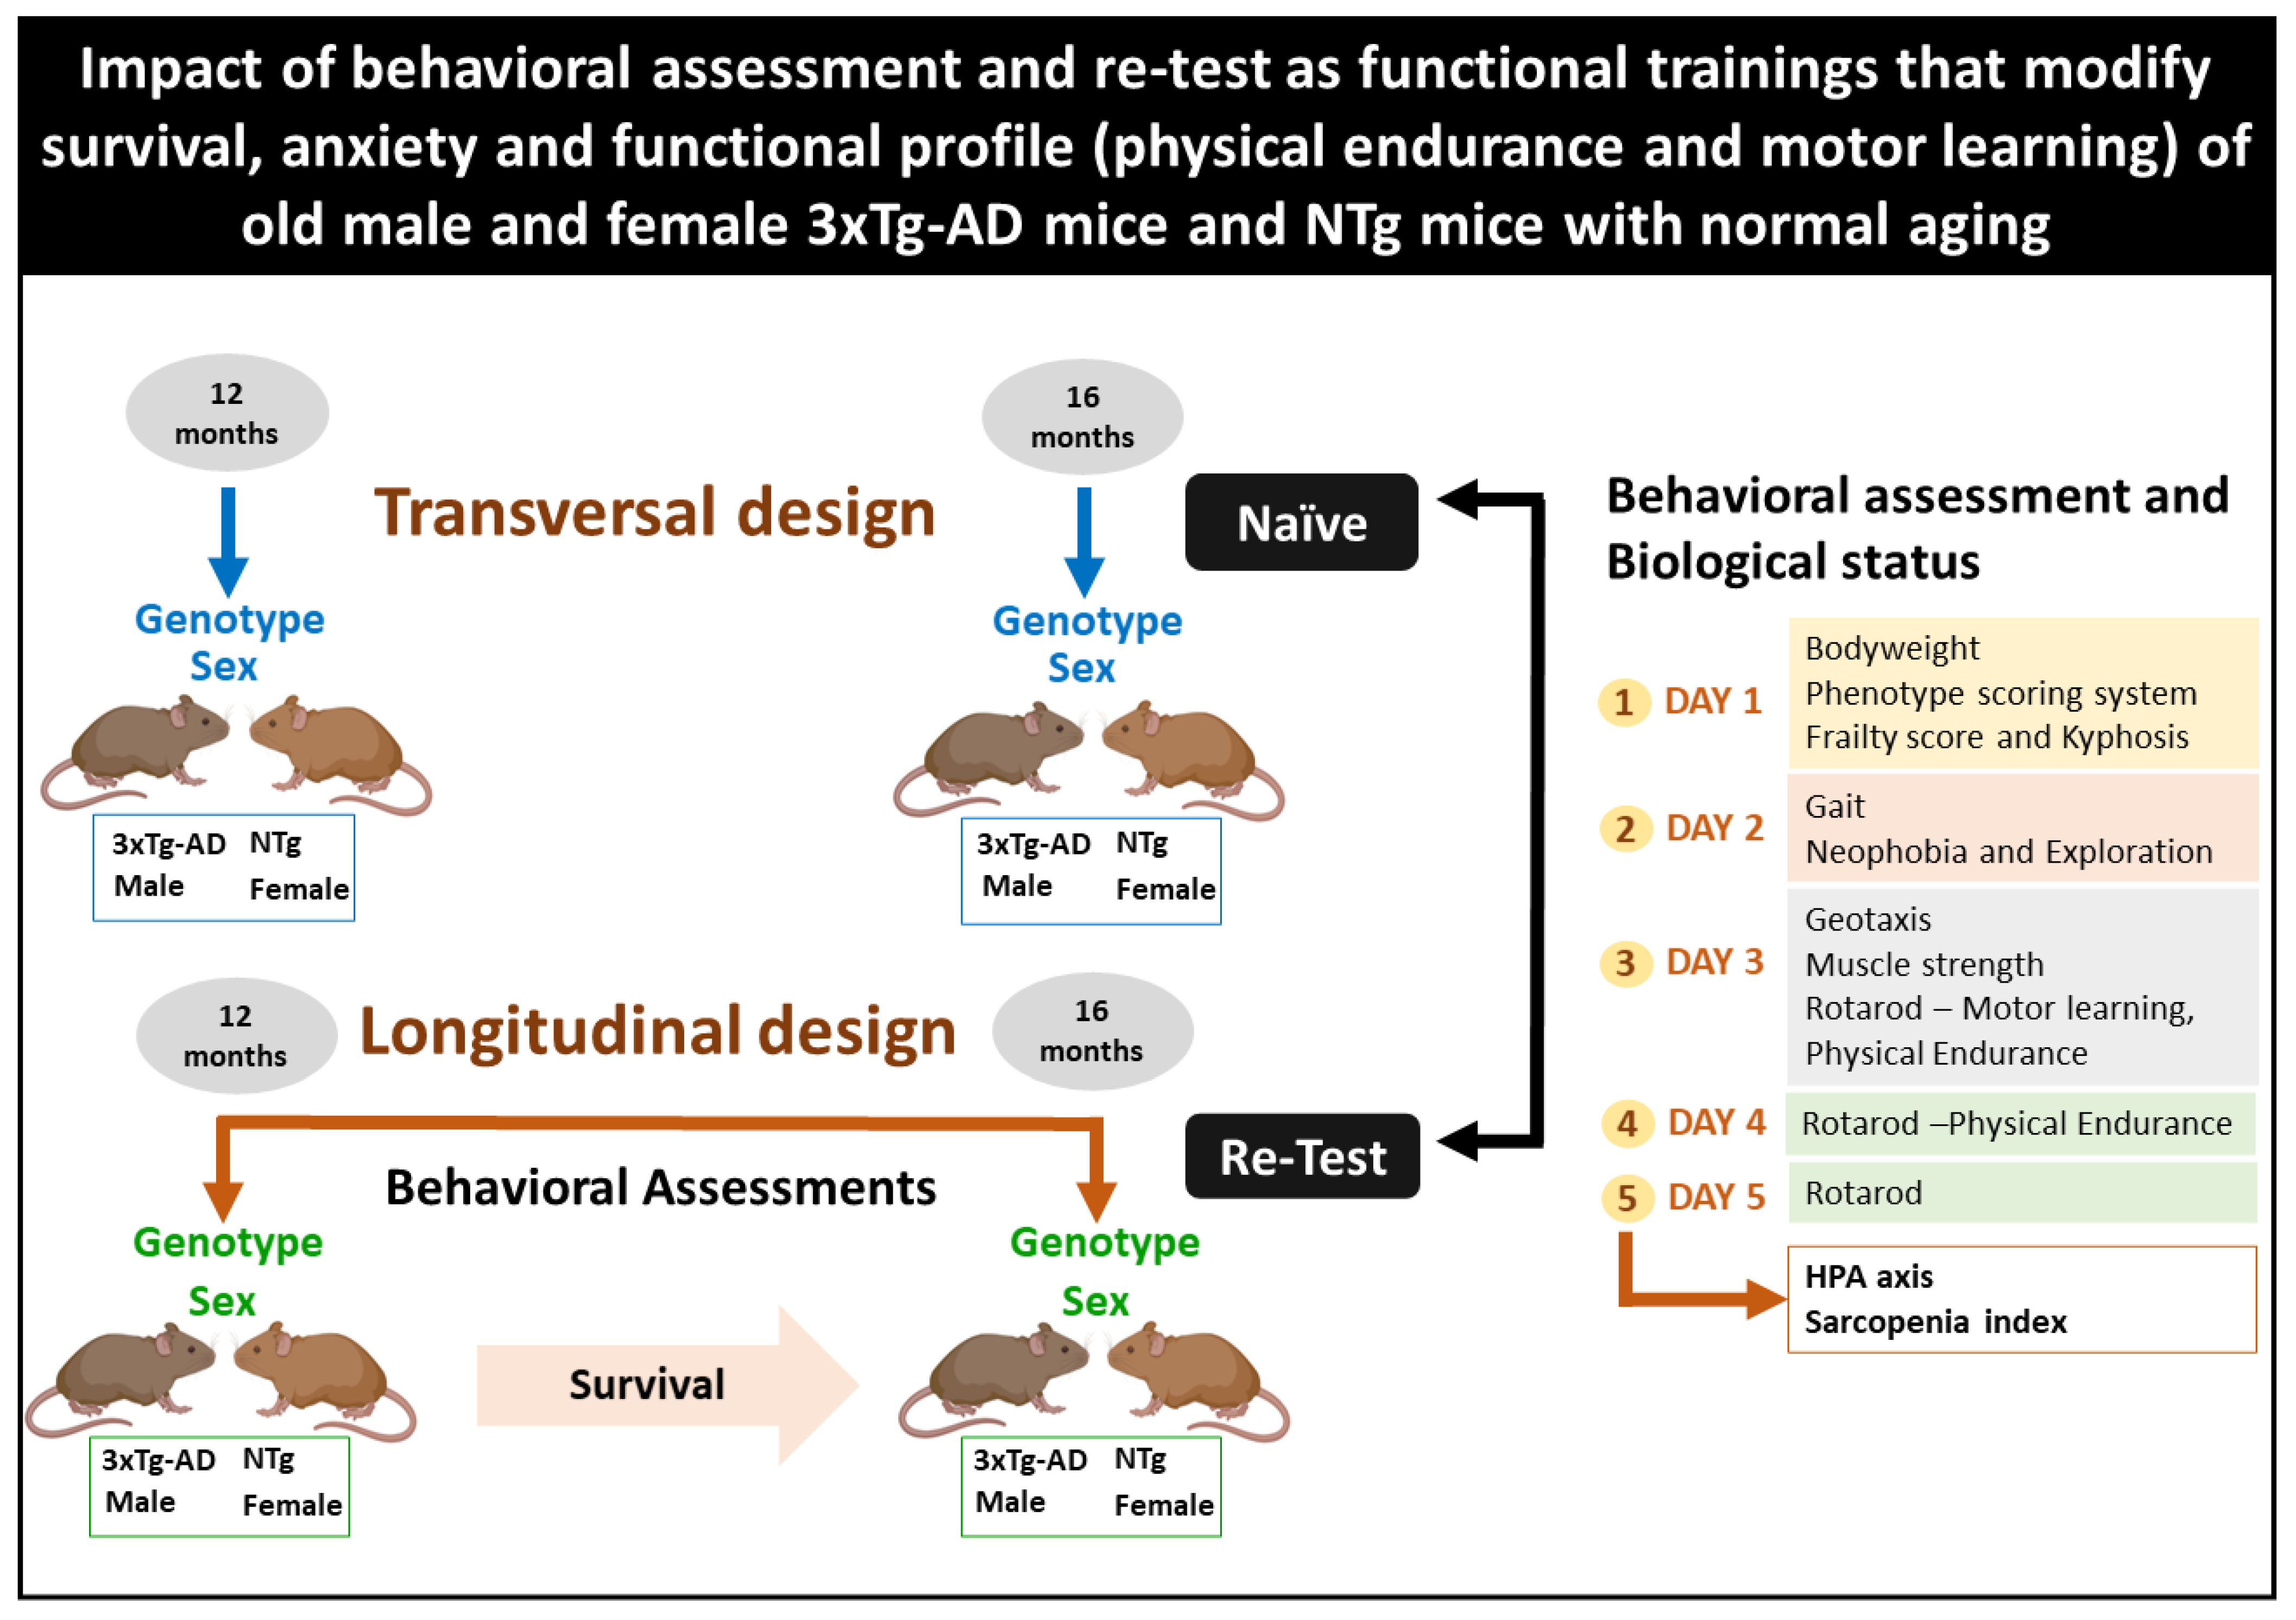
2.2. Experimental Design
2.3. Behavioral Assessment and Biological Status
2.3.1. Survival, Bodyweight, Phenotype Scoring System, Frailty Score, and Kyphosis
2.3.2. Quantitative Parameters of Gait, Neophobia, and Exploration
2.3.3. Muscular Strength—Hanger Test and Geotaxis
2.3.4. Motor Performance: Learning and Physical Endurance—Rotarod
2.3.5. Biological Status: HPA Axis and Sarcopenia Index
2.4. Statistics
3. Results
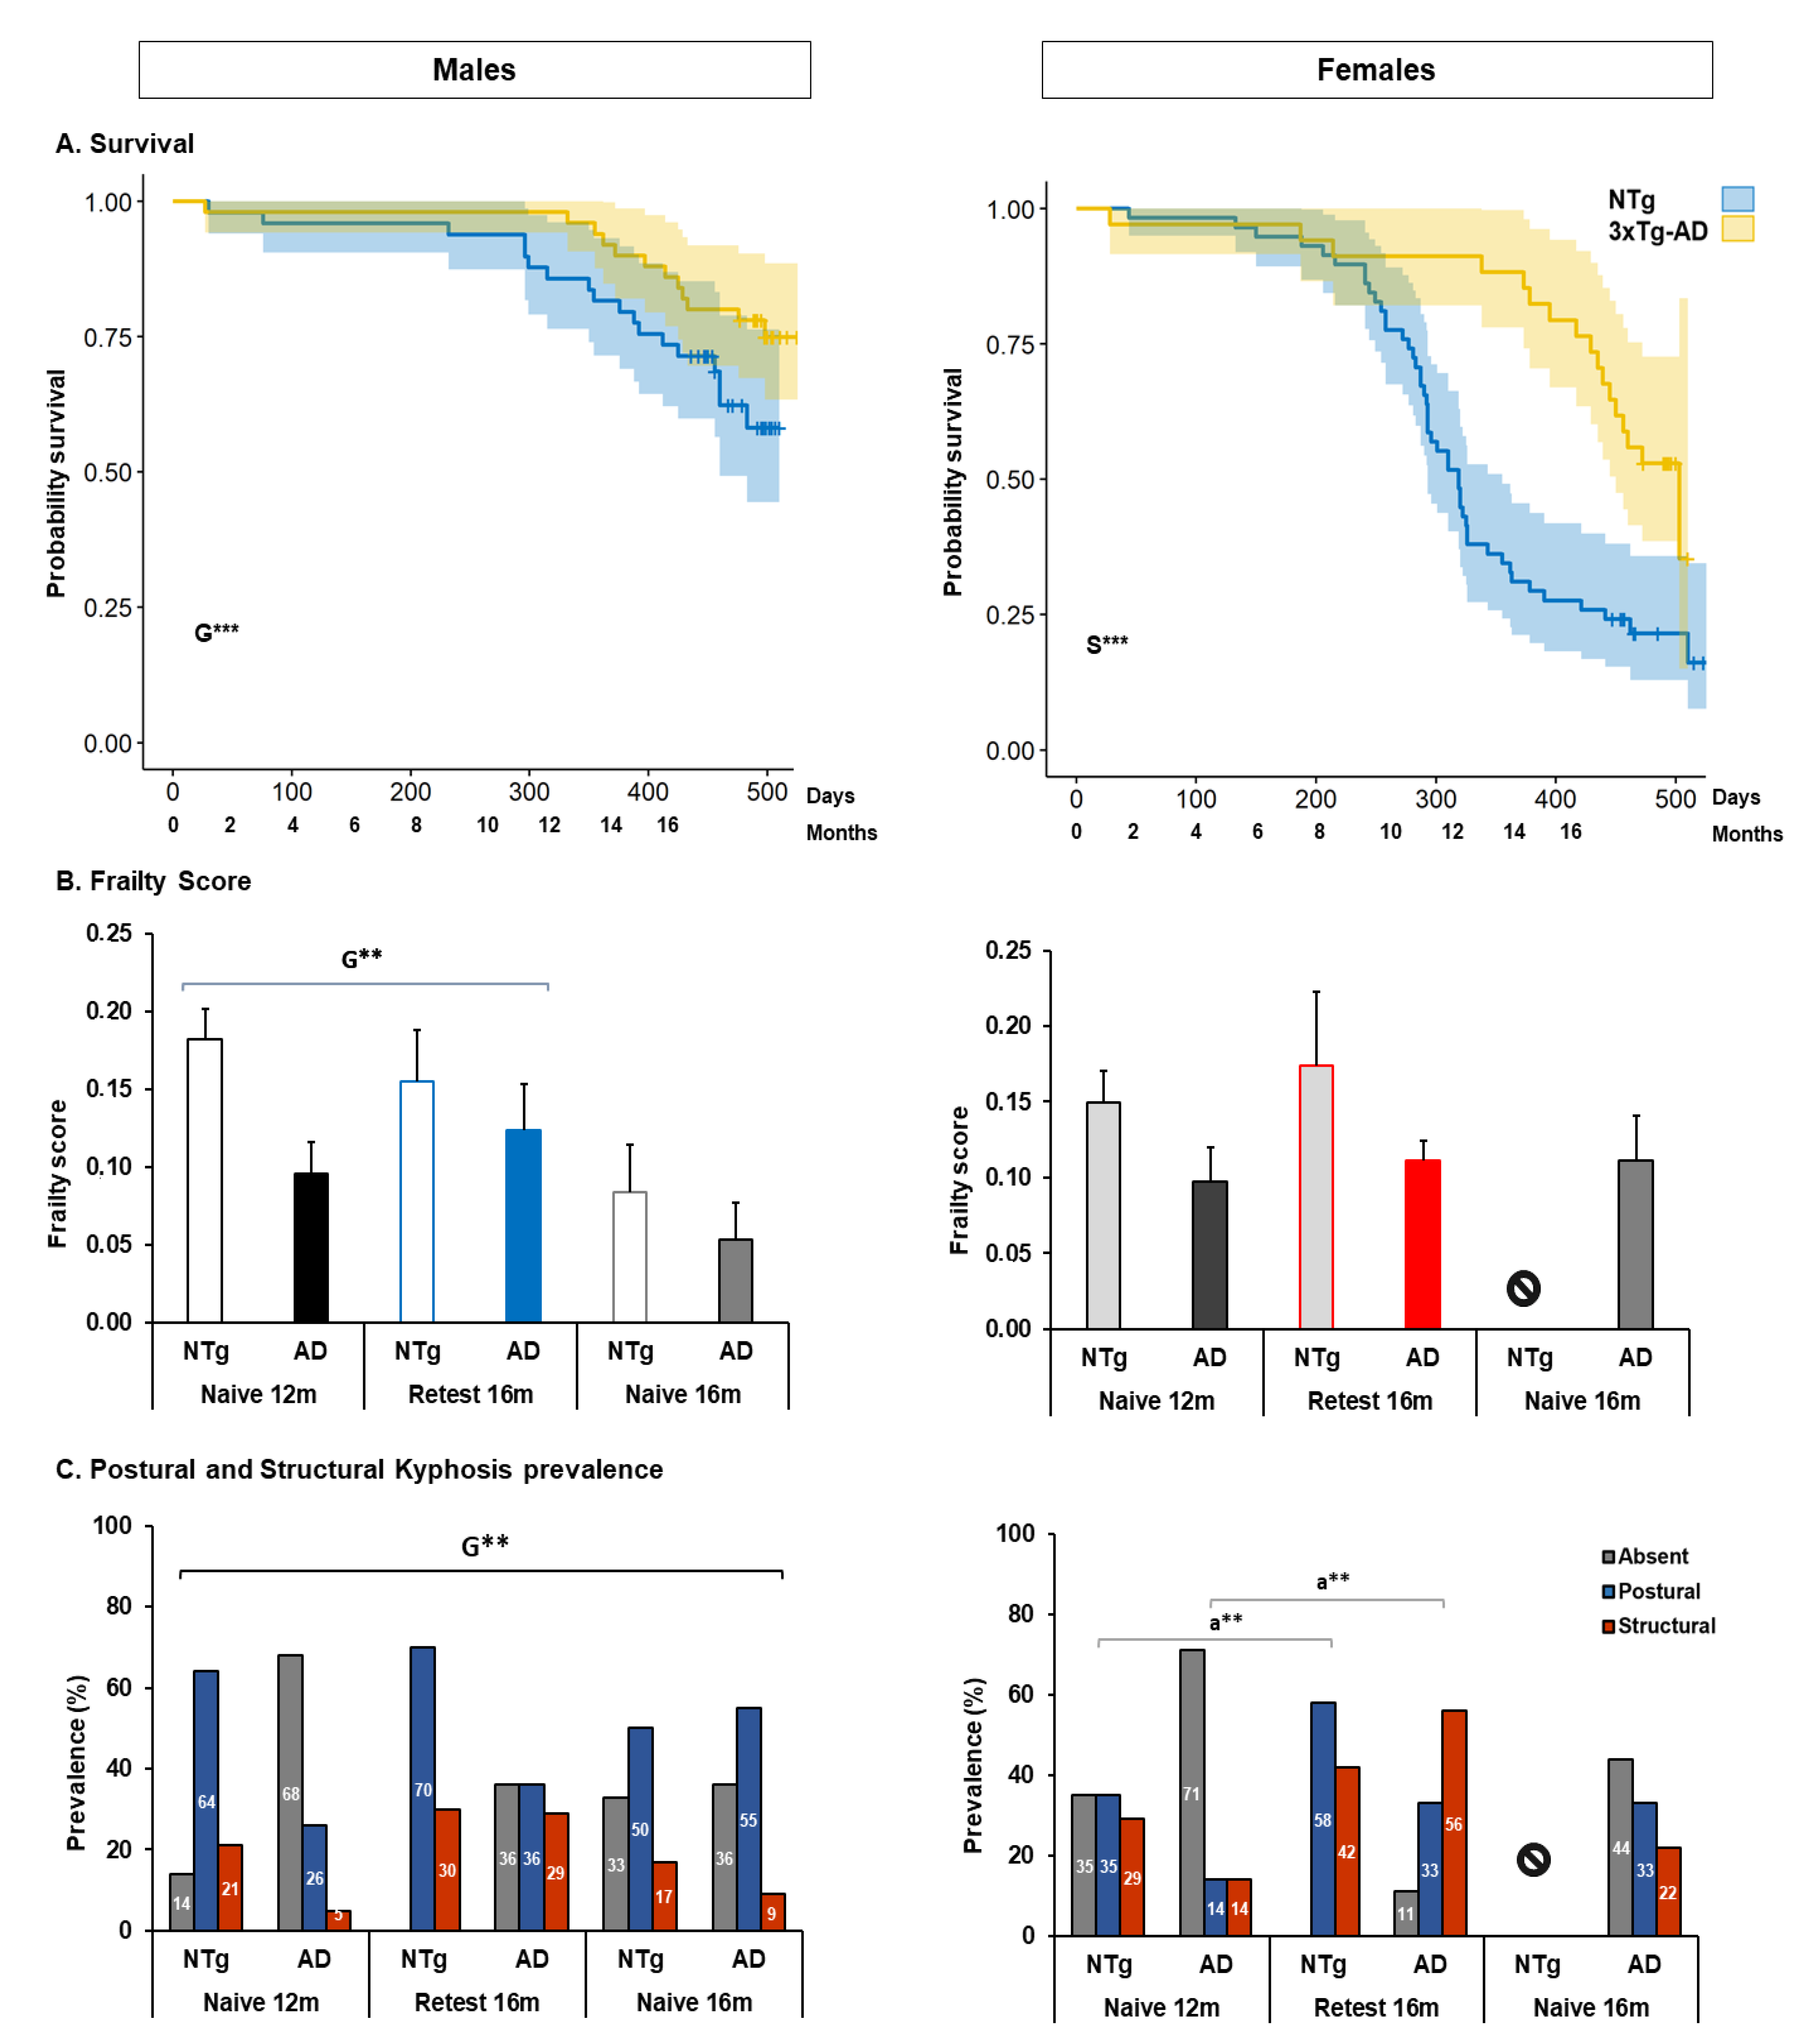
3.1. Survival, Bodyweight, Phenotype Scoring System, Frailty Score, and Kyphosis
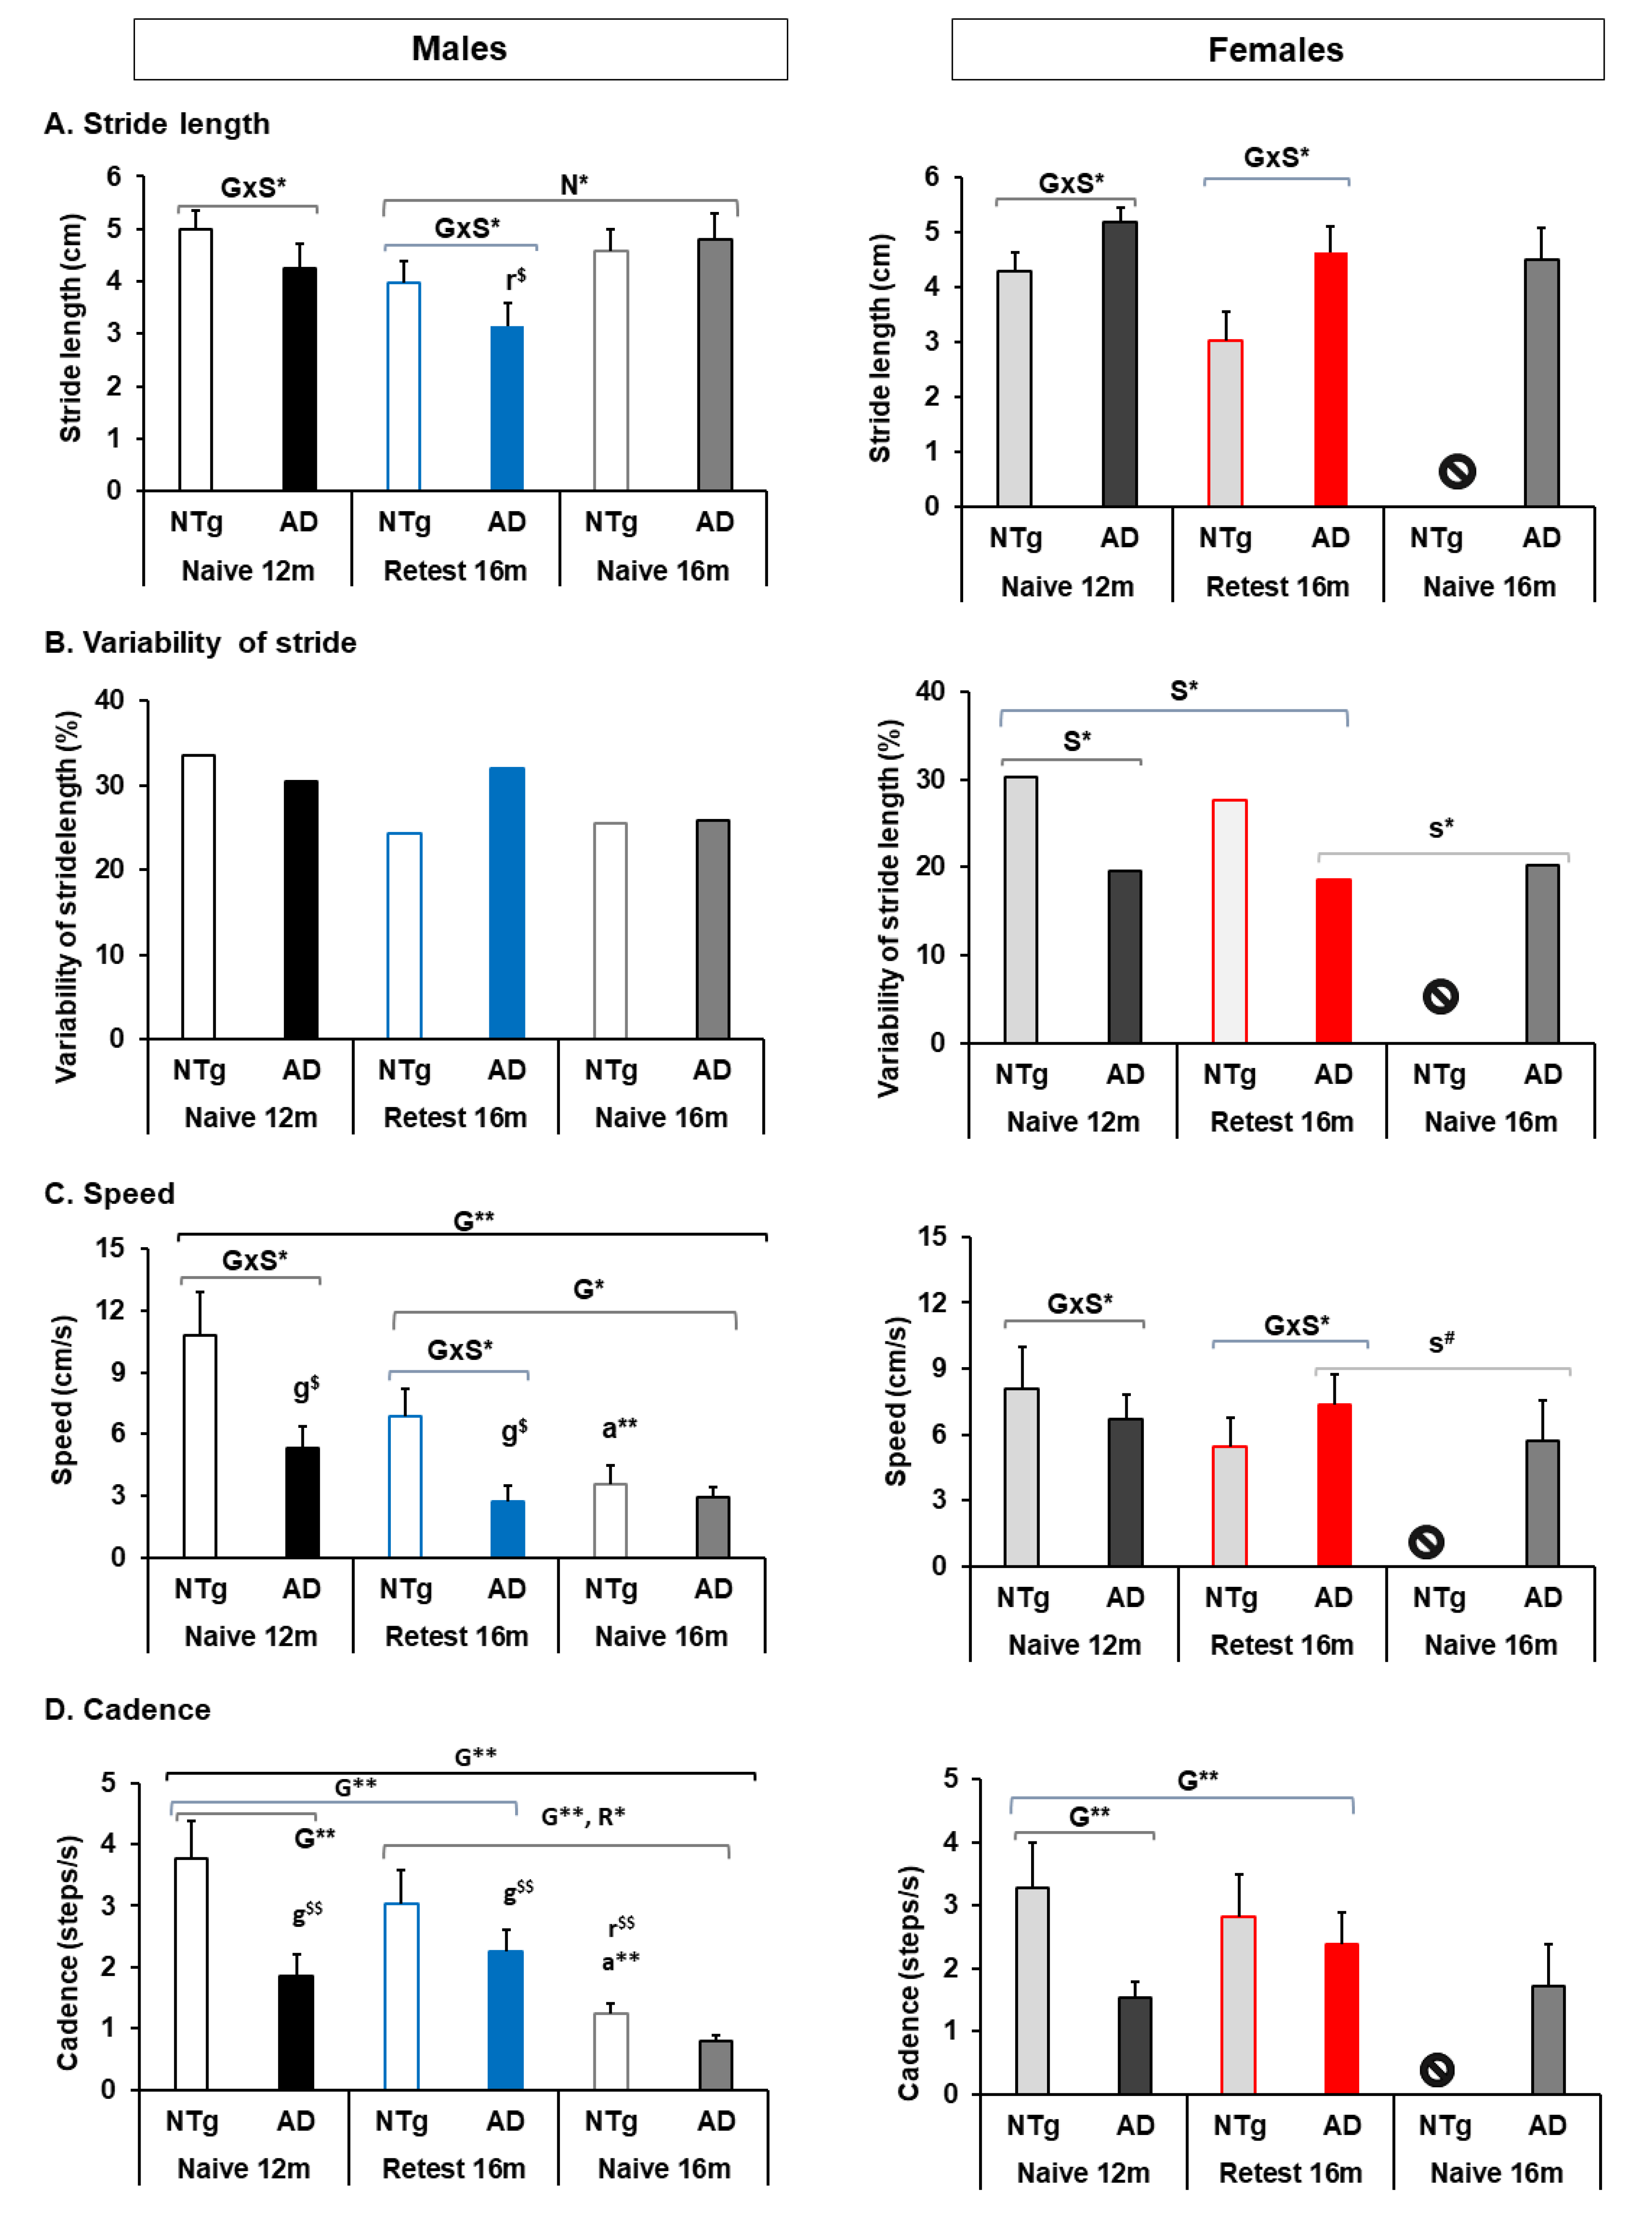
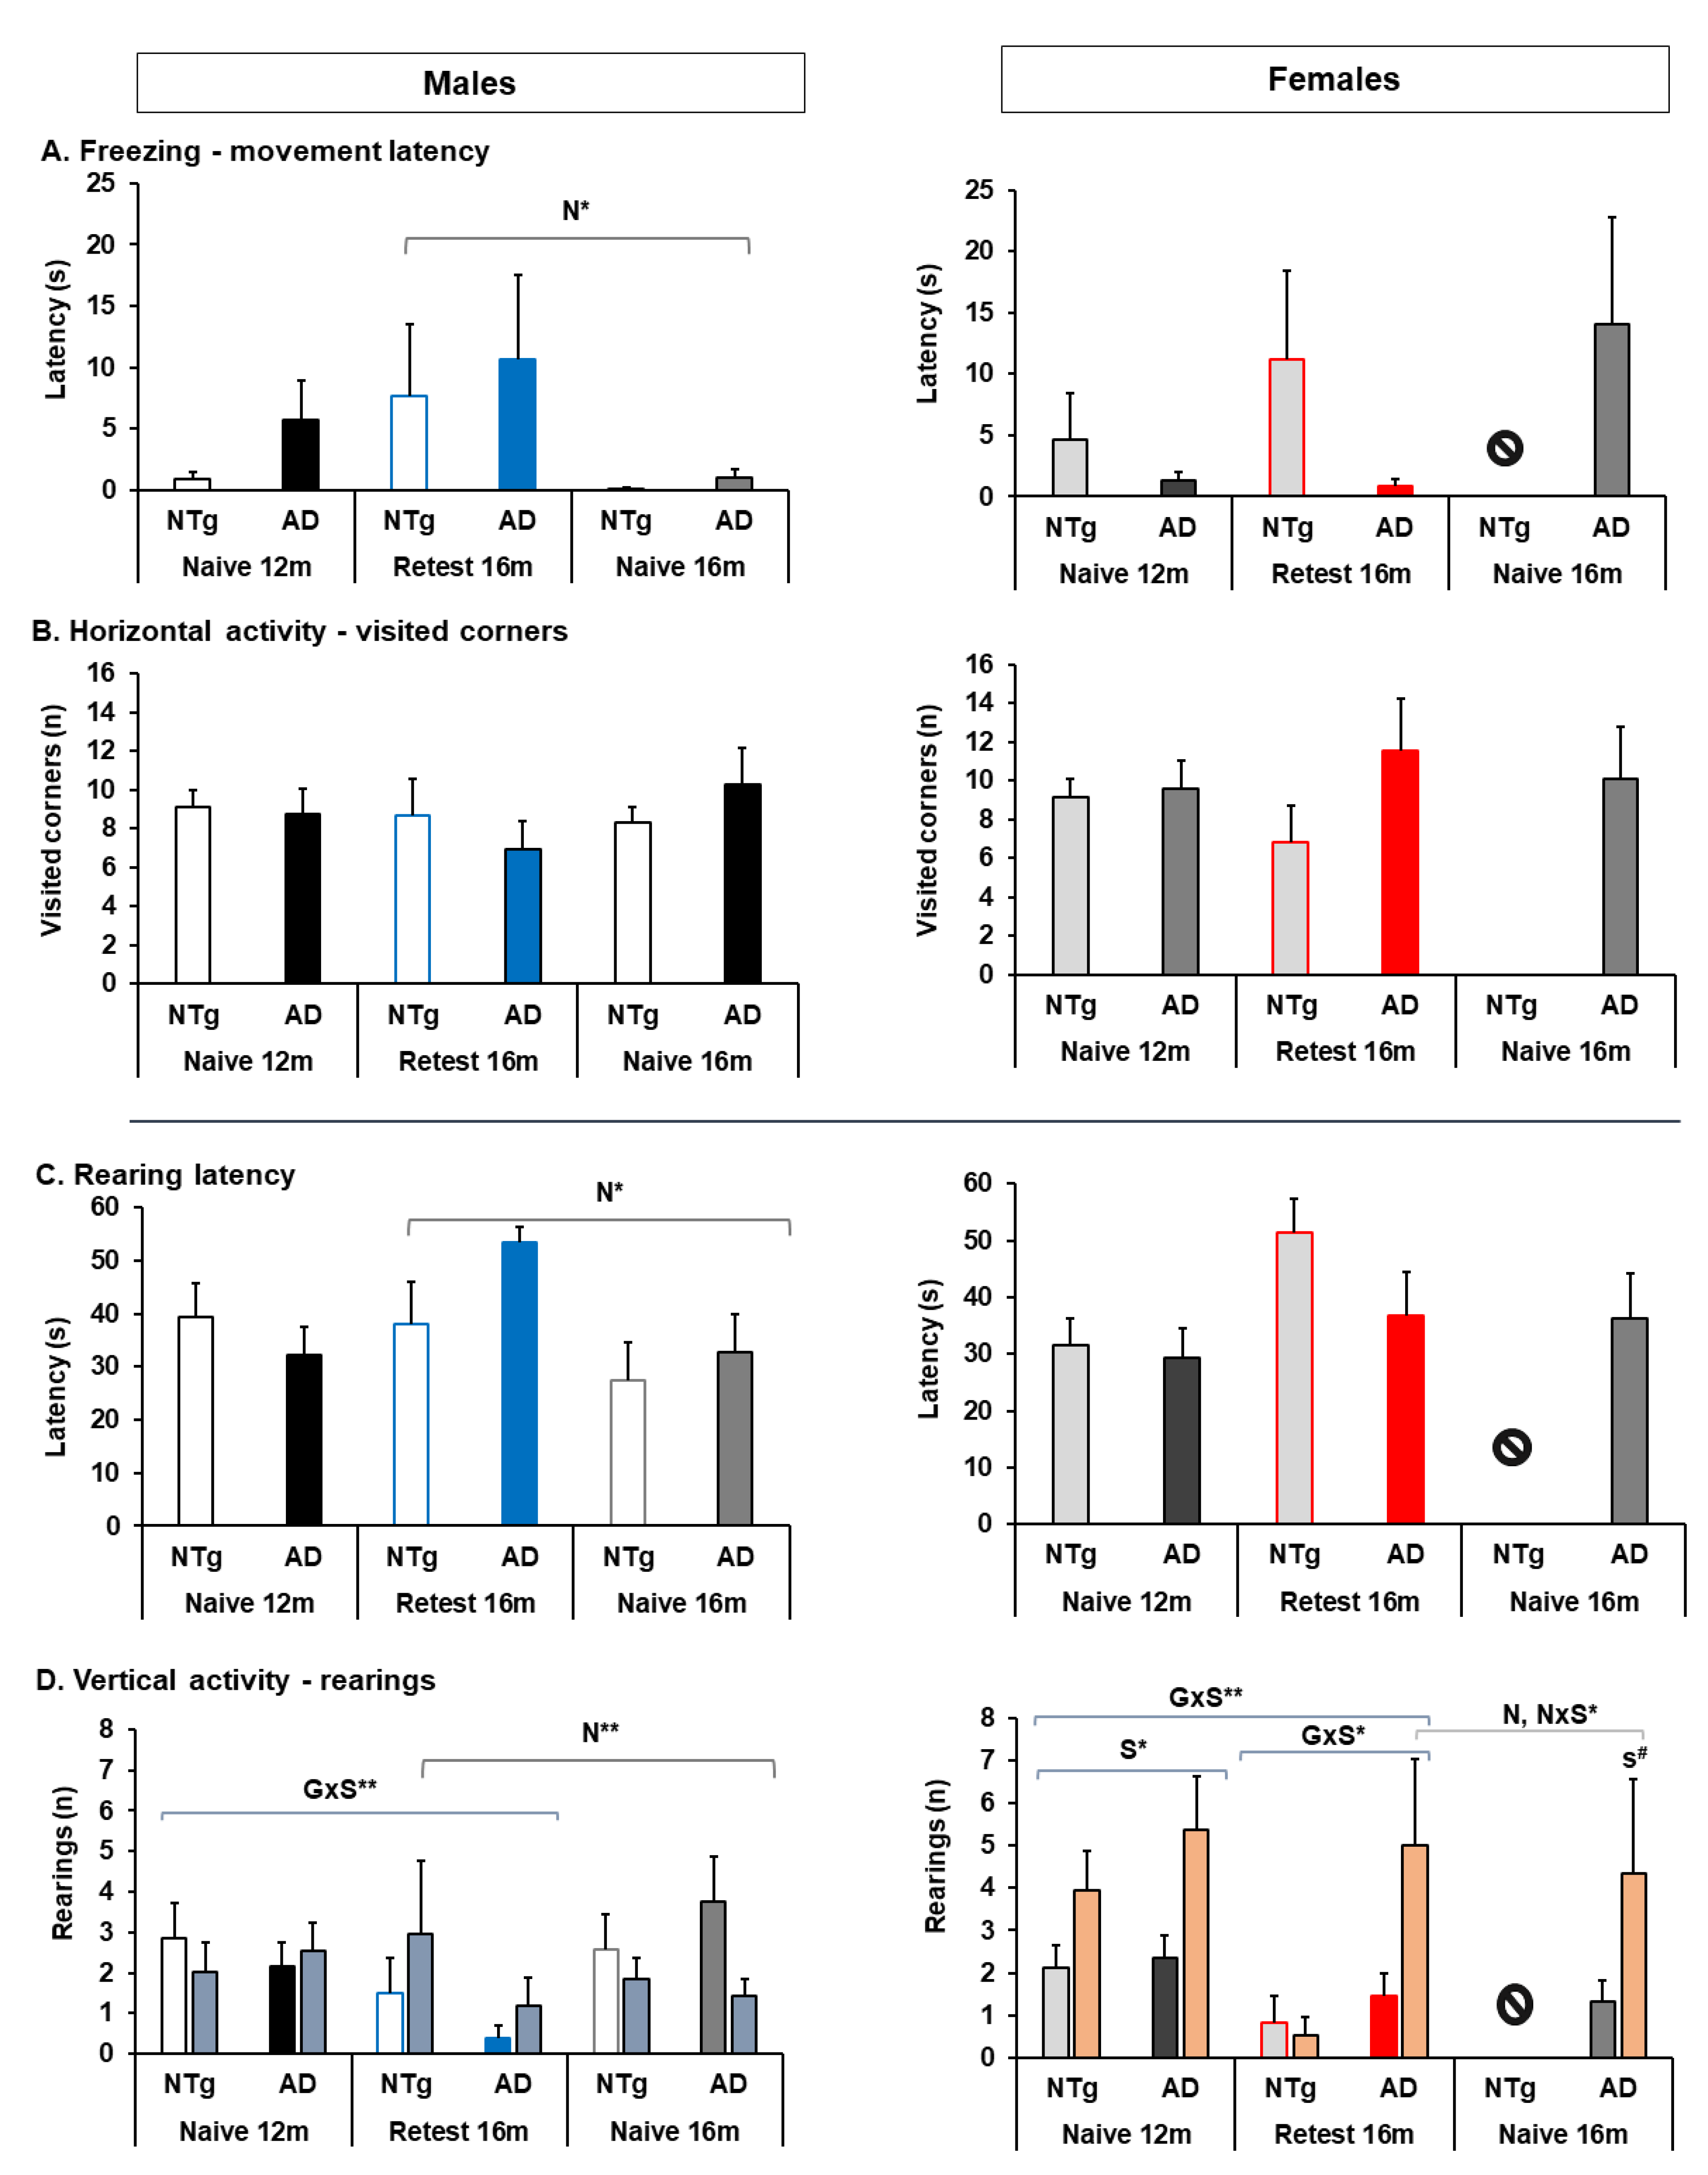
3.2. Quantitative Parameters of Gait, and Neophobia and Exploration
3.3. Muscular Strength: Forelimb Grip Strength and Muscular Endurance—Hanger Test and Response to Gravity: Geotaxis
3.4. Motor Performance: Learning and Physical Endurance—Rotarod
3.5. Biological Status: HPA Axis and Sarcopenia Index
4. Discussion
4.1. Survival, Bodyweight, Phenotype Scoring System, Frailty Score, and Kyphosis
4.1.1. Survival
4.1.2. Frailty
4.1.3. Kyphosis
4.1.4. Phenotype Scoring System
4.1.5. Clasping
4.2. Quantitative Parameters of Gait, and Neophobia and Exploration
4.2.1. Stride Length
4.2.2. Speed
4.2.3. Neophobia and Exploration
4.3. Muscular Strength: Forelimb Grip Strength and Muscular Endurance—Hanger Test and Response to Gravity—Geotaxis
4.3.1. Muscular Strength
4.3.2. Geotaxis
4.4. Motor Performance: Learning and Physical Endurance—Rotarod
4.5. Biological Status: HPA Axis and Sarcopenia Index
4.5.1. Corticosterone
4.5.2. Sarcopenia
5. Conclusions
Supplementary Materials
Author Contributions
Funding
Institutional Review Board Statement
Informed Consent Statement
Data Availability Statement
Acknowledgments
Conflicts of Interest
References
- Allan, L.M.; Ballard, C.G.; Burn, D.J.; Kenny, R.A. Prevalence and Severity of Gait Disorders in Alzheimer’s and Non-Alzheimer’s Dementias. J. Am. Geriatr. Soc. 2005, 53, 1681–1687. [Google Scholar] [CrossRef] [PubMed]
- Buchman, A.S.; Wilson, R.S.; Boyle, P.A.; Bienias, J.L.; Bennett, D.A. Change in Motor Function and Risk of Mortality in Older Persons. J. Am. Geriatr. Soc. 2007, 55, 11–19. [Google Scholar] [CrossRef] [PubMed]
- Fried, L.; Tangen, C.M.; Walston, J.; Newman, A.B.; Hirsch, C.; Gottdiener, J.; Seeman, T.; Tracy, R.; Kop, W.J.; Burke, G.; et al. Frailty in Older Adults: Evidence for a Phenotype. J. Gerontol. Med. Sci. 2001, 56, M146–M156. [Google Scholar] [CrossRef] [PubMed]
- Bland, J.S. Age as a Modifiable Risk Factor for Chronic Disease. Integr. Med. A Clin. J. 2018, 17, 16–19. [Google Scholar]
- Lee, D.R.; Santo, E.C.; Lo, J.C.; Ritterman Weintraub, M.L.; Patton, M.; Gordon, N.P. Understanding functional and social risk characteristics of frail older adults: A cross-sectional survey study. BMC Fam. Pract. 2018, 19, 170. [Google Scholar] [CrossRef] [Green Version]
- Beeri, M.S.; Leurgans, S.E.; Bennett, D.A.; Barnes, L.L.; Buchman, A.S. Diverse Motor Performances Are Related to Incident Cognitive Impairment in Community-Dwelling Older Adults. Front. Aging Neurosci. 2021, 13, 717139. [Google Scholar] [CrossRef]
- Geritz, J.; Maetzold, S.; Steffen, M.; Pilotto, A.; Corrà, M.F.; Moscovich, M.; Rizzetti, M.C.; Borroni, B.; Padovani, A.; Alpes, A.; et al. Motor, cognitive and mobility deficits in 1000 geriatric patients: Protocol of a quantitative observational study before and after routine clinical geriatric treatment—The ComOn-study. BMC Geriatr. 2020, 20, 45. [Google Scholar] [CrossRef]
- Liou, W.C.; Chan, L.; Hong, C.T.; Chi, W.C.; Yen, C.F.; Liao, H.F.; Chen, J.H.; Liou, T.H. Hand fine motor skill disability correlates with dementia severity. Arch. Gerontol. Geriatr. 2020, 90, 104168. [Google Scholar] [CrossRef]
- Poirier, G.; Ohayon, A.; Juranville, A.; Mourey, F.; Gaveau, J. Deterioration, Compensation and Motor Control Processes in Healthy Aging, Mild Cognitive Impairment and Alzheimer’s Disease. Geriatrics 2021, 6, 33. [Google Scholar] [CrossRef]
- Scarmeas, N.; Hadjigeorgiou, G.M.; Papadimitriou, A.; Dubois, B.; Sarazin, M.; Brandt, J.; Albert, M.; Marder, K.; Bell, K.; Honig, L.S.; et al. Motor signs during the course of Alzheimer disease. Neurology 2004, 63, 975–982. [Google Scholar] [CrossRef] [Green Version]
- Sperling, R.A.; Mormino, E.C.; Schultz, A.P.; Betensky, R.A.; Papp, K.V.; Amariglio, R.E.; Hanseeuw, B.J.; Buckley, R.; Chhatwal, J.; Hedden, T.; et al. The impact of amyloid-beta and tau on prospective cognitive decline in older individuals. Ann. Neurol. 2019, 85, 181–193. [Google Scholar] [CrossRef] [PubMed]
- Morozova, A.; Zorkina, Y.; Abramova, O.; Pavlova, O.; Pavlov, K.; Solovevа, K.; Volkova, M.; Alekseeva, P.; Andryshchenko, A.; Kostyuk, G.; et al. Neurobiological Highlights of Cognitive Impairment in Psychiatric Disorders. Int. J. Mol. Sci. 2022, 23, 1217. [Google Scholar] [CrossRef] [PubMed]
- Dyer, A.H.; Murphy, C.; Lawlor, B.; Kennelly, S.; Segurado, R.; Olde Rikkert, M.G.M.; Howard, R.; Pasquier, F.; Börjesson-Hanson, A.; Tsolaki, M.; et al. Gait speed, cognition and falls in people living with mild-to-moderate Alzheimer disease: Data from NILVAD. BMC Geriatr. 2020, 20, 117. [Google Scholar] [CrossRef] [PubMed] [Green Version]
- You, Z.Z.; You, Z.Z.; Li, Y.; Zhao, S.; Ren, H.; Hu, X. Alzheimer’s disease distinction based on gait feature analysis. In Proceedings of the 2020 International Conference on e-health Networking, Applications and Services (HealthCom), Shenzhen, China, 1–2 March 2021; pp. 1–6. [Google Scholar] [CrossRef]
- Buchman, A.S.; Bennett, D.A. Loss of motor function in preclinical Alzheimer’s disease. Expert Rev. Neurother. 2011, 11, 665–676. [Google Scholar] [CrossRef] [PubMed]
- Wolkowitz, O.W.; Epel, E.S.; Reus, V.I.; Mellon, S.H. Depression gets old fast: Do stress and depression accelerate cell aging? Depress. Anxiety 2010, 27, 327–338. [Google Scholar] [CrossRef] [PubMed]
- Tanaka, M.; Toldi, J.; Vécsei, L. Exploring the Etiological Links behind Neurodegenerative Diseases: Inflammatory Cytokines and Bioactive Kynurenines. Int. J. Mol. Sci. 2020, 21, 2431. [Google Scholar] [CrossRef] [Green Version]
- Chitnis, T.; Weiner, H.L. CNS inflammation and neurodegeneration. J. Clin. Investig. 2017, 127, 3577. [Google Scholar] [CrossRef] [Green Version]
- Battaglia, S.; Garofalo, S.; di Pellegrino, G. Context-dependent extinction of threat memories: Influences of healthy aging. Sci. Rep. 2018, 8, 12592. [Google Scholar] [CrossRef]
- Ferretti, M.T.; Martinkova, J.; Biskup, E.; Benke, T.; Gialdini, G.; Nedelska, Z.; Rauen, K.; Mantua, V.; Religa, D.; Hort, J.; et al. Sex and gender differences in Alzheimer’s disease: Current challenges and implications for clinical practice. Eur. J. Neurol. 2020, 27, 928–943. [Google Scholar] [CrossRef]
- Guo, L.; Zhong, M.B.; Zhang, L.; Zhang, B.; Cai, D. Sex Differences in Alzheimer’s Disease: Insights From the Multiomics Landscape. Biol. Psychiatry 2022, 91, 61–71. [Google Scholar] [CrossRef]
- Laws, K.R.; Irvine, K.; Gale, T.M. Sex differences in Alzheimer’s disease. Curr. Opin. Psychiatry 2018, 31, 133–139. [Google Scholar] [CrossRef] [PubMed]
- Xing, Y.; Tang, Y.; Jia, J. Sex Differences in Neuropsychiatric Symptoms of Alzheimer’s Disease: The Modifying Effect of Apolipoprotein e ε 4 Status. Behav. Neurol. 2015, 275256. [Google Scholar] [CrossRef] [PubMed] [Green Version]
- Gabelli, C.; Codemo, A. Gender differences in cognitive decline and Alzheimer’s disease. Ital. J. Gender-Specific Med. 2015, 1, 21–28. [Google Scholar] [CrossRef]
- Laws, K.R.; Irvine, K.; Gale, T.M. Sex differences in cognitive impairment in Alzheimer’s disease. World J. Psychiatry 2016, 6, 54–65. [Google Scholar] [CrossRef] [Green Version]
- Kirkland, J.L. Translating advances from the basic biology of aging into clinical application. Exp. Gerontol. 2013, 48, 1–5. [Google Scholar] [CrossRef] [Green Version]
- Kirkland, J.L.; Peterson, C. Healthspan, translation, and new outcomes for animal studies of aging. J. Gerontol. A Biol. Sci. Med. Sci. 2009, 64, 209–212. [Google Scholar] [CrossRef]
- Camargo, L.C.; Honold, D.; Bauer, R.; Jon Shah, N.; Langen, K.J.; Willbold, D.; Kutzsche, J.; Willuweit, A.; Schemmert, S. Sex-related motor deficits in the tau-p301l mouse model. Biomedicines 2021, 9, 1160. [Google Scholar] [CrossRef]
- Kane, A.E.; Shin, S.; Wong, A.A.; Fertan, E.; Faustova, N.S.; Howlett, S.E.; Brown, R.E. Sex differences in healthspan predict lifespan in the 3xTg-AD Mouse model of Alzheimer’s Disease. Front. Aging Neurosci. 2018, 10, 172. [Google Scholar] [CrossRef] [Green Version]
- O’Leary, T.P.; Robertson, A.; Chipman, P.H.; Rafuse, V.F.; Brown, R.E. Motor function deficits in the 12 month-old female 5xFAD mouse model of Alzheimer’s disease. Behav. Brain Res. 2018, 337, 256–263. [Google Scholar] [CrossRef]
- Castillo-Mariqueo, L.; Pérez-García, M.J.; Giménez-Llort, L. Modeling Functional Limitations, Gait Impairments, and Muscle Pathology in Alzheimer’s Disease: Studies in the 3xTg-AD Mice. Biomedicines 2021, 9, 1365. [Google Scholar] [CrossRef]
- Castillo-Mariqueo, L.; Giménez-Llort, L. Kyphosis and bizarre patterns impair spontaneous gait performance in end-of-life mice with Alzheimer’s disease pathology while gait is preserved in normal aging. Neurosci. Lett. 2021, 136280. [Google Scholar] [CrossRef] [PubMed]
- Castillo-Mariqueo, L.; Giménez-Llort, L. Translational Modeling of Psychomotor Function in Normal and AD-Pathological Aging With Special Concerns on the Effects of Social Isolation. Front. Aging 2021, 2, 648567. [Google Scholar] [CrossRef]
- LaFerla, F.M.; Oddo, S. Alzheimer’s disease: Abeta, tau and synaptic dysfunction. Trends Mol. Med. 2005, 11, 170–176. [Google Scholar] [CrossRef] [PubMed]
- Oddo, S.; Caccamo, A.; Shepherd, J.D.; Murphy, M.P.; Golde, T.E.; Kayed, R.; Metherate, R.; Mattson, M.P.; Akbari, Y.; LaFerla, F.M. Triple-Transgenic Model of Alzheimer’s Disease with Plaques and Tangles: Intracellular Aβ and Synaptic Dysfunction evaluating the efficacy of anti-AD therapies in mitigating. Neuron 2003, 39, 409–421. [Google Scholar] [CrossRef] [Green Version]
- Kilkenny, C.; Browne, W.J.; Cuthill, I.C.; Emerson, M.; Altman, D.G. Improving Bioscience Research Reporting: The ARRIVE Guidelines for Reporting Animal Research. PLoS Biol. 2010, 8, e1000412. [Google Scholar] [CrossRef] [PubMed]
- Ditzler, S.; Stoeck, J.; Leblanc, M.; Kooperberg, C.; Hansen, S.; Olson, J. A Rapid Neurobehavioral Assessment Reveals that FK506 Delays Symptom Onset in R6/2 Huntington’s Disease Mice. Preclinica. 2003, 1, 115–126. [Google Scholar]
- Guyenet, S.J.; Furrer, S.A.; Damian, V.M.; Baughan, T.D.; la Spada, A.R.; Garden, G.A. A simple composite phenotype scoring system for evaluating mouse models of cerebellar ataxia. J. Vis. Exp. 2010, 1–3. [Google Scholar] [CrossRef] [Green Version]
- Kojic, M.; Gaik, M.; Kiska, B.; Salerno-Kochan, A.; Hunt, S.; Tedoldi, A.; Mureev, S.; Jones, A.; Whittle, B.; Genovesi, L.A.; et al. Elongator mutation in mice induces neurodegeneration and ataxia-like behavior. Nat. Commun. 2018, 9, 3195. [Google Scholar] [CrossRef]
- Ma, Q.L.; Zuo, X.; Yang, F.; Ubeda, O.; Gant, D.; Alaverdyan, M.; Kiosea, N.; Nazari, S.; Chen, P.P.; Nothias, F.; et al. Loss of MAP function leads to hippocampal synapse loss and deficits in the Morris Water Maze with aging. J. Neurosci. 2014, 34, 7124–7136. [Google Scholar] [CrossRef] [Green Version]
- Whitehead, J.C.; Hildebrand, B.A.; Sun, M.; Rockwood, M.R.; Rose, R.A.; Rockwood, K.; Howlett, S.E. A clinical frailty index in aging mice: Comparisons with frailty index data in humans. J. Gerontol. Ser. A Biol. Sci. Med. Sci. 2014, 69, 621–632. [Google Scholar] [CrossRef]
- Muntsant, A.; Jiménez-Altayó, F.; Puertas-Umbert, L.; Jiménez-Xarrie, E.; Vila, E.; Giménez-Llort, L. Sex-dependent end-of-life mental and vascular scenarios for compensatory mechanisms in mice with normal and ad-neurodegenerative aging. Biomedicines 2021, 9, 111. [Google Scholar] [CrossRef] [PubMed]
- Wang, X.; Wang, Q.M.; Meng, Z.; Yin, Z.; Luo, X.; Yu, D. Gait disorder as a predictor of spatial learning and memory impairment in aged mice. PeerJ 2017, 5, e2854. [Google Scholar] [CrossRef] [PubMed] [Green Version]
- Giménez-Llort, L.; García, Y.; Buccieri, K.; Revilla, S.; Suñol, C.; Cristofol, R.; Sanfeliu, C. Gender-Specific Neuroimmunoendocrine Response to Treadmill Exercise in 3xTg-AD Mice. Int J. Alzheimers Dis. 2010, 128354. [Google Scholar] [CrossRef] [Green Version]
- Giménez-Llort, L.; Fernández-Teruel, A.; Escorihuela, R.M.; Fredholm, B.B.; Tobeña, A.; Pekny, M.; Johansson, B. Mice lacking the adenosine A1 receptor are anxious and aggressive, but are normal learners with reduced muscle strength and survival rate. Eur. J. Neurosci. 2002, 16, 547–550. [Google Scholar] [CrossRef] [PubMed]
- Edström, E.; Ulfhake, B. Sarcopenia is not due to lack of regenerative drive in senescent skeletal muscle. Aging Cell 2005, 4, 65–77. [Google Scholar] [CrossRef]
- Torres-Lista, V.; Fuente, M.D.; Giménez-Llort, L. Survival Curves and Behavioral Profiles of Female 3xTg-AD Mice Surviving to 18–Months of Age as Compared to Mice with Normal Aging. J. Alzheimer’s Dis. Reports 2017, 1, 47. [Google Scholar] [CrossRef] [PubMed] [Green Version]
- Richardson, A.; Fischer, K.E.; Speakman, J.R.; De Cabo, R.; Mitchell, S.J.; Peterson, C.A.; Rabinovitch, P.; Chiao, Y.A.; Taffet, G.; Miller, R.A.; et al. Measures of Healthspan as Indices of Aging in Mice—A Recommendation. J. Gerontol. Ser. A Biol. Sci. Med. Sci. 2016, 71, 427–430. [Google Scholar] [CrossRef] [Green Version]
- Rae, E.A.; Brown, R.E. The problem of genotype and sex differences in life expectancy in transgenic AD mice. Neurosci. Biobehav. Rev. 2015, 57, 238–251. [Google Scholar] [CrossRef]
- Baglietto-Vargas, D.; Chen, Y.; Suh, D.; Ager, R.R.; Rodriguez-Ortiz, C.J.; Mederios, R.; Myczek, K.; Green, K.N.; Baram, T.Z.; LaFerla, F.M. Short-term modern life-like stress exacerbates Aβ-pathology and synapse loss in 3xTg-AD mice. J. Neurochem. 2015, 134, 915–926. [Google Scholar] [CrossRef] [Green Version]
- Giménez-Llort, L.; Marin-Pardo, D.; Marazuela, P.; Del Hernández-Guillamón, M.M. Survival Bias and Crosstalk between Chronological and Behavioral Age: Age- and Genotype-Sensitivity Tests Define Behavioral Signatures in Middle-Aged, Old, and Long-Lived Mice with Normal and AD-Associated Aging. Biomedicines 2021, 9, 636. [Google Scholar] [CrossRef]
- Brown, R.E.; Shin, S.; Woodland, N.; Rae, E.A. Genotype and Sex Differences in Longevity in Transgenic Mouse Models of Alzheimer’s Disease. In Conn’s Handbook of Models for Human Aging; Academic Press: Cambridge, MA, USA, 2018; pp. 563–576. [Google Scholar] [CrossRef]
- Seldeen, K.L.; Pang, M.; Troen, B.R. Mouse Models of Frailty: An Emerging Field. Curr. Osteoporos. Rep. 2015, 13, 280–286. [Google Scholar] [CrossRef] [PubMed]
- Kwak, D.; Baumann, C.W.; Thompson, L.D.V. Identifying Characteristics of Frailty in Female Mice Using a Phenotype Assessment Tool. J. Gerontol. Ser. A. 2020, 75, 640–646. [Google Scholar] [CrossRef] [PubMed]
- Lalonde, R.; Strazielle, C. Brain regions and genes affecting limb-clasping responses. Brain Res. Rev. 2011, 67, 252–259. [Google Scholar] [CrossRef] [PubMed]
- Lieu, C.A.; Chinta, S.J.; Rane, A.; Andersen, J.K. Age-Related Behavioral Phenotype of an Astrocytic Monoamine Oxidase-B Transgenic Mouse Model of Parkinson’s Disease. PLoS ONE 2013, 8, e54200. [Google Scholar] [CrossRef] [PubMed]
- Noda, S.; Sato, S.; Fukuda, T.; Tada, N.; Hattori, N. Aging-related motor function and dopaminergic neuronal loss in C57BL/6 mice. Mol. Brain 2020, 13, 46. [Google Scholar] [CrossRef]
- Stover, K.R.; Campbell, M.A.; Van Winssen, C.M.; Brown, R.E. Analysis of motor function in 6-month-old male and female 3xTg-AD mice. Behav. Brain Res. 2015, 281, 16–23. [Google Scholar] [CrossRef]
- Garvock-de Montbrun, T.; Fertan, E.; Stover, K.; Brown, R.E. Motor deficits in 16-month-old male and female 3xTg-AD mice. Behav. Brain Res. 2019, 356, 305–313. [Google Scholar] [CrossRef]
- Filali, M.; Lalonde, R.; Theriault, P.; Julien, C.; Calon, F.; Planel, E. Cognitive and non-cognitive behaviors in the triple transgenic mouse model of Alzheimer’s disease expressing mutated APP, PS1, and Mapt (3xTg-AD). Behav. Brain Res. 2012, 2, 334–342. [Google Scholar] [CrossRef]
- Pieruccini-Faria, F.; Black, S.E.; Masellis, M.; Smith, E.E.; Almeida, Q.J.; Li, K.Z.H.; Bherer, L.; Camicioli, R.; Montero-Odasso, M. Gait variability across neurodegenerative and cognitive disorders: Results from the Canadian Consortium of Neurodegeneration in Aging (CCNA) and the Gait and Brain Study. Alzheimers. Dement. 2021, 17, 1317–1328. [Google Scholar] [CrossRef]
- Belghali, M.; Chastan, N.; Cignetti, F.; Davenne, D.; Decker, L.M. Loss of gait control assessed by cognitive-motor dual-tasks: Pros and cons in detecting people at risk of developing Alzheimer’s and Parkinson’s diseases. GeroScience 2017, 39, 305–329. [Google Scholar] [CrossRef]
- Nadkarni, N.K.; Mawji, E.; Mcllroy, W.E.; Black, S.E. Spatial and temporal gait parameters in Alzheimer’s disease and aging. Gait Posture 2009, 30, 452–454. [Google Scholar] [CrossRef] [PubMed] [Green Version]
- Roda, A.R.; Villegas, S.; Esquerda-Canals, G.; Martí-Clúa, J. Cognitive Impairment in the 3xTg-AD Mouse Model of Alzheimer’s Disease is Affected by A beta-ImmunoTherapy and Cognitive Stimulation. Pharmaceutics 2020, 12, 944. [Google Scholar] [CrossRef] [PubMed]
- Boyle, P.A.; Buchman, A.S.; Wilson, R.S.; Leurgans, S.E.; Bennett, D.A. Association of muscle strength with the risk of Alzheimer disease and the rate of cognitive decline in community-dwelling older persons. Arch. Neurol. 2009, 66, 1339–1344. [Google Scholar] [CrossRef] [PubMed] [Green Version]
- Murata, S.; Ono, R.; Sugimoto, T.; Toba, K.; Sakurai, T. Functional Decline and Body Composition Change in Older Adults With Alzheimer Disease : A Retrospective Cohort Study at a Japanese Memory Clinic. Alzheimer Dis. Assoc. Disord. 2021, 35, 36–43. [Google Scholar] [CrossRef]
- Eeri, M.S.; Leugrans, S.E.; Delbono, O.; Bennett, D.A.; Buchman, A.S. Sarcopenia is associated with incident Alzheimer’s dementia, mild cognitive impairment, and cognitive decline. J. Am. Geriatr. Soc. 2021, 69, 1826–1835. [Google Scholar] [CrossRef]
- Ogawa, Y.; Kaneko, Y.; Shimizu, S.; Kanetaka, H.; Hanyu, H. Sarcopenia and Muscle Functions at Various Stages of Alzheimer Disease. Front. Neurol. 2018, 9, 710. [Google Scholar] [CrossRef] [Green Version]
- Larsson, L.; Degens, H.; Li, M.; Salviati, L.; Lee, Y.; Thompson, W.; Kirkland, J.L.; Sandri, M. Sarcopenia: Aging-Related Loss of Muscle Mass and Function. Physiol. Rev. 2019, 99, 427–511. [Google Scholar] [CrossRef]
- Lalonde, R.; Fukuchi, K.I.; Strazielle, C. Neurologic and motor dysfunctions in APP transgenic mice. Rev. Neurosci. 2012, 23, 363–379. [Google Scholar] [CrossRef] [Green Version]
- Graber, T.G.; Maroto, R.; Fry, C.S.; Brightwell, C.R.; Rasmussen, B.B. Measuring Exercise Capacity and Physical Function in Adult and Older Mice. J. Gerontol. Ser. A Biol. Sci. Med. Sci. 2021, 76, 819–824. [Google Scholar] [CrossRef]
- Hamieh, A.M.; Camperos, E.; Hernier, A.M.; Castagné, V. C57BL/6 mice as a preclinical model to study age-related cognitive deficits: Executive functions impairment and inter-individual differences. Brain Res. 2021, 1751, 147173. [Google Scholar] [CrossRef]
- Justice, J.N.; Carter, C.S.; Beck, H.J.; Gioscia-Ryan, R.A.; McQueen, M.; Enoka, R.M.; Seals, D.R. Battery of behavioral tests in mice that models age-associated changes in human motor function. Age 2014, 36, 583–595. [Google Scholar] [CrossRef] [PubMed]
- Tanaka, H.; Seals, D.R. Endurance exercise performance in Masters athletes: Age-associated changes and underlying physiological mechanisms. J. Physiol. 2008, 586, 55–63. [Google Scholar] [CrossRef] [PubMed]
- Pena, G.S.; Paez, H.G.; Johnson, T.K.; Halle, J.L.; Carzoli, J.P.; Visavadiya, N.P.; Zourdos, M.C.; Whitehurst, M.A.; Khamoui, A.V. Hippocampal Growth Factor and Myokine Cathepsin B Expression following Aerobic and Resistance Training in 3xTg-AD Mice. Int. J. Chronic Dis. 2020, 2020, 5919501. [Google Scholar] [CrossRef] [PubMed] [Green Version]
- Giménez-Llort, L.; Arranz, L.; Maté, I.; De la Fuente, M. Gender-specific neuroimmunoendocrine aging in a triple-transgenic 3xTg-AD mouse model for Alzheimer’s disease and its relation with longevity. Neuroimmunomodulation 2008, 15, 331–343. [Google Scholar] [CrossRef] [PubMed]
- Stephens, M.A.C.; Wand, G. Stress and the HPA Axis: Role of Glucocorticoids in Alcohol Dependence. Alcohol Res. 2012, 34, 468–483. [Google Scholar] [PubMed]
- Nguyen, E.T.; Selmanovic, D.; Maltry, M.; Morano, R.; Franco-Villanueva, A.; Estrada, C.M.; Solomon, M.B. Endocrine stress responsivity and social memory in 3xTg-AD female and male mice: A tale of two experiments. Horm. Behav. 2020, 126. [Google Scholar] [CrossRef]
- Rothman, S.M.; Herdener, N.; Camandola, S.; Texel, S.J.; Mughal, M.R.; Cong, W.N.; Martin, B.; Mattson, M.P. 3xTgAD mice exhibit altered behavior and elevated Aβ after chronic mild social stress. Neurobiol. Aging 2012, 33, 830.e1–830.e12. [Google Scholar] [CrossRef] [Green Version]
- Bai, A.; Xu, W.; Sun, J.; Liu, J.; Deng, X.; Wu, L.; Zou, X.; Zuo, J.; Zou, L.; Liu, Y.; et al. Associations of sarcopenia and its defining components with cognitive function in community-dwelling oldest old. BMC Geriatr. 2021, 21, 292. [Google Scholar] [CrossRef]
- Buchman, A.S.; Schneider, J.A.; Wilson, R.S.; Bienias, J.L.; Bennett, D.A. Body mass index in older persons is associated with Alzheimer disease pathology. Neurology 2006, 67, 1949–1954. [Google Scholar] [CrossRef]
- Buchman, A.S.; Wilson, R.S.; Bienias, J.L.; Shah, R.C.; Evans, D.A.; Bennett, D.A. Change in body mass index and risk of incident Alzheimer disease. Neurology 2005, 65, 892–897. [Google Scholar] [CrossRef]
- Cui, M.; Zhang, S.; Liu, Y.; Gang, X.; Wang, G. Grip Strength and the Risk of Cognitive Decline and Dementia: A Systematic Review and Meta-Analysis of Longitudinal Cohort Studies. Front. Aging Neurosci. 2021, 13, 625551. [Google Scholar] [CrossRef] [PubMed]


| Phenotype Scoring System | Naïve 12-Month-Old | Re-Test 16-Month-Old | Naïve 16-Month-Old | Statistics | |||||||
|---|---|---|---|---|---|---|---|---|---|---|---|
| Males | Females | p-Value | Males | Females | p-Value | Males | Females | p-Value | |||
| Clasping score | NTg | 0.52 ± 0.16 | 0.43 ± 0.08 | n.s. | 0.67 ± 0.20 | 0.69 ± 0.17 | n.s. | 0.25 ± 0.06 | NR | g* | n.s. |
| AD | 0.56 ± 0.17 | 0.62 ± 0.24 | 0.79 ± 0.19 | 0.30 ± 0.15 | 0.67 ± 0.18 * | 0.26 ± 0.12 | |||||
| Ledge score | NTg | 0.40 ± 0.15 | 0.48 ± 0.14 | n.s. | 0.60 ± 0.09 | 0.68 ± 0.11 | n.s. | 0.31 ± 0.12 | NR | n.s. | R** |
| AD | 0.25 ± 0.08 | 0.48 ± 0.13 | 0.58 ± 0.16 | 0.51 ± 0.07 | 0.22 ± 0.09 | 0.41 ± 0.14 | |||||
| Gait score | NTg | 0.21 ± 0.15 | 0.33 ± 0.12 | G×S** | 0.20 ± 0.13 | 0.38 ± 0.15 | G×S** | - | NR | s# | G*, R**, r&&, r$$ |
| AD | 0.26 ± 0.10 | - | 0.64 ± 0.13&& | - | 0.03 ± 0.03 | 0.44 ± 0.24 | |||||
| Kyphosis score | NTg | 1.07 ± 0.16 | 1.0 ± 0.25 | G** | 1.30 ± 0.15 | 1.38 ± 0.15 | n.s. | 0.72 ± 0.21, s$$ | NR | n.s. | G*, R***, r& |
| AD | 0.30 ± 0.13 | 0.43 ± 0.20 | 0.95 ± 0.26 | 1.37 ± 0.27 & | 0.47 ± 0.17 | 0.67 ± 0.28 | |||||
| Total score | NTg | 2.21 ± 0.37 | 2.24 ± 0.39 | G* | 2.77 ± 0.37 | 3.14 ± 0.45 | n.s. | 1.28 ± 0.23 | NR | n.s. | R***, r& G* |
| AD | 1.37 ± 0.30 | 1.52 ± 0.33 | 2.96 ± 0.58 & | 2.18 ± 0.32 | 1.39 ± 0.28 | 1.78 ± 0.44 | |||||
| Genotype Factor (G) | Sex Factor (S) | Re-Test Factor (R) | Naïve Factor (N) | |
|---|---|---|---|---|
| Phenotype scoring system | 🡅 deficits 3xTg-AD group 🡅 deterioration in 3xTg-AD males in the total score | |||
| Frailty | 🡅 3xTg-AD males at 16 m in the re-test | |||
| Kyphosis | 🡅 3xTg-AD males increased the severity in the re-test at 16 m | |||
| Quantitative parameters of gait | Speed: 🡅 3xTg-AD males at 12 m, and 🡇 in the re-test at 16 m 🡇 16 m naïve NTg and 3xTg-AD Cadence: 🡇 3xTg-AD males at 12 m and 16 m Re-test 🡇 3xTg-AD and NTg Re-test group at 12 and 16 m 🡇 Naïve 16 m NTg and 3xTg-AD males had a lower cadence than age-matched re-tests | Speed: 🡅 Re-test and naïve 16 m 3xTg-AD females Variability of stride length: 🡇 Re-test and naïve 16 m 3xTg-AD females | Stride length: 🡇 Re-test 3xTg-AD males at 12 m Cadence: 🡇 Naïve 16 m males 3xTg-AD and NTg 🡇3xTg-AD male in all groups | Stride length: 🡅 Naïve 3xTg-AD and NTg at 16 m |
| Exploration and neophobia | Exploratory activity (ratio): 🡅 NTg and 3xTg-AD females at 12 m | Freezing: 🡇 Naïve 3xTg-AD and NTg males at 16 m Vertical exploratory activity: 🡅 Naïve 3xTg-AD and NTg males at 16 m Exploratory activity (ratio): 🡅 Naïve 3xTg-AD and NTg males at 16 m 🡅 Naïve 3xTg-AD females at 16 m | ||
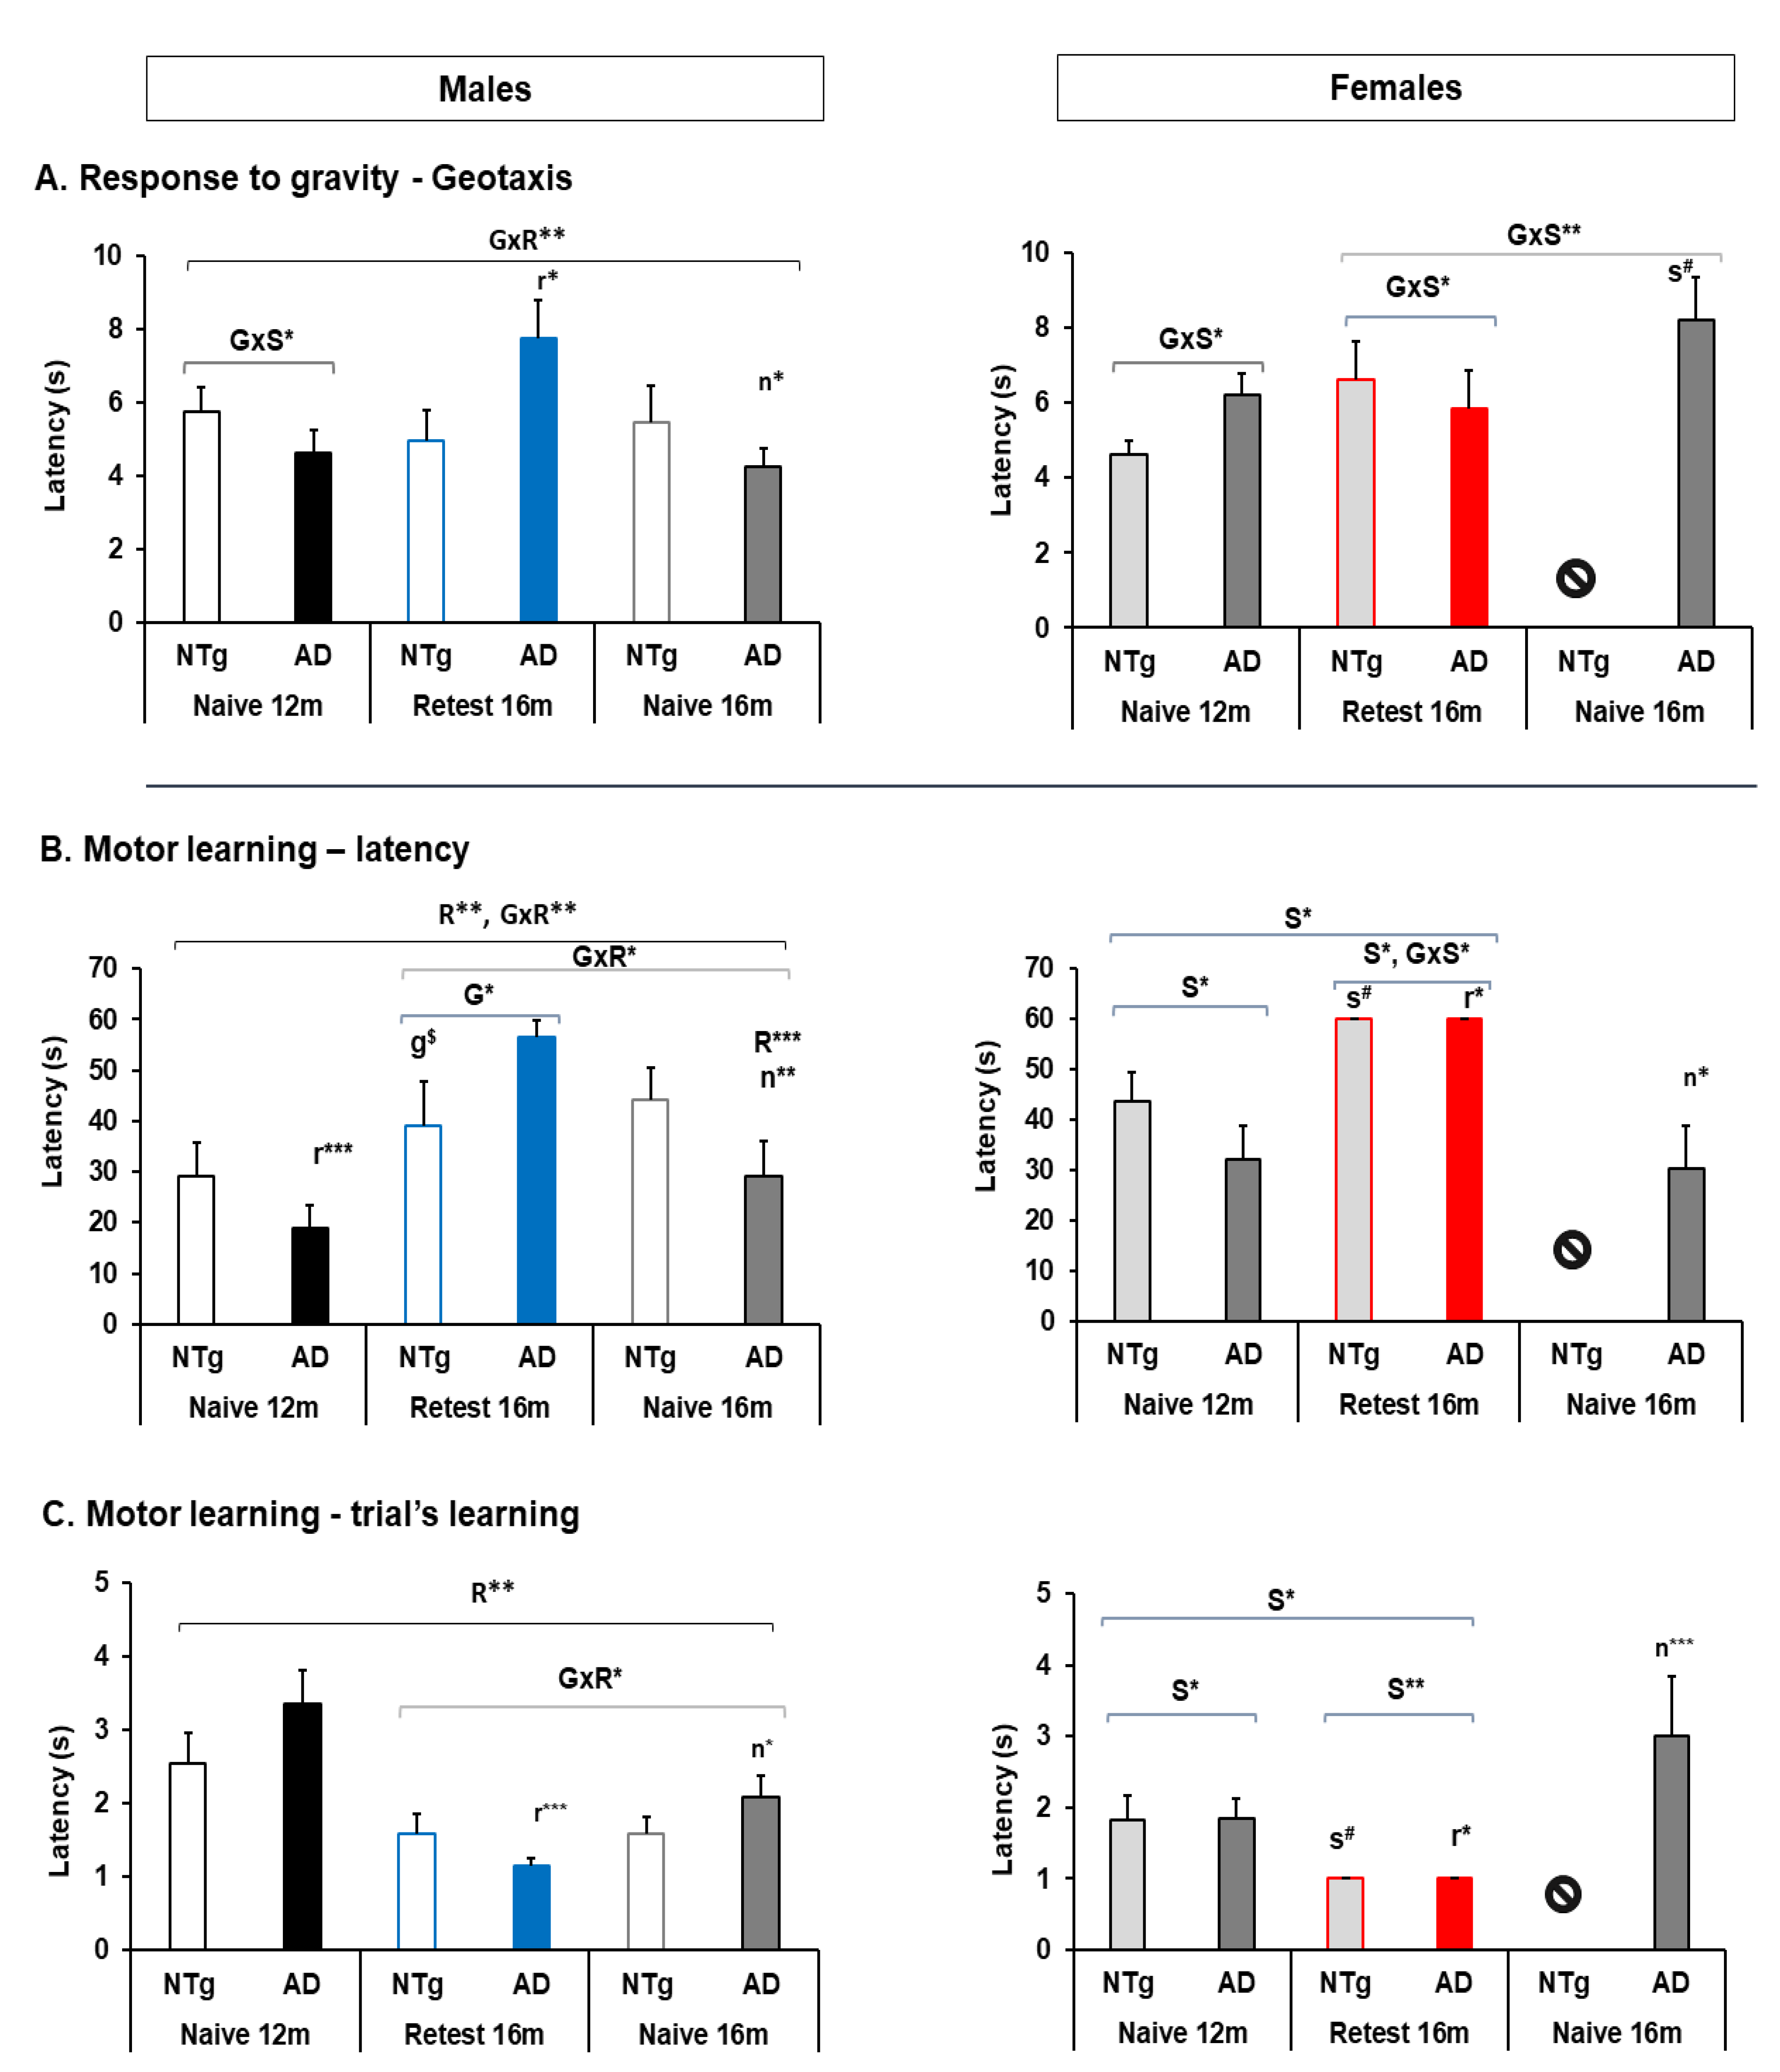
| Geotaxis | 🡅 Naïve 3xTg-AD females at 16 m | 🡅 Re-test 3xTg-AD in the re-test group compared to their performance at 12 m. | ||
| Motor learning | 🡅 Latency 3xTg-AD males Re-test at 16 m | 🡅 Latency and trials females at 12 m in both genotypes. 🡅 Females at 16 m re-test group | 🡅 Latency re-test 3xTg-AD males at 16 m 🡅 Latency re-test 3xTg-AD females at 16 m 🡅 N trials among males in re-test group 🡇 N trials among females in re-test group | 🡇 Latency naïve 3xTg-AD male and females at 16 m |
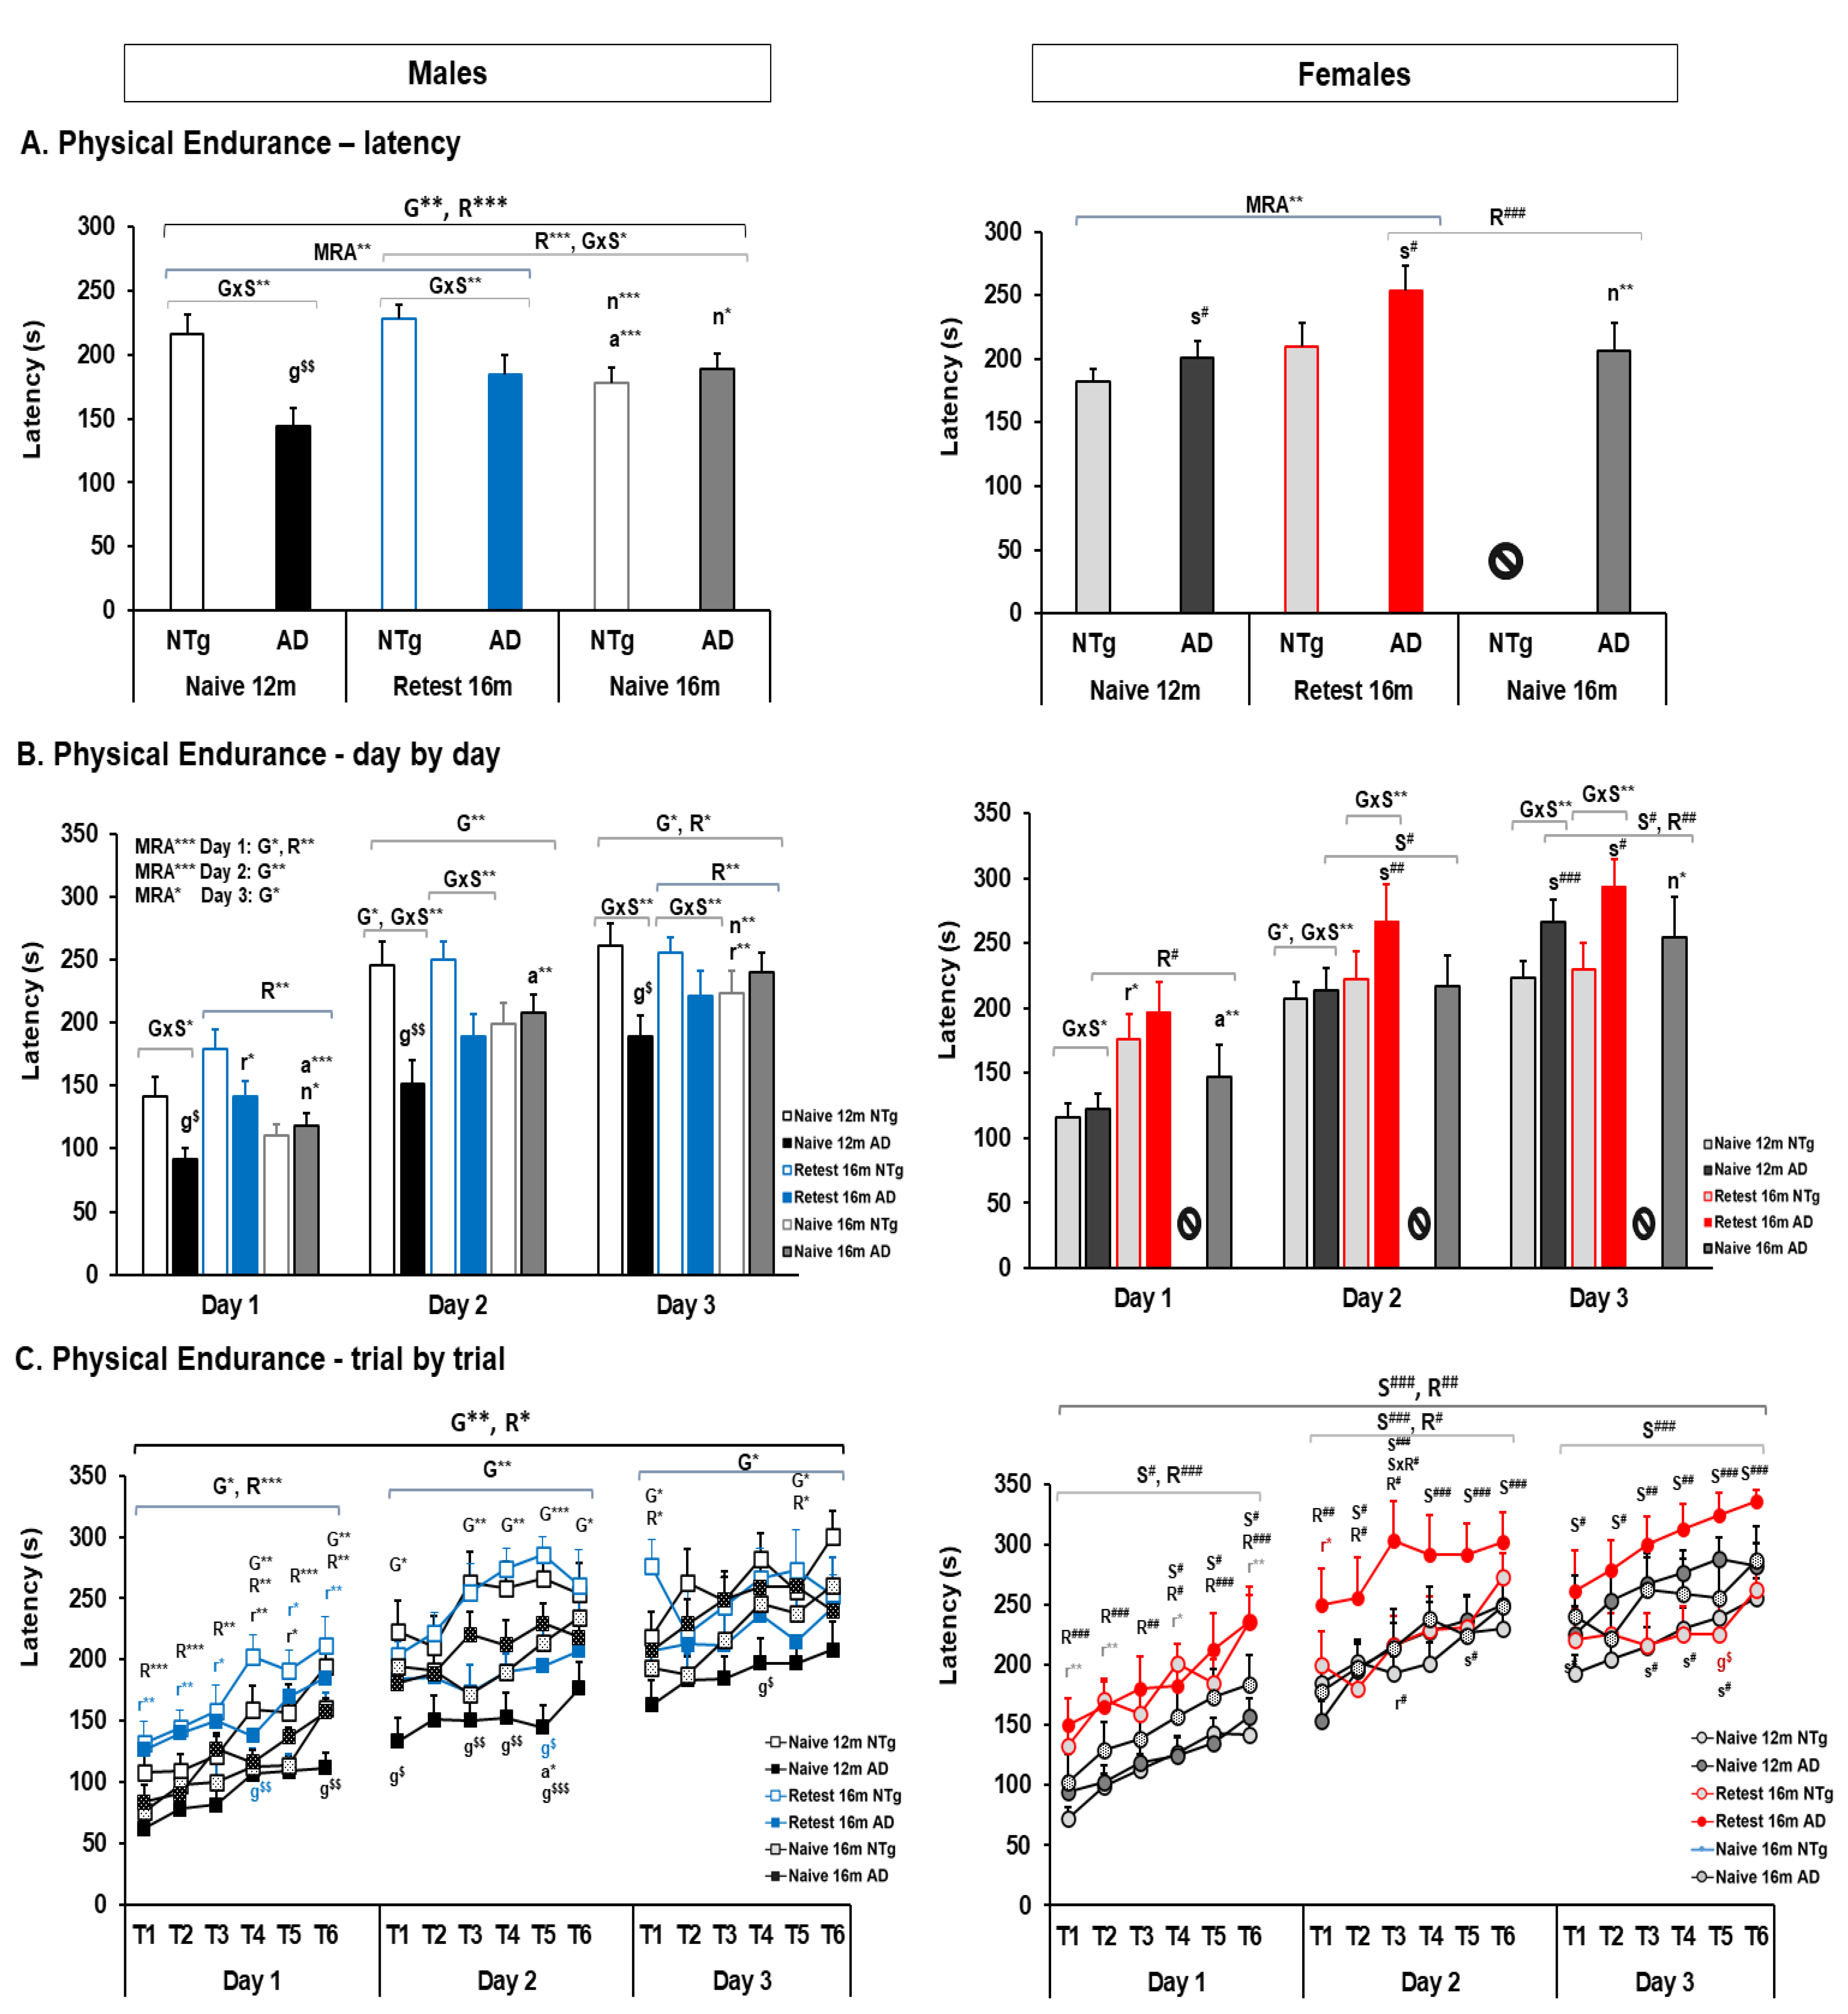
| Physical Endurance | 🡇 3xTg-AD males at 12 m and 16 m in the re-test group. 🡇 Day 2, 3xTg-AD males in all groups 🡇 Day 3, 3xTg-AD males at 12 m | 🡅 3xTg-AD females at 12 m and 16 m 🡅 Day 2–3, 3xTg-AD females at 12 m and 16 m | 🡅 NTg re-test males at 16 m 🡅 Re-test at 16 m in all group in 2nd and 3rd training days 🡅 Re-test at 16 m male groups in 1st training day 🡅 Re-test at 16 m female group in 1st and 2nd day | 🡅 16 m naïve 3xTg-AD males than 3xTg-AD Re-test at this age. |
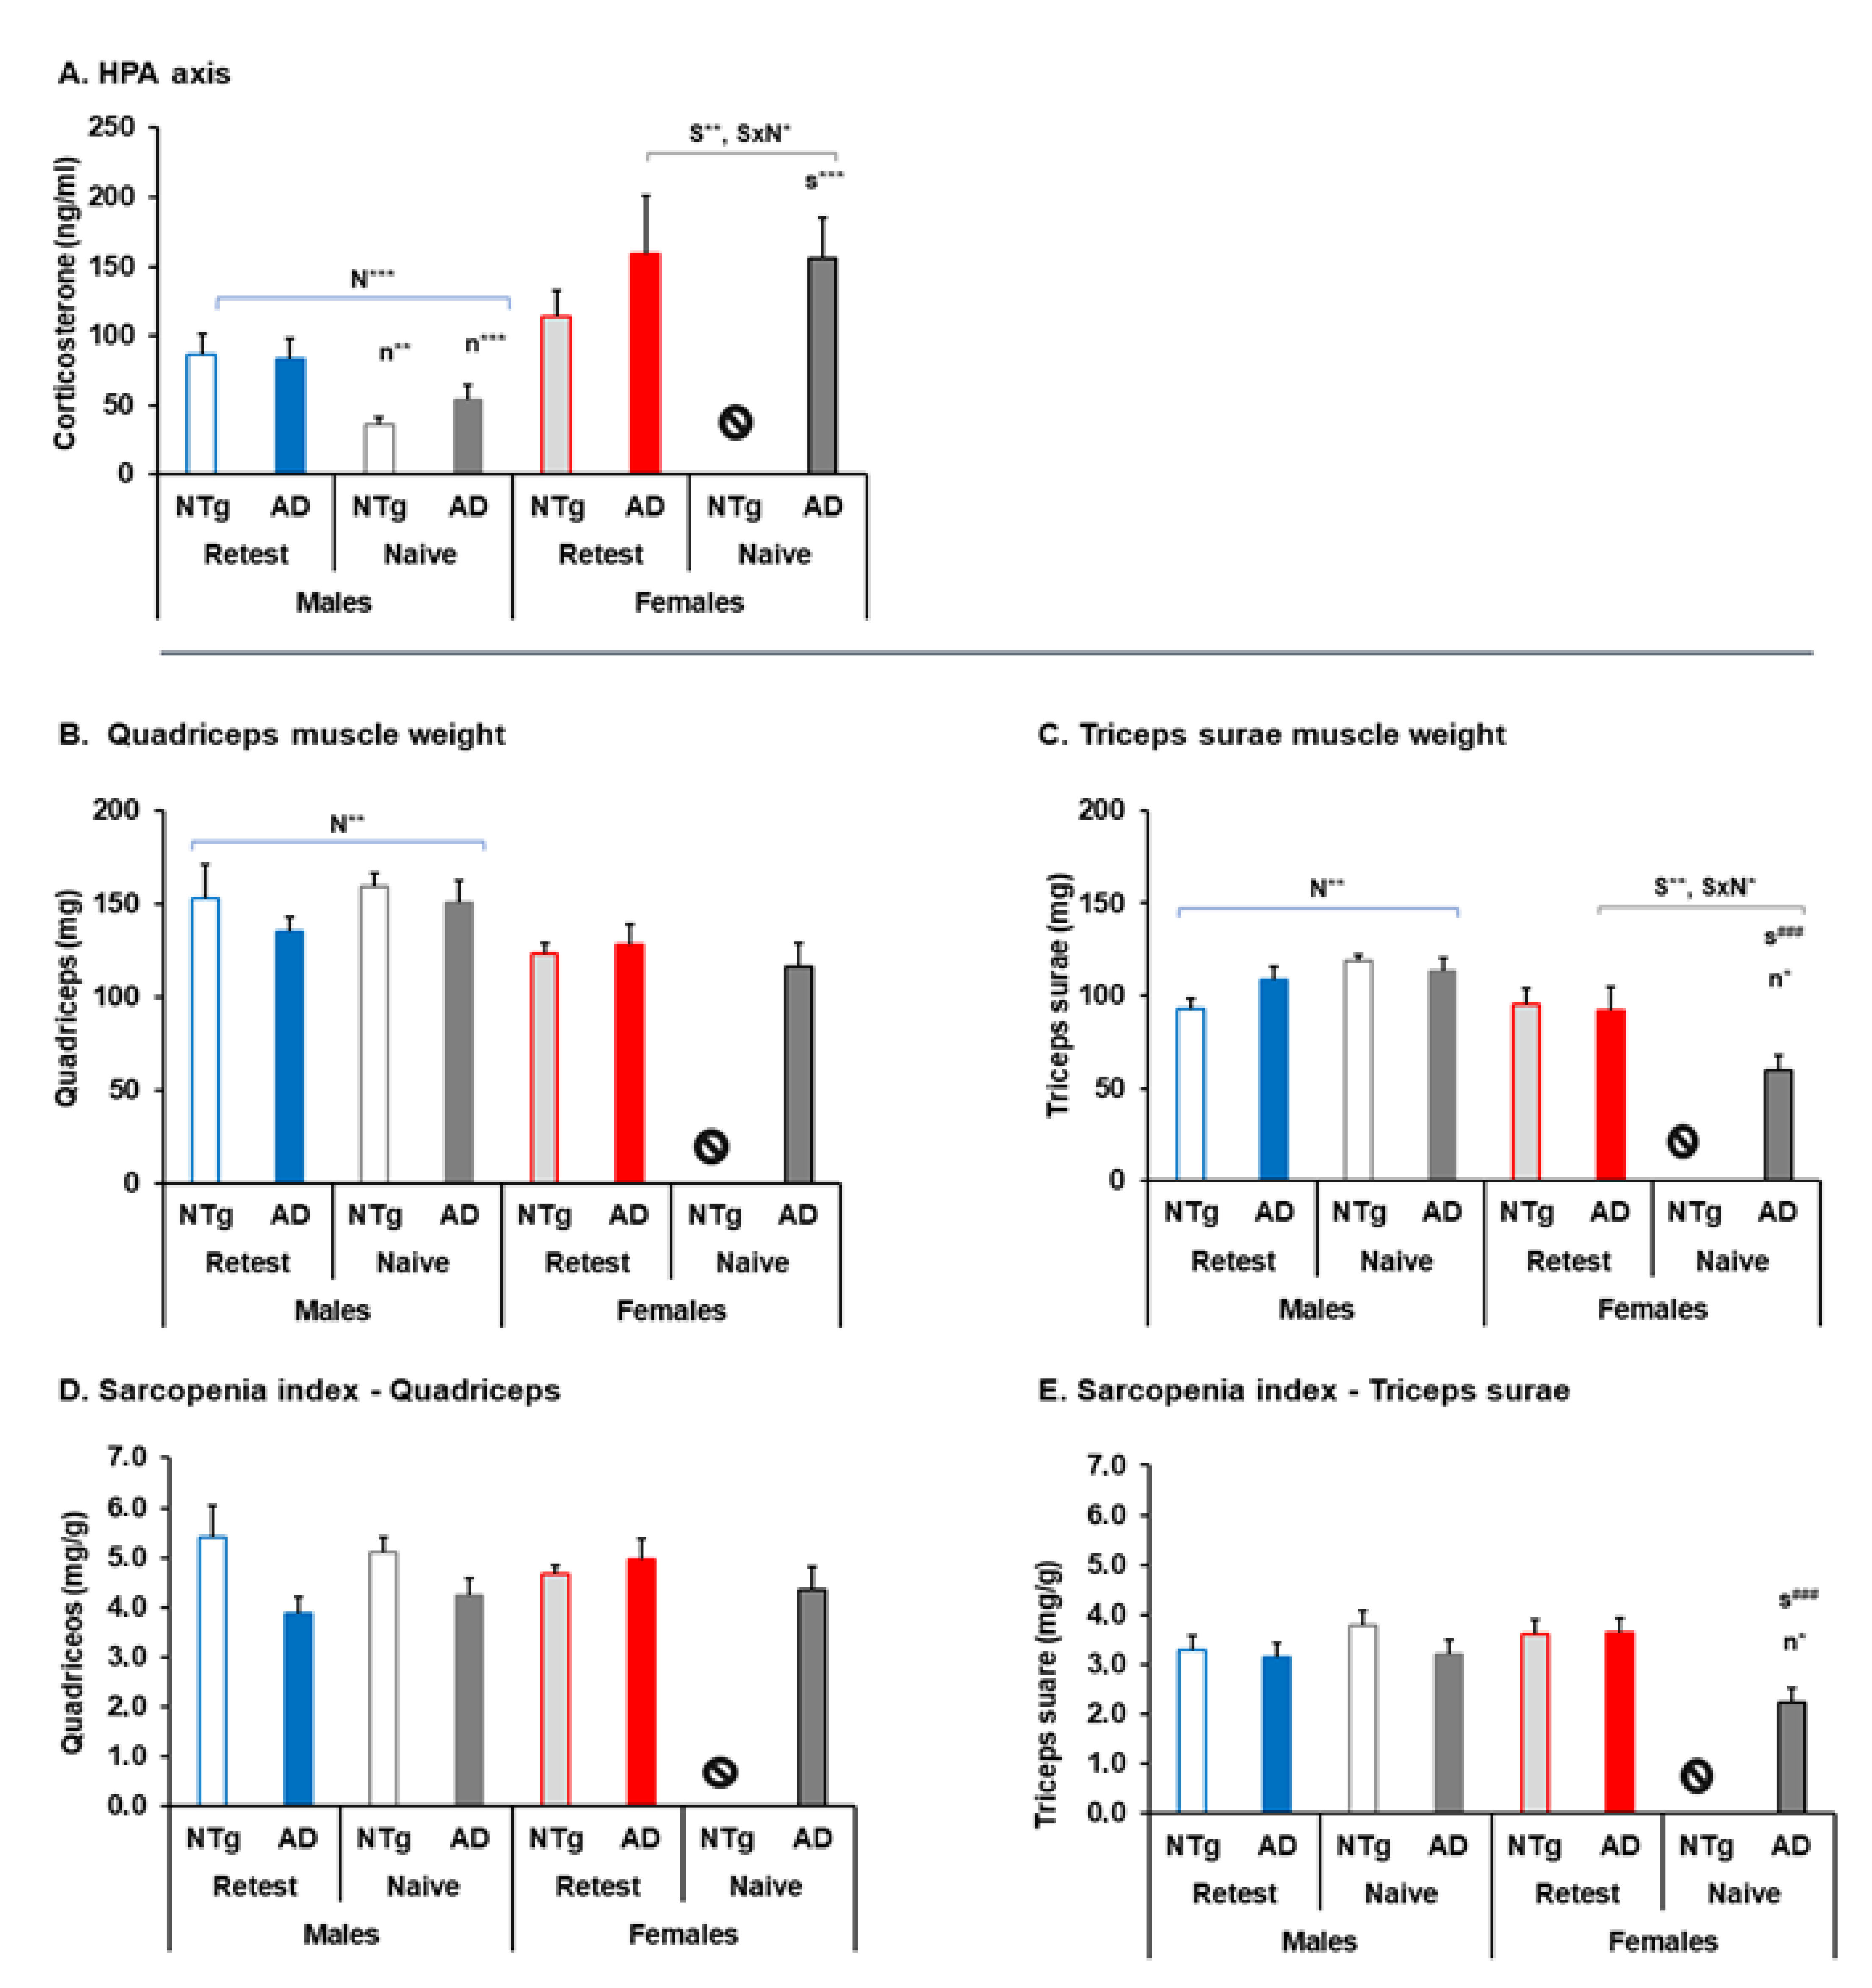
| HPA axis | 🡅 3xTg-AD re-test at 16 m 🡅 Naïve females at 16 m | 🡇 Naïve Re-test males at 16 m 🡅 Naïve females at 16 m | ||
| Sarcopenia index | 🡇 Triceps surae and sarcopenia index naïve 3xTg-AD females | 🡅 Quadriceps and triceps sura muscles naïve males Re-test at 16 m. 🡇 Triceps surae and sarcopenia index naïve 3xTg-AD females re-test females at 16 m | ||
| Survival | High mortality, mostly among NTg female mice, rescued in longitudinal designs | |||
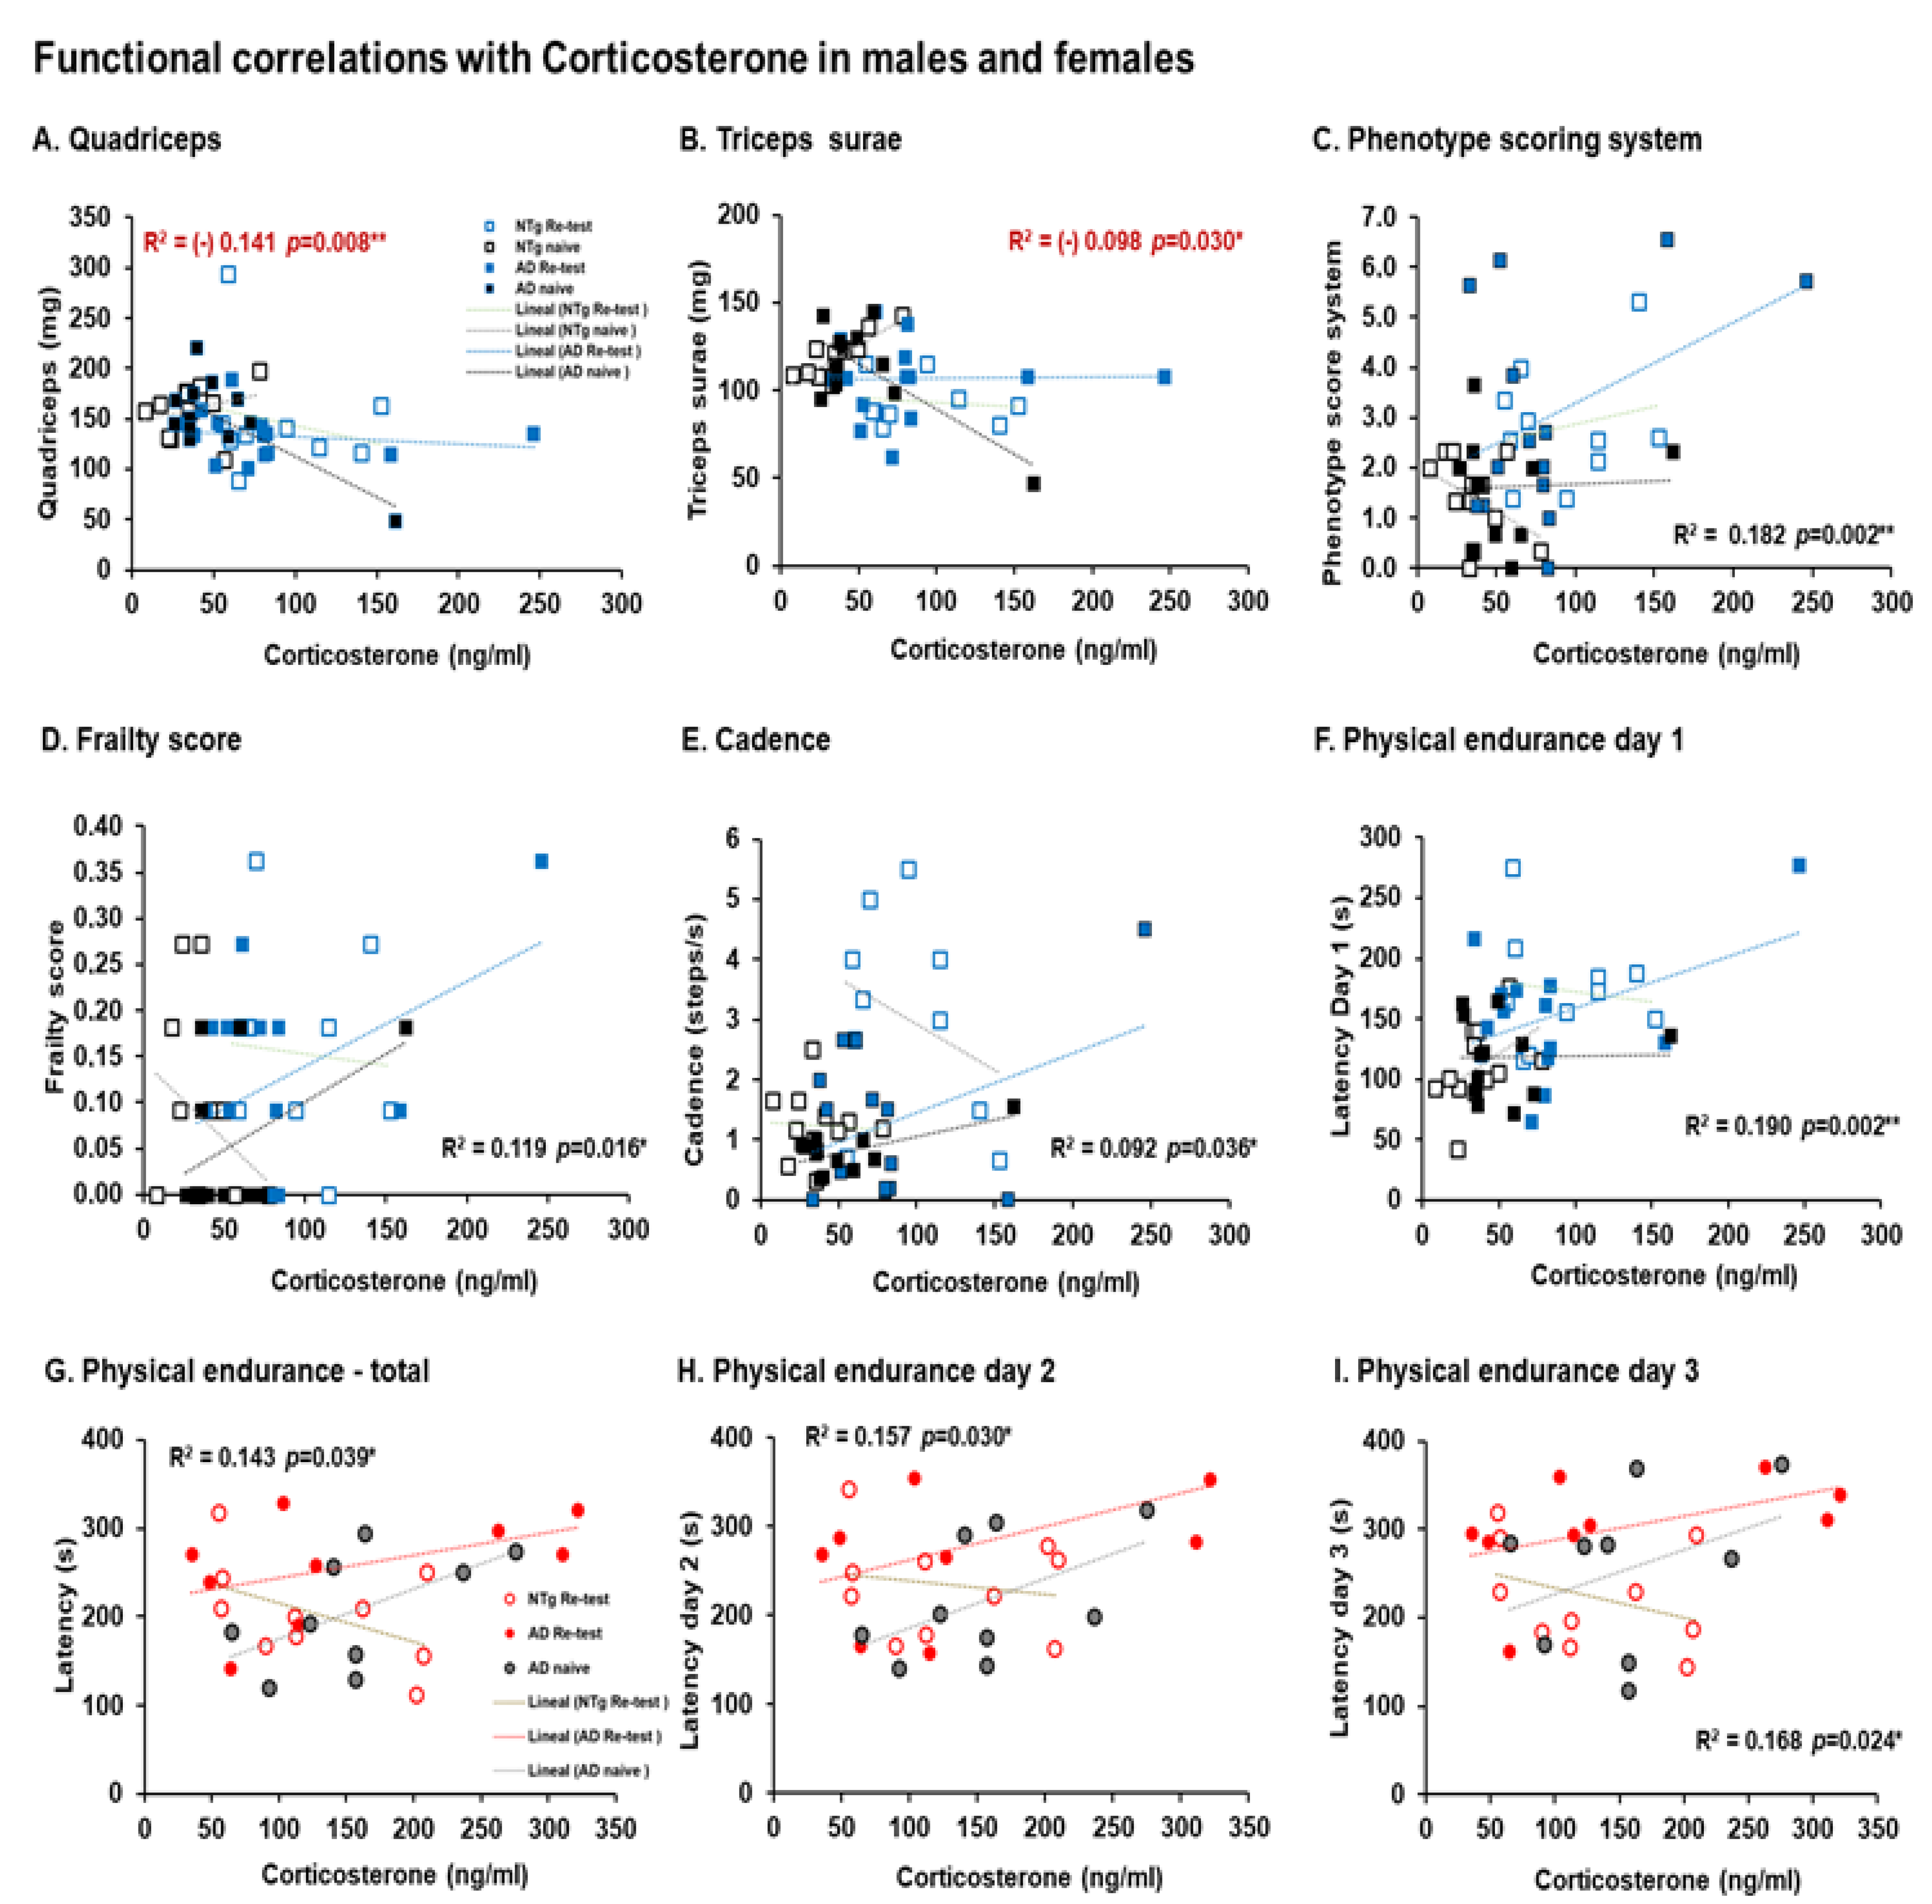
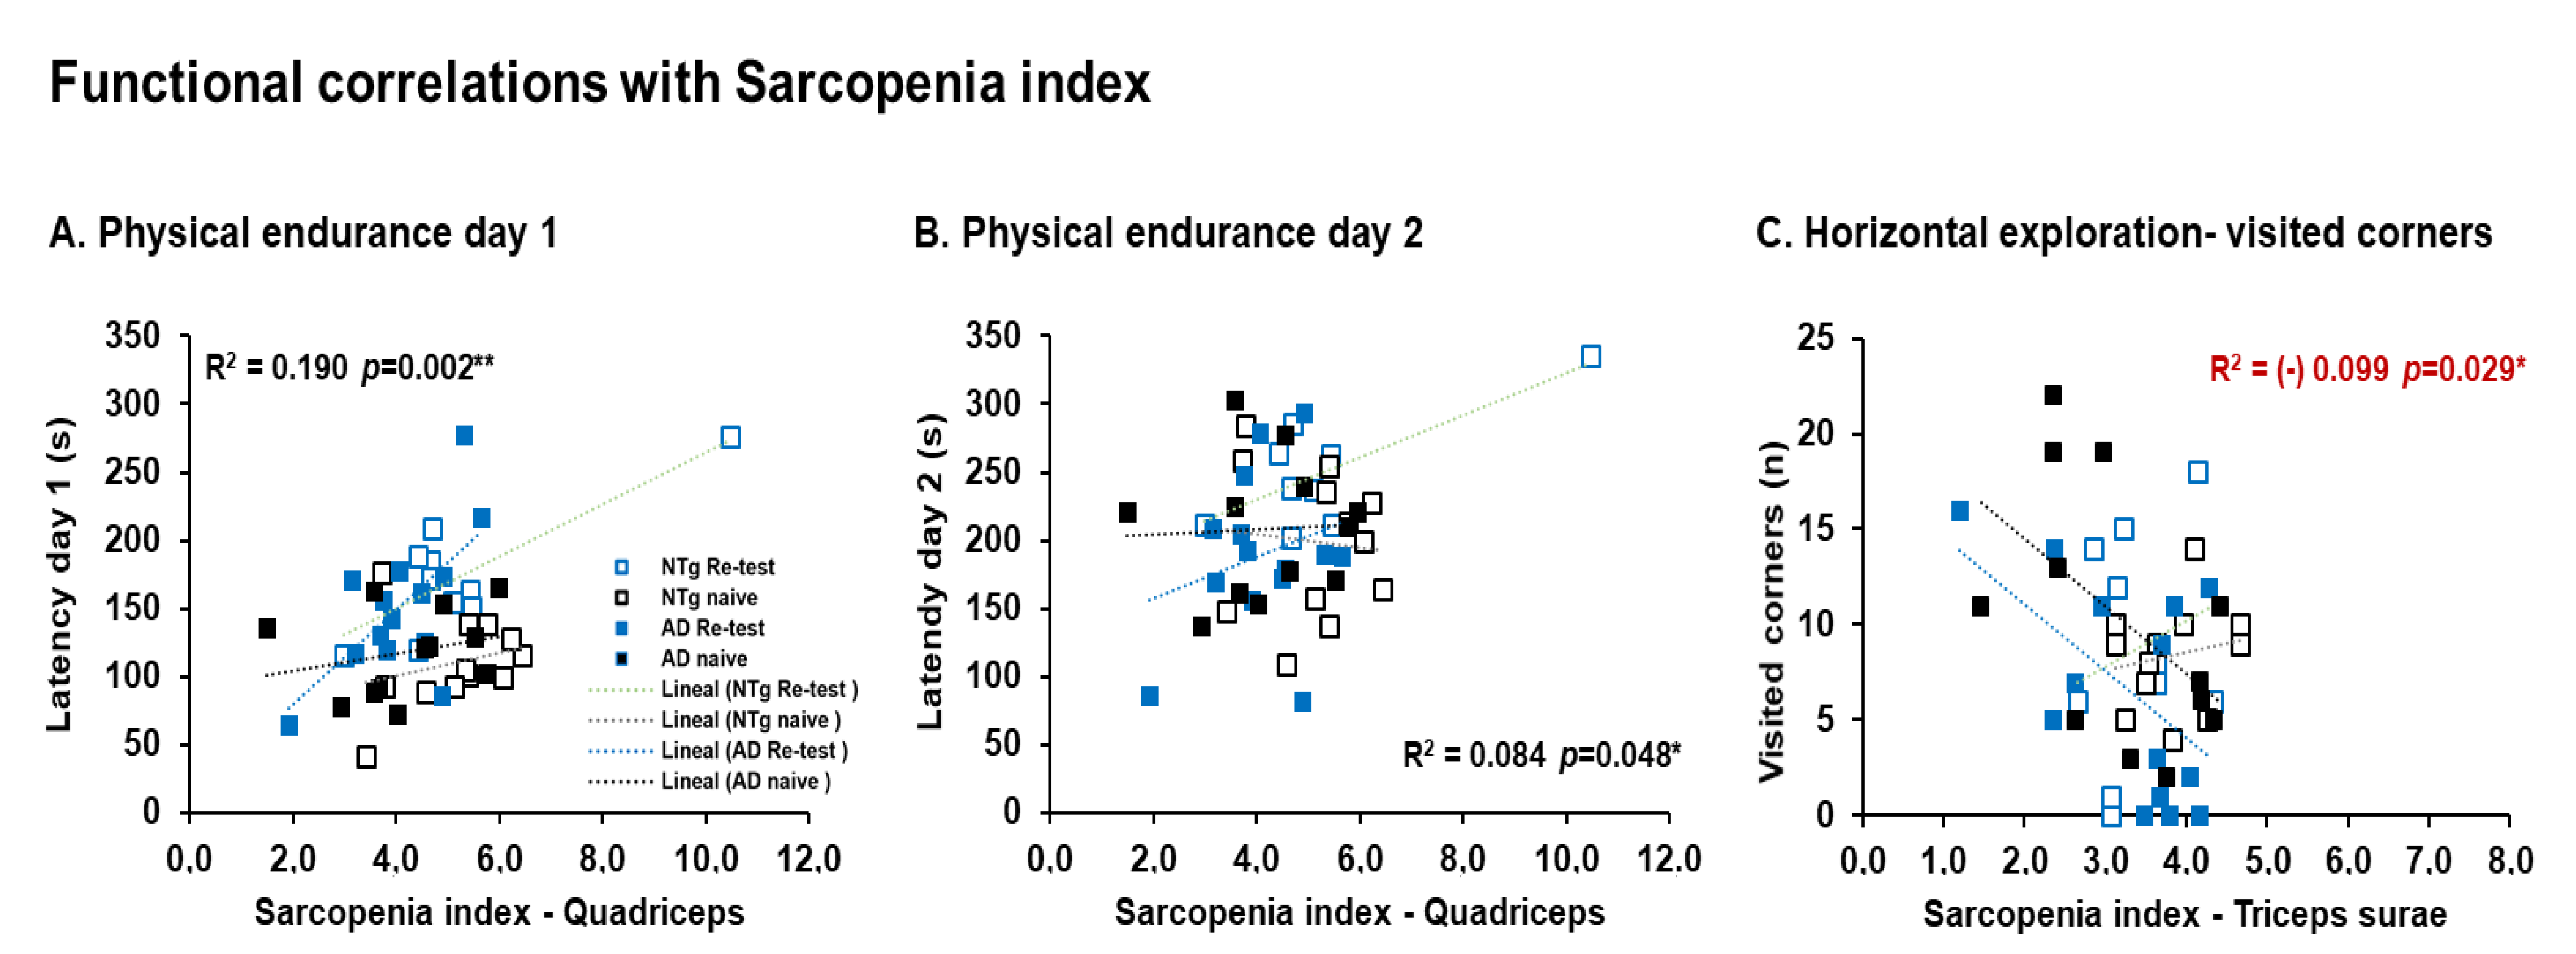
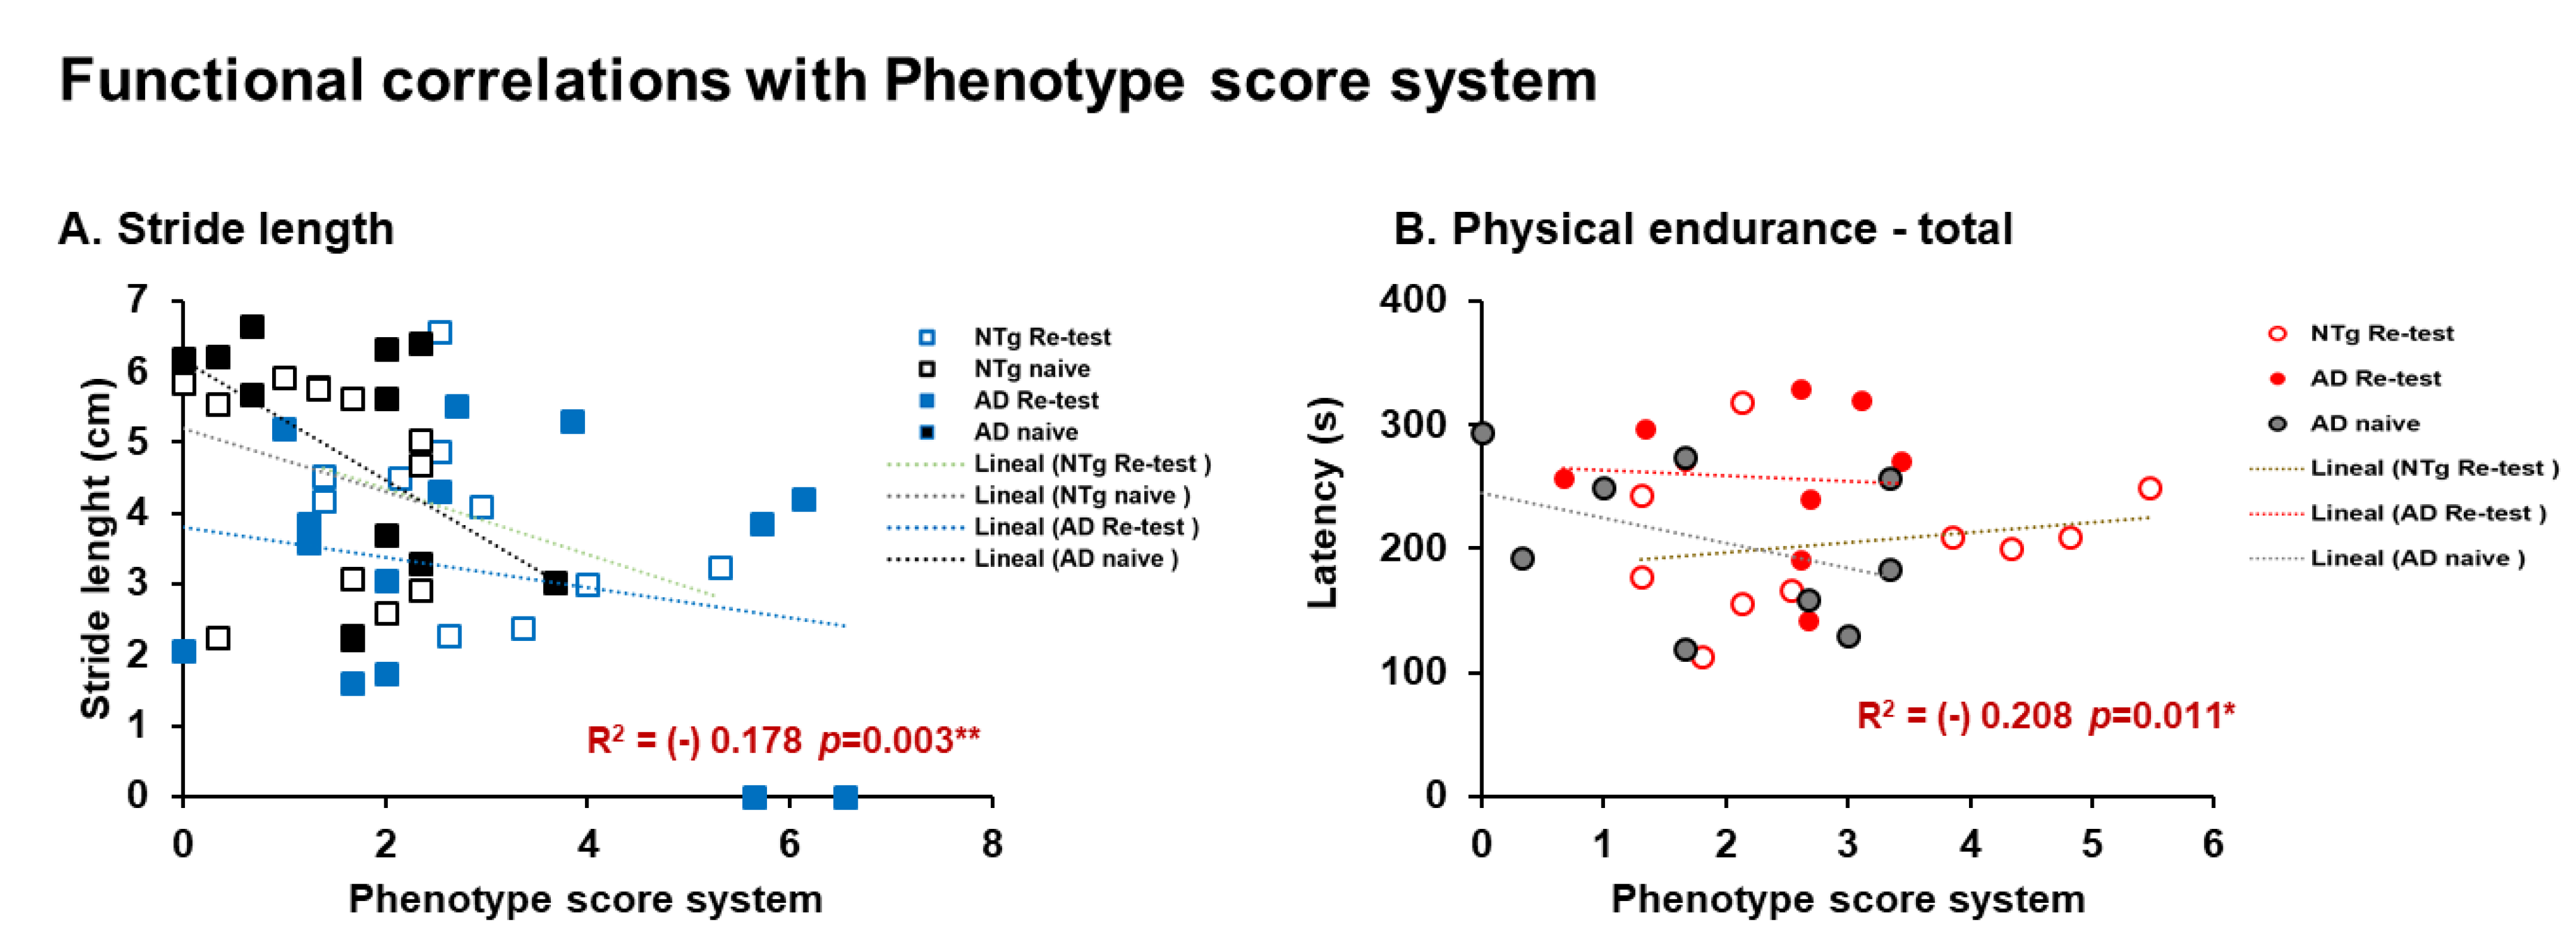
| Correlation’s interactions | In males, negative correlations between corticosterone and quadriceps, triceps surae; and positive correlations between corticosterone and phenotype score system, frailty score, cadence, and physical endurance Day 1. Females, positives correlated between corticosterone and physical endurance-total, physical endurance Days 2 and 3. Positive correlations in males were detected between sarcopenia index-quadriceps and physical endurance on Days 1 and 2. In females, negative correlations were detected between sarcopenia index–triceps and horizontal activity. Negative correlations in males were identified between phenotype score system and stride length, and in females’ phenotype score system and physical endurance—total. | |||
Publisher’s Note: MDPI stays neutral with regard to jurisdictional claims in published maps and institutional affiliations. |
© 2022 by the authors. Licensee MDPI, Basel, Switzerland. This article is an open access article distributed under the terms and conditions of the Creative Commons Attribution (CC BY) license (https://creativecommons.org/licenses/by/4.0/).
Share and Cite
Castillo-Mariqueo, L.; Giménez-Llort, L. Impact of Behavioral Assessment and Re-Test as Functional Trainings That Modify Survival, Anxiety and Functional Profile (Physical Endurance and Motor Learning) of Old Male and Female 3xTg-AD Mice and NTg Mice with Normal Aging. Biomedicines 2022, 10, 973. https://doi.org/10.3390/biomedicines10050973
Castillo-Mariqueo L, Giménez-Llort L. Impact of Behavioral Assessment and Re-Test as Functional Trainings That Modify Survival, Anxiety and Functional Profile (Physical Endurance and Motor Learning) of Old Male and Female 3xTg-AD Mice and NTg Mice with Normal Aging. Biomedicines. 2022; 10(5):973. https://doi.org/10.3390/biomedicines10050973
Chicago/Turabian StyleCastillo-Mariqueo, Lidia, and Lydia Giménez-Llort. 2022. "Impact of Behavioral Assessment and Re-Test as Functional Trainings That Modify Survival, Anxiety and Functional Profile (Physical Endurance and Motor Learning) of Old Male and Female 3xTg-AD Mice and NTg Mice with Normal Aging" Biomedicines 10, no. 5: 973. https://doi.org/10.3390/biomedicines10050973