
Prognostic Value of Mid-Regional Proadrenomedullin Sampled at Presentation and after 72 Hours in Septic Patients Presenting to the Emergency Department: An Observational Two-Center Study

 ,
,  , , , , , , and
Abstract
:1. Background
2. Methods
2.1. Study Design
2.2. Inclusion and Exclusion Criteria
2.3. Outcome and Study Plan
2.4. Clinical Management
2.5. Biomarker Measurement
2.6. Case Adjudication
2.7. Sample Size Calculation
2.8. Statistical Analysis
3. Results
3.1. Patient Characteristics
3.2. Survival Analysis
3.3. Subgroup Analysis—Septic Shock
3.4. Subgroup Analysis—Pulmonary Infective Focus
4. Discussion
5. Conclusions
Supplementary Materials
Author Contributions
Funding
Institutional Review Board Statement
Informed Consent Statement
Data Availability Statement
Conflicts of Interest
References
- Singer, M.; Deutschman, C.S.; Seymour, C.W.; Shankar-Hari, M.; Annane, D.; Bauer, M.; Bellomo, R.; Bernard, G.R.; Chiche, J.D.; Coopersmith, C.M.; et al. The Third International Consensus Definitions for Sepsis and Septic Shock (Sepsis-3). JAMA 2016, 315, 801–810. [Google Scholar] [CrossRef] [PubMed]
- Evans, L.; Rhodes, A.; Alhazzani, W.; Antonelli, M.; Coopersmith, C.M.; French, C.; Machado, F.R.; McIntyre, L.; Ostermann, M.; Prescott, H.C.; et al. Surviving Sepsis Campaign: International Guidelines for Management of Sepsis and Septic Shock 2021. Crit. Care Med. 2021, 49, e1063–e1143. [Google Scholar] [CrossRef] [PubMed]
- Cheung, B.M.; Tang, F. Adrenomedullin: Exciting new horizons. Recent Pat. Endocr. Metab. Immune Drug Discov. 2012, 6, 4–17. [Google Scholar] [CrossRef] [PubMed]
- Krintus, M.; Kozinski, M.; Braga, F.; Kubica, J.; Sypniewska, G.; Panteghini, M. Plasma midregional proadrenomedullin (MR-proADM) concentrations and their biological determinants in a reference population. Clin. Chem. Lab. Med. 2018, 56, 1161–1168. [Google Scholar] [CrossRef] [PubMed]
- Andaluz-Ojeda, D.; Nguyen, H.B.; Meunier-Beillard, N.; Cicuendez, R.; Quenot, J.P.; Calvo, D.; Dargent, A.; Zarca, E.; Andres, C.; Nogales, L.; et al. Superior accuracy of mid-regional proadrenomedullin for mortality prediction in sepsis with varying levels of illness severity. Ann. Intensive Care 2017, 7, 15. [Google Scholar] [CrossRef] [PubMed] [Green Version]
- Elke, G.; Bloos, F.; Wilson, D.C.; Brunkhorst, F.M.; Briegel, J.; Reinhart, K.; Loeffler, M.; Kluge, S.; Nierhaus, A.; Jaschinski, U.; et al. The use of mid-regional proadrenomedullin to identify disease severity and treatment response to sepsis—A secondary analysis of a large randomised controlled trial. Crit. Care 2018, 22, 79. [Google Scholar] [CrossRef] [Green Version]
- Saeed, K.; Wilson, D.C.; Bloos, F.; Schuetz, P.; van der Does, Y.; Melander, O.; Hausfater, P.; Legramante, J.M.; Claessens, Y.E.; Amin, D.; et al. The early identification of disease progression in patients with suspected infection presenting to the emergency department: A multi-centre derivation and validation study. Crit. Care 2019, 23, 40. [Google Scholar] [CrossRef] [PubMed] [Green Version]
- Kakareko, K.; Rydzewska-Rosolowska, A.; Rygasiewicz, K.; Siemiatkowski, A.; Koc-Zorawska, E.; Zbroch, E.; Hryszko, T. Prognostic value of midregional proadrenomedullin in critically ill patients. Pol. Arch. Intern. Med. 2019, 129, 673–678. [Google Scholar] [CrossRef] [PubMed]
- Legramante, J.M.; Mastropasqua, M.; Susi, B.; Porzio, O.; Mazza, M.; Miranda Agrippino, G.; D’Agostini, C.; Brandi, A.; Giovagnoli, G.; Di Lecce, V.N.; et al. Prognostic performance of MR-pro-adrenomedullin in patients with community acquired pneumonia in the Emergency Department compared to clinical severity scores PSI and CURB. PLoS ONE 2017, 12, e0187702. [Google Scholar] [CrossRef] [PubMed] [Green Version]
- Montrucchio, G.; Sales, G.; Rumbolo, F.; Palmesino, F.; Fanelli, V.; Urbino, R.; Filippini, C.; Mengozzi, G.; Brazzi, L. Effectiveness of mid-regional pro-adrenomedullin (MR-proADM) as prognostic marker in COVID-19 critically ill patients: An observational prospective study. PLoS ONE 2021, 16, e0246771. [Google Scholar] [CrossRef] [PubMed]
- Hartmann, O.; Schuetz, P.; Albrich, W.C.; Anker, S.D.; Mueller, B.; Schmidt, T. Time-dependent Cox regression: Serial measurement of the cardiovascular biomarker proadrenomedullin improves survival prediction in patients with lower respiratory tract infection. Int. J. Cardiol. 2012, 161, 166–173. [Google Scholar] [CrossRef]
- Patnaik, R.; Azim, A.; Mishra, P. Should serial monitoring of procalcitonin be done routinely in critically ill patients of ICU: A systematic review and meta-analysis. J. Anaesthesiol. Clin. Pharmacol. 2020, 36, 458–464. [Google Scholar] [CrossRef]
- Mueller, A.A.; Tamura, T.; Crowley, C.P.; DeGrado, J.R.; Haider, H.; Jezmir, J.L.; Keras, G.; Penn, E.H.; Massaro, A.F.; Kim, E.Y. Inflammatory Biomarker Trends Predict Respiratory Decline in COVID-19 Patients. Cell Rep. Med. 2020, 1, 100144. [Google Scholar] [CrossRef] [PubMed]
- Nuzzi, V.; Merlo, M.; Specchia, C.; Lombardi, C.M.; Carubelli, V.; Iorio, A.; Inciardi, R.M.; Bellasi, A.; Canale, C.; Camporotondo, R.; et al. The prognostic value of serial troponin measurements in patients admitted for COVID-19. ESC Heart Fail. 2021, 8, 3504–3511. [Google Scholar] [CrossRef] [PubMed]
- Vincent, J.L.; Moreno, R.; Takala, J.; Willatts, S.; De Mendonça, A.; Bruining, H.; Reinhart, C.K.; Suter, P.M.; Thijs, L.G. The SOFA (Sepsis-related Organ Failure Assessment) score to describe organ dysfunction/failure. On behalf of the Working Group on Sepsis-Related Problems of the European Society of Intensive Care Medicine. Intensive Care Med. 1996, 22, 707–710. [Google Scholar] [CrossRef] [PubMed]
- Knaus, W.A.; Draper, E.A.; Wagner, D.P.; Zimmerman, J.E. APACHE II: A severity of disease classification system. Crit. Care Med. 1985, 13, 818–829. [Google Scholar] [CrossRef] [PubMed]
- Plachouras, D.; Lepape, A.; Suetens, C. ECDC definitions and methods for the surveillance of healthcare-associated infections in intensive care units. Intensive Care Med. 2018, 44, 2216–2218. [Google Scholar] [CrossRef] [PubMed] [Green Version]
- Gauthier, J.; Wu, Q.V.; Gooley, T.A. Cubic splines to model relationships between continuous variables and outcomes: A guide for clinicians. Bone Marrow Transplant. 2020, 55, 675–680. [Google Scholar] [CrossRef] [PubMed] [Green Version]
- Harrel, F.E. Regression Modeling Strategies: With Applications, to Linear Models, Logistic and Ordinal Regression, and Survival Analysis, 2nd ed.; Springer: Cham, Switzerland, 2015. [Google Scholar]
- Statistically Efficient Ways to Quantify Added Predictive Value of New Measurements. 2020. Available online: https://www.fharrell.com/post/addvalue/ (accessed on 4 November 2021).
- Zhou, X.; Obuchowski, N.; McClish, D. Statistical Methods in Diagnostic Medicine, 2nd ed.; John Wiley & Sons: Hoboken, NJ, USA, 2011. [Google Scholar]


| Total (N = 147) | Survivors at 28 Days (N = 128) | Non-Survivors at 28 Days (N = 19) | p-Value | |
|---|---|---|---|---|
| Age (years) | 69 ± 16 | 67 ± 16 | 78 ± 10 | 0.001 |
| Sex (F) | 59 (40.1%) | 50 (39.1%) | 9 (47.4%) | 0.62 |
| Pre-existing comorbidities | ||||
| Hypertension | 89 (60.5%) | 75 (58.6%) | 14 (73.7%) | 0.21 |
| Smoking | 31 (21.1%) | 25 (19.5%) | 6 (31.6%) | 0.45 |
| CAD | 30 (20.4%) | 25 (19.5%) | 5 (26.3%) | 0.49 |
| Recent (<3 months) hospital admission | 31 (21.1%) | 28 (21.9%) | 3 (15.8%) | 0.54 |
| Chronic steroids | 32 (21.8%) | 27 (21.1%) | 5 (26.3%) | 0.61 |
| Immunosuppression | 22 (15.0%) | 18 (14.2%) | 4 (23.5%) | 0.57 |
| HIV | 0 (0%) | - | - | - |
| Active solid cancer | 28 (19.0%) | 21 (16.4%) | 7 (36.8%) | 0.03 |
| Active hematologic malignancy | 16 (10.9%) | 13 (10.2%) | 3 (15.8%) | 0.44 |
| Chronic kidney disease | 41 (27.9%) | 37 (28.9%) | 4 (21.1%) | 0.59 |
| Diabetes | 34 (23.1%) | 33 (25.8%) | 1 (5.3%) | 0.08 |
| COPD | 30 (20.4%) | 24 (18.8%) | 6 (31.6%) | 0.20 |
| NYHA IV heart failure | 5 (3.4%) | 5 (3.9%) | 0 (0%) | 1.0 |
| Liver cirrhosis | 5 (3.4%) | 5 (3.9%) | 0 (0%) | 1.0 |
| Recent (<3 months) trauma | 6 (4.1%) | 6 (4.7%) | 0 (0%) | 1.0 |
| Recent (<3 months) burns | 0 (0%) | - | - | - |
| Vital parameters | ||||
| Blood pressure | ||||
| SBP (mmHg) | 112 ± 26 | 114 ± 27 | 99 ± 19 | 0.017 |
| DBP (mmHg) | 63 ± 15 | 65 ± 15 | 56 ± 11 | 0.005 |
| MAP (mmHg) | 80 ± 17 | 81 ± 18 | 70 ± 12 | 0.006 |
| Heart rate (bpm) | 99 ± 20 | 98 ± 19 | 106 ± 23 | 0.04 |
| Respiratory rate (bpm) | 20 ± 6 | 19 ± 6 | 24 ± 7 | 0.03 |
| SpO2 (%) | 93 ± 5 | 93 ± 5 | 92 ± 7 | 0.40 |
| Temperature (°C) | 38.0 ± 1.6 | 38.2 ± 1.2 | 36.5 ± 2.6 | 0.001 |
| AVPU scale | ||||
| Awake | 112 (76.2%) | 101 (78.9%) | 11 (57.9%) | 0.05 |
| Vocal | 10 (6.8%) | 9 (7.0%) | 1 (5.3%) | 0.8 |
| Pain | 5 (3.4%) | 3 (2.3%) | 2 (10.5%) | 0.13 |
| Unresponsive | 20 (13.6%) | 15 (11.7%) | 5 (26.3%) | 0.14 |
| Glasgow Coma Scale (GCS) | 13 ± 4 | 13 ± 4 | 11 ± 5 | 0.05 |
| Laboratory parameters | ||||
| P/F ratio | 286 ± 97 Missing: 16 (10.9%) | 293 ± 93 | 238 ± 111 | 0.06 |
| White blood cells (×109) | 14.69 ± 9.40 | 14.35 ± 9.00 | 16.92 ± 11.82 | 0.52 |
| Hemoglobin (g/dL) | 12.1 ± 2.4 | 12.4 ± 2.3 | 10.5 ± 2.3 | 0.002 |
| Hematocrit (%) | 37.2 ± 7.0 | 37.7 ± 6.7 | 33.6 ± 8.0 | 0.01 |
| Platelets (×103) | 214 ± 128 | 212 ± 125 | 228 ± 145 | 0.55 |
| Creatinine (mg/dL) | 2.0 ± 1.9 | 1.91 ± 1.6 | 2.70 ± 3.22 | 0.27 |
| Bilirubin (mg/dL) | 1.1 ± 0.9 | 1.1 ± 0.8 | 1.2 ± 1.0 | 0.98 |
| Final diagnosis | ||||
| Sepsis-3, sepsis | 109 (74.1%) | 98 (85.2%) | 11 (57.9%) | 0.10 |
| Sepsis-3, septic shock | 38 (25.9%) | 30 (23.4%) | 8 (42.1%) | 0.10 |
| Microbiology | ||||
| Positive cultures | 75 (51.0%) | 66 (52.4%) | 9 (47.4%) | 0.68 |
| Gram positive | 25 (17.0%) | 23 (18.0%) | 2 (11.1%) | 0.53 |
| Gram negative | 29 (19.7%) | 25 (19.5%) | 4 (22.2%) | 1.0 |
| Fungal | 3 (2.0%) | 3 (2.3%) | 0 (0%) | 1.0 |
| Multiple microorganisms | 17 (11.6%) | 15 (11.7%) | 2 (11.1%) | 1.0 |
| Origin of infection | ||||
| Lungs | 57 (38.8%) | 47 (36.7%) | 10 (52.6%) | 0.18 |
| Urinary tract | 35 (23.8%) | 33 (25.8%) | 2 (10.5%) | 0.25 |
| Soft tissue | 7 (4.8%) | 7 (5.5%) | 0 (0%) | 0.60 |
| Gastrointestinal | 21 (14.3%) | 18 (14.1%) | 3 (15.8%) | 0.74 |
| Joints | 5 (3.4%) | 4 (3.1%) | 1 (5.3%) | 0.50 |
| Heart valves | 1 (0.7%) | 1 (0.8%) | 0 (0%) | 1.0 |
| Central venous catheter associated/Bacteriemia | 9 (6.1%) | 8 (6.3%) | 1 (5.3%) | 1.0 |
| Unknown | 15 (10.2%) | 13 (10.2%) | 2 (10.5%) | 1.0 |
| Treatment | ||||
| Antibiotics | ||||
| Any | 147 (100%) | 128 (100%) | 19 (100%) | - |
| Ceftriaxone | 38 (25.9%) | 34 (26.6%) | 4 (21.1%) | 0.78 |
| Piperacillin/Tazobactam | 47 (32.0%) | 40 (31.3%) | 7 (36.8%) | 0.61 |
| Carbapenems | 46 (31.3%) | 40 (31.3%) | 6 (31.6%) | 1 |
| Vancomicin | 26 (17.7%) | 21 (16.4%) | 5 (26.3%) | 0.1 |
| Vasopressors | 38 (25.9%) | 30 (23.4%) | 8 (42.1%) | 0.10 |
| Corticosteroids | 32 (21.8%) | 27 (31.4%) | 5 (55.6%) | 0.56 |
| Conventional oxygen therapy | 28 (19.0%) | 18 (14.1%) | 10 (52.6%) | <0.001 |
| Non-invasive mechanical ventilation | 21 (14.3%) | 14 (10.9%) | 7 (36.8%) | 0.007 |
| Mechanical ventilation | 24 (16.3%) | 17 (13.3%) | 7 (36.8%) | 0.02 |
| Renal replacement therapy | 15 (10.2%) | 11 (8.6%) | 4 (21.1%) | 0.03 |
| Biomarkers at ED presentation | ||||
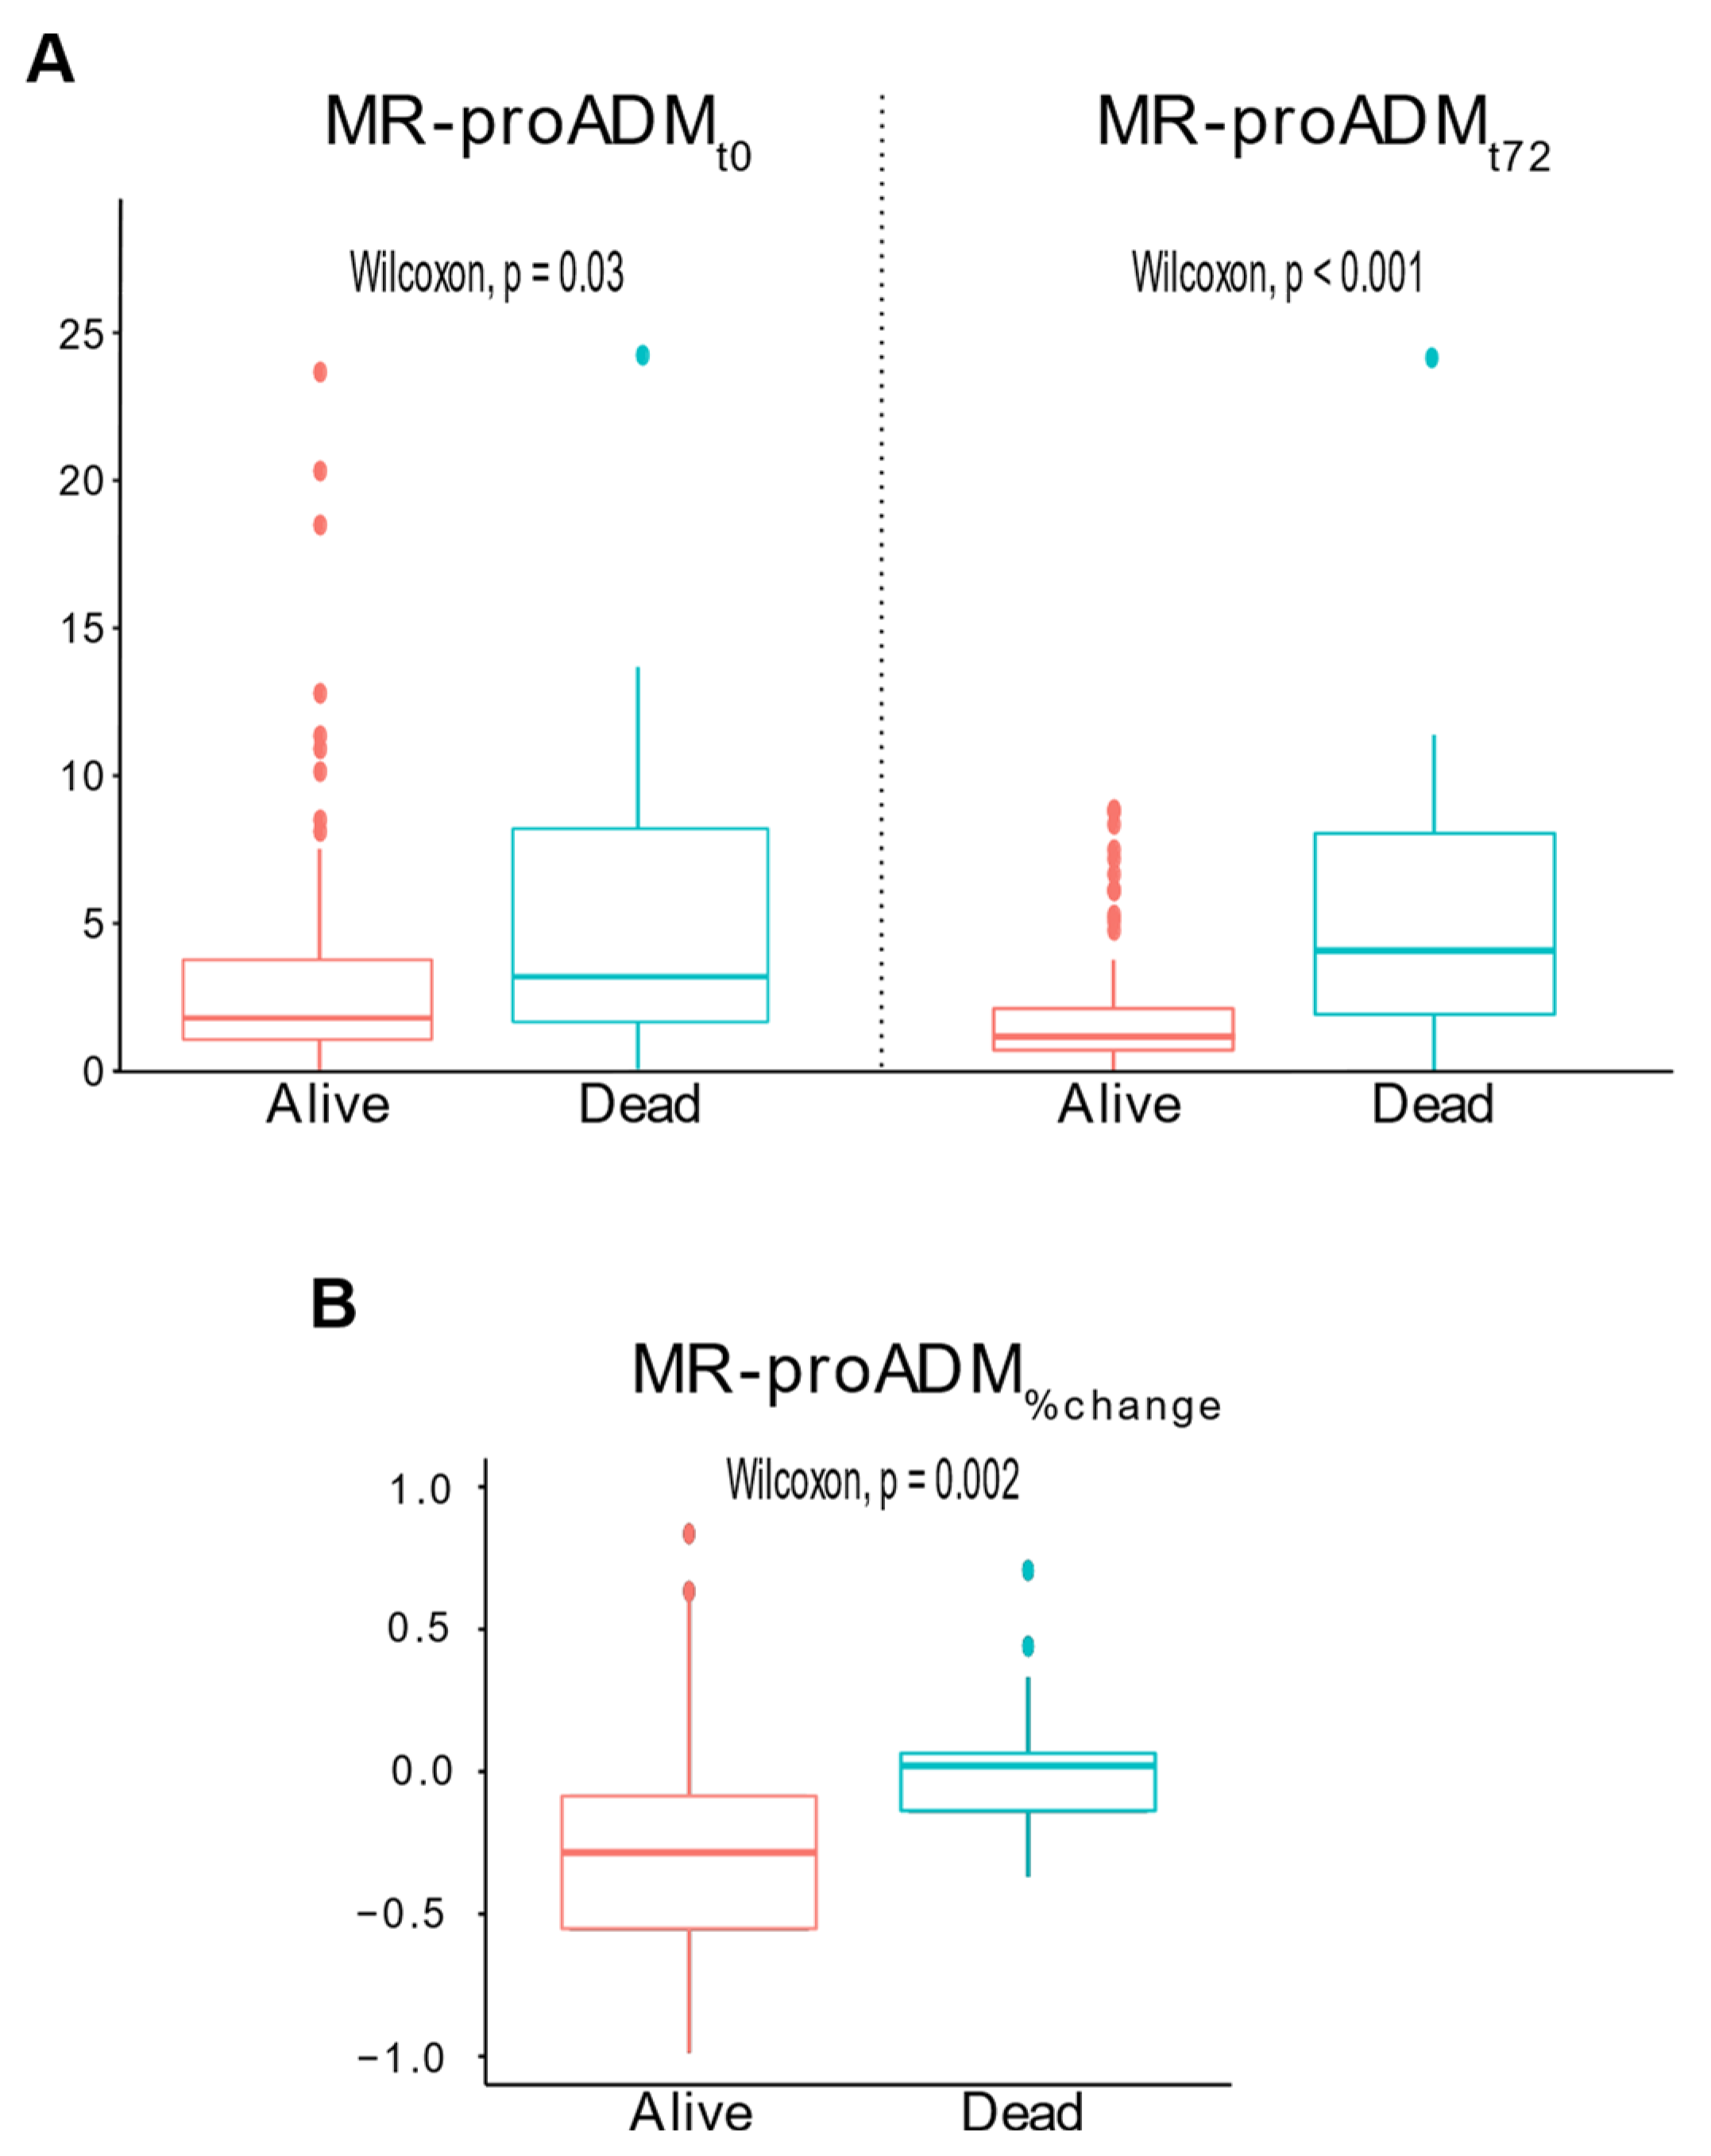
| MR-proADMt0 (nmol/L) | 1.93 (1.10–4.28) | 1.79 (1.07–3.78) | 3.19 (1.36–9.37) | 0.03 |
| PCT (ng/mL) | 2.2 (0.64–12.3) Missing: 8 (5.4%) | 2.0 (0.6–11.3) | 6.9 (0.8–15.3) | 0.31 |
| Lactate (mmol/L) | 2.0 (1.1–3.3) Missing: 32 (21.8%) | 1.9 (1.1–3.3) | 2.7 (1.7–6.3) | 0.05 |
| CRP (mg/L) | 55 (16–192) | 64 (17–197) | 30 (8–98) | 0.12 |
| Biomarkers at 72-h from presentation | ||||
| MR-proADMt72h (nmol/L) | 1.41 (0.84–2.89) Missing: 21 (14.3%) | 1.29 (0.82–2.30) | 4.31 (2.00–8.86) | <0.001 |
| PCT (ng/mL) | 2.3 (0.58–12.2) Missing: 56 (38.1%) | 1.9 (0.6–11.5) | 19.3 (8.1–26.3) | 0.14 |
| Lactate (mmol/L) | 1.4 (0.9–1.8) Missing: 123 (83.7%) | 1.0 (0.9–1.6) | 2.3 (1.6–5.7) | 0.04 |
| CRP (mg/L) | 114 (51–194) Missing: 55 (37.4%) | 111 (54–190) | 196 (33–279) | 0.44 |
| MR-proADM%change | −26% [−53–(−3%)] Missing: 21 (14.3%) | −28% [−55–(−8%)] | 2% (−14–7%) | 0.002 |
| Severity scores at ED presentation | ||||
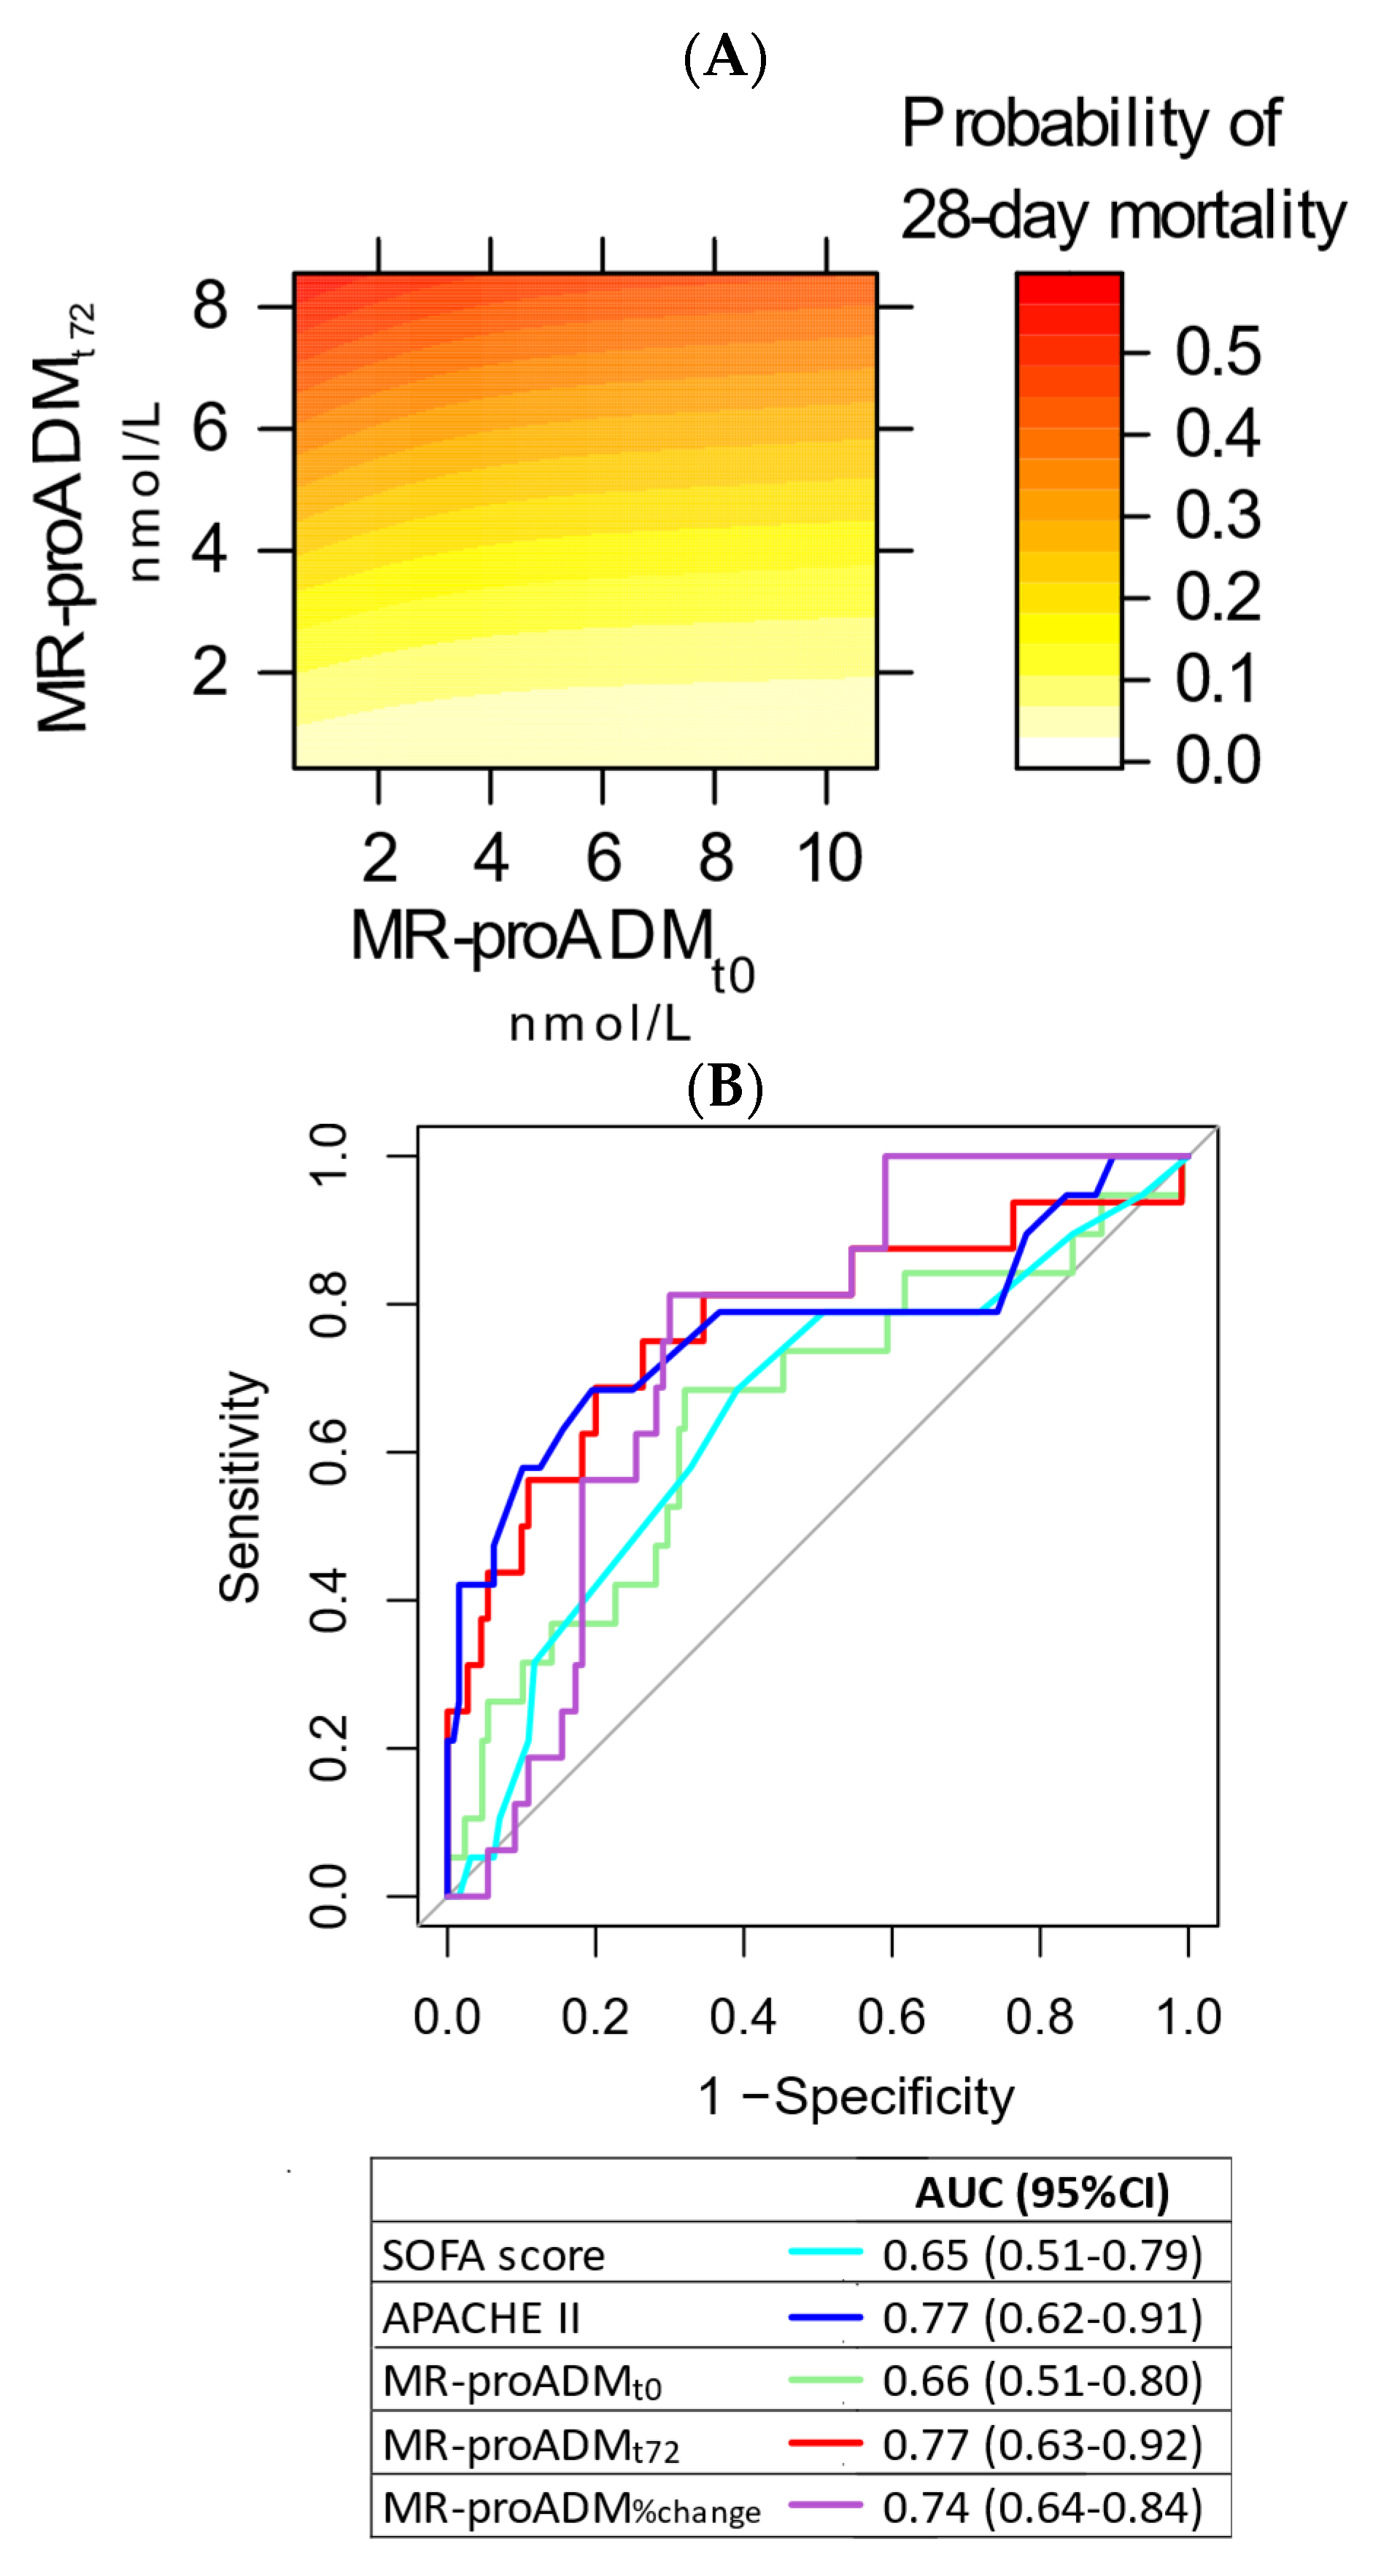
| SOFA score | 4 (2–6) | 4 (2–6) | 6 (4–7) | 0.03 |
| APACHE II | 21 (15–26) | 20 (15–24) | 29 (23–37) | <0.001 |
| Test | Sensitivity (95% CI) | p-Value | Specificity (95% CI) | p-Value | LR+ (95% CI) | p-Value | LR− (95% CI) | p-Value |
|---|---|---|---|---|---|---|---|---|
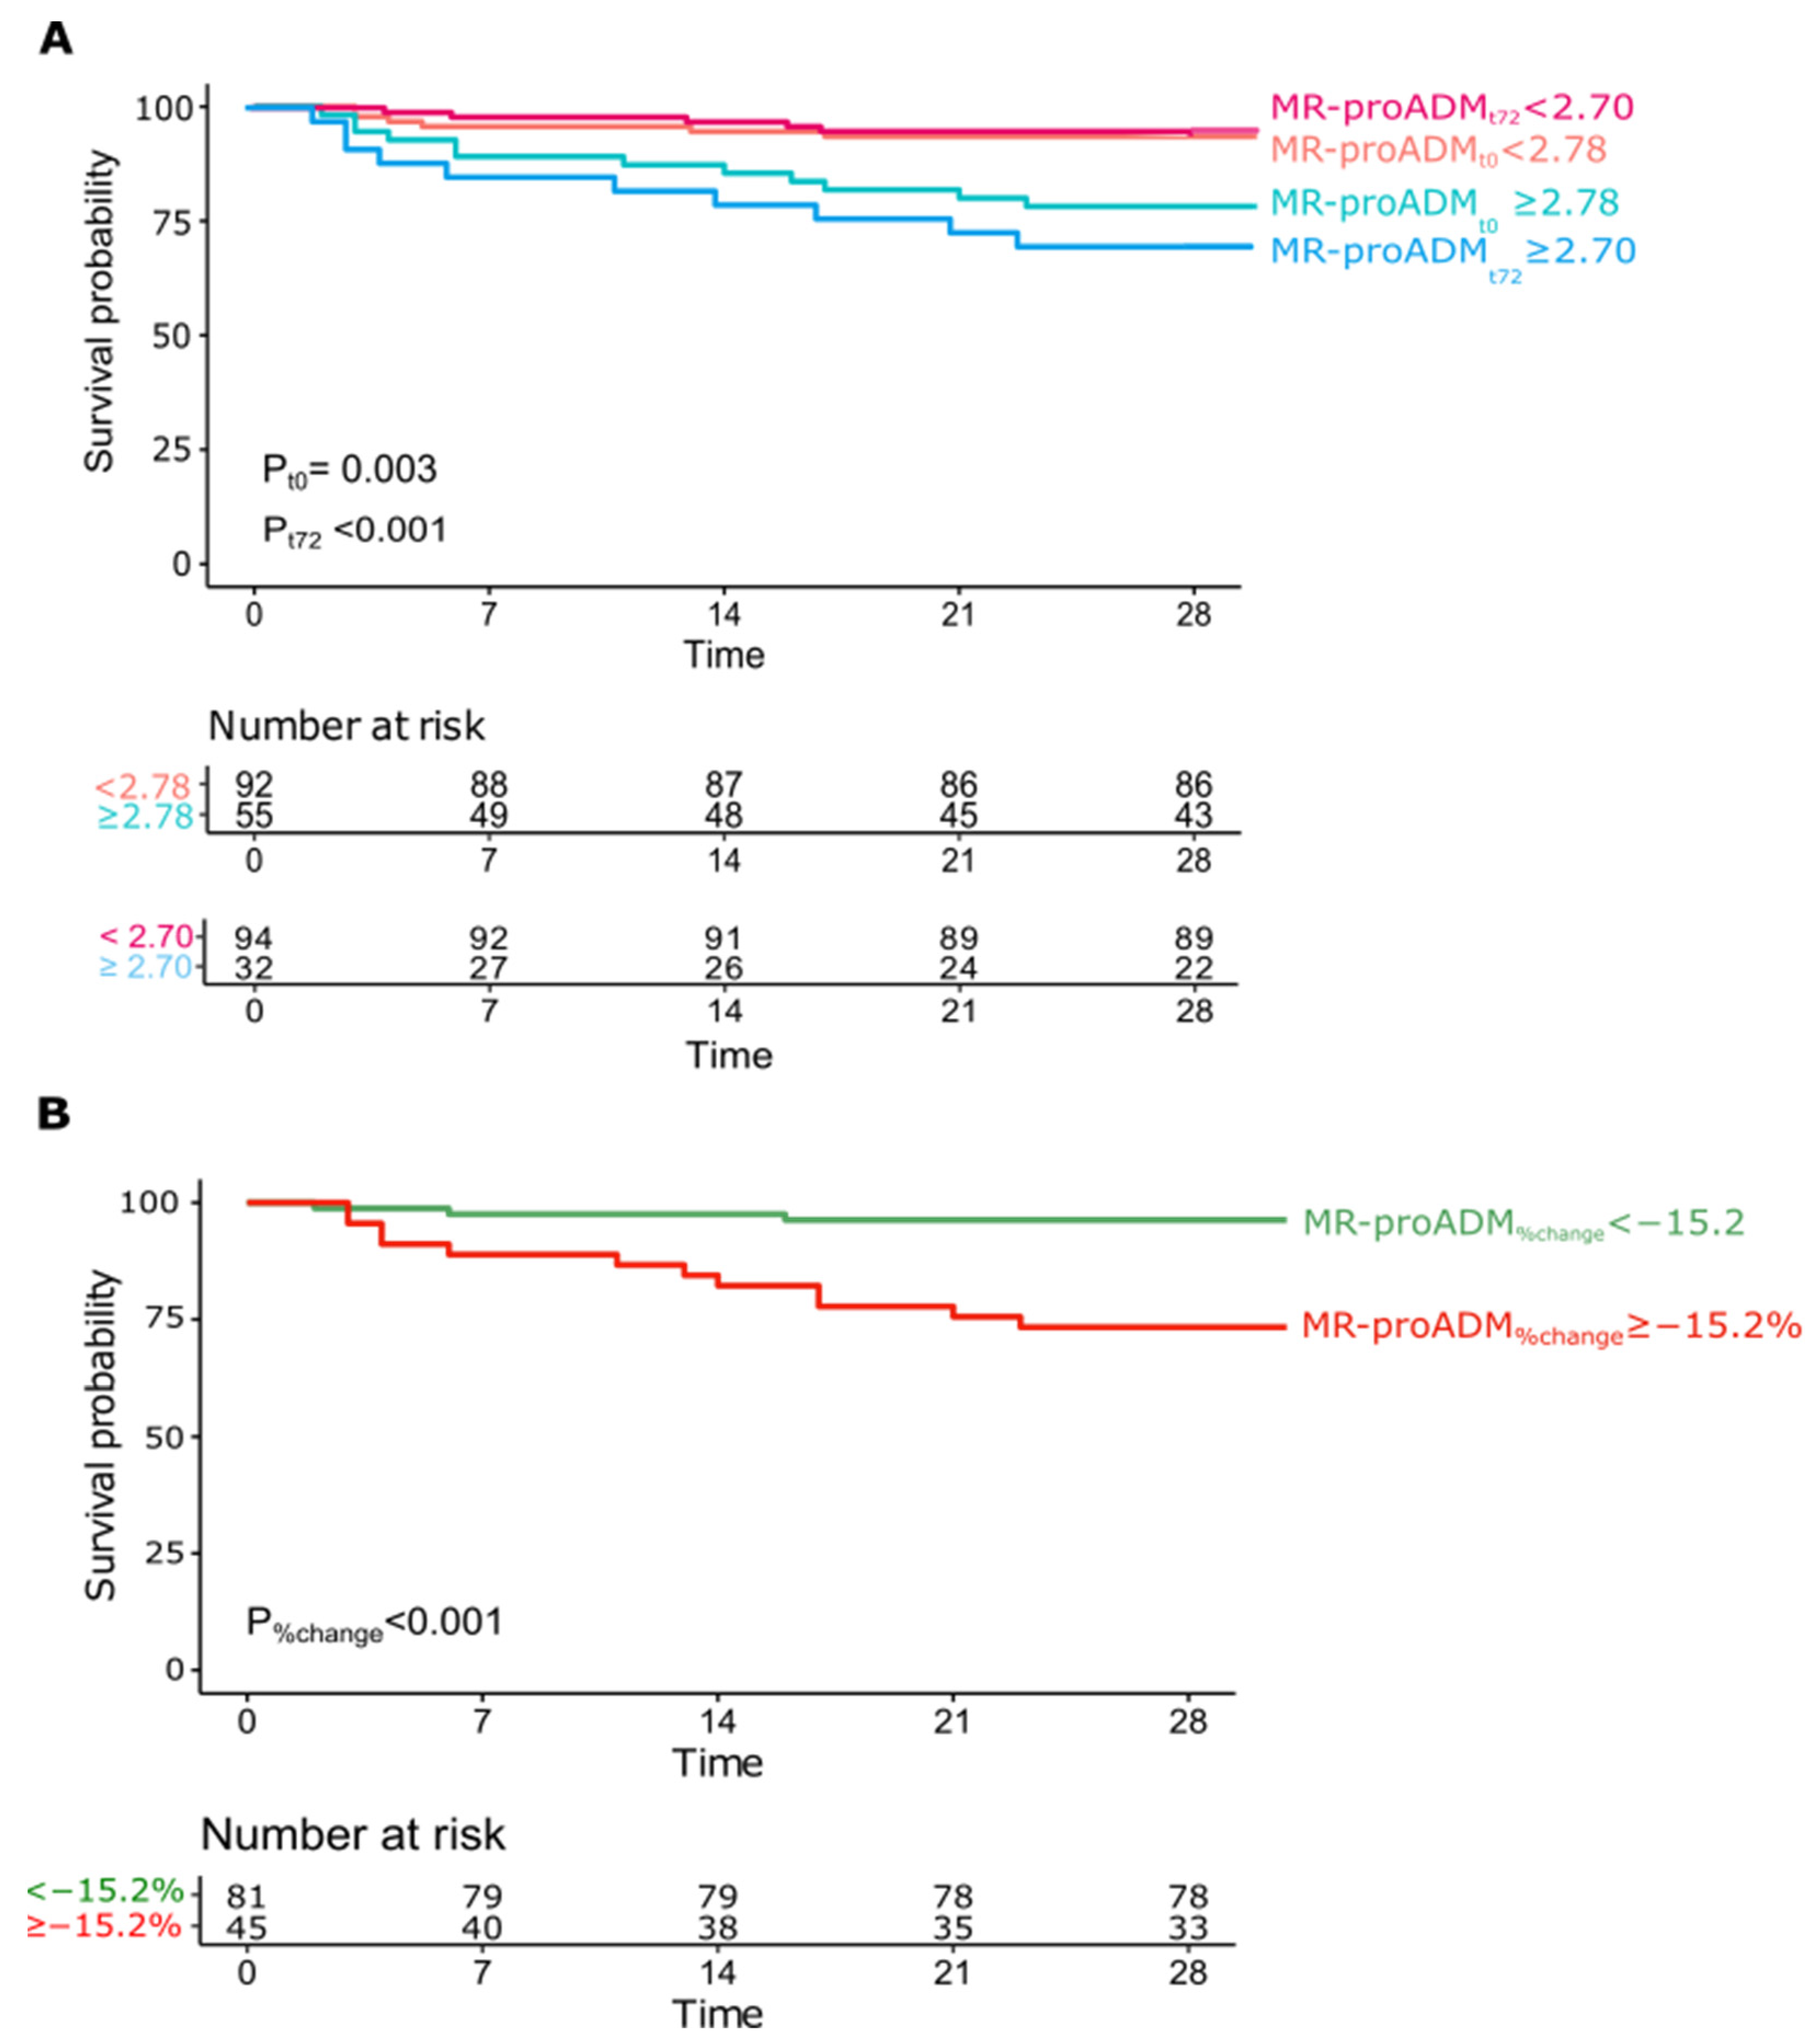
| MR-proADMt0 ≥ 2.78 nmol/L | 81.3% (62.1–100) | - | 64.6% (55.6–73.5) | - | 2.3 (1.6–3.2) | - | 0.3 (0.1–0.8) | - |
| MR-proADMt72 ≥ 2.7 nmol/L | 68.8% (46.0–91.5) | 0.5 | 80.0% (72.5–87.5) | <0.001 | 3.4 (2.1–5.7) | 0.05 | 0.4 (0.2–0.8) | 0.4 |
| MR-proADM%change ≥ −15.2% | 75.0% (53.8–96.2) | 1.0 | 70.0% (61.4–78.6) | 0.5 | 2.5 (1.7–3.7) | 0.8 | 0.4 (0.2–0.8) | 0.8 |
Publisher’s Note: MDPI stays neutral with regard to jurisdictional claims in published maps and institutional affiliations. |
© 2022 by the authors. Licensee MDPI, Basel, Switzerland. This article is an open access article distributed under the terms and conditions of the Creative Commons Attribution (CC BY) license (https://creativecommons.org/licenses/by/4.0/).
Share and Cite
Bima, P.; Montrucchio, G.; Caramello, V.; Rumbolo, F.; Dutto, S.; Boasso, S.; Ferraro, A.; Brazzi, L.; Lupia, E.; Boccuzzi, A.; et al. Prognostic Value of Mid-Regional Proadrenomedullin Sampled at Presentation and after 72 Hours in Septic Patients Presenting to the Emergency Department: An Observational Two-Center Study. Biomedicines 2022, 10, 719. https://doi.org/10.3390/biomedicines10030719
Bima P, Montrucchio G, Caramello V, Rumbolo F, Dutto S, Boasso S, Ferraro A, Brazzi L, Lupia E, Boccuzzi A, et al. Prognostic Value of Mid-Regional Proadrenomedullin Sampled at Presentation and after 72 Hours in Septic Patients Presenting to the Emergency Department: An Observational Two-Center Study. Biomedicines. 2022; 10(3):719. https://doi.org/10.3390/biomedicines10030719
Chicago/Turabian StyleBima, Paolo, Giorgia Montrucchio, Valeria Caramello, Francesca Rumbolo, Stefania Dutto, Sarah Boasso, Anita Ferraro, Luca Brazzi, Enrico Lupia, Adriana Boccuzzi, and et al. 2022. "Prognostic Value of Mid-Regional Proadrenomedullin Sampled at Presentation and after 72 Hours in Septic Patients Presenting to the Emergency Department: An Observational Two-Center Study" Biomedicines 10, no. 3: 719. https://doi.org/10.3390/biomedicines10030719