
Prognosis Value of Immunoregulatory Molecules in Oral Cancer Microenvironment: An Immunohistochemical Study

 , ,
, ,
Abstract
:1. Introduction
2. Materials and Methods
2.1. Collection of Clinical Data
2.2. Preliminary Anatomopathological Analysis and Selection of Histological Blocks
2.3. Immunohistochemistry
2.4. Immunohistochemical Observation
2.5. Survival
2.6. Statistical Analysis
3. Results
3.1. Sample Selection
3.2. Clinical and Histopathological Characteristics
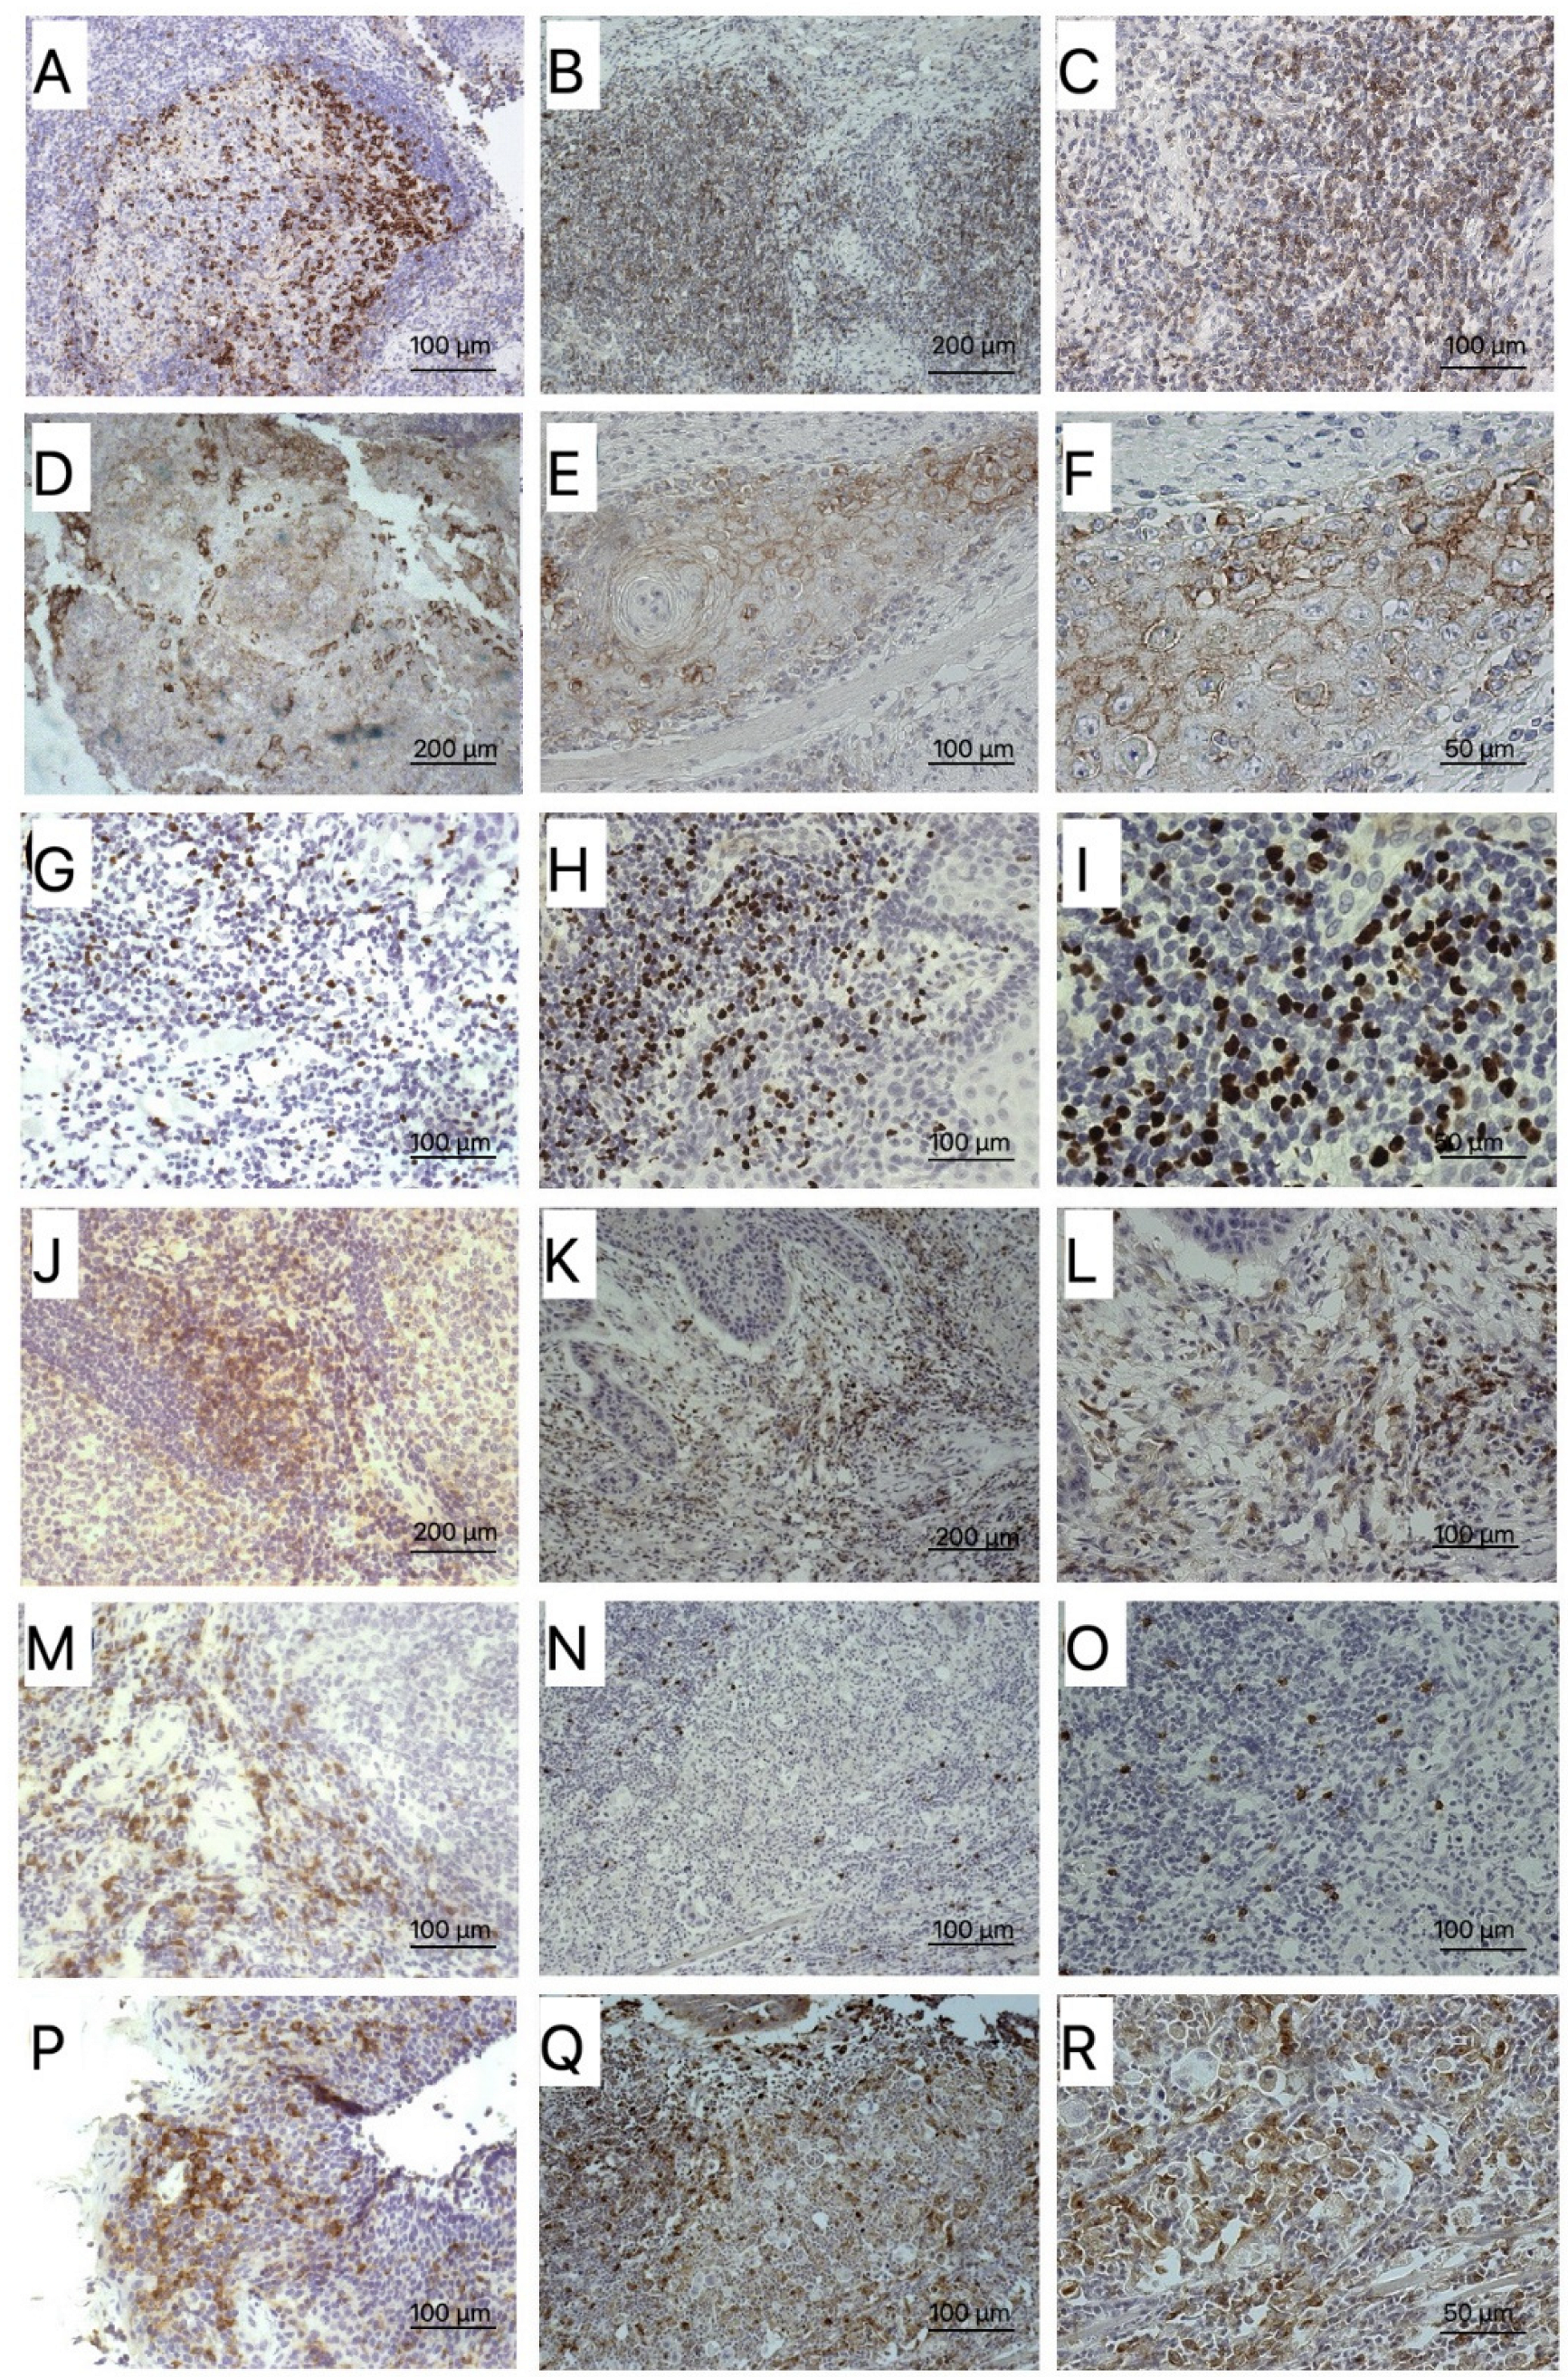
3.3. Biomarkers
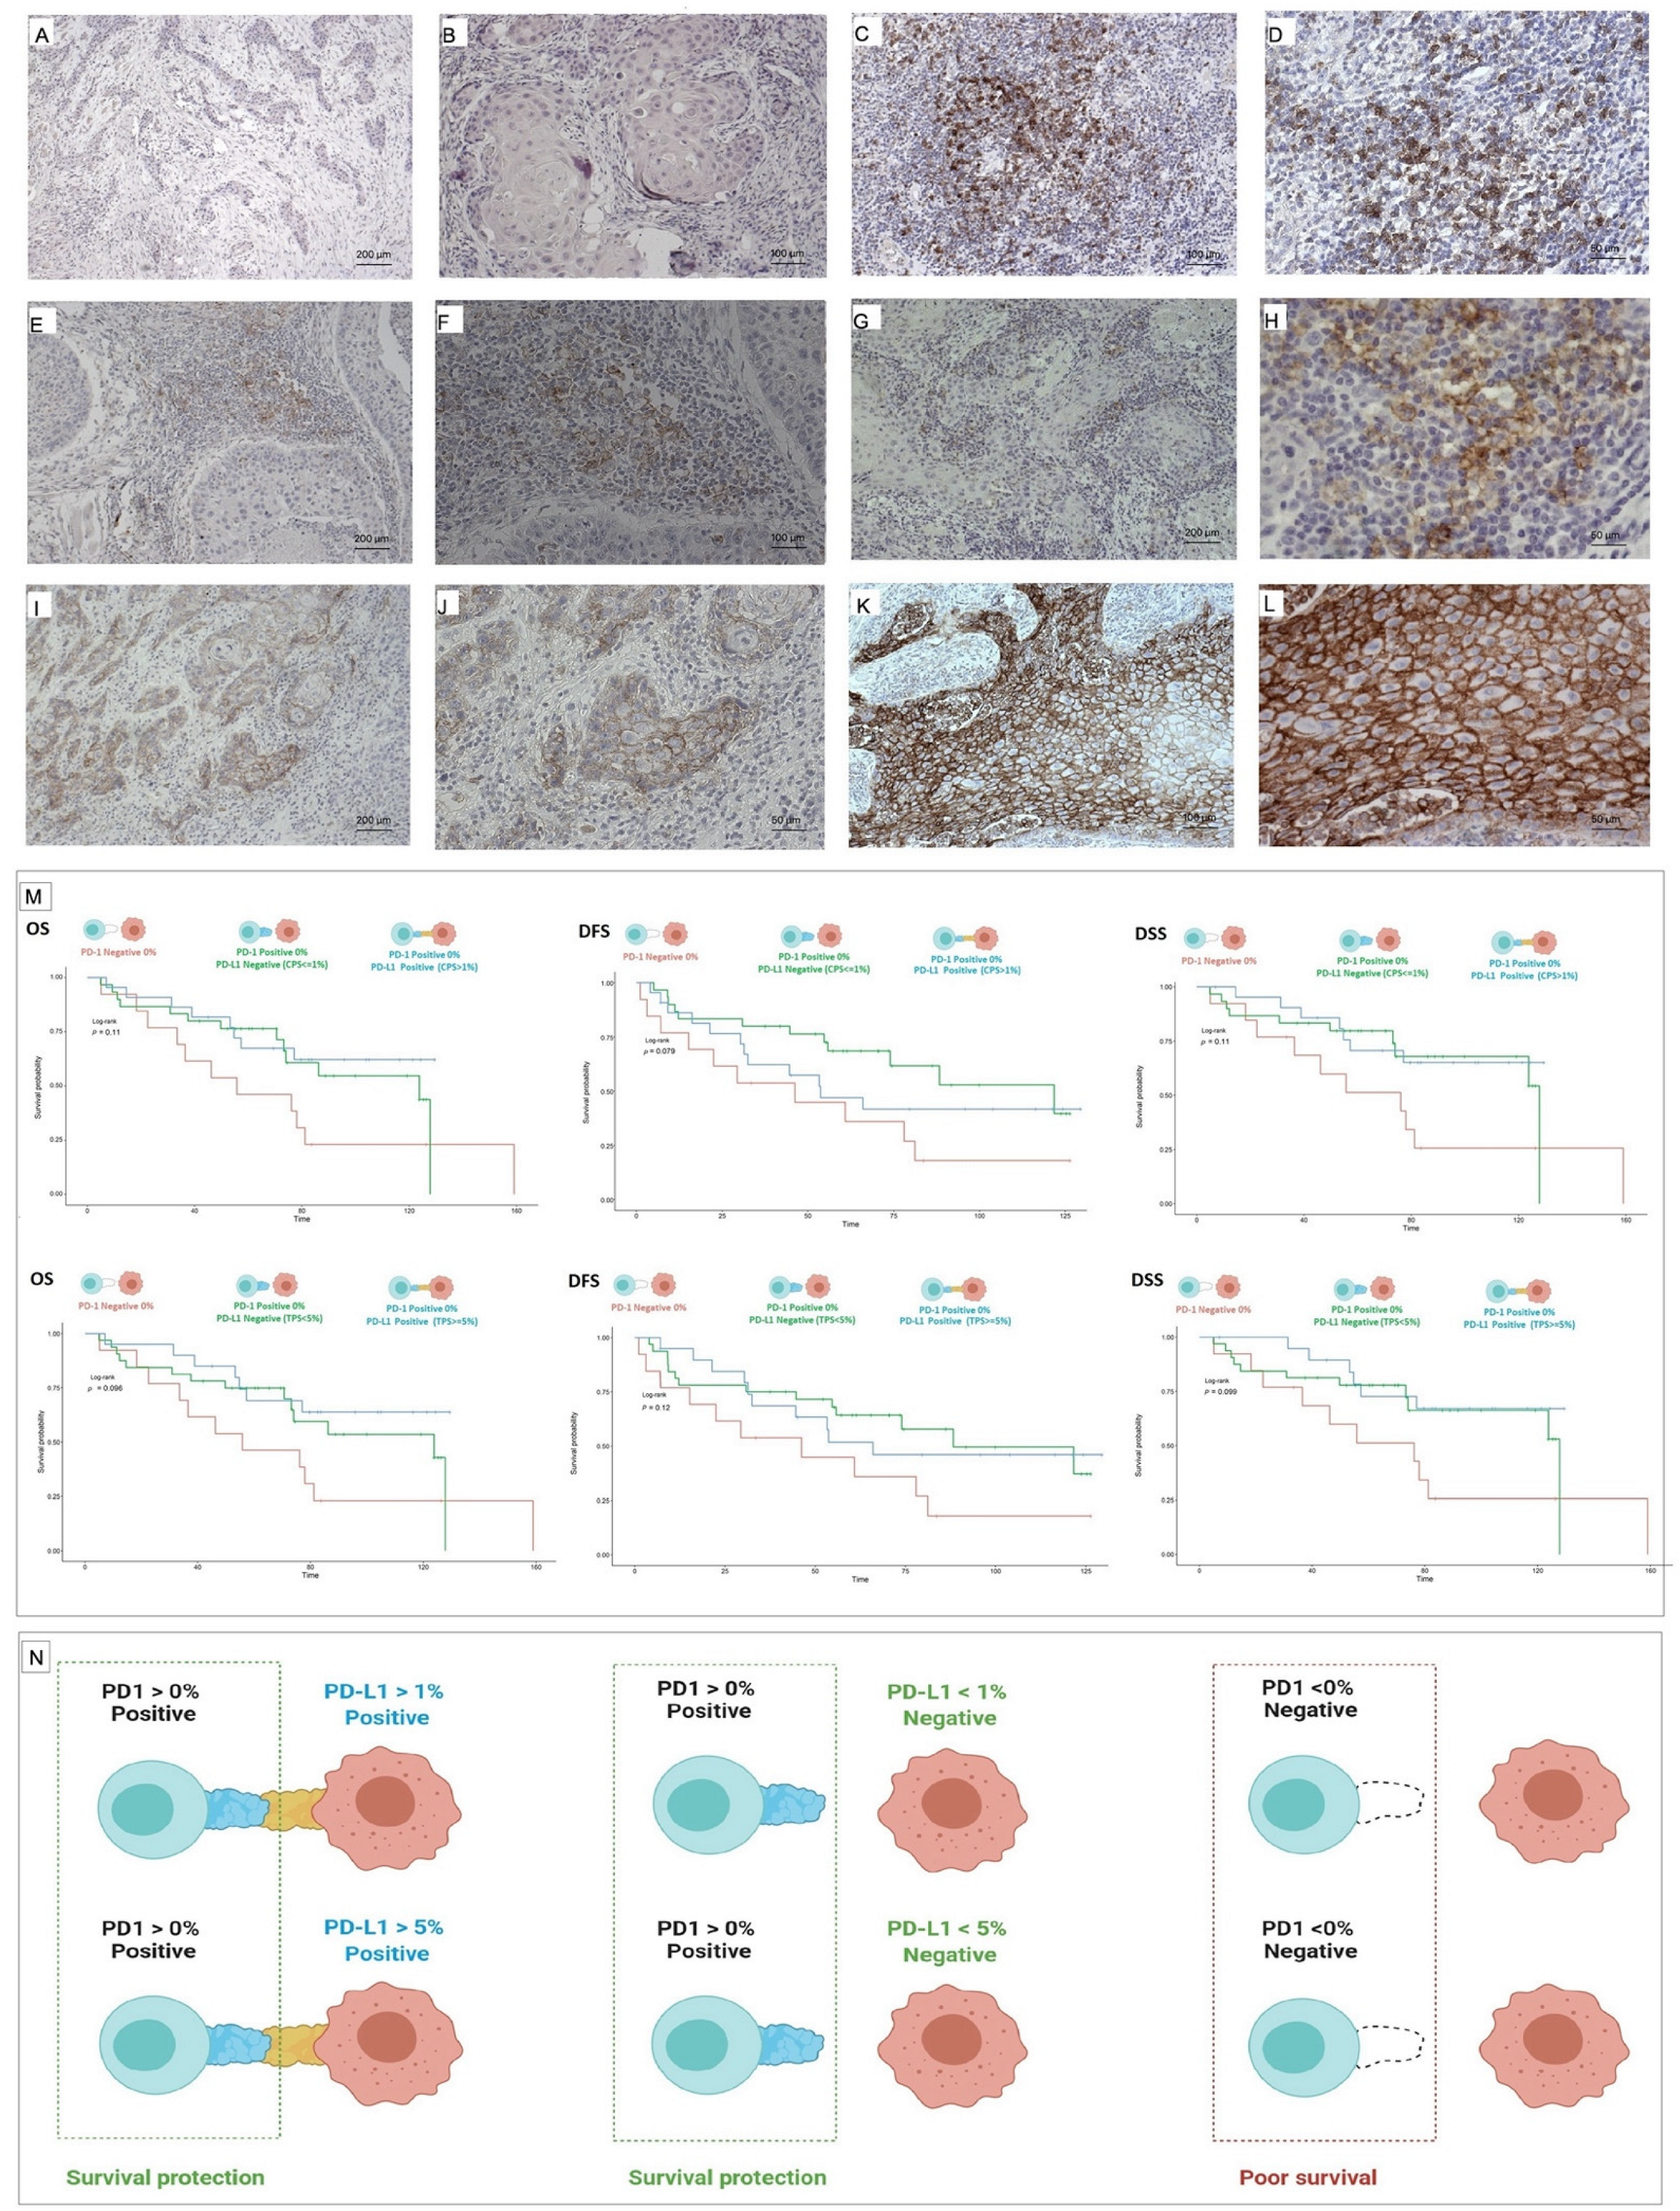
3.4. PD-1 and PD-L1
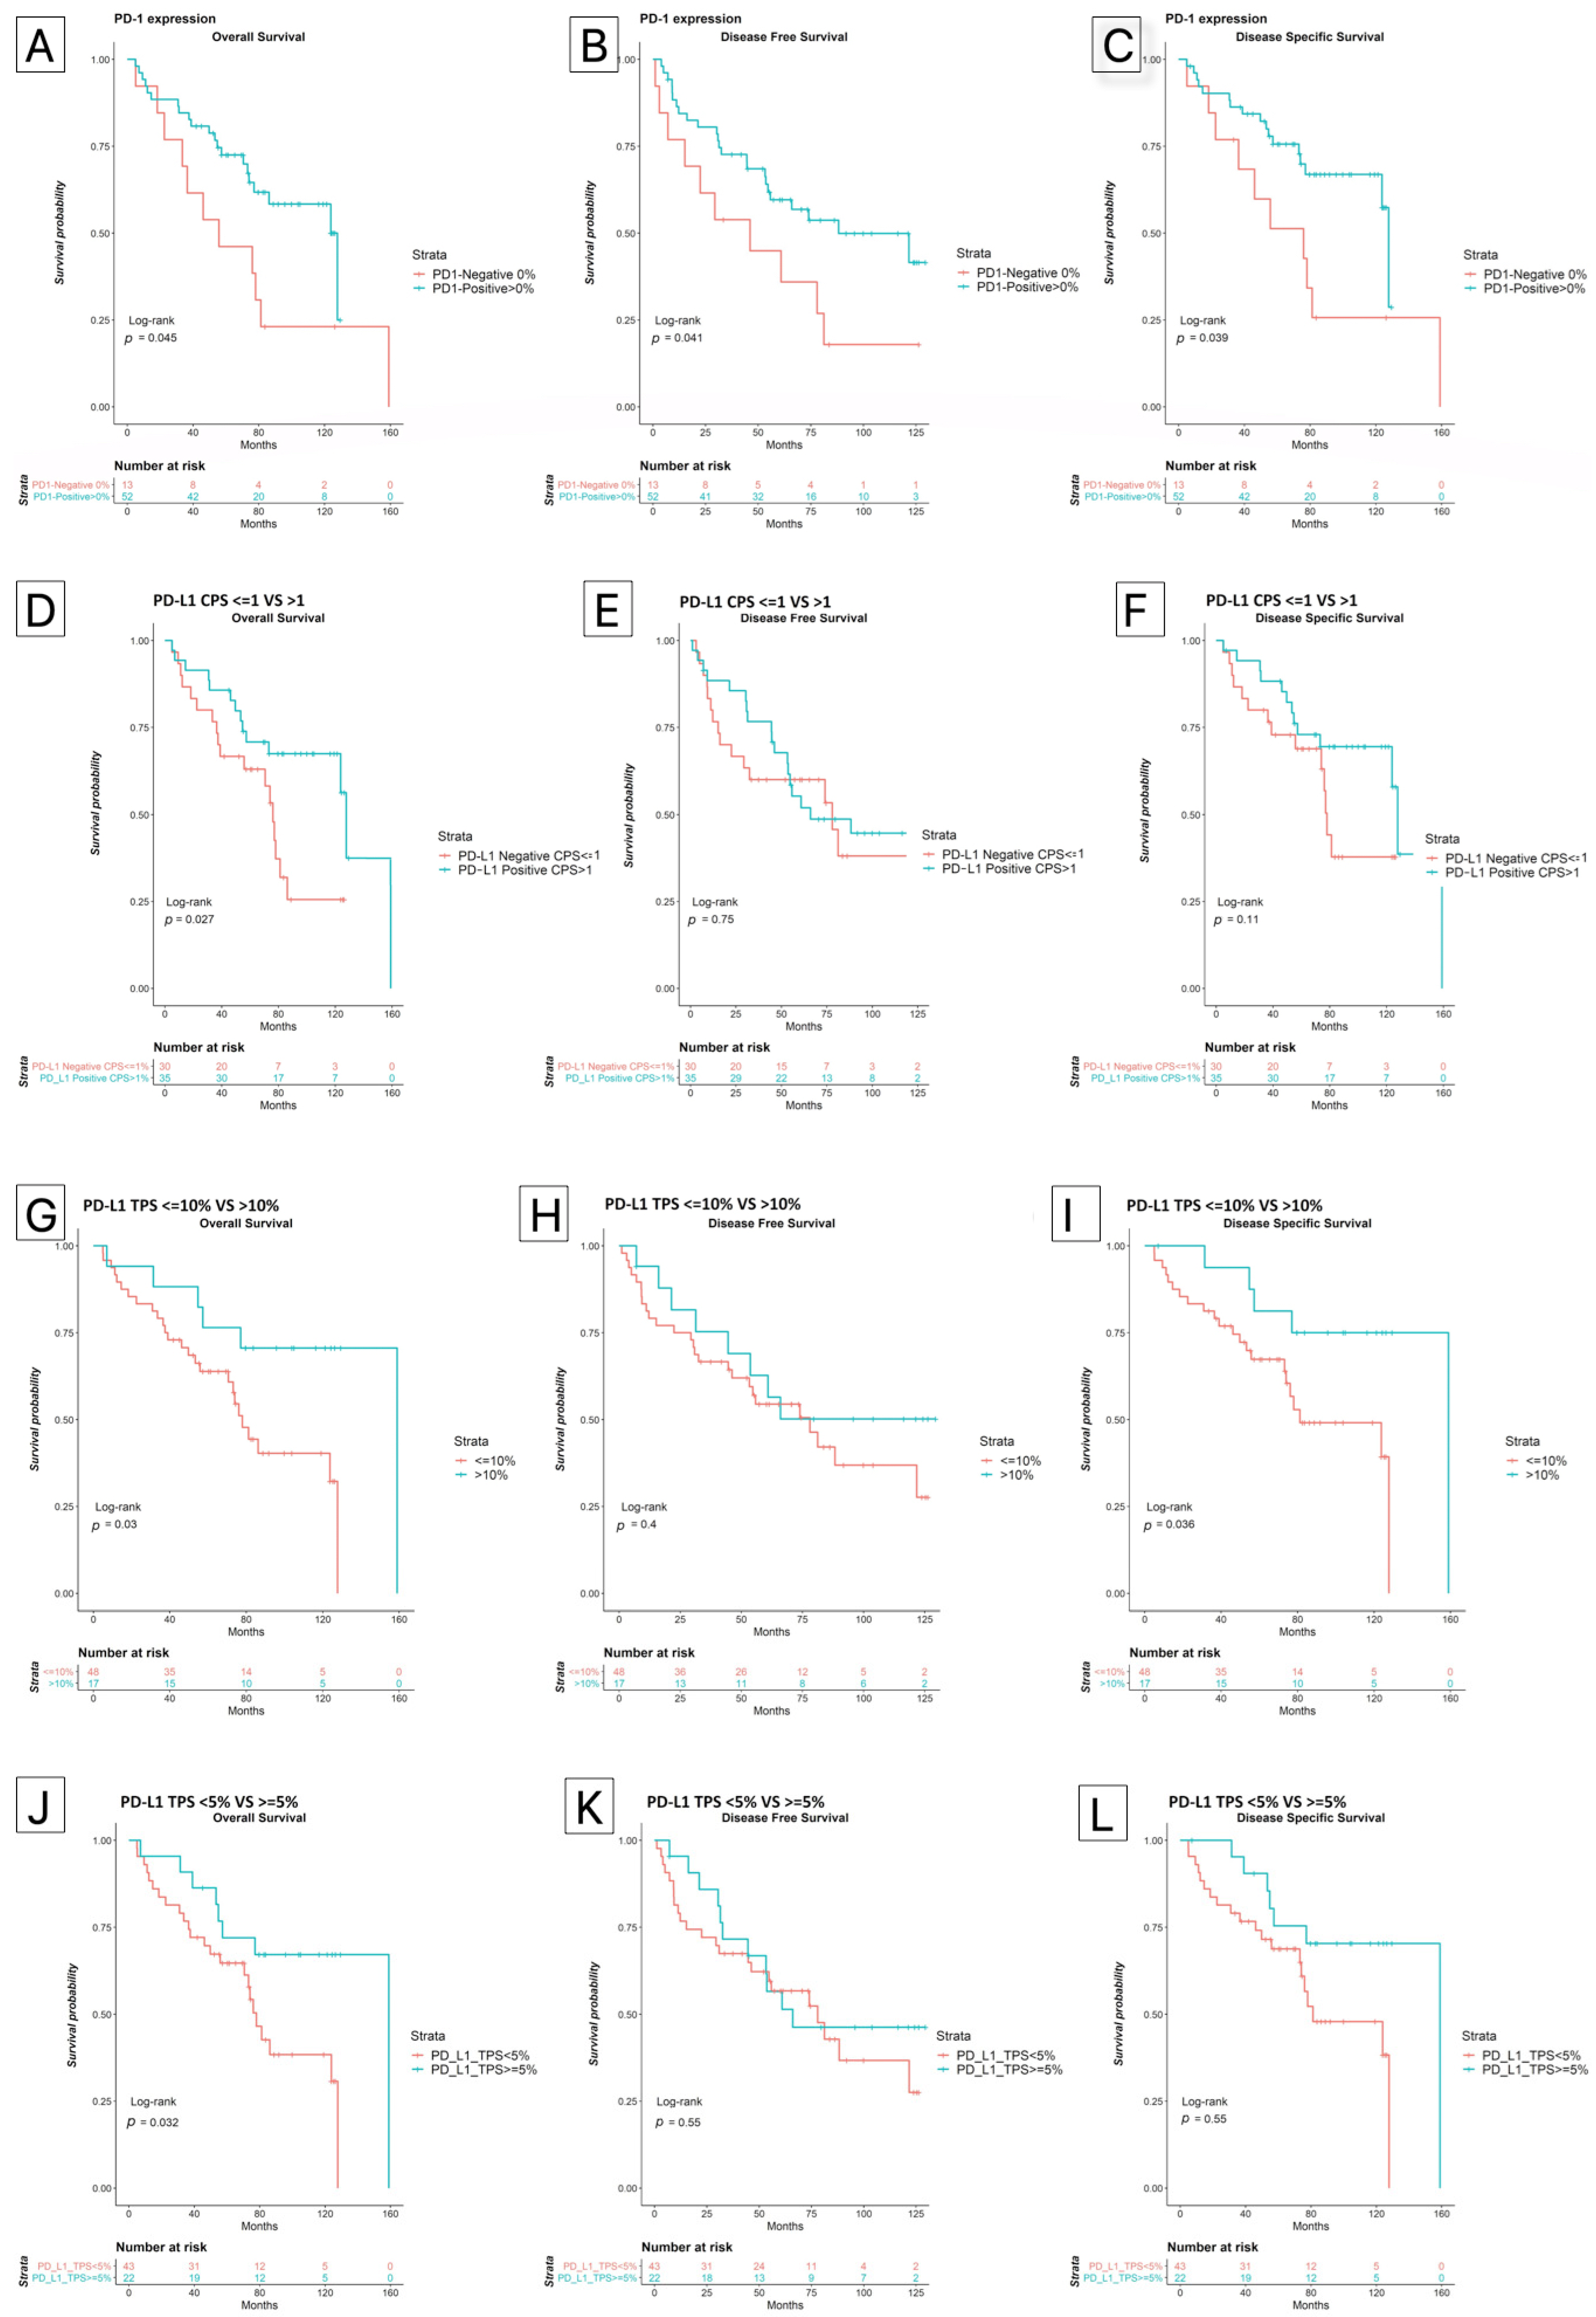
3.5. PD-1 Expression
3.6. PD-L1 Expression
3.7. Other Biomarkers
3.8. Survival Analysis
3.9. Multivariate Analysis
4. Discussion
5. Conclusions
Supplementary Materials
Author Contributions
Funding
Institutional Review Board Statement
Informed Consent Statement
Data Availability Statement
Acknowledgments
Conflicts of Interest
References
- Bray, F.; Ferlay, J.; Soerjomataram, I.; Siegel, R.L.; Torre, L.A.; Jemal, A. Global cancer statistics 2018: GLOBOCAN estimates of incidence and mortality worldwide for 36 cancers in 185 countries. CA Cancer J. Clin. 2018, 68, 394–424. [Google Scholar] [CrossRef] [Green Version]
- Warnakulasuriya, S. Global epidemiology of oral and oropharyngeal cancer. Oral Oncol. 2009, 45, 309–316. [Google Scholar] [CrossRef] [PubMed]
- Sacco, A.G.; Cohen, E.E. Current Treatment Options for Recurrent or Metastatic Head and Neck Squamous Cell Carcinoma. J. Clin. Oncol. 2015, 33, 3305–3313. [Google Scholar] [CrossRef] [PubMed]
- Rapidis, A.D.; Gullane, P.; Langdon, J.D.; Lefebvre, J.L.; Scully, C.; Shah, J.P. Major advances in the knowledge and understanding of the epidemiology, aetiopathogenesis, diagnosis, management and prognosis of oral cancer. Oral Oncol. 2009, 45, 299–300. [Google Scholar] [CrossRef] [PubMed]
- Chi, A.C.; Day, T.A.; Neville, B.W. Oral cavity and oropharyngeal squamous cell carcinoma--an update. CA Cancer J. Clin. 2015, 65, 401–421. [Google Scholar] [CrossRef]
- Zandberg, D.P.; Strome, S.E. The role of the PD-L1:PD-1 pathway in squamous cell carcinoma of the head and neck. Oral Oncol. 2014, 50, 627–632. [Google Scholar] [CrossRef]
- Brandwein-Gensler, M.; Teixeira, M.S.; Lewis, C.M.; Lee, B.; Rolnitzky, L.; Hille, J.J.; Genden, E.; Urken, M.L.; Wang, B.Y. Oral squamous cell carcinoma: Histologic risk assessment, but not margin status, is strongly predictive of local disease-free and overall survival. Am. J. Surg. Pathol. 2005, 29, 167–178. [Google Scholar] [CrossRef]
- Brandwein-Gensler, M.; Smith, R.V.; Wang, B.; Penner, C.; Theilken, A.; Broughel, D.; Schiff, B.; Owen, R.P.; Smith, J.; Sarta, C.; et al. Validation of the histologic risk model in a new cohort of patients with head and neck squamous cell carcinoma. Am. J. Surg. Pathol. 2010, 34, 676–688. [Google Scholar] [CrossRef]
- Weckx, A.; Riekert, M.; Grandoch, A.; Schick, V.; Zöller, J.E.; Kreppel, M. Time to recurrence and patient survival in recurrent oral squamous cell carcinoma. Oral Oncol. 2019, 94, 8–13. [Google Scholar] [CrossRef]
- Peltanova, B.; Raudenska, M.; Masarik, M. Effect of tumor microenvironment on pathogenesis of the head and neck squamous cell carcinoma: A systematic review. Mol. Cancer 2019, 18, 63. [Google Scholar] [CrossRef]
- Mohan, S.P.; Bhaskaran, M.K.; George, A.L.; Thirutheri, A.; Somasundaran, M.; Pavithran, A. Immunotherapy in Oral Cancer. J. Pharm. Bioallied. Sci. 2019, 11 (Suppl. S2), S107–S111. [Google Scholar] [CrossRef] [PubMed]
- Ferris, R.L.; Blumenschein, G., Jr.; Fayette, J.; Guigay, J.; Colevas, A.D.; Licitra, L.; Harrington, K.; Kasper, S.; Vokes, E.E.; Even, C.; et al. Nivolumab for Recurrent Squamous-Cell Carcinoma of the Head and Neck. N. Engl. J. Med. 2016, 375, 1856–1867. [Google Scholar] [CrossRef] [PubMed] [Green Version]
- Cohen, E.E.W.; Soulières, D.; Le Tourneau, C.; Dinis, J.; Licitra, L.; Ahn, M.-J.; Soria, A.; Machiels, J.-P.; Mach, N.; Mehra, R.; et al. Pembrolizumab versus methotrexate, docetaxel, or cetuximab for recurrent or metastatic head-and-neck squamous cell carcinoma (KEYNOTE-040): A randomised, open-label, phase 3 study. Lancet 2019, 393, 156–167. [Google Scholar] [CrossRef]
- Cohen, E.E.W.; Bell, R.B.; Bifulco, C.B.; Burtness, B.; Gillison, M.L.; Harrington, K.J.; Le, Q.-T.; Lee, N.Y.; Leidner, R.; Lewis, R.L.; et al. The Society for Immunotherapy of Cancer consensus statement on immunotherapy for the treatment of squamous cell carcinoma of the head and neck (HNSCC). J. Immunother. Cancer 2019, 7, 184. [Google Scholar] [CrossRef] [Green Version]
- Mehra, R.; Seiwert, T.Y.; Gupta, S.; Weiss, J.; Gluck, I.; Eder, J.P.; Burtness, B.; Tahara, M.; Keam, B.; Kang, H.; et al. Efficacy and safety of pembrolizumab in recurrent/metastatic head and neck squamous cell carcinoma: Pooled analyses after long-term follow-up in KEYNOTE-012. Br. J. Cancer 2018, 119, 153–159. [Google Scholar] [CrossRef] [PubMed]
- Segal, N.H.; Ou, S.-H.I.; Balmanoukian, A.; Fury, M.G.; Massarelli, E.; Brahmer, J.R.; Weiss, J.; Schöffski, P.; Antonia, S.J.; Massard, C.; et al. Safety and efficacy of durvalumab in patients with head and neck squamous cell carcinoma: Results from a phase I/II expansion cohort. Eur. J. Cancer 2019, 109, 154–161. [Google Scholar] [CrossRef] [PubMed]
- Bauml, J.; Seiwert, T.Y.; Pfister, D.G.; Worden, F.; Liu, S.V.; Gilbert, J.; Saba, N.F.; Weiss, J.; Wirth, L.; Sukari, A.; et al. Pembrolizumab for Platinum- and Cetuximab-Refractory Head and Neck Cancer: Results From a Single-Arm, Phase II Study. J. Clin. Oncol. 2017, 35, 1542–1549. [Google Scholar] [CrossRef]
- Cramer, J.D.; Burtness, B.; Ferris, R.L. Immunotherapy for head and neck cancer: Recent advances and future directions. Oral Oncol. 2019, 99, 104460. [Google Scholar] [CrossRef]
- Warnakulasuriya, S.; Kujan, O.; Aguirre-Urizar, J.M.; Bagan, J.V.; González-Moles, M.; Kerr, A.R.; Lodi, G.; Mello, F.W.; Monteiro, L.; Ogden, G.R.; et al. Oral potentially malignant disorders: A consensus report from an international seminar on nomenclature and classification, convened by the WHO Collaborating Centre for Oral Cancer. Oral Dis. 2021, 27, 1862–1880. [Google Scholar] [CrossRef]
- Amin, M.B.; Greene, F.L.; Edge, S.B.; Compton, C.C.; Gershenwald, J.E.; Brookland, R.K.; Meyer, L.; Gress, D.M.; Byrd, D.R.; Winchester, D.P. The Eighth Edition AJCC Cancer Staging Manual: Continuing to build a bridge from a population-based to a more “personalized” approach to cancer staging. CA Cancer J. Clin. 2017, 67, 93–99. [Google Scholar] [CrossRef]
- El-Naggar, A.K.; Chan, J.K.; Takata, T.; Grandis, J.R.; Slootweg, P.J. The fourth edition of the head and neck World Health Organization blue book: Editors’ perspectives. Hum. Pathol. 2017, 66, 10–12. [Google Scholar] [CrossRef] [PubMed]
- Lydiatt, W.M.; Patel, S.G.; O’Sullivan, B.; Brandwein, M.S.; Ridge, J.A.; Migliacci, J.C.; Loomis, A.M.; Shah, J.P. Head and Neck cancers-major changes in the American Joint Committee on cancer eighth edition cancer staging manual. CA Cancer J. Clin. 2017, 67, 122–137. [Google Scholar] [CrossRef] [PubMed]
- Lewis, J.S.; Beadle, B.; Bishop, J.A.; Chernock, R.D.; Colasacco, C.; Lacchetti, C.; Moncur, J.T.; Rocco, J.W.; Schwartz, M.R.; Seethala, R.R.; et al. Human Papillomavirus Testing in Head and Neck Carcinomas: Guideline From the College of American Pathologists. Arch. Pathol. Lab. Med. 2018, 142, 559–597. [Google Scholar] [CrossRef] [PubMed] [Green Version]
- Kogashiwa, Y.; Yasuda, M.; Sakurai, H.; Nakahira, M.; Sano, Y.; Gonda, K.; Ikeda, T.; Inoue, H.; Kuba, K.; Oba, S.; et al. PD-L1 Expression Confers Better Prognosis in Locally Advanced Oral Squamous Cell Carcinoma. Anticancer. Res. 2017, 37, 1417–1424. [Google Scholar] [CrossRef] [Green Version]
- Hanna, G.; Woo, S.-B.; Li, Y.; Barletta, J.; Hammerman, P.; Lorch, J. Tumor PD-L1 expression is associated with improved survival and lower recurrence risk in young women with oral cavity squamous cell carcinoma. Int. J. Oral. Maxillofac. Surg. 2018, 47, 568–577. [Google Scholar] [CrossRef]
- Ahn, H.; Yang, J.M.; Kim, H.; Chung, J.-H.; Ahn, S.-H.; Jeong, W.-J.; Paik, J.H. Clinicopathologic implications of the miR-197/PD-L1 axis in oral squamous cell carcinoma. Oncotarget 2017, 8, 66178–66194. [Google Scholar] [CrossRef] [Green Version]
- Ahmadi, N.; Gao, K.; Chia, N.; Kwon, M.S.; Palme, C.E.; Gupta, R.; Clark, J. Association of PD-L1 expression in oral squamous cell carcinoma with smoking, sex, and p53 expression. Oral Surg. Oral Med. Oral Pathol. Oral Radiol. 2019, 128, 631–638. [Google Scholar] [CrossRef]
- Lenouvel, D.; González-Moles, M.; Ruiz-Ávila, I.; Chamorro-Santos, C.; González-Ruiz, L.; González-Ruiz, I.; Ramos-García, P. Clinicopathological and prognostic significance of PD-L1 in oral cancer: A preliminary retrospective immunohistochemistry study. Oral Dis. 2021, 27, 173–182. [Google Scholar] [CrossRef]
- Lenouvel, D.; González-Moles, M.; Ruiz-Ávila, I.; Gonzalez-Ruiz, L.; Gonzalez-Ruiz, I.; Ramos-García, P. Prognostic and clinicopathological significance of PD-L1 overexpression in oral squamous cell carcinoma: A systematic review and comprehensive meta-analysis. Oral Oncol. 2020, 106, 104722. [Google Scholar] [CrossRef]
- Kikuchi, M.; Yamashita, D.; Hara, S.; Takebayashi, S.; Hamaguchi, K.; Mizuno, K.; Omori, K.; Shinohara, S. Clinical significance of tumor-associated immune cells in patients with oral squamous cell carcinoma. Head Neck 2021, 43, 534–543. [Google Scholar] [CrossRef]
- Maruse, Y.; Kawano, S.; Jinno, T.; Matsubara, R.; Goto, Y.; Kaneko, N.; Sakamoto, T.; Hashiguchi, Y.; Moriyama, M.; Toyoshima, T.; et al. Significant association of increased PD-L1 and PD-1 expression with nodal metastasis and a poor prognosis in oral squamous cell carcinoma. Int. J. Oral Maxillofac. Surg. 2018, 47, 836–845. [Google Scholar] [CrossRef] [PubMed] [Green Version]
- Chen, T.-C.; Wu, C.-T.; Wang, C.-P.; Hsu, W.-L.; Yang, T.-L.; Lou, P.-J.; Ko, J.-Y.; Chang, Y.-L. Associations among pretreatment tumor necrosis and the expression of HIF-1α and PD-L1 in advanced oral squamous cell carcinoma and the prognostic impact thereof. Oral Oncol. 2015, 51, 1004–1010. [Google Scholar] [CrossRef] [PubMed]
- Oliveira-Costa, J.P.; De Carvalho, A.F.; da Silveira, G.G.; Amaya, P.; Wu, Y.; Park, K.-J.J.; Gigliola, M.P.; Lustberg, M.; Buim, M.E.C.; Ferreira, E.; et al. Gene expression patterns through oral squamous cell carcinoma development: PD-L1 expression in primary tumor and circulating tumor cells. Oncotarget 2015, 6, 20902–20920. [Google Scholar] [CrossRef] [Green Version]
- Satgunaseelan, L.; Gupta, R.; Madore, J.; Chia, N.; Lum, T.; Palme, C.E.; Boyer, M.; Scolyer, R.A.; Clark, J.R. Programmed cell death-ligand 1 expression in oral squamous cell carcinoma is associated with an inflammatory phenotype. Pathology 2016, 48, 574–580. [Google Scholar] [CrossRef] [PubMed]
- Straub, M.; Drecoll, E.; Pfarr, N.; Weichert, W.; Langer, R.; Hapfelmeier, A.; Götz, C.; Wolff, K.-D.; Kolk, A.; Specht, K. CD274/PD-L1 gene amplification and PD-L1 protein expression are common events in squamous cell carcinoma of the oral cavity. Oncotarget 2016, 7, 12024–12034. [Google Scholar] [CrossRef] [Green Version]
- Troeltzsch, M.; Woodlock, T.; Pianka, A.; Otto, S.; Troeltzsch, M.; Ehrenfeld, M.; Knösel, T. Is There Evidence for the Presence and Relevance of the PD-1/PD-L1 Pathway in Oral Squamous Cell Carcinoma? Hints From an Immunohistochemical Study. J. Oral Maxillofac. Surg. 2017, 75, 969–977. [Google Scholar] [CrossRef] [PubMed]
- de Vicente, J.C.; Rodríguez-Santamarta, T.; Rodrigo, J.P.; Blanco-Lorenzo, V.; Allonca, E.; García-Pedrero, J.M. PD-L1 Expression in Tumor Cells Is an Independent Unfavorable Prognostic Factor in Oral Squamous Cell Carcinoma. Cancer Epidemiol. Biomark. Prev. 2019, 28, 546–554. [Google Scholar] [CrossRef] [Green Version]
- Mattox, A.K.; Lee, J.; Westra, W.H.; Pierce, R.H.; Ghossein, R.; Faquin, W.C.; Diefenbach, T.J.; Morris, L.G.; Lin, D.T.; Wirth, L.J.; et al. PD-1 Expression in Head and Neck Squamous Cell Carcinomas Derives Primarily from Functionally Anergic CD4+ TILs in the Presence of PD-L1+ TAMs. Cancer Res. 2017, 77, 6365–6374. [Google Scholar] [CrossRef] [Green Version]
- Hirai, M.; Kitahara, H.; Kobayashi, Y.; Kato, K.; Bou-Gharios, G.; Nakamura, H.; Kawashiri, S. Regulation of PD-L1 expression in a high-grade invasive human oral squamous cell carcinoma microenvironment. Int. J. Oncol. 2017, 50, 41–48. [Google Scholar] [CrossRef] [Green Version]
- Wirsing, A.M.; Ervik, I.K.; Seppola, M.; Uhlin-Hansen, L.; Steigen, S.E.; Hadler-Olsen, E. Presence of high-endothelial venules correlates with a favorable immune microenvironment in oral squamous cell carcinoma. Mod. Pathol. 2018, 31, 910–922. [Google Scholar] [CrossRef]
- Miranda-Galvis, M.; Piña, A.R.; de Sá, R.S.; Leite, A.A.; Vargas, P.A.; Calsavara, V.F.; Pinto, C.A.L.; Teng, Y.; Kowalski, L.P. PD-L1 expression patterns in oral cancer as an integrated approach for further prognostic classification. Oral Dis. 2021, 27, 1699–1710. [Google Scholar] [CrossRef] [PubMed]
- Hirsch, F.R.; McElhinny, A.; Stanforth, D.; Ranger-Moore, J.; Jansson, M.; Kulangara, K.; Richardson, W.; Towne, P.; Hanks, D.; Vennapusa, B.; et al. PD-L1 Immunohistochemistry Assays for Lung Cancer: Results from Phase 1 of the Blueprint PD-L1 IHC Assay Comparison Project. J. Thorac. Oncol. 2017, 12, 208–222. [Google Scholar] [CrossRef] [Green Version]
- Xu, H.; Lin, G.; Huang, C.; Zhu, W.; Miao, Q.; Fan, X.; Wu, B.; Zheng, X.; Lin, X.; Jiang, K.; et al. Assessment of Concordance between 22C3 and SP142 Immunohistochemistry Assays regarding PD-L1 Expression in Non-Small Cell Lung Cancer. Sci. Rep. 2017, 7, 16956. [Google Scholar] [CrossRef] [Green Version]
- Moratin, J.; Metzger, K.; Safaltin, A.; Herpel, E.; Hoffmann, J.; Freier, K.; Hess, J.; Horn, D. Upregulation of PD-L1 and PD-L2 in neck node metastases of head and neck squamous cell carcinoma. Head Neck 2019, 41, 2484–2491. [Google Scholar] [CrossRef] [PubMed]
- Cho, Y.-A.; Yoon, H.-J.; Lee, J.-I.; Hong, S.-P.; Hong, S.-D. Relationship between the expressions of PD-L1 and tumor-infiltrating lymphocytes in oral squamous cell carcinoma. Oral Oncol. 2011, 47, 1148–1153. [Google Scholar] [CrossRef] [PubMed]
- Rasmussen, J.H.; Lelkaitis, G.; Håkansson, K.; Vogelius, I.R.; Johannesen, H.H.; Fischer, B.M.; Bentzen, S.M.; Specht, L.; Kristensen, C.A.; von Buchwald, C.; et al. Intratumor heterogeneity of PD-L1 expression in head and neck squamous cell carcinoma. Br. J. Cancer 2019, 120, 1003–1006. [Google Scholar] [CrossRef] [PubMed] [Green Version]
- Botti, G.; Scognamiglio, G.; Cantile, M. PD-L1 Immunohistochemical Detection in Tumor Cells and Tumor Microenvironment: Main Considerations on the Use of Tissue Micro Arrays. Int. J. Mol. Sci. 2016, 17, 1046. [Google Scholar] [CrossRef] [Green Version]
- Lin, Y.-M.; Sung, W.-W.; Hsieh, M.-J.; Tsai, S.-C.; Lai, H.-W.; Yang, S.-M.; Shen, K.-H.; Chen, M.-K.; Lee, H.; Yeh, K.-T.; et al. High PD-L1 Expression Correlates with Metastasis and Poor Prognosis in Oral Squamous Cell Carcinoma. PLoS ONE 2015, 10, e0142656. [Google Scholar] [CrossRef] [Green Version]
- Tsai, M.-S.; Chen, W.-C.; Lu, C.-H.; Chen, M.-F. The prognosis of head and neck squamous cell carcinoma related to immunosuppressive tumor microenvironment regulated by IL-6 signaling. Oral Oncol. 2019, 91, 47–55. [Google Scholar] [CrossRef]
- Yoshida, S.; Nagatsuka, H.; Nakano, K.; Kogashiwa, Y.; Ebihara, Y.; Yano, M.; Yasuda, M. Significance of PD-L1 Expression in Tongue Cancer Development. Int. J. Med. Sci. 2018, 15, 1723–1730. [Google Scholar] [CrossRef] [Green Version]
- Khouja, M.H.; Baekelandt, M.; Sarab, A.; Nesland, J.M.; Holm, R. Limitations of tissue microarrays compared with whole tissue sections in survival analysis. Oncol Lett. 2010, 1, 827–831. [Google Scholar] [CrossRef] [PubMed] [Green Version]
- Rizk, E.M.; Gartrell, R.D.; Barker, L.W.; Esancy, C.L.; Finkel, G.G.; Bordbar, D.D.; Saenger, Y.M. Prognostic and Predictive Immunohistochemistry-Based Biomarkers in Cancer and Immunotherapy. Hematol. Oncol. Clin. North Am. 2019, 33, 291–299. [Google Scholar] [CrossRef] [PubMed]
- Grillo, F.; Bruzzone, M.; Pigozzi, S.; Prosapio, S.; Migliora, P.; Fiocca, R.; Mastracci, L. Immunohistochemistry on old archival paraffin blocks: Is there an expiry date? J. Clin. Pathol. 2017, 70, 988–993. [Google Scholar] [CrossRef] [PubMed]
- Faisal, M.; Abu Bakar, M.; Sarwar, A.; Adeel, M.; Batool, F.; Malik, K.I.; Jamshed, A.; Hussain, R. Depth of invasion (DOI) as a predictor of cervical nodal metastasis and local recurrence in early stage squamous cell carcinoma of oral tongue (ESSCOT). PLoS ONE 2018, 13, e0202632. [Google Scholar] [CrossRef]
- Song, J.-J.; Zhao, S.-J.; Fang, J.; Ma, D.; Liu, X.-Q.; Chen, X.-B.; Wang, Y.; Cheng, B.; Wang, Z. Foxp3 overexpression in tumor cells predicts poor survival in oral squamous cell carcinoma. BMC Cancer 2016, 16, 530. [Google Scholar] [CrossRef] [Green Version]
- Schreiber, T.H. The use of FoxP3 as a biomarker and prognostic factor for malignant human tumors. Cancer Epidemiol. Biomark. Prev. 2007, 16, 1931–1934. [Google Scholar] [CrossRef] [Green Version]
- Weed, D.T.; Walker, G.; De La Fuente, A.C.; Nazarian, R.; Vella, J.L.; Gomez-Fernandez, C.R.; Serafini, P. FOXP3 subcellular localization predicts recurrence in oral squamous cell carcinoma. PLoS ONE 2013, 8, e71908. [Google Scholar] [CrossRef]
- Cannarile, M.A.; Weisser, M.; Jacob, W.; Jegg, A.-M.; Ries, C.H.; Rüttinger, D. Colony-stimulating factor 1 receptor (CSF1R) inhibitors in cancer therapy. J. Immunother. Cancer 2017, 5, 53. [Google Scholar] [CrossRef]
- Suárez-Sánchez, F.J.; Lequerica-Fernández, P.; Suárez-Canto, J.; Rodrigo, J.P.; Rodríguez, J.C.D.V.; Domínguez-Iglesias, F.; García-Pedrero, J.M.; De Vicente, J.C. Macrophages in Oral Carcinomas: Relationship with Cancer Stem Cell Markers and PD-L1 Expression. Cancers 2020, 12, 1764. [Google Scholar] [CrossRef]
- Zhang, Q.W.; Liu, L.; Gong, C.-Y.; Shi, H.-S.; Zeng, Y.-H.; Wang, X.-Z.; Zhao, Y.-W.; Wei, Y.-Q. Prognostic significance of tumor-associated macrophages in solid tumor: A meta-analysis of the literature. PLoS ONE 2012, 7, e50946. [Google Scholar] [CrossRef] [Green Version]
- Lingen, M.W.; Xiao, W.; Schmitt, A.; Jiang, B.; Pickard, R.; Kreinbrink, P.; Perez-Ordonez, B.; Jordan, R.C.; Gillison, M.L. Low etiologic fraction for high-risk human papillomavirus in oral cavity squamous cell carcinomas. Oral Oncol. 2013, 49, 1–8. [Google Scholar] [CrossRef] [PubMed] [Green Version]
- Tang, H.; Zhou, X.; Ye, Y.; Zhou, Y.; Wu, C.; Xu, Y. The different role of PD-L1 in head and neck squamous cell carcinomas: A meta-analysis. Pathol. Res. Pract. 2020, 216, 152768. [Google Scholar] [CrossRef] [PubMed]
- Hong, A.M.; Ferguson, P.M.; Dodds, T.; Jones, D.; Li, M.; Yang, J.; Scolyer, R.A. Significant association of PD-L1 expression with human papillomavirus positivity and its prognostic impact in oropharyngeal cancer. Oral Oncol. 2019, 92, 33–39. [Google Scholar] [CrossRef]
- Oliva, M.; Spreafico, A.; Taberna, M.; Alemany, L.; Coburn, B.; Mesia, R.; Siu, L. Immune biomarkers of response to immune-checkpoint inhibitors in head and neck squamous cell carcinoma. Ann. Oncol. 2019, 30, 57–67. [Google Scholar] [CrossRef] [PubMed]
- Wang, X.; Teng, F.; Kong, L.; Yu, J. PD-L1 expression in human cancers and its association with clinical outcomes. Onco. Targets Ther. 2016, 9, 5023–5039. [Google Scholar] [CrossRef] [Green Version]
- Oldenhuis, C.N.A.M.; Oosting, S.F.; Gietema, J.A.; de Vries, E.G.E. Prognostic versus predictive value of biomarkers in oncology. Eur. J. Cancer 2008, 44, 946–953. [Google Scholar] [CrossRef]


| Variable | N | Overall, N = 65 | Sex | p-Value 1 | |
|---|---|---|---|---|---|
| Men, N = 40 | Women, N = 25 | ||||
| Age at diagnosis | 65 | 0.178 | |||
| Mean (SD) | 65 (13) | 64 (13) | 68 (13) | ||
| Tobacco use | 63 | 0.001 | |||
| Never smoker | 30 (48%) | 11 (29%) | 19 (76%) | ||
| Former smoker | 16 (25%) | 13 (34%) | 3 (12%) | ||
| Current smoker | 17 (27%) | 14 (37%) | 3 (12%) | ||
| Alcohol use | 60 | <0.001 | |||
| Nondrinker | 41 (68%) | 18 (50%) | 23 (96%) | ||
| Former drinker | 7 (12%) | 7 (19%) | 0 (0%) | ||
| Current drinker | 12 (20%) | 11 (31%) | 1 (4.2%) | ||
| Mouth Primary Location | 65 | 23 (35%) | 16 (40%) | 7 (28%) | 0.325 |
| Tongue Primary Location | 65 | 48 (74%) | 26 (65%) | 22 (88%) | 0.040 |
| Tumor status | 63 | 0.162 | |||
| T1 | 13 (21%) | 8 (21%) | 5 (20%) | ||
| T2 | 25 (40%) | 11 (29%) | 14 (56%) | ||
| T3 | 13 (21%) | 10 (26%) | 3 (12%) | ||
| T4 | 12 (19%) | 9 (24%) | 3 (12%) | ||
| Nodal status | 60 | 0.902 | |||
| N0 | 36 (60%) | 21 (60%) | 15 (60%) | ||
| N1 | 8 (13%) | 4 (11%) | 4 (16%) | ||
| N2 | 14 (23%) | 9 (26%) | 5 (20%) | ||
| N3 | 2 (3.3%) | 1 (2.9%) | 1 (4.0%) | ||
| Metastasis status | 60 | 0.688 | |||
| M0 | 53 (88%) | 30 (86%) | 23 (92%) | ||
| M1 | 7 (12%) | 5 (14%) | 2 (8.0%) | ||
| Stage | 63 | 0.656 | |||
| Stage I | 8 (13%) | 6 (16%) | 2 (8.0%) | ||
| Stage II | 13 (21%) | 7 (18%) | 6 (24%) | ||
| Stage III | 28 (44%) | 18 (47%) | 10 (40%) | ||
| Stage IV | 14 (22%) | 7 (18%) | 7 (28%) | ||
| Histological Grade | 65 | 0.513 | |||
| Grade 1: WD | 22 (34%) | 12 (30%) | 10 (40%) | ||
| Grade 2: MD | 37 (57%) | 25 (62%) | 12 (48%) | ||
| Grade 3: PD | 6 (9.2%) | 3 (7.5%) | 3 (12%) | ||
| Oral potentially malignant disorders | 65 | 10 (15%) | 4 (10%) | 6 (24%) | 0.165 |
| Lymphoplasmacytic invasion | 65 | 0.242 | |||
| Nil | 2 (3.1%) | 1 (2.5%) | 1 (4.0%) | ||
| Low | 33 (51%) | 24 (60%) | 9 (36%) | ||
| Moderate | 25 (38%) | 12 (30%) | 13 (52%) | ||
| Intense | 5 (7.7%) | 3 (7.5%) | 2 (8.0%) | ||
| Vascular invasion | 65 | 5 (7.7%) | 4 (10%) | 1 (4.0%) | 0.641 |
| Perineural invasion | 65 | 26 (40%) | 19 (48%) | 7 (28%) | 0.118 |
| WPOI | 65 | 0.275 | |||
| WPOI 1 | 4 (6.2%) | 4 (10%) | 0 (0%) | ||
| WPOI 2 | 30 (46%) | 16 (40%) | 14 (56%) | ||
| WPOI 3 | 20 (31%) | 12 (30%) | 8 (32%) | ||
| WPOI 4 | 4 (6.2%) | 2 (5.0%) | 2 (8.0%) | ||
| WPOI 5 | 7 (11%) | 6 (15%) | 1 (4.0%) | ||
| Risk Score | 65 | 0.029 | |||
| 0–1 | 24 (37%) | 13 (32%) | 11 (44%) | ||
| 2–3 | 18 (28%) | 8 (20%) | 10 (40%) | ||
| 4–7 | 23 (35%) | 19 (48%) | 4 (16%) | ||
| Depth of invasion | 63 | 0.444 | |||
| Median (IQR) | 9 (3, 12) | 10 (4, 12) | 8 (3, 10) | ||
| Depth of invasion | 63 | 0.278 | |||
| Less invasive | 22 (35%) | 13 (33%) | 9 (38%) | ||
| Moderate invasive | 18 (29%) | 9 (23%) | 9 (38%) | ||
| Deeply invasive | 23 (37%) | 17 (44%) | 6 (25%) | ||
| Local recurrence | 65 | 19 (29%) | 9 (22%) | 10 (40%) | 0.131 |
| Regional recurrence | 65 | 6 (9.2%) | 4 (10%) | 2 (8.0%) | >0.999 |
| Distant recurrence | 65 | 2 (3.1%) | 1 (2.5%) | 1 (4.0%) | >0.999 |
| DFS outcome | 65 | 0.152 | |||
| Alive and without recurrence | 26 (40%) | 14 (35%) | 12 (48%) | ||
| Death | 5 (7.7%) | 4 (10%) | 1 (4.0%) | ||
| Death OSCC | 11 (17%) | 10 (25%) | 1 (4.0%) | ||
| Local recurrence | 18 (28%) | 9 (22%) | 9 (36%) | ||
| Regional or Nodal recurrence | 5 (7.7%) | 3 (7.5%) | 2 (8.0%) | ||
| DFS event | 65 | 34 (52%) | 22 (55%) | 12 (48%) | 0.583 |
| DSS outcome | 65 | 0.081 | |||
| Alive with or without recurrence | 33 (51%) | 16 (40%) | 17 (68%) | ||
| Death | 5 (7.7%) | 4 (10%) | 1 (4.0%) | ||
| Death OSCC | 27 (42%) | 20 (50%) | 7 (28%) | ||
| DSS event | 65 | 27 (42%) | 20 (50%) | 7 (28%) | 0.080 |
| OS Outcome | 65 | 0.028 | |||
| Alive with or without recurrence | 33 (51%) | 16 (40%) | 17 (68%) | ||
| Death by any cause | 32 (49%) | 24 (60%) | 8 (32%) | ||
| Overall Survival event | 65 | 32 (49%) | 24 (60%) | 8 (32%) | 0.028 |
| Cox Proportional Hazard Model | ||||||
|---|---|---|---|---|---|---|
| OS: HR (CI 95%) | p-Value | DSS: HR (CI 95%) | p-Value | DFS: HR (CI 95%) | p-Value | |
| PD-1 expression | ||||||
| PD-1-Negative 0% | Ref.Cat. | - | Ref.Cat. | - | Ref.Cat. | - |
| PD-1-Positive > 0% | 0.47 (0.22–1.00) | 0.050 | 0.43 (0.19–0.98) | 0.044 | 0.47 (0.22–0.99) | 0.047 |
| PD-L1 CPS | ||||||
| [0, 1) | Ref.Cat. | - | Ref.Cat. | - | Ref.Cat. | - |
| [1, 20) | 0.78 (0.36–1.67) | 0.522 | 0.94 (0.43–2.01) | 0.873 | 0.59 (0.23–1.51) | 0.276 |
| [20, 100) | 0.25 (0.08–0.803) | 0.019 | 0.59 (0.23–1.51) | 0.276 | 0.23 (0.06–0.82) | 0.024 |
| PD-L1 CPS cutoff > 1% | ||||||
| PD-L1 Negative CPS < =1% | Ref.Cat. | - | Ref.Cat. | - | Ref.Cat. | - |
| PD-L1 Positive CPS > 1 | 0.44 (0.21–0.92) | 0.031 | 0.53 (0.24–1.17) | 0.119 | 0.89 (0.45–1.76) | 0.749 |
| PD-L1 TPS cutoff 10% | ||||||
| PD-L1 ≤ 10% | Ref.Cat. | - | Ref.Cat. | - | Ref.Cat. | - |
| PD-L1 > 10% | 0.36 (0.14–0.94) | 0.037 | 0.33 (0.11–0.98) | 0.046 | 0.71 (0.32–1.57) | 0.401 |
| PD_L1 TPS cutoff 5% | ||||||
| PD-L1 < 5% | Ref.Cat. | - | Ref.Cat. | - | Ref.Cat. | - |
| PD-L1 ≥ 5% | 0.41 (0.17–0.95) | 0.038 | 0.42 (0.16–1.05) | 0.063 | 0.80 (0.39–1.65) | 0.549 |
| PD-L1 TPS cutoffs 5%/10% | ||||||
| PD-L1 < 5% | Ref.Cat. | - | Ref.Cat. | - | Ref.Cat. | - |
| PD-L1 [5–10%) | 1.01 (0.24–4.30) | 0.992 | 1.26 (0.29–5.46) | 0.757 | 0.88 (0.21–3.74) | 0.857 |
| PD-L1 [10–100%] | 0.32 (0.12–0.86) | 0.024 | 0.31 (0.10–0.91) | 0.033 | 0.79 (0.36–1.71) | 0.549 |
| PD-L1 intensity | ||||||
| Nil | Ref.Cat. | - | Ref.Cat. | - | Ref.Cat. | - |
| Low | 0.50 (0.20–1.23) | 0.134 | 0.53 (0.20–1.41) | 0.204 | 0.80 (0.34–1.86) | 0.603 |
| Moderate | 0.43 (0.17–1.05) | 0.063 | 0.45 (0.17–1.20) | 0.112 | 0.62 (0.26–1.48) | 0.280 |
| Intense | 0.21 (0.03–1.66) | 0.139 | 0.26 (0.03–2.08) | 0.204 | 1.02 (0.29–3.57) | 0.968 |
| FOXP3 | ||||||
| [0.02,0.1] | Ref.Cat. | - | Ref.Cat. | - | Ref.Cat. | - |
| (0.1,0.15] | 0.75 (0.32–1.77) | 0.516 | 0.65 (0.25–1.71) | 0.384 | 0.73 (0.31–1.71) | 0.472 |
| (0.15,0.3] | 0.73 (0.31–1.73) | 0.478 | 0.73 (0.29–1.84) | 0.509 | 1.03 (0.47–2.29) | 0.936 |
| CD4 | ||||||
| [0.05,0.25) | Ref.Cat. | - | Ref.Cat. | - | Ref.Cat. | - |
| [0.25,0.35) | 0.80 (0.29–2.20) | 0.674 | 0.84 (0.27–2.58) | 0.757 | 1.37 (0.56–3.34) | 0.484 |
| [0.35,0.50] | 0.78 (0.34–1.81) | 0.569 | 1.01 (0.42–2.45) | 0.976 | 1.01 (0.46–2.21) | 0.984 |
| P16 | ||||||
| Negative | Ref.Cat. | - | Ref.Cat. | - | Ref.Cat. | - |
| Positive | 4.45 (1.04–19.05) | 0.044 | 2.69 (0.36–20.13) | 0.337 | 1.29 (0.17–9.48) | 0.803 |
| CSF1R | ||||||
| [0–8)% | Ref.Cat. | - | Ref.Cat. | - | Ref.Cat. | - |
| [8–100)% | 1.17 (0.57–2.38) | 0.667 | 1.03 (0.47–2.26) | 0.944 | 1.00 (0.50–1.98) | 0.992 |
| CD8 | ||||||
| CD8 [0–10%) Mild | Ref.Cat. | - | Ref.Cat. | - | Ref.Cat. | - |
| CD8 [10–50)% Moderate | 1.51 (0.35–6.45) | 0.582 | 2.59 (0.34–19.53) | 0.358 | 1.60 (0.38–6.74) | 0.522 |
| CD8 ≥ 50% Severe | 1.19 (0.21–6.62) | 0.849 | 2.44 (0.27–22.50) | 0.430 | 1.37 (0.26–7.09) | 0.711 |
| Cox Proportional Hazard Model | ||||||
|---|---|---|---|---|---|---|
| OS: HR (CI 95%) | p-Value | DSS: HR (CI 95%) | p-Value | DFS: HR (CI 95%) | p-Value | |
| Gender | ||||||
| Men | Ref.Cat. | - | Ref.Cat. | - | Ref.Cat. | - |
| Women | 0.49 (0.18–1.31) | 0.157 | 0.52 (0.18–1.47) | 0.215 | 1.01 (0.44–2.30) | 0.988 |
| Tobacco use | ||||||
| Never smoker | Ref.Cat. | - | Ref.Cat. | - | Ref.Cat. | - |
| Former smoker | 1.77 (0.51–6.06) | 0.367 | 2.71 (0.75–9.81) | 0.128 | 1.61 (0.59–4.40) | 0.350 |
| Current smoker | 1.12 (0.35–3.51) | 0.850 | 1.24 (0.36–4.27) | 0.738 | 0.64 (0.23–1.76) | 0.385 |
| Tumor status | ||||||
| T1 + T2 | Ref.Cat. | - | Ref.Cat. | - | Ref.Cat. | - |
| T3 + T4 | 1.10 (0.37–3.33) | 0.861 | 0.99 (0.32–3.11) | 0.990 | 1.30 (0.50–3.40) | 0.586 |
| Metastasis status | ||||||
| M0 | Ref.Cat. | - | Ref.Cat. | - | Ref.Cat. | - |
| M1 | 8.49 (1.90–37.97) | 0.005 | 9.39 (1.85–47.60) | 0.007 | 6.53 (1.59–26.83) | 0.009 |
| Histological Grade | ||||||
| Grade 1: WD | Ref.Cat. | - | Ref.Cat. | - | Ref.Cat. | - |
| Grade2 + 3:MD + PD | 2.96 (1.06–8.29) | 0.039 | 5.29 (1.48–18.96) | 0.010 | 3.46 (1.32–9.03) | 0.011 |
| Stage | ||||||
| Stage I | Ref.Cat. | - | Ref.Cat. | - | Ref.Cat. | - |
| Stage II | 1.14 (0.18–7.05) | 0.887 | 1.98 (0.20–19.70) | 0.558 | 0.72 (0.16–3.22) | 0.667 |
| Stage III | 1.16 (0.20–6.88) | 0.870 | 2.07 (0.21–20.26) | 0.533 | 0.65 (0.14–2.97) | 0.582 |
| Stage IV | 1.25 (0.23–6.77) | 0.793 | 1.98 (0.22–18.06) | 0.543 | 0.99 (0.25–4.02) | 0.994 |
| WPOI | ||||||
| WPOI 1 + 2 + 3 + 4 | Ref.Cat. | - | Ref.Cat. | - | Ref.Cat. | - |
| WPOI 5 | 2.47 (0.56–10.90) | 0.232 | 3.41 (0.74–15.79) | 0.117 | 2.14 (0.51–9.03) | 0.301 |
| PD-1 | ||||||
| PD-1-Negative < 0% | Ref.Cat. | - | Ref.Cat. | - | Ref.Cat. | - |
| PD-1-Positive > 0% | 0.54 (0.20–1.48) | 0.232 | 0.52 (0.18–1.51) | 0.232 | 0.36 (0.14–0.93) | 0.034 |
| PD-L1 TPS cutoff 10% | ||||||
| PD-L1 ≤ 10% | Ref.Cat. | - | Ref.Cat. | - | Ref.Cat. | - |
| PD-L1 > 10% | 0.35 (0.11–1.14) | 0.081 | 0.40 (0.12–1.35) | 0.139 | 0.87 (0.35–2.13) | 0.757 |
Publisher’s Note: MDPI stays neutral with regard to jurisdictional claims in published maps and institutional affiliations. |
© 2022 by the authors. Licensee MDPI, Basel, Switzerland. This article is an open access article distributed under the terms and conditions of the Creative Commons Attribution (CC BY) license (https://creativecommons.org/licenses/by/4.0/).
Share and Cite
Peña-Cardelles, J.F.; Pozo-Kreilinger, J.J.; Roncador, G.; Esteban-Hernández, J.; Moro-Rodríguez, J.E.; Sastre-Perona, A.; Castelo-Fernández, B.; Cebrián-Carretero, J.L. Prognosis Value of Immunoregulatory Molecules in Oral Cancer Microenvironment: An Immunohistochemical Study. Biomedicines 2022, 10, 710. https://doi.org/10.3390/biomedicines10030710
Peña-Cardelles JF, Pozo-Kreilinger JJ, Roncador G, Esteban-Hernández J, Moro-Rodríguez JE, Sastre-Perona A, Castelo-Fernández B, Cebrián-Carretero JL. Prognosis Value of Immunoregulatory Molecules in Oral Cancer Microenvironment: An Immunohistochemical Study. Biomedicines. 2022; 10(3):710. https://doi.org/10.3390/biomedicines10030710
Chicago/Turabian StylePeña-Cardelles, Juan Francisco, José Juan Pozo-Kreilinger, Giovanna Roncador, Jesús Esteban-Hernández, José Ernesto Moro-Rodríguez, Ana Sastre-Perona, Beatriz Castelo-Fernández, and José Luis Cebrián-Carretero. 2022. "Prognosis Value of Immunoregulatory Molecules in Oral Cancer Microenvironment: An Immunohistochemical Study" Biomedicines 10, no. 3: 710. https://doi.org/10.3390/biomedicines10030710