Article

Calculated Tumor-Associated Neutrophils Are Associated with the Tumor—Stroma Ratio and Predict a Poor Prognosis in Advanced Gastric Cancer

1
Department of Surgery, Uijeongbu St. Mary Hospital, College of Medicine, The Catholic University of Korea, Seoul 06591, Korea
2
Department of Hospital Pathology, Uijeongbu St. Mary Hospital, College of Medicine, The Catholic University of Korea, Seoul 06591, Korea
*
Author to whom correspondence should be addressed.
Biomedicines 2022, 10(3), 708; https://doi.org/10.3390/biomedicines10030708
Submission received: 28 February 2022 / Revised: 17 March 2022 / Accepted: 17 March 2022 / Published: 18 March 2022
(This article belongs to the Special Issue Gastric Cancer: From Mechanisms to Therapeutic Approaches)

Abstract

:
The tumor-associated neutrophils (TANs) value and tumor—stroma ratio (TSR) are promising prognostic parameters in the tumor microenvironment. We aimed to evaluate the prognostic role and relationship of TANs and TSR in gastric cancer. Our study comprised 157 patients who underwent gastrectomy for advanced gastric cancer. TANs were assessed by immunohistochemical staining (CD15 and CD66b) and were analyzed with an image analyzer. TANs have been known to have different functional subpopulations of N1 (anti-tumor) and N2 (pro-tumor). We developed “calculated TANs with pro-tumor function (cN2; CD15 minus CD66b)”. The TSR was evaluated using hematoxylin and eosin staining. High-grade CD15-positive, cN2 in the tumor center, and TSR were significantly related to poor disease-free survival (DFS). TSR and cN2 were independent prognostic factors for DFS (hazard ratio (HR) = 2.614; p = 0.001, HR = 3.976; p = 0.002) and cN2 in the tumor center showed a positive correlation with TSR (R = 0.179, p = 0.025). While CD66b stained both N1 and N2, CD15 detected most of N2. Combining both markers revealed a novel cN2, which was an independent marker of poor prognosis. The transformation from N1 to N2 predominantly occurred in the tumor center, and was associated with TSR.

1. Introduction

Recently, tailored precision treatment such as immunotherapy has emerged as a novel strategy in gastric cancer treatment [1]. The investigation and characterization of the tumor microenvironment (TME) is a fundamental aspect of selecting personalized immunotherapeutic approaches, because TME significantly influences the therapeutic response and clinical outcome [2,3,4]. TME is a complex system composed of various cell types including tumor cells, endothelial cells, stromal cells (cancer-associated fibroblasts (CAFs)), immune cells (macrophages, lymphocytes, natural killer (NK) cells, and neutrophils), and extracellular components (cytokines, growth factors, hormones, and extracellular matrix) [2,4,5,6,7].
Tumor-associated neutrophils (TANs) represent a predominant proportion of the immune infiltrate in a variety of cancer types, including lung cancer, gastric cancers, colorectal cancer, hepatocellular carcinoma, and head and neck cancer [4]. TANs have been implicated in cancer initiation and progression, and have been identified as potential prognostic markers of various cancers [4,8,9,10]. However, previous studies that have explored the associations between TANs and gastric cancer outcomes have revealed heterogeneous results, as there are rare studies supporting both pro-tumor and anti-tumor effects of these cells in gastric cancer [11,12,13,14,15,16]. These diverse effects of TANs may come from neutrophil polarization (N1: anti-tumor function; N2: pro-tumor function) toward diametrically opposed phenotypes in response to several signals in the TME [17,18]. These studies revealed the multifaceted functional roles of TANs in different tumors, as well as in the different stages of the same tumor, although the precise mechanisms underlying TAN functions are still obscure [17,18,19].
The growing interest in TME research has also revealed the tumor—stroma ratio (TSR) (which is based on the proportions of stroma to tumor area) to be a novel potential prognostic factor in cancers [20]. Several recent reports have focused on the association between TSR and CAFs [5,20,21]. Recent studies have also investigated the interaction between CAFs and tumor-infiltrating cells, specifically TANs, within the tumor immune microenvironment, a relationship that has been identified as another key factor in promoting tumor progression [6,22,23,24]. In this process, CAFs may be able to induce the polarization of TANs to an N2 phenotype by modulating tumor cells [6]. However, the results have been limited and there have been few studies in gastric cancer [16].
In this study, we aimed to evaluate the prognostic role of TANs and their association with clinicopathological features. We also investigated the relationship between TANs and TSR in gastric cancer after gastrectomy.

2. Materials and Methods

2.1. Patients and Clinicopathological Data

A total of 157 patients with advanced gastric cancer, who underwent a gastrectomy at Uijeongbu St. Mary’s Hospital between January 2011 and December 2017, were enrolled in this study. The cohort was comprised of 150 patients who had curative surgery and 7 patients who had palliative surgery. The clinicopathological parameters were evaluated retrospectively from electronic medical records and included disease-free survival (DFS), overall survival (OS), cancer-specific survival (CSS), age, sex, size, tumor differentiation, and tumor node metastasis (TNM) stage (according to eighth TNM staging manual published by the American Joint Committee on Cancer) [25], as well as lymphatic, venous, and perineural invasion. Informed consent was obtained from all subjects involved in the study. This study was approved by the Institutional Review Board of the College of Medicine at the Catholic University of Korea (UC21SISI0011).

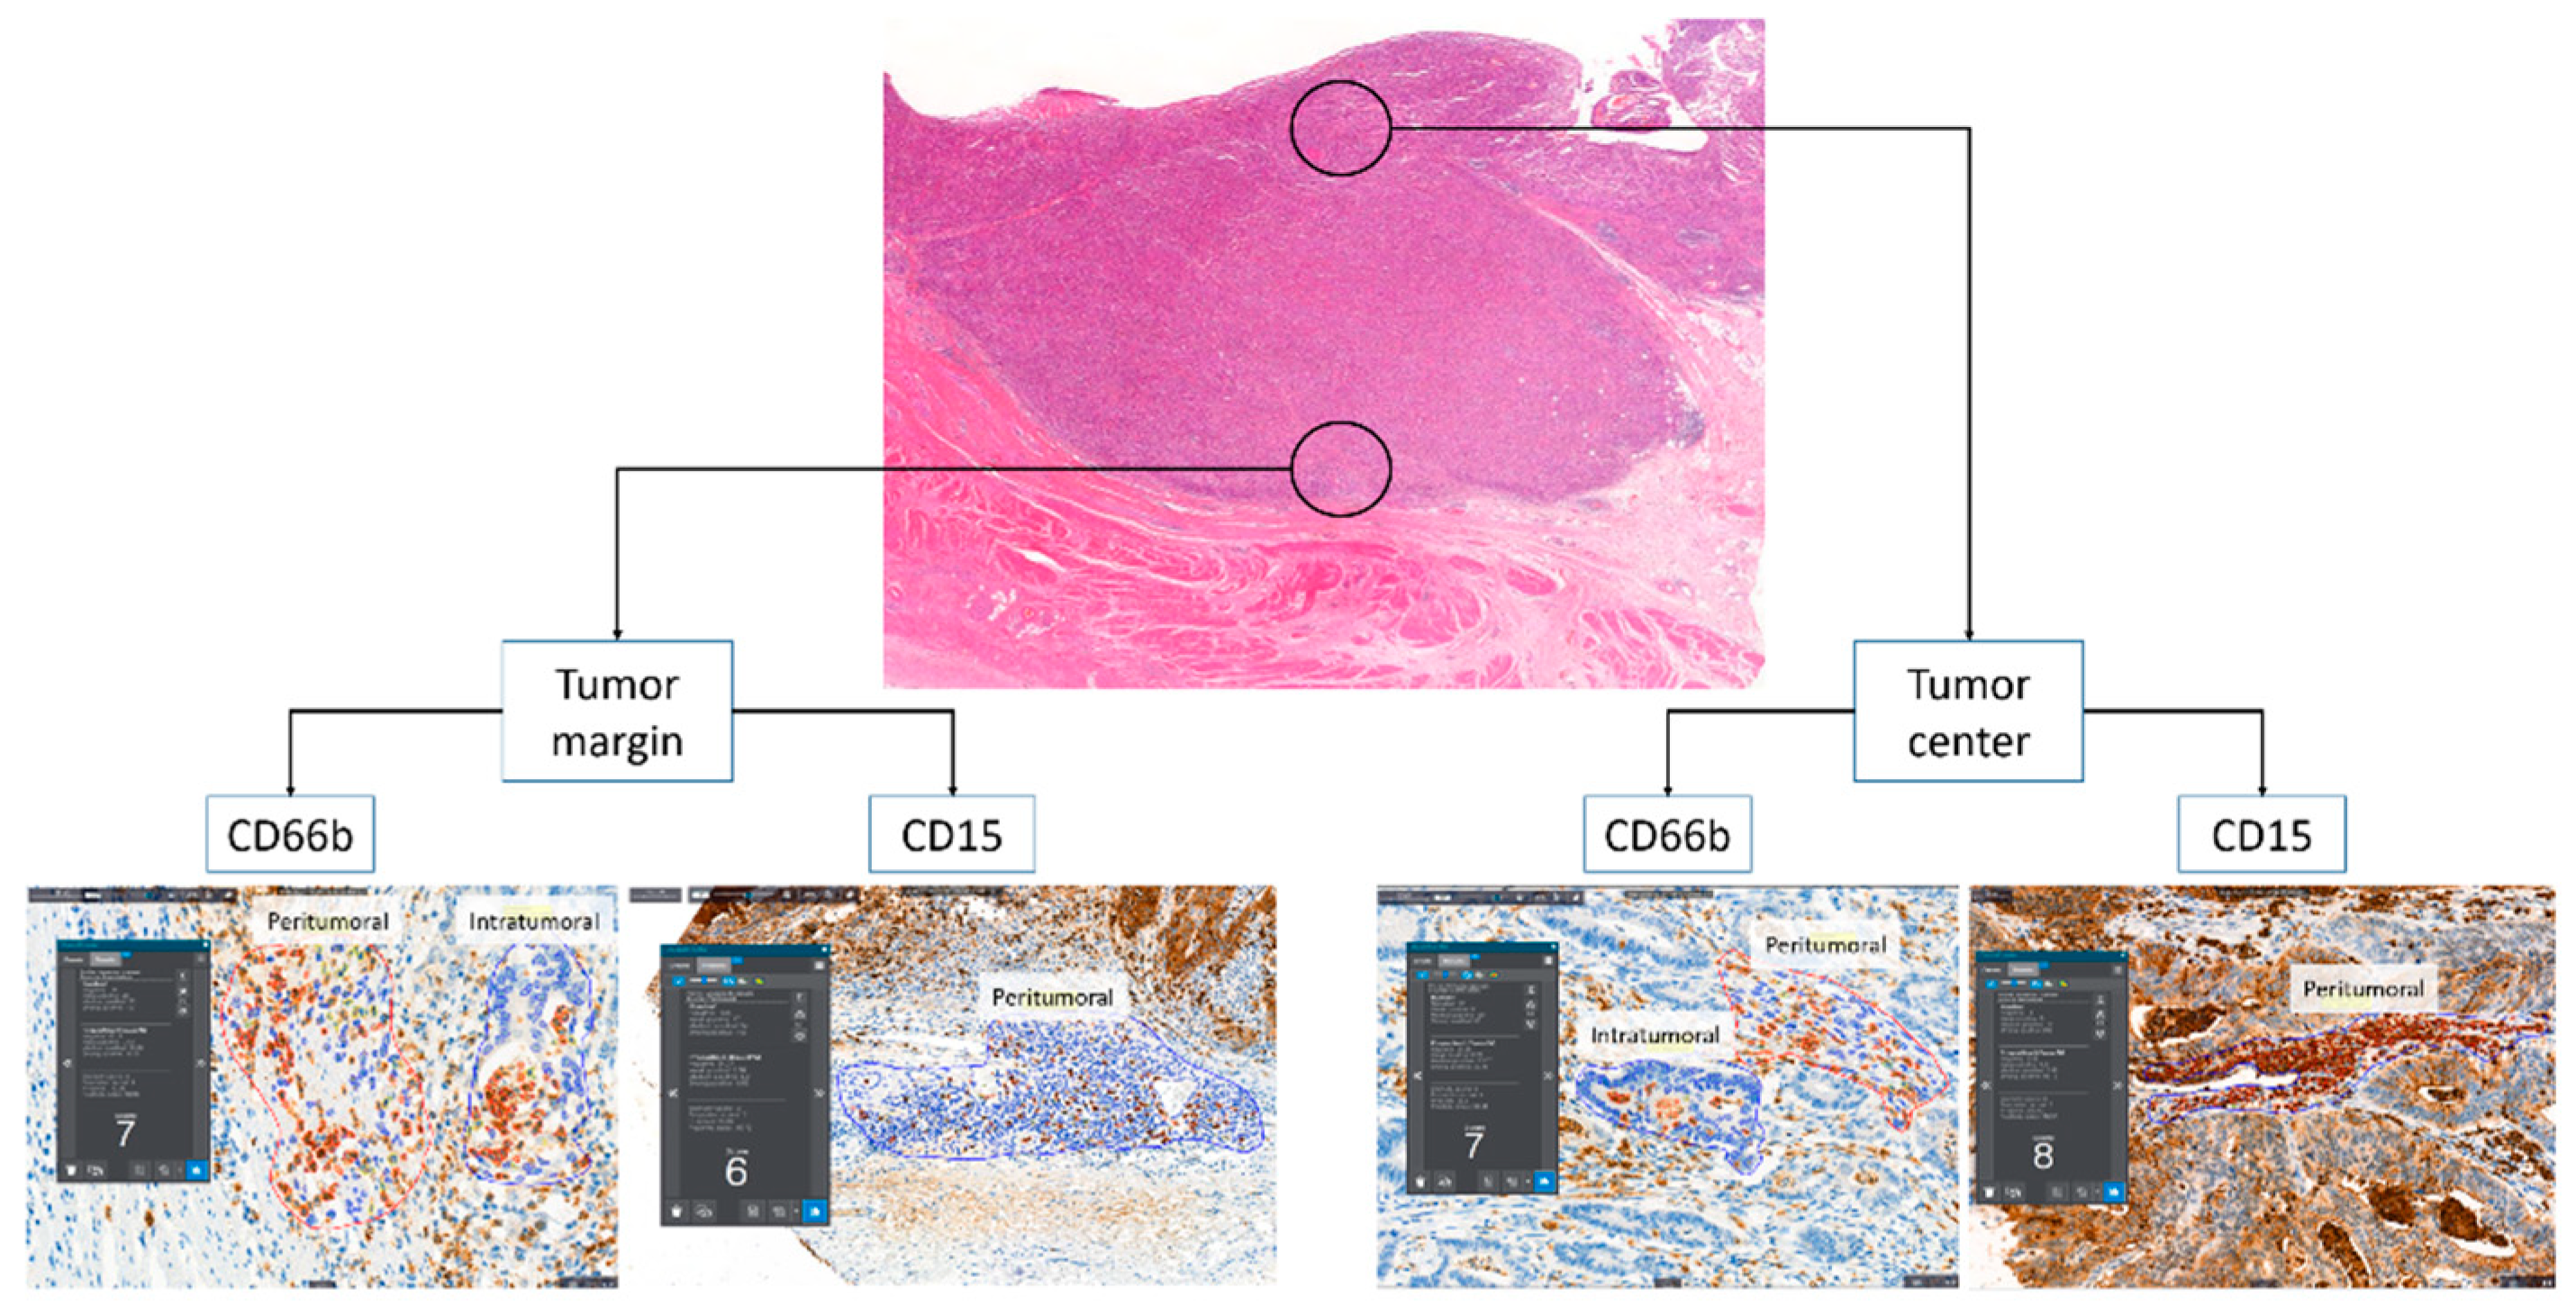
2.2. Tissue Microarray and Immunohistochemistry

Tissue microarrays were constructed for immunohistochemistry (IHC). Two tissue cores (3 mm) were obtained from two representative paraffin block-embedded tumor compartments (at the tumor margin and center; Figure 1). IHC staining was performed on an automated Ventana Benchmark XT platform (Roche Diagnostics, Basel, Switzerland) using monoclonal antibodies against CD15 (FDA-approved Ventana PATHWAY, MMA clone) and CD66b (1:100, 555723 [G10F5], BD biosciences, Franklin Lakes, NJ, USA), and the Ventana ultraVIEW DAB Detection Kit (Roche Diagnostics, Basel, Switzerland).

2.3. Image Analysis of Immunohistochemistry

IHC-stained neutrophils were counted using an image analyzer (Quant Center, 3DHISTECH, Budapest, Hungary). We selected hotspots with the most active neutrophils in the two representative tumor microenvironment areas (peritumoral and intratumoral) from the CD66b analysis (Figure 1). As the CD15 antibody stained both tumor cells and neutrophils, only peritumoral neutrophils could be analyzed (Figure 1). We calculated the average number of neutrophils per area, from areas of at least 0.1 mm2.

2.4. Tumor—Stroma Ratio (TSR)

TSR was assessed in hematoxylin and eosin (HE) stained slides at the invasive front to evaluate CAFs [5,26]. Three expert pathologists (J.A.G., Y.C. and K.Y.) independently examined each tumor section. When an ulcer was found, we excluded that section to avoid misinterpreting fibroblasts associated with ulcer-induced fibrosis as CAFs.

2.5. Statistical Analysis

The Chi-squared (χ2) test and Fisher’s exact test were used to compare low- and high-grade calculated N2 (cN2) and TSR data with clinicopathological factors. Continuous data were converted to categorical variables using cutoff values, where the sum of the sensitivity and specificity was maximized for the prediction of DFS using a time-dependent receiver operating characteristic (ROC) curve. For multivariate cox regression analyses, we used the variables that were significantly associated with DFS in a Kaplan—Meier curve analysis by log-rank tests. To minimize overfitting [27], we used lymphovascular perineural invasion (LVPI) as a parameter, which is calculated by combining lymphatic invasion, venous invasion, and perineural invasion instead of using each factor as an independent variable. Age, TNM stage, tumor size, and LVPI were used as compounding factors, to which cN2 and TSR were added one by one. Two-sided p values < 0.05 were considered statistically significant. All of the analyses were performed using SPSS software (version 20.0; IBM, Armonk, NY, USA) and R statistical programming (version 3.4.1; http//www.r-project.org, accessed on 7 March 2022).

3. Results

3.1. Prognostic Value of TANs and Establishment of cN2

Our analyses indicated that neutrophils detected by the CD66b antibody were not associated with DFS, OS, or CSS. However, CD66b-postive neutrophils had a tendency to be associated with a good prognosis when located in the tumor margin and peritumoral area of the tumor center, but were correlated with a poor prognosis when the cells were present in the intratumoral area of the tumor center, although these results were not statistically significant (Table 1 and Supplementary Figure S1). The number of neutrophils stained by the CD15 antibody were correlated with poor DFS, OS, and CSS when the cells were located in the tumor margin and center (p = 0.006 and p = 0.002 in DFS, p = 0.001 and p = 0.009 in OS, and p = 0.014 and p = 0.011 in CSS; Table 1 and Supplementary Figure S1).
By combining the values from both CD15- and CD66b-positive staining, we developed a measurement that we call “calculated TANs with pro-tumor function (cN2)”. The cN2 value is defined as the number of CD66b-postive cells subtracted from the number of CD15-positive cells.

3.2. Clinicopathologic Characteristics Associated with cN2 and TSR in Patients with Advanced Gastric Cancer

Recurrence occurred in 62 patients (39.5%), death in 100 (63.7%), and cancer-specific death in 63 (40.1%) out of 157 patients. Recurrence, death, cancer-specific death, advanced pT stage, and lymphatic and perineural invasion were significantly associated with high-grade cN2. High-grade TSR had a significant relationship with recurrence, death, cancer-specific death, advanced pT stage, pN stage, pM stage, and pTNM stage, as well as lymphatic, venous, and perineural invasion (Table 2).

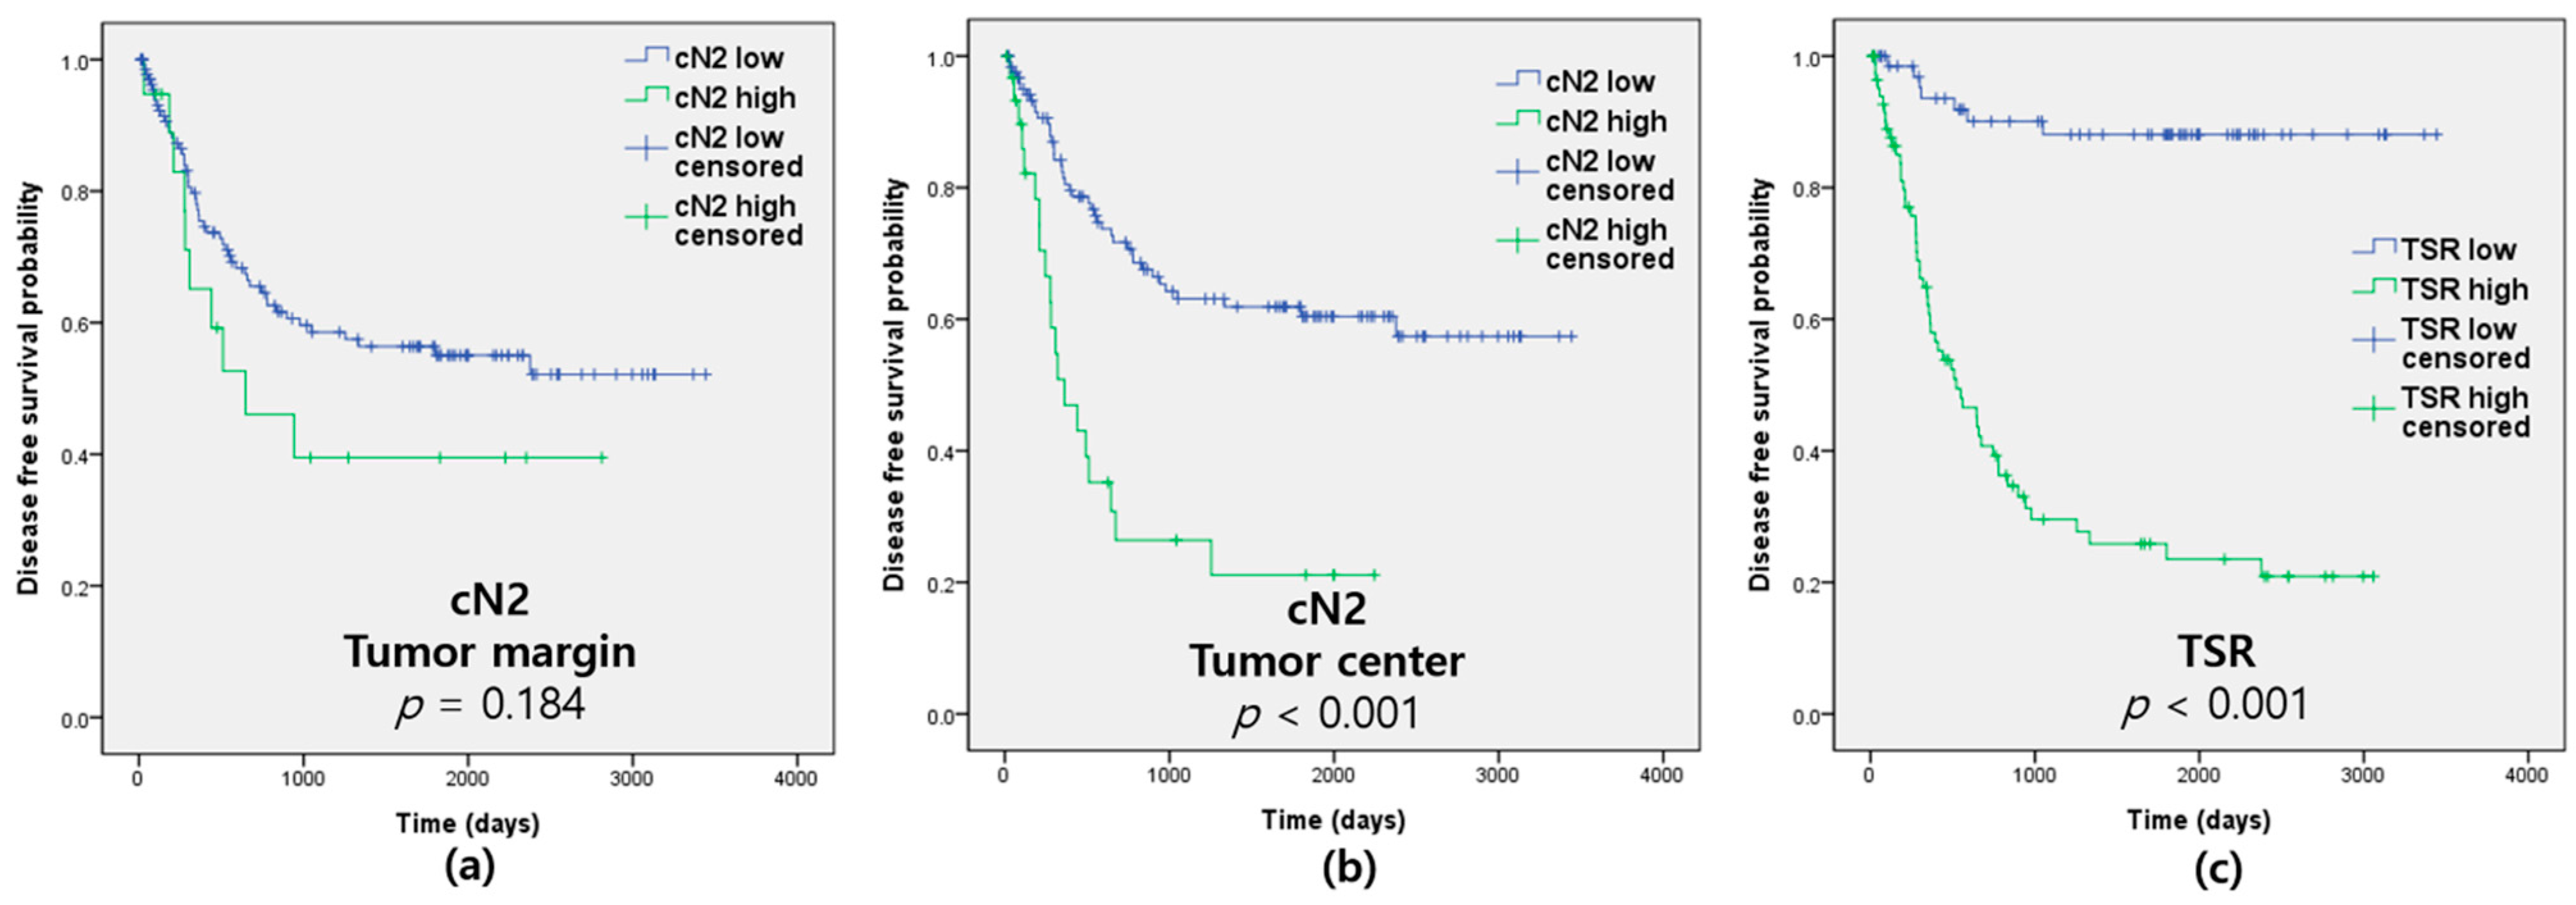
3.3. Prognostic Value of cN2 and TSR in Patients with Advanced Gastric Cancer

The cN2 value was associated with a poor DFS for cells located in the tumor center (p < 0.001) but not in the tumor margin (p = 0.184; Figure 2 and Table 1). High-grade TSR was revealed to be a marker of poor DFS, OS, and CSS (p < 0.001, p < 0.001, and p < 0.001; Figure 2 and Table 1). pTNM stage, lymphatic, venous and perineural invasion, tumor size, and neutrophils detected by CD15 were also significantly associated with prognosis (Table 3).

3.4. Multivariate Cox Proportional Hazards Model and Correlation between TANs and TSR

High-grade cN2 was an independent predictor of poor DFS for cells located in the tumor center (p = 0.001), but not in the tumor margin (p = 0.860). High-grade TSR was also an independent marker of poor prognosis (p = 0.002; Table 3). Neutrophils detected by CD66b (data not shown) and CD15 individually were not independent prognostic factors (Table 3). TSR was positively correlated with the cN2 value in the tumor center (R = 0.179, p = 0.025) and was negatively correlated with CD66b-positive neutrophils in the intratumoral area at the tumor margin (R = −0.185, p = 0.020; Table 4).

4. Discussion

Our study demonstrated that the cN2 value is an independent marker of a poor prognosis for DFS and OS (Table 3). To the best of our knowledge, this is the first study to reveal that different antibodies can detect distinct neutrophils with opposite prognostic effects. Furthermore, we also established a novel marker, cN2, which is an independent predictor of a poor prognosis.
The role of TANs in the TME remains controversial, with evidence for both pro- and anti-tumor roles [28]. In several studies, high densities of TANs were independently associated with an unfavorable prognosis [8,12,16,29,30,31]. However, there have also been studies that have reported TANs as a favorable prognostic factor or demonstrated no relationship between TANs and prognosis [8,11,13,14,15,32]. Even in the same cancer, the prognostic trends have not been consistent [8]. The dual functions of TANs originate from the plasticity of neutrophils in response to a variety of stimuli [33,34]. TAN polarization probably exists as a spectrum of activation states, rather than only two extremes; namely the N1 or N2 categories [35]. This dual function is likely a reflection of their unexpected plasticity in response to environmental cues, such as transforming growth factor β (TGF-β) and interferon β (IFN-β) [17].
The markers used to identify TANs (such as CD66b, CD15, myeloperoxidase, and cell morphology by HE staining) may explain these discrepancies, at least partly [11,12,13,14,15,16,29,30,31,32,36,37]. The expression of these markers in neutrophils may vary, resulting in different prognostic effects [9]. CD15 is expressed in neutrophils, eosinophils, some monocytes, and occasionally in tumor cells [38]. It is also a differentiation marker found on all neutrophil subpopulations [39]. CD66b immunoreactivity is found on both neutrophils and eosinophils, and is recognized as a granulocyte activation marker and neutrophil lineage marker [39,40]. In the present study, we evaluated both CD66b- and CD15-postive TANs simultaneously, and revealed that they identified TANs with the opposite prognostic effects, using different immunostaining markers.
We revealed that high-grade CD66b-positive TANs have different prognostic effects according to the tumor compartments or microenvironments. In the majority of previously reported studies, the average numbers of CD66b-postive TANs without differentiating by compartment or microenvironments were analyzed, and variously described a high density of CD66b-postive TANs as having good [13,14], poor [16,31], or not significant [32] prognostic factors. In the present study, we revealed that a high density of CD66b-positive TANs in the intratumoral area of the tumor central compartment was associated with a trend toward poor survival; however, the same cells located in other areas showed good survival trends, although they were not statistically significant (data not shown). These results suggest that if previous researchers focused their analyses on the intratumoral area of the central compartment, they would have found CD66-postive TANs to be a poor prognostic factor; while if they evaluated other areas, they would have identified CD66-postive TANs to be a good prognostic factor. Therefore, it is necessary to evaluate TANs within different tumor compartments and microenvironments, at least in gastric cancer.
Li et al. and Liu et al. evaluated the CD66b-positive TANs only with the tumor compartment, and not the tumor microenvironment areas [30,36]. When Li et al. divided their tumor analyses based on the invasive margin and tumor center, their multivariate analyses revealed that a high level of CD66b-postive TANs in the invasive margin was an independent marker of poor prognosis, but not when the cells were located in the tumor center [30]. In addition, Liu et al. evaluated TANs in the tumor center and the invasive border of the tumor compared to normal tissues [36]. In the univariate analysis, they showed that high-grade CD66b-positive TANs were associated with a poor prognosis in normal tissue and the tumor center, but a good prognosis when cells were found at the invasive border. They also established a ratio of CD66b-postive TANs between the tumor center and the invasive border, and showed that it was an independent marker of a poor prognosis [36]. In the present study, high-grade CD66b-postive TANs (combining peritumoral and intratumoral) were a significantly good survival marker in the tumor margin (p = 0.044), but not significant in the tumor center (p = 0.011), with trends toward poor survival in the univariate analysis, while the results were not significant in the multivariate analysis in both tumor regions (margin: p = 0.066, center: p = 0.850; data not shown). These findings were similar to those reported by Liu et al. [36], but did not match those from Li et al. [30]. The results of the ratio between the tumor center and the margin were similar only in the univariate analysis (p = 0.006), but there was no significance in the multivariate analysis (p = 0.538) (data not shown). One reason that our results differ from those of Li et al. may be that we analyzed different populations or employed different methods of screening. In each slide, we only selected the most active hotspots in the intratumoral and peritumoral areas, and used an automated analyzer to obtain more objective results.
In contrast to the CD66 expression, CD15-positive TANs displayed poor prognostic effects in all previous studies that analyzed the mean number of TANs without differentiating regions or areas [12,29,31]. Similarly, we revealed that high-grade CD15-positive TANs were a poor prognostic marker. Furthermore, because CD15 also stained the tumor cells, we could only evaluate TANs in the peritumoral area.
In the present study, we established the cN2 measurement by focusing on the tendency for CD15 to stain more N2 cells compared to CD66b, which stained both N1 and N2 cells (but stained more N1 cells). As a result, cN2 is a poor prognostic factor in the tumor center, and CD66b and CD15 alone could not predict prognosis, as only the univariate analysis suggested they might be significant markers. In contrast, cN2 was shown to be an independent prognostic factor in the tumor center. We also revealed that the transformation from N1 to N2 predominantly occurred in the tumor center, as suggested by Mishalian et al. [41]. These authors reported that neutrophils remain predominantly located at the edges of the tumor and have an N1 phenotype at early stages. However, as the tumor progresses, neutrophils are often found deeper within the tumor and possess an N2 phenotype, which supports tumor growth [41].
We demonstrate that cN2 is closely correlated with clinicopathological factors such as T stage, and lymphatic and perineural invasion. In contrast, Wang et al. suggested that TANs may help to estimate lymph node metastasis in early gastric cancer [37]. Abe et al. revealed that in Epstein–Barr virus-associated gastric cancer, a high density of CD66b-positive cells is associated with intestinal-type histology and a low frequency of lymph node metastasis [32]. In the present study, there was no association with pN or with intestinal type. We presume that this is because the previous study evaluated early gastric cancer, and they measured TANs primarily by HE staining with the aid of myeloperoxidase IHC. In this study, we established the cN2 measurement using CD66b and CD15 IHC analyses that were evaluated with an image analyzer.
In addition, we found that TSR is an independent predictor of a poor prognosis. In particular, fibrosis in the tumor center also appeared to play an important role in the transformation of neutrophils from an N1 to N2 phenotype. Accordingly, as stroma-rich tumors have more CAFs, they could reasonably benefit from greater support of tumor growth [21]. The cancer stroma, as exemplified by CAFs, plays critical roles in cancer invasion and metastasis [5]. TGF-β by itself stimulates an N2 phenotype and inhibits N1 phenotypic polarization in neutrophils, whereas IFN-β stimulates N1 while inhibiting N2 polarization [10,19,42]. CAF-mediated TGF-β signaling redirects TAN differentiation toward the N2 phenotype. Conversely, a TGF-β blockade attenuates tumor growth via TAN polarization to an anti-tumor N1 phenotype, thereby providing additive strategies for cancer therapies [43].
Our study included a relatively small number of patients analyzed by retrospective data collection. Further prospective research on a larger scale is required to confirm our findings. However, as we collected and analyzed all of the gastric cancer cases in one institution over the course of six years, our study cohort might well reflect the results of real-world practice. In addition, interobserver variations may exist in the interpretation of TSR. To overcome this weakness, in the present study, TSR was evaluated independently by three expert pathologists (J.A.G., Y.C. and K.Y.) Finally, while we suggest that the cN2 value represents N2 neutrophils, we do not have definitive evidence that cN2 only detects N2 cells. Further studies are required to confirm that cN2 represents only the N2 population.

5. Conclusions

CD66b stained both the N1 and N2 populations of neutrophils; however, CD15 detected more N2 cells. By combining both markers, we outline a novel measurement, cN2 (CD15 minus CD66), that is an independent marker of a poor prognosis. The transformation from N1 to N2 occurred predominantly in the tumor center and was associated with the TSR.

Supplementary Materials

The following supporting information can be downloaded at: https://www.mdpi.com/article/10.3390/biomedicines10030708/s1, Supplementary Figure S1: Disease-free survival according to tumor-associated neutrophils detected with CD66b and CD15.

Author Contributions

Conceptualization, E.Y.K. and K.Y.; methodology, E.Y.K., K.Y., J.A.-G. and Y.C.; validation, E.Y.K. and K.Y.; formal analysis, E.Y.K. and K.Y.; investigation, E.Y.K., K.Y., J.A.-G. and Y.C.; data curation, E.Y.K., K.Y., J.A.-G. and Y.C.; writing—original draft preparation, E.Y.K. and K.Y.; writing—review and editing, E.Y.K. and K.Y.; visualization, E.Y.K. and K.Y.; supervision, K.Y.; project administration, E.Y.K. and K.Y.; funding acquisition, E.Y.K. and K.Y. All authors have read and agreed to the published version of the manuscript.

Funding

This research was supported by the Basic Science Research Program through the National Research Foundation of Korea (NRF) funded by the Ministry of Education (2021R1I1A1A01060037). The authors wish to acknowledge the financial support of The Catholic University of Korea, Uijeongbu St. Mary’s Hospital Clinical Research Laboratory Foundation made in the program year of 2022 (UJBCRL202205).

Institutional Review Board Statement

The study was conducted in accordance with the Declaration of Helsinki, and was approved by the Institutional Review Board of the College of Medicine at the Catholic University of Korea (UC21SISI0011 and 18 February 2021).

Informed Consent Statement

Informed consent was obtained from all subjects involved in the study.

Data Availability Statement

Data can be made available upon reasonable request.

Conflicts of Interest

The authors declare no conflict of interest.

References

  1. Murciano-Goroff, Y.R.; Warner, A.B.; Wolchok, J.D. The future of cancer immunotherapy: Microenvironment-targeting combinations. Cell Res. 2020, 30, 507–519. [Google Scholar] [CrossRef] [PubMed]
  2. Wu, T.; Dai, Y. Tumor microenvironment and therapeutic response. Cancer Lett. 2017, 387, 61–68. [Google Scholar] [CrossRef] [PubMed]
  3. Dolcetti, R.; De Re, V.; Canzonieri, V. Immunotherapy for Gastric Cancer: Time for a Personalized Approach? Int. J. Mol. Sci. 2018, 19, 1602. [Google Scholar] [CrossRef] [PubMed] [Green Version]
  4. Bejarano, L.; Jordāo, M.J.C.; Joyce, J.A. Therapeutic Targeting of the Tumor Microenvironment. Cancer Discov. 2021, 11, 933–959. [Google Scholar] [CrossRef]
  5. Lee, D.; Ham, I.H.; Son, S.Y.; Han, S.U.; Kim, Y.B.; Hur, H. Intratumor stromal proportion predicts aggressive phenotype of gastric signet ring cell carcinomas. Gastric Cancer 2017, 20, 591–601. [Google Scholar] [CrossRef] [Green Version]
  6. Mao, X.; Xu, J.; Wang, W.; Liang, C.; Hua, J.; Liu, J.; Zhang, B.; Meng, Q.; Yu, X.; Shi, S. Crosstalk between cancer-associated fibroblasts and immune cells in the tumor microenvironment: New findings and future perspectives. Mol. Cancer 2021, 20, 131. [Google Scholar] [CrossRef]
  7. Yim, K.; Jang, W.M.; Lee, S.H. Modified Tumor Budding as a Better Predictor of Lymph Node Metastasis in Early Gastric Cancer: Possible Real-World Applications. Cancers 2021, 13, 3405. [Google Scholar] [CrossRef]
  8. Shen, M.; Hu, P.; Donskov, F.; Wang, G.; Liu, Q.; Du, J. Tumor-associated neutrophils as a new prognostic factor in cancer: A systematic review and meta-analysis. PLoS ONE 2014, 9, e98259. [Google Scholar] [CrossRef] [Green Version]
  9. Coffelt, S.B.; Wellenstein, M.D.; de Visser, K.E. Neutrophils in cancer: Neutral no more. Nat. Rev. Cancer 2016, 16, 431–446. [Google Scholar] [CrossRef] [Green Version]
  10. Shaul, M.E.; Fridlender, Z.G. Tumour-associated neutrophils in patients with cancer. Nat. Rev. Clin. Oncol. 2019, 16, 601–620. [Google Scholar] [CrossRef]
  11. Caruso, R.A.; Bellocco, R.; Pagano, M.; Bertoli, G.; Rigoli, L.; Inferrera, C. Prognostic value of intratumoral neutrophils in advanced gastric carcinoma in a high-risk area in northern Italy. Mod. Pathol. 2002, 15, 831–837. [Google Scholar] [CrossRef] [PubMed]
  12. Zhao, J.J.; Pan, K.; Wang, W.; Chen, J.G.; Wu, Y.H.; Lv, L.; Li, J.J.; Chen, Y.B.; Wang, D.D.; Pan, Q.Z.; et al. The prognostic value of tumor-infiltrating neutrophils in gastric adenocarcinoma after resection. PLoS ONE 2012, 7, e33655. [Google Scholar] [CrossRef] [PubMed]
  13. Huang, X.; Pan, Y.; Ma, J.; Kang, Z.; Xu, X.; Zhu, Y.; Chen, J.; Zhang, W.; Chang, W.; Zhu, J. Prognostic significance of the infiltration of CD163(+) macrophages combined with CD66b(+) neutrophils in gastric cancer. Cancer Med. 2018, 7, 1731–1741. [Google Scholar] [CrossRef] [PubMed] [Green Version]
  14. Zhang, H.; Liu, H.; Shen, Z.; Lin, C.; Wang, X.; Qin, J.; Qin, X.; Xu, J.; Sun, Y. Tumor-infiltrating Neutrophils is Prognostic and Predictive for Postoperative Adjuvant Chemotherapy Benefit in Patients with Gastric Cancer. Ann. Surg. 2018, 267, 311–318. [Google Scholar] [CrossRef] [PubMed]
  15. Clausen, F.; Behrens, H.M.; Krüger, S.; Röcken, C. Sexual dimorphism in gastric cancer: Tumor-associated neutrophils predict patient outcome only for women. J. Cancer Res. Clin. Oncol. 2020, 146, 53–66. [Google Scholar] [CrossRef] [PubMed] [Green Version]
  16. Cong, X.; Zhang, Y.; Zhu, Z.; Li, S.; Yin, X.; Zhai, Z.; Zhang, Y.; Xue, Y. CD66b(+) neutrophils and α-SMA(+) fibroblasts predict clinical outcomes and benefits from postoperative chemotherapy in gastric adenocarcinoma. Cancer Med. 2020, 9, 2761–2773. [Google Scholar] [CrossRef] [Green Version]
  17. Jaillon, S.; Ponzetta, A.; Di Mitri, D.; Santoni, A.; Bonecchi, R.; Mantovani, A. Neutrophil diversity and plasticity in tumour progression and therapy. Nat. Rev. Cancer 2020, 20, 485–503. [Google Scholar] [CrossRef]
  18. Ohms, M.; Möller, S.; Laskay, T. An Attempt to Polarize Human Neutrophils Toward N1 and N2 Phenotypes in vitro. Front. Immunol. 2020, 11, 532. [Google Scholar] [CrossRef]
  19. Wang, X.; Qiu, L.; Li, Z.; Wang, X.Y.; Yi, H. Understanding the Multifaceted Role of Neutrophils in Cancer and Autoimmune Diseases. Front. Immunol. 2018, 9, 2456. [Google Scholar] [CrossRef]
  20. Wu, J.; Liang, C.; Chen, M.; Su, W. Association between tumor-stroma ratio and prognosis in solid tumor patients: A systematic review and meta-analysis. Oncotarget 2016, 7, 68954–68965. [Google Scholar] [CrossRef] [Green Version]
  21. Kemi, N.; Eskuri, M.; Herva, A.; Leppänen, J.; Huhta, H.; Helminen, O.; Saarnio, J.; Karttunen, T.J.; Kauppila, J.H. Tumour-stroma ratio and prognosis in gastric adenocarcinoma. Br. J. Cancer 2018, 119, 435–439. [Google Scholar] [CrossRef] [PubMed] [Green Version]
  22. Cheng, Y.; Li, H.; Deng, Y.; Tai, Y.; Zeng, K.; Zhang, Y.; Liu, W.; Zhang, Q.; Yang, Y. Cancer-associated fibroblasts induce PDL1+ neutrophils through the IL6-STAT3 pathway that foster immune suppression in hepatocellular carcinoma. Cell Death Dis. 2018, 9, 422. [Google Scholar] [CrossRef] [PubMed]
  23. Sahai, E.; Astsaturov, I.; Cukierman, E.; DeNardo, D.G.; Egeblad, M.; Evans, R.M.; Fearon, D.; Greten, F.R.; Hingorani, S.R.; Hunter, T.; et al. A framework for advancing our understanding of cancer-associated fibroblasts. Nat. Rev. Cancer 2020, 20, 174–186. [Google Scholar] [CrossRef] [Green Version]
  24. Tsai, Y.M.; Wu, K.L.; Liu, Y.W.; Chang, W.A.; Huang, Y.C.; Chang, C.Y.; Tsai, P.H.; Liao, S.H.; Hung, J.Y.; Hsu, Y.L. Cooperation Between Cancer and Fibroblasts in Vascular Mimicry and N2-Type Neutrophil Recruitment via Notch2-Jagged1 Interaction in Lung Cancer. Front. Oncol. 2021, 11, 696931. [Google Scholar] [CrossRef] [PubMed]
  25. Amin, M.B.; Edge, S.B.; Greene, F.L.; Byrd, D.R.; Brookland, R.K.; Washington, M.K.; Gershenwald, J.E.; Compton, C.C.; Hess, K.R.; Sullivan, D.C.; et al. AJCC Cancer Staging Manual, 8th ed.; Springer International Publishing: New York, NY, USA, 2017. [Google Scholar]
  26. Zhu, Y.; Jin, Z.; Qian, Y.; Shen, Y.; Wang, Z. Prognostic Value of Tumor-Stroma Ratio in Rectal Cancer: A Systematic Review and Meta-analysis. Front. Oncol. 2021, 11, 685570. [Google Scholar] [CrossRef]
  27. Pavlou, M.; Ambler, G.; Seaman, S.R.; Guttmann, O.; Elliott, P.; King, M.; Omar, R.Z. How to develop a more accurate risk prediction model when there are few events. BMJ 2015, 351, h3868. [Google Scholar] [CrossRef] [PubMed] [Green Version]
  28. Wu, L.; Zhang, X.H. Tumor-Associated Neutrophils and Macrophages-Heterogenous but Not Chaotic. Front. Immunol. 2020, 11, 553967. [Google Scholar] [CrossRef]
  29. Tokumoto, M.; Tanaka, H.; Ohira, M.; Go, Y.; Okita, Y.; Sakurai, K.; Toyokawa, T.; Kubo, N.; Muguruma, K.; Maeda, K.; et al. A positive correlation between neutrophils in regional lymph nodes and progression of gastric cancer. Anticancer Res. 2014, 34, 7129–7136. [Google Scholar] [PubMed]
  30. Li, S.; Cong, X.; Gao, H.; Lan, X.; Li, Z.; Wang, W.; Song, S.; Wang, Y.; Li, C.; Zhang, H.; et al. Tumor-associated neutrophils induce EMT by IL-17a to promote migration and invasion in gastric cancer cells. J. Exp. Clin. Cancer Res. 2019, 38, 6. [Google Scholar] [CrossRef] [PubMed] [Green Version]
  31. Shan, Z.G.; Chen, J.; Liu, J.S.; Zhang, J.Y.; Wang, T.T.; Teng, Y.S.; Mao, F.Y.; Cheng, P.; Zou, Q.M.; Zhou, W.Y.; et al. Activated neutrophils polarize protumorigenic interleukin-17A-producing T helper subsets through TNF-α-B7-H2-dependent pathway in human gastric cancer. Clin. Transl. Med. 2021, 11, e484. [Google Scholar] [CrossRef]
  32. Abe, H.; Morikawa, T.; Saito, R.; Yamashita, H.; Seto, Y.; Fukayama, M. In Epstein-Barr virus-associated gastric carcinoma a high density of CD66b-positive tumor-associated neutrophils is associated with intestinal-type histology and low frequency of lymph node metastasis. Virchows Arch. 2016, 468, 539–548. [Google Scholar] [CrossRef] [PubMed]
  33. Cuartero, M.I.; Ballesteros, I.; Moraga, A.; Nombela, F.; Vivancos, J.; Hamilton, J.A.; Corbí, Á.L.; Lizasoain, I.; Moro, M.A. N2 neutrophils, novel players in brain inflammation after stroke: Modulation by the PPARγ agonist rosiglitazone. Stroke 2013, 44, 3498–3508. [Google Scholar] [CrossRef] [PubMed] [Green Version]
  34. Grecian, R.; Whyte, M.K.B.; Walmsley, S.R. The role of neutrophils in cancer. Br. Med. Bull. 2018, 128, 5–14. [Google Scholar] [CrossRef] [PubMed] [Green Version]
  35. Fridlender, Z.G.; Albelda, S.M. Tumor-associated neutrophils: Friend or foe? Carcinogenesis 2012, 33, 949–955. [Google Scholar] [CrossRef] [Green Version]
  36. Liu, K.; Yang, K.; Wu, B.; Chen, H.; Chen, X.; Chen, X.; Jiang, L.; Ye, F.; He, D.; Lu, Z.; et al. Tumor-Infiltrating Immune Cells Are Associated With Prognosis of Gastric Cancer. Medicine 2015, 94, e1631. [Google Scholar] [CrossRef]
  37. Wang, Y.; Zhai, J.; Zhang, T.; Han, S.; Zhang, Y.; Yao, X.; Shen, L. Tumor-Associated Neutrophils Can Predict Lymph Node Metastasis in Early Gastric Cancer. Front. Oncol. 2020, 10, 570113. [Google Scholar] [CrossRef]
  38. Nakayama, F.; Nishihara, S.; Iwasaki, H.; Kudo, T.; Okubo, R.; Kaneko, M.; Nakamura, M.; Karube, M.; Sasaki, K.; Narimatsu, H. CD15 expression in mature granulocytes is determined by alpha 1,3-fucosyltransferase IX, but in promyelocytes and monocytes by alpha 1,3-fucosyltransferase IV. J. Biol. Chem. 2001, 276, 16100–16106. [Google Scholar] [CrossRef] [Green Version]
  39. McKenna, E.; Mhaonaigh, A.U.; Wubben, R.; Dwivedi, A.; Hurley, T.; Kelly, L.A.; Stevenson, N.J.; Little, M.A.; Molloy, E.J. Neutrophils: Need for Standardized Nomenclature. Front. Immunol. 2021, 12, 602963. [Google Scholar] [CrossRef]
  40. Ducker, T.P.; Skubitz, K.M. Subcellular localization of CD66, CD67, and NCA in human neutrophils. J. Leukoc Biol. 1992, 52, 11–16. [Google Scholar] [CrossRef]
  41. Mishalian, I.; Bayuh, R.; Eruslanov, E.; Michaeli, J.; Levy, L.; Zolotarov, L.; Singhal, S.; Albelda, S.M.; Granot, Z.; Fridlender, Z.G. Neutrophils recruit regulatory T-cells into tumors via secretion of CCL17—A new mechanism of impaired antitumor immunity. Int. J. Cancer 2014, 135, 1178–1186. [Google Scholar] [CrossRef]
  42. Masucci, M.T.; Minopoli, M.; Carriero, M.V. Tumor Associated Neutrophils. Their Role in Tumorigenesis, Metastasis, Prognosis and Therapy. Front. Oncol. 2019, 9, 1146. [Google Scholar] [CrossRef] [PubMed] [Green Version]
  43. Mhaidly, R.; Mechta-Grigoriou, F. Fibroblast heterogeneity in tumor micro-environment: Role in immunosuppression and new therapies. Semin Immunol. 2020, 48, 101417. [Google Scholar] [CrossRef] [PubMed]
Figure 1. The schematic description of tumor compartments and tumor microenvironmental areas, and representative images of counting the number of neutrophils with an image analyzer.
Biomedicines 10 00708 g001
Figure 2. Disease-free survival according to calculated tumor-associated neutrophils for pro-tumor function (cN2) and tumor—stromal ratio (TSR). (a) cN2 at the tumor margin; (b) cN2 at the tumor center; (c) TSR.
Biomedicines 10 00708 g002
Table 1. The prognostic effects of the clinicopathological factors, tumor–associated neutrophils, and tumor—stroma ratio using the Kaplan—Meier curve analysis.
FactorsCutoff ValuesDFSOSCSS
p Valuep Valuep Value
Age≤ vs. >72 years old0.268<0.0010.131
SexMale vs. female0.3780.9840.641
pTT2 + T3 vs. T4<0.001<0.001<0.001
pNN0 vs. N1 + N2 + N3<0.001<0.001<0.001
pMM0 vs. M10.0690.001<0.001
pTNMI + II vs. III + IV<0.001<0.001<0.001
Lauren classificationIntestinal vs. Others0.1460.5190.127
Tumor differentiationWell + moderately vs. poorly0.1300.1710.054
Lymphatic invasionAbsent vs. present<0.001<0.001<0.001
Venous invasionAbsent vs. present0.0030.0960.015
Perineural invasionAbsent vs. present<0.001<0.001<0.001
CD66bMarginPeritumoral≤ vs. >54.81/mm20.1040.2190.081
Intratumoral≤ vs. >30.6/mm20.1670.0480.047
CenterPeritumoral≤ vs. >4.8/mm20.0530.1690.097
Intratumoral≤ vs. >6.5/mm20.1240.3720.171
CD15Margin≤ vs. >2473.3/mm20.0060.0010.014
Center≤ vs. >536.1/mm20.0020.0090.011
cN2Margin≤ vs. >949.3/mm20.1840.0380.044
Center≤ vs. >954.6/mm2<0.0010.0020.002
TSR≤ vs. >40%<0.001<0.001<0.001
DFS, disease free survival; OS, overall survival; CSS, cancer specific survival; cN2, calculated tumor-associated neutrophils for pro-tumor function; TSR, tumor—stromal ratio.
Table 2. Clinicopathological characteristics according to the calculated tumor-associated neutrophils for pro-tumor function and tumor—stromal ratio.
FactorscN2 of Tumor Centerp ValueTSRp Value
Low-Grade
(≤954.6/mm2)
n = 126 (%)
High-Grade
(>954.6 /mm2)
n = 31 (%)
Low-Grade
(≤40%)
n = 72 (%)
High-Grade
(>40%)
n = 85 (%)
Age (years old) 0.681 0.857
≤7258 (81.7)13 (18.3) 32 (45.1)39 (54.9)
>7268 (79.1)18 (20.9) 40 (46.5)46 (53.5)
Sex 0.167 0.898
Male 93 (83.0)19 (17.0) 51 (45.5)61 (54.5)
Female33 (73.3)12 (26.7) 21 (46.7)24 (53.3)
pT 0.001 0.000
T2 + T388 (88.0)12 (12.0) 60 (60.0)40 (40.0)
T438 (66.7)19 (33.3) 12 (21.1)45 (78.9)
pN 0.089 <0.001
N049 (87.5)7 (12.5) 41 (73.2)15 (26.8)
N1 + N2 + N377 (76.2)24 (23.8) 31 (30.7)70 (69.3)
pM 0.591 0.013
M0114 (79.7)29 (20.3) 70 (49.0)73 (51.0)
M112 (85.7)2 (14.3) 2 (14.3)12 (85.7)
pTNM 0.260 <0.001
I + II 63 (84.0)12 (16.0) 54 (72.0)21 (28.0)
III + IV63 (76.8)19 (23.2) 18 (22.0)64 (78.0)
Lauren classification 0.577 0.764
Intestinal68 (81.9)15 (18.1) 39 (47.0)44 (53.0)
Others58 (78.4)16 (21.6) 33 (44.6)41 (55.4)
Differentiation 0.240 <0.001
Well + Moderate51 (85.0)9 (15.0) 30 (50.0)30 (50.0)
Poorly75 (77.3)22 (22.7) 42 (43.3)55 (56.7)
Lymphatic invasion 0.014 <0.001
Absent59 (89.4)7 (10.6) 49 (74.2)17 (25.8)
Present67 (73.6)24 (26.4) 23 (25.3)68 (74.7)
Venous invasion 0.223 0.001
Absent115 (81.6)26 (18.4) 71 (50.4)70 (49.6)
Present11 (68.8)5 (31.3) 1 (6.3)15 (93.8)
Perineural invasion <0.001 <0.001
Absent85 (89.5)10 (10.5) 60 (63.2)35 (36.8)
Present41 (66.1)21 (33.9) 12 (19.4)50 (80.6)
Tumor size (mm) 0.074 0.079
≤55.068 (86.1)11 (13.9) 42 (53.2)37 (46.8)
>55.058 (74.4)20 (25.6) 30 (38.5)48 (61.5)
Overall death 0.009 <0.001
Alive52 (91.2)5 (8.8) 45 (78.9)12 (21.1)
Death74 (74.0)26 (26.0) 27 (27.0)73 (73.0)
Recurrence 0.001 <0.001
Absent84 (88.4)11 (11.6) 65 (68.4)30 (31.6)
Present42 (67.7)20 (32.3) 7 (11.3)55 (88.7)
Cancer-specific death 0.023 <0.001
Alive81 (86.2)13 (13.8) 65 (69.1)29 (30.9)
Death45 (71.4)18 (28.6) 7 (11.1)56 (88.9)
cN2, calculated tumor-associated neutrophils for pro-tumor function; TSR, tumor—stromal ratio.
Table 3. Univariate and multivariate analyses of factors associated with disease-free survival of advanced gastric cancer.
Univariate AnalysisMultivariate Analysis
HR (95% CI)p ValueAdjusted HR
(95% CI)
p Value
Age (>72 years)1.326 (0.803–2.190)0.270
pTNM (III + IV)13.386 (6.031–29.708)<0.001
LVPI (Present)11.050 (4.001–30.521)<0.001
Tumor size (>55.0 mm)2.761 (1.627–4.687)<0.001
CD15Margin (>2473.3/mm2) *2.269 (1.149–4.484)0.0181.539 (0.746–3.174)0.243
Center (>536.1/mm2) *2.393 (1.287–4.448)0.0061.106 (0.597–2.050)0.749
cN2Margin (>949.3/mm2) *1.576 (0.800–3.106)0.1881.066 (0.521–2.181)0.860
Center (>954.6/mm2) *3.241 (1.888–5.566)<0.0012.614 (1.436–4.671)0.001
TSR (>40%) *10.768 (4.877–23.775)<0.0013.976 (1.643–9.620)0.002
HR, hazard ratio; CI, confidence interval; LVPI, lymphovascular and perineural invasion; cN2, calculated tumor-associated neutrophils for pro-tumor function; TSR, tumor—stromal ratio. * Adjusted for age, pTNM, lymphovascular and perineural invasion, and tumor size.
Table 4. Correlation of variable tumor associated neutrophils, calculated tumor-associated neutrophils for pro-tumor function, and tumor—stromal ratio.
FactorsPearson’s Coefficientp Value
CD66bMarginPeritumoral−0.0950.235
Intratumoral−0.1850.020
CenterPeritumoral−0.0850.288
Intratumoral−0.0670.403
CD15MarginPeritumoral0.0350.660
Center Peritumoral0.1330.096
cN2MarginPeritumoral0.0880.275
Center Peritumoral0.1790.025
cN2, calculated tumor-associated neutrophils for pro-tumor function.
Publisher’s Note: MDPI stays neutral with regard to jurisdictional claims in published maps and institutional affiliations.

