
CD5 Deficiency Alters Helper T Cell Metabolic Function and Shifts the Systemic Metabolome


 , , , , and
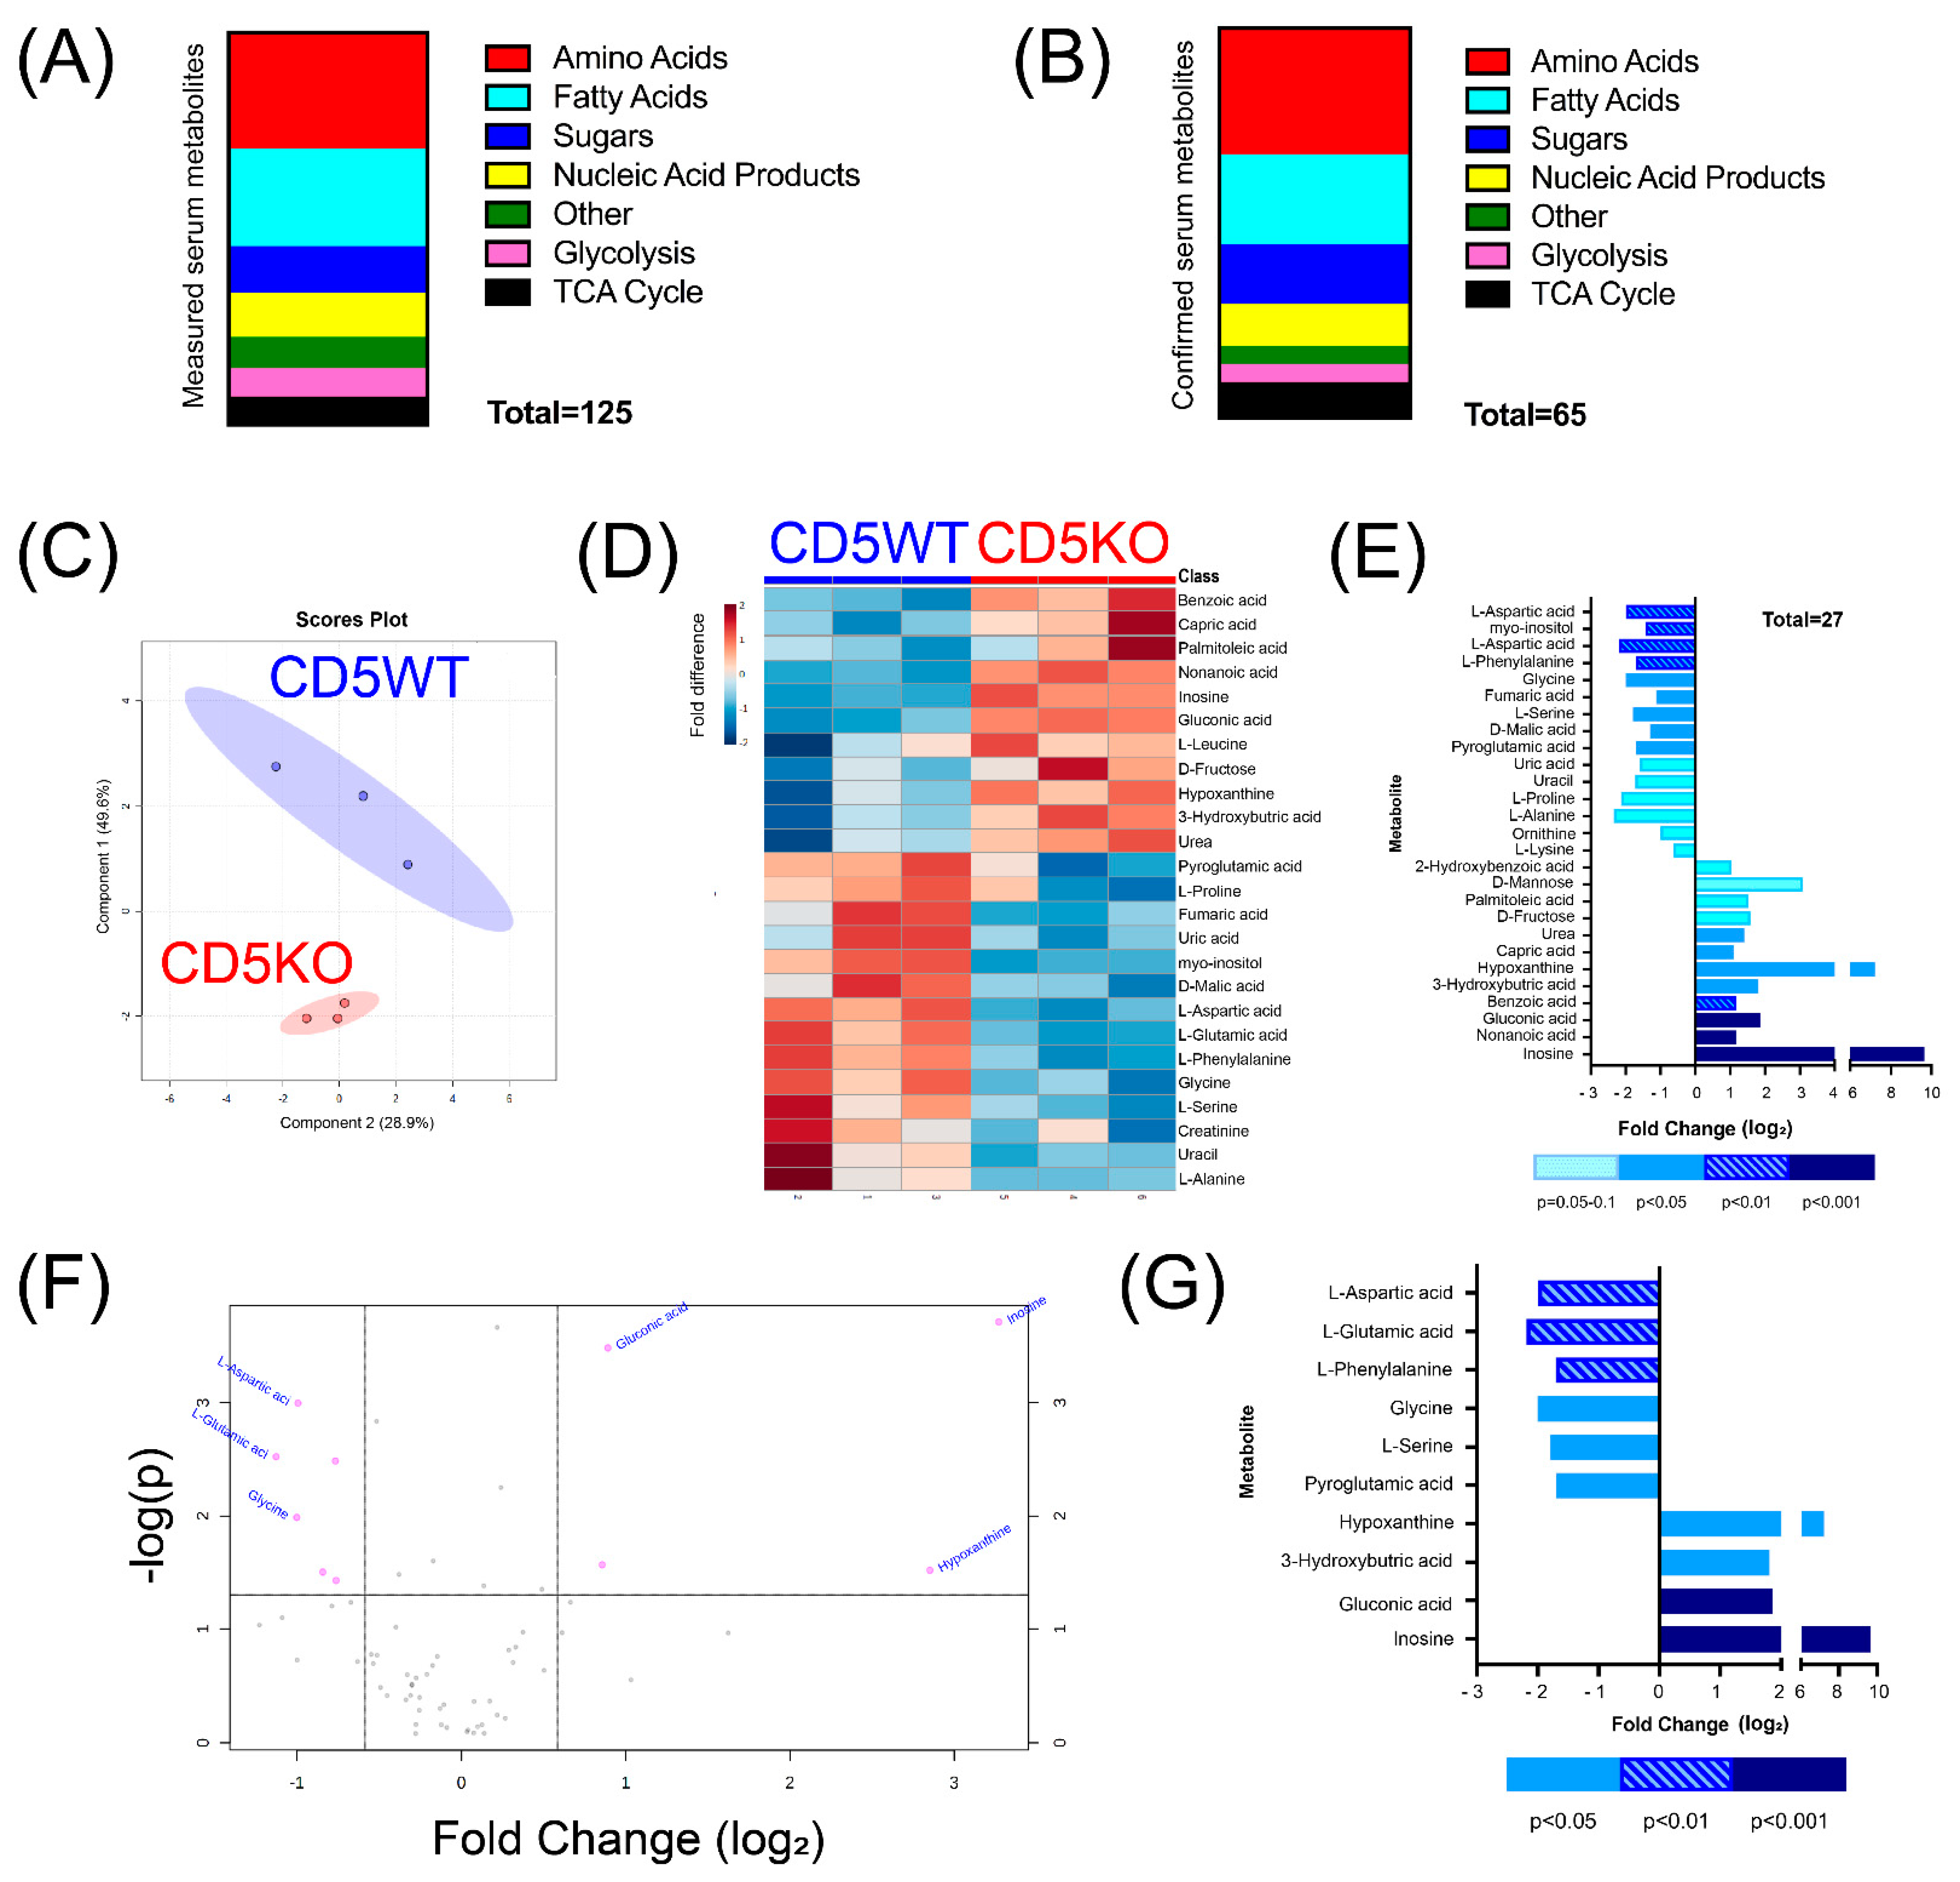
Abstract
:1. Introduction
2. Materials and Methods
2.1. Mice
2.2. T Cell Isolation
2.3. Serum and T Cell Metabolomics
2.4. RNA-Seq and qPCR
2.5. T Cell Metabolic Assays
2.6. Flow Cytometry
2.7. Statistical Analysis
3. Results
3.1. Removal of CD5 Decreases Serum Amino Acid Levels in CD5KO Mice
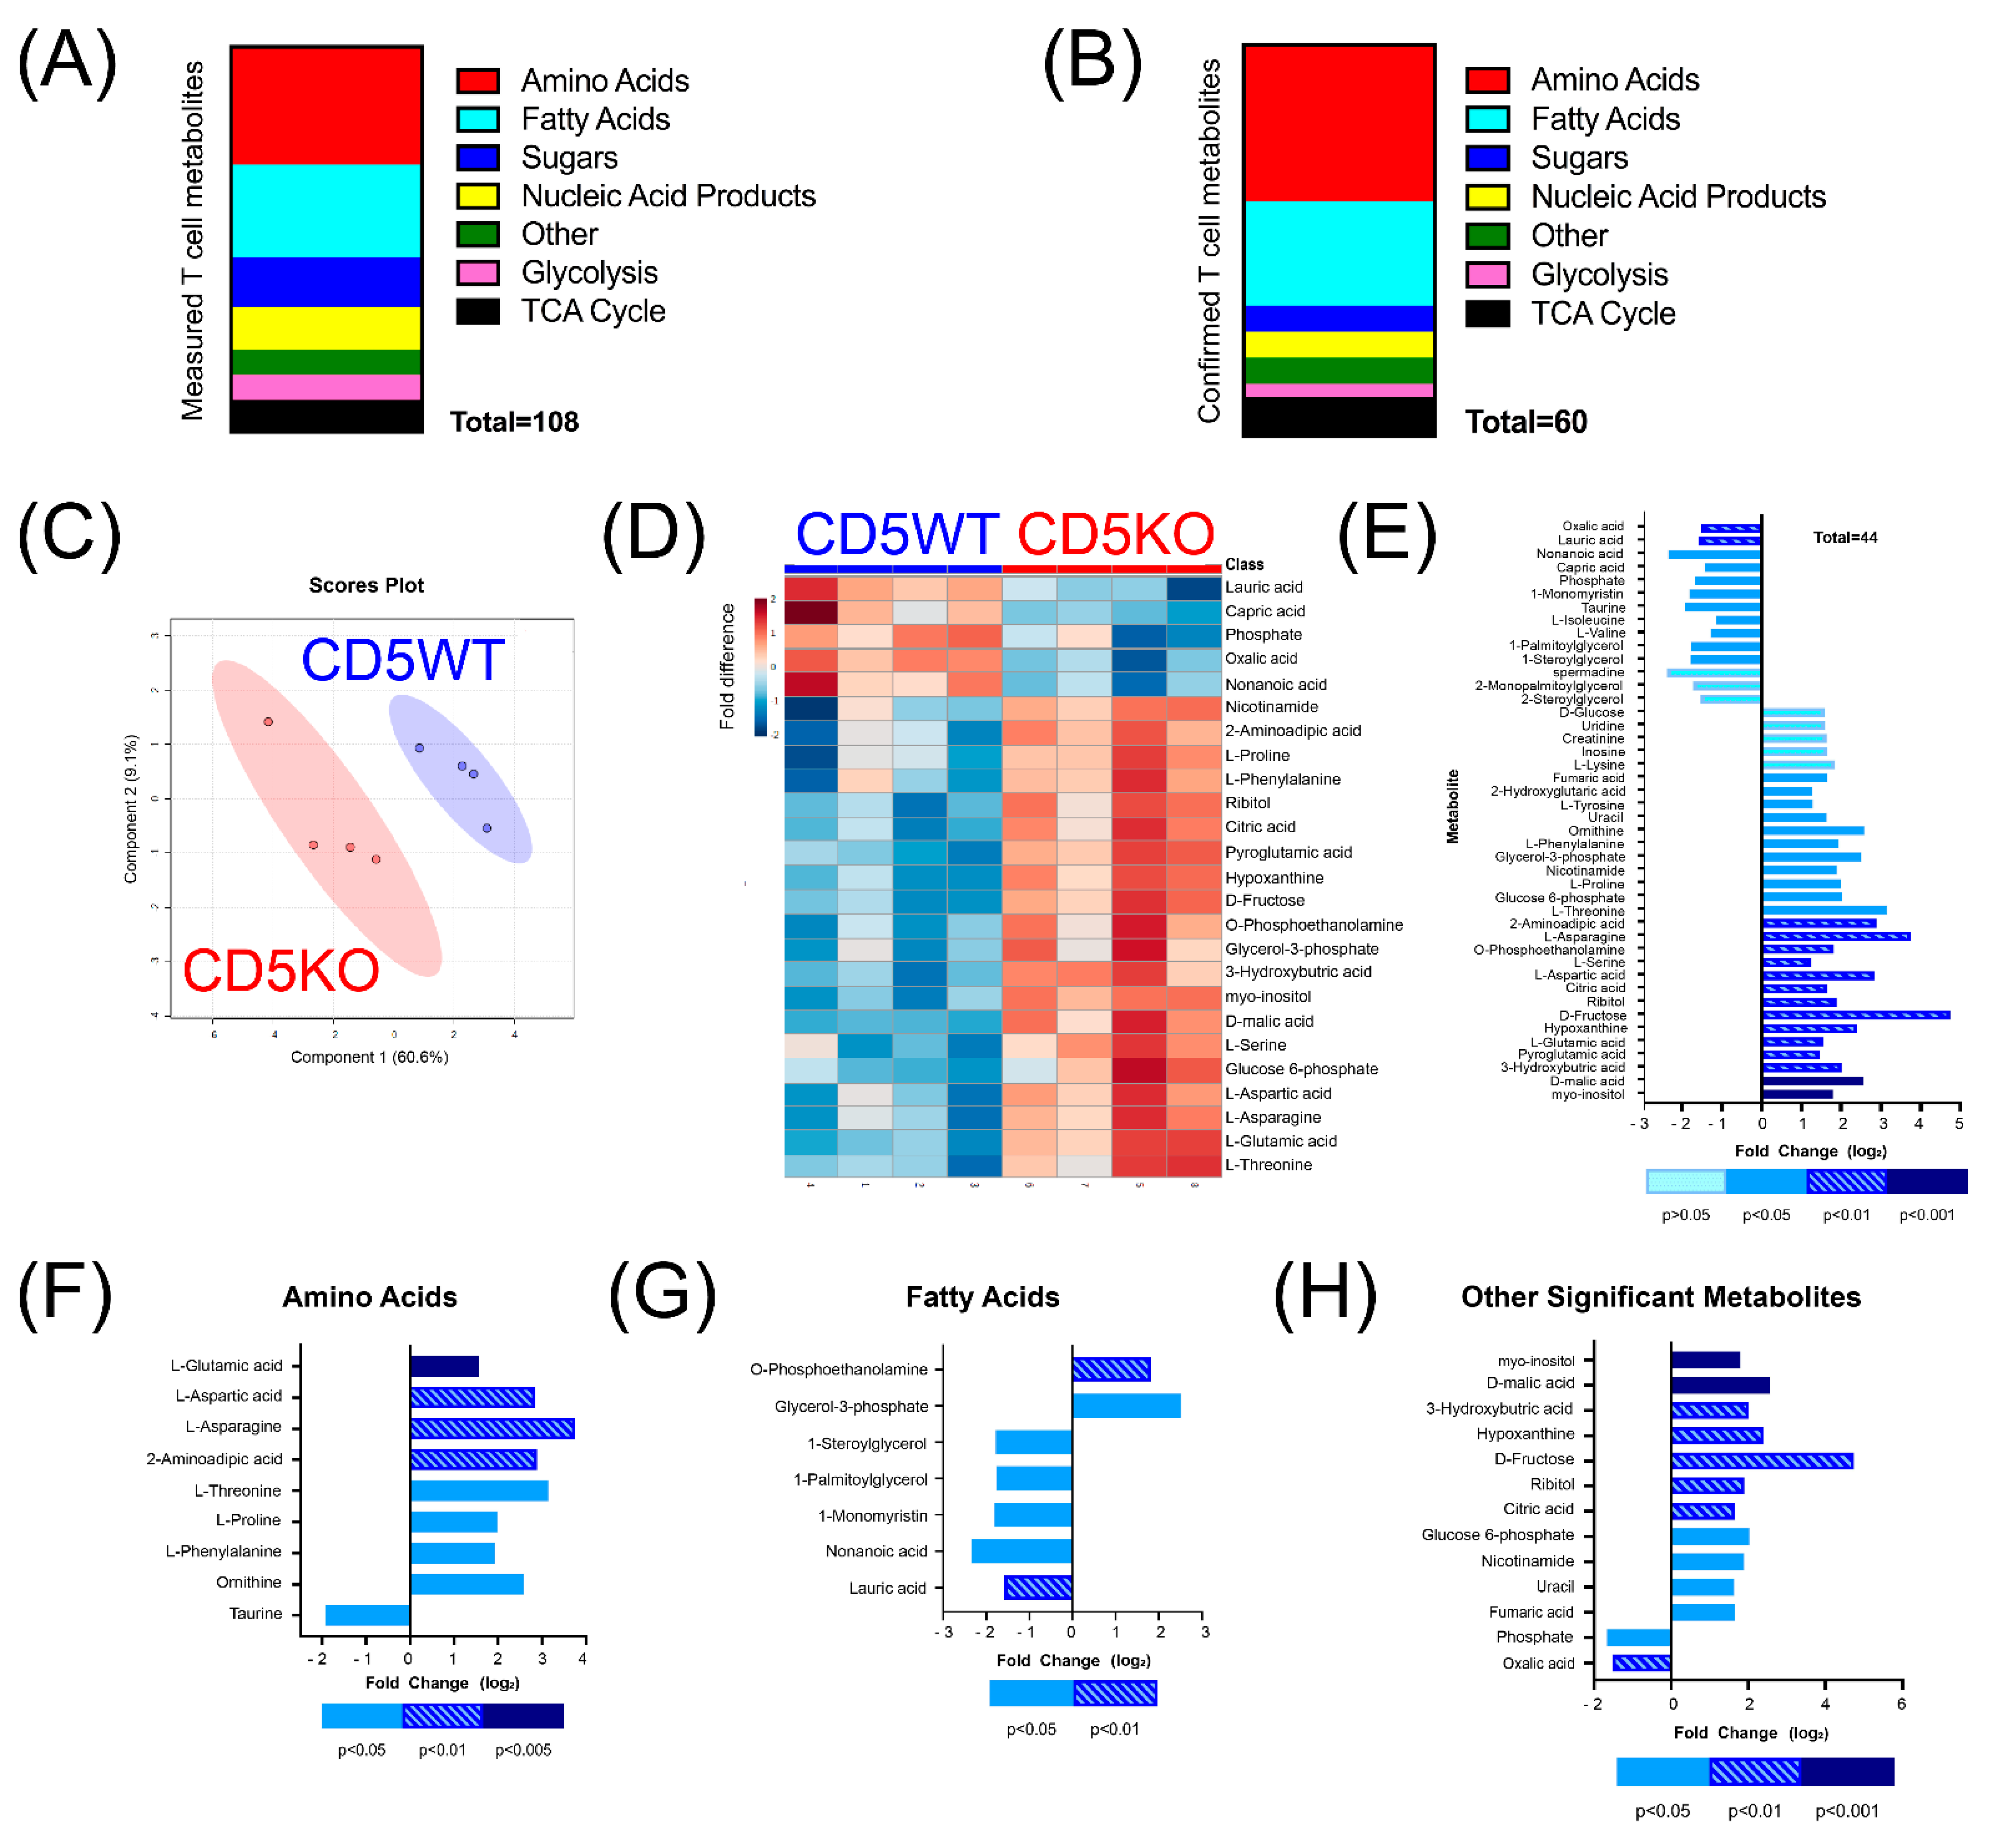
3.2. CD5KO Th Cells Have Elevated Levels of Many Metabolites
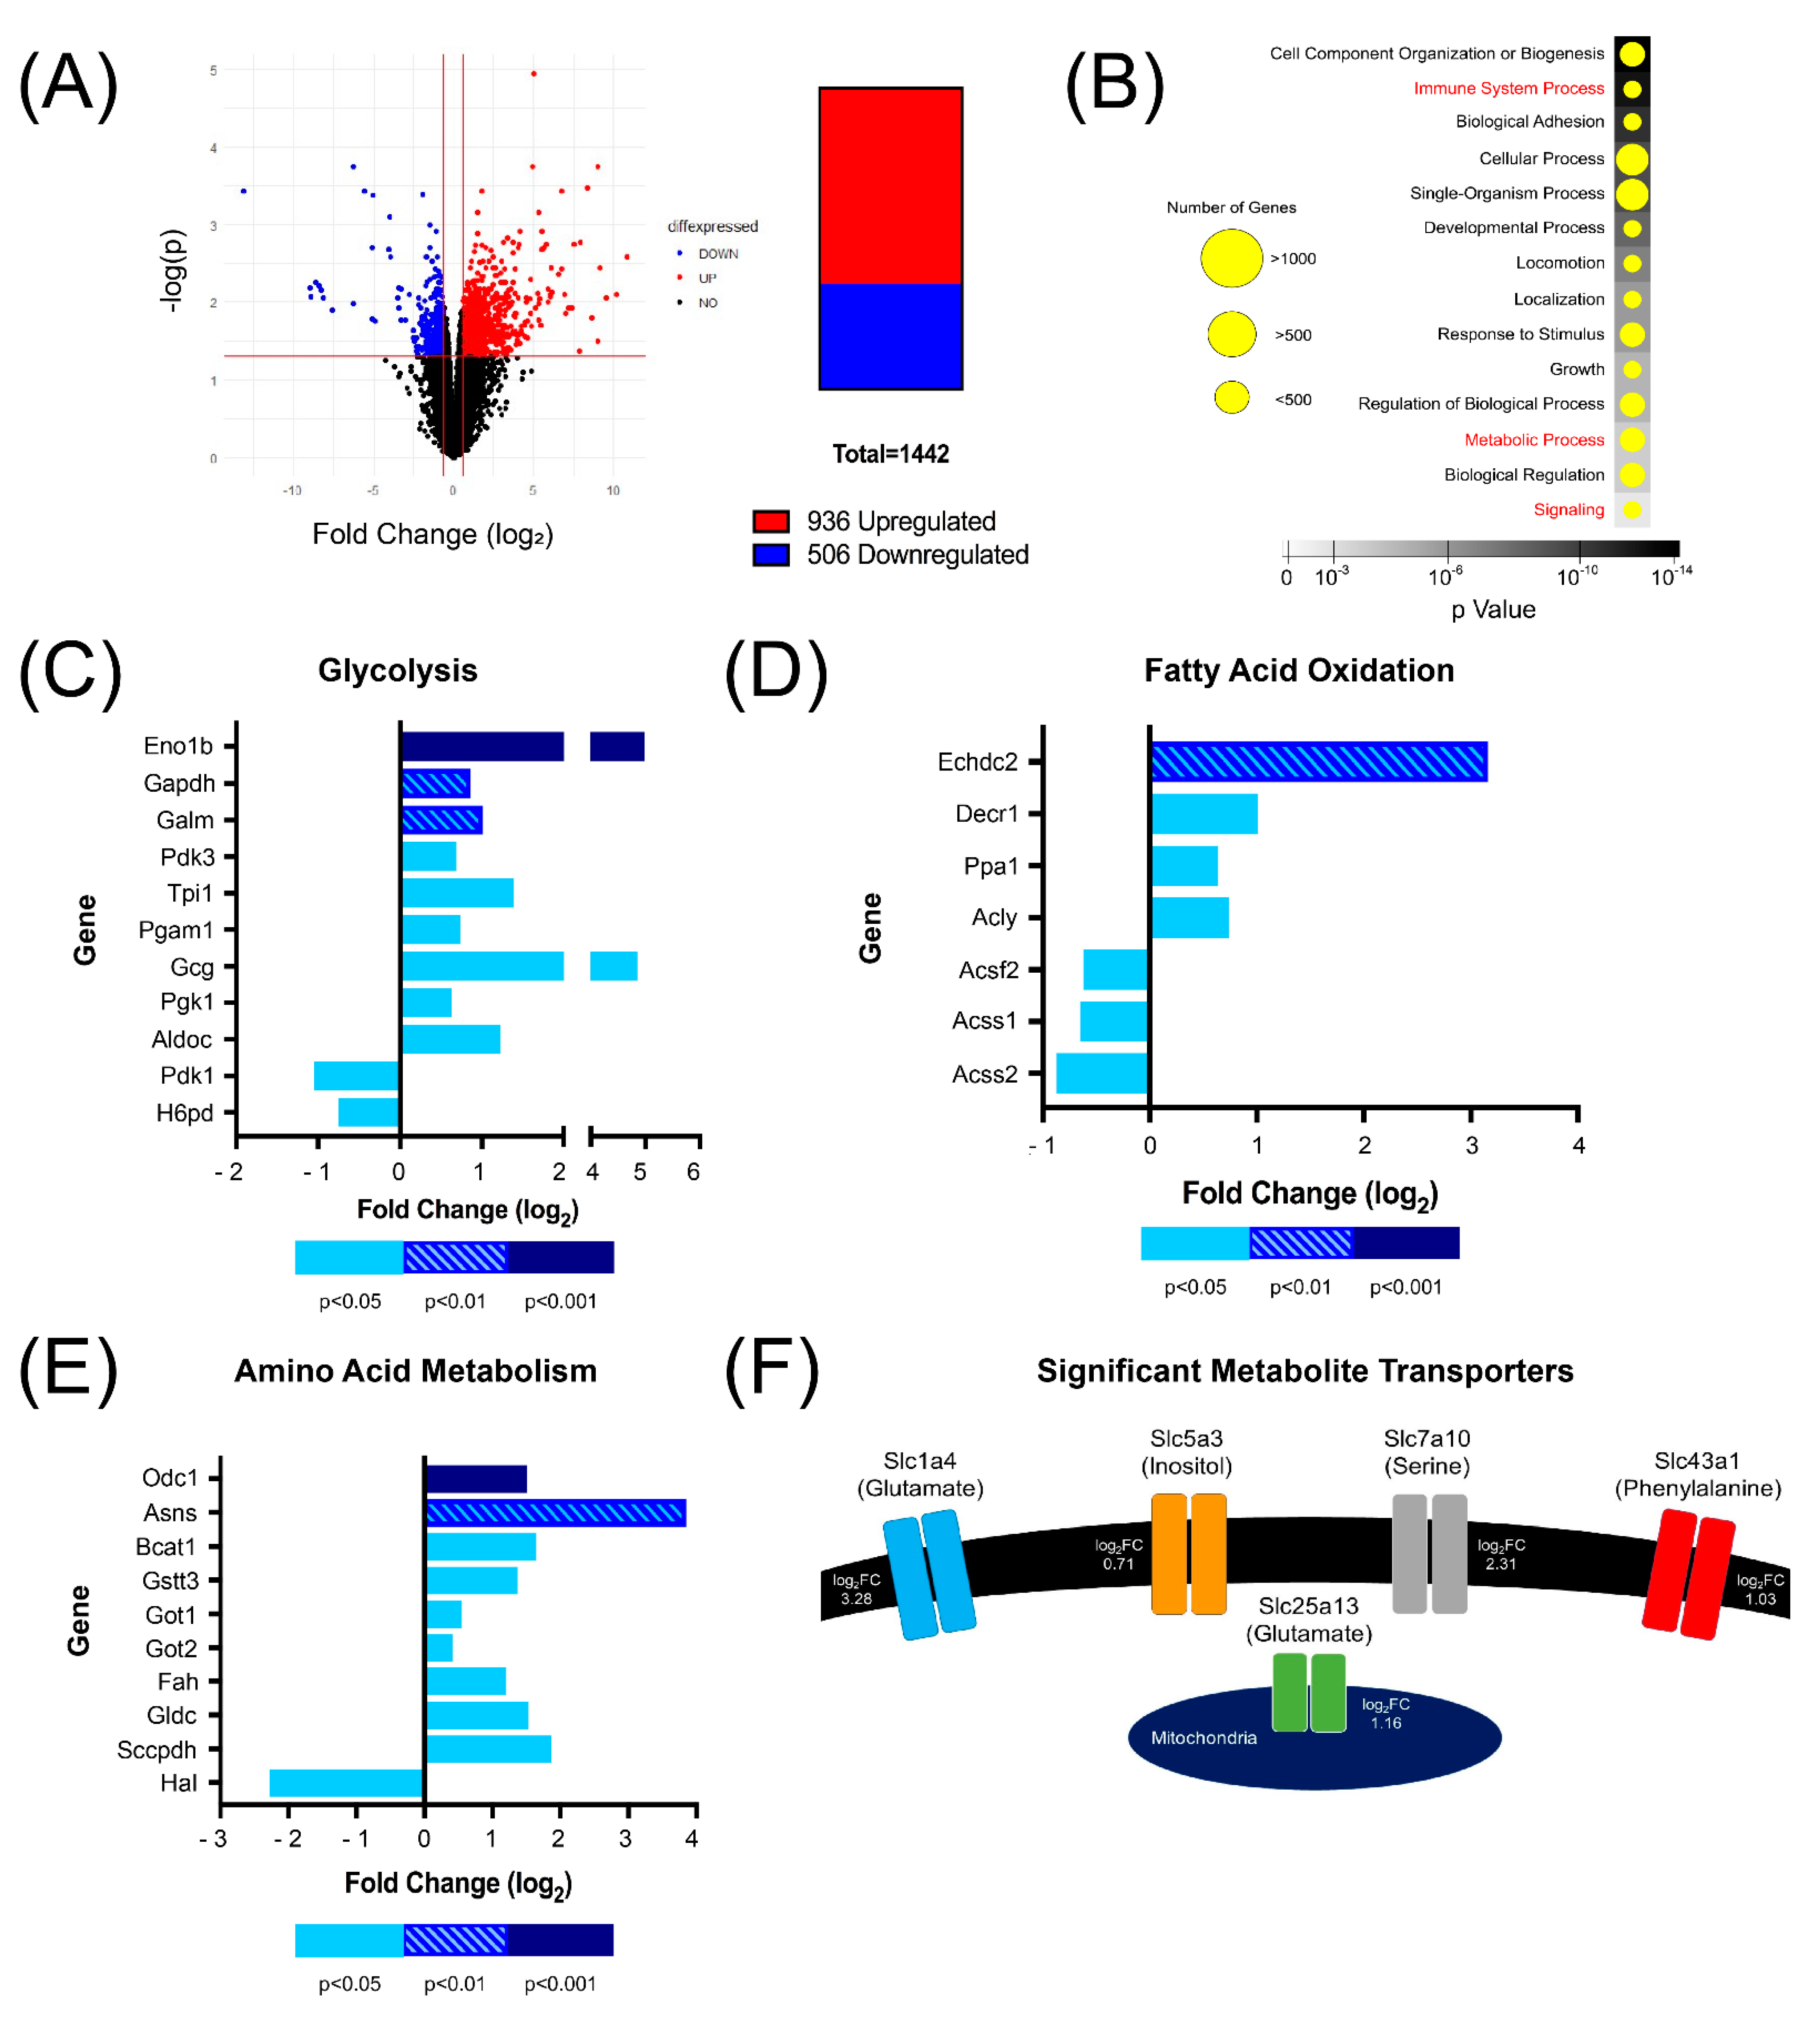
3.3. RNA-Seq Identified Several Genes Involved in Metabolism That Are Upregulated in CD5KO Th Cells
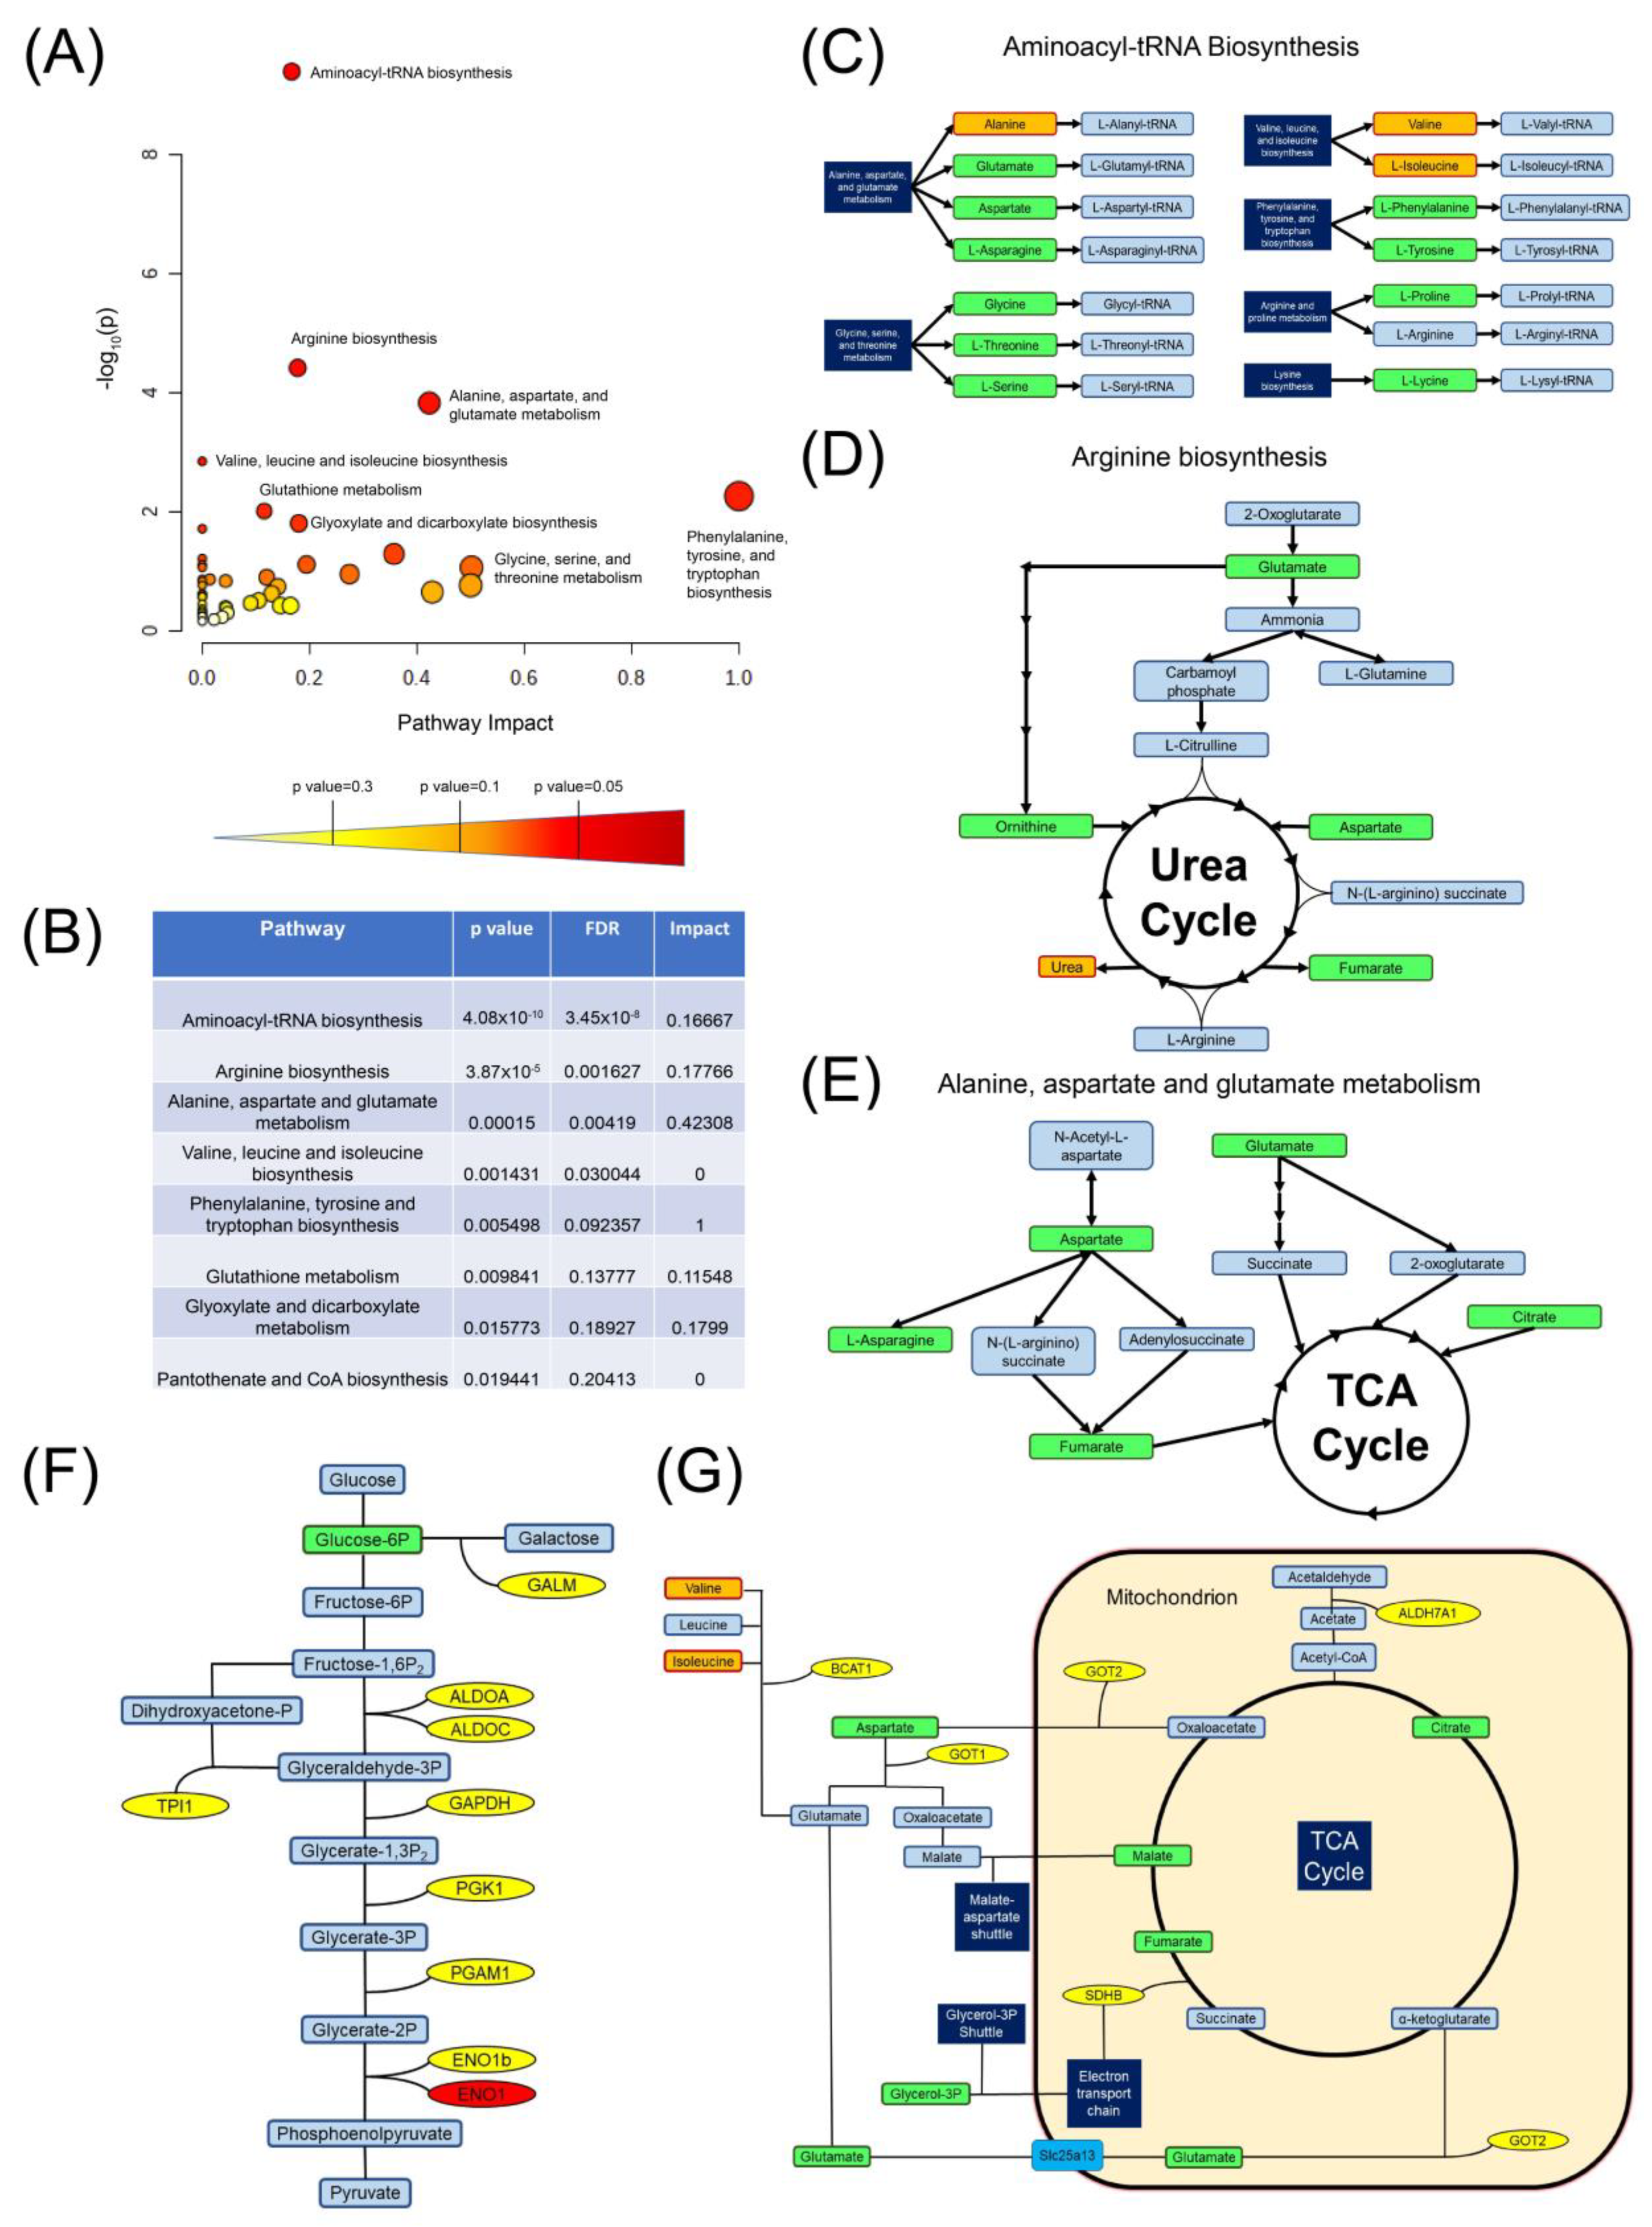
3.4. Metabolomic and Transcriptomic Pathway Analysis Revealed That CD5 May Be Linked to Specific Metabolic Pathways
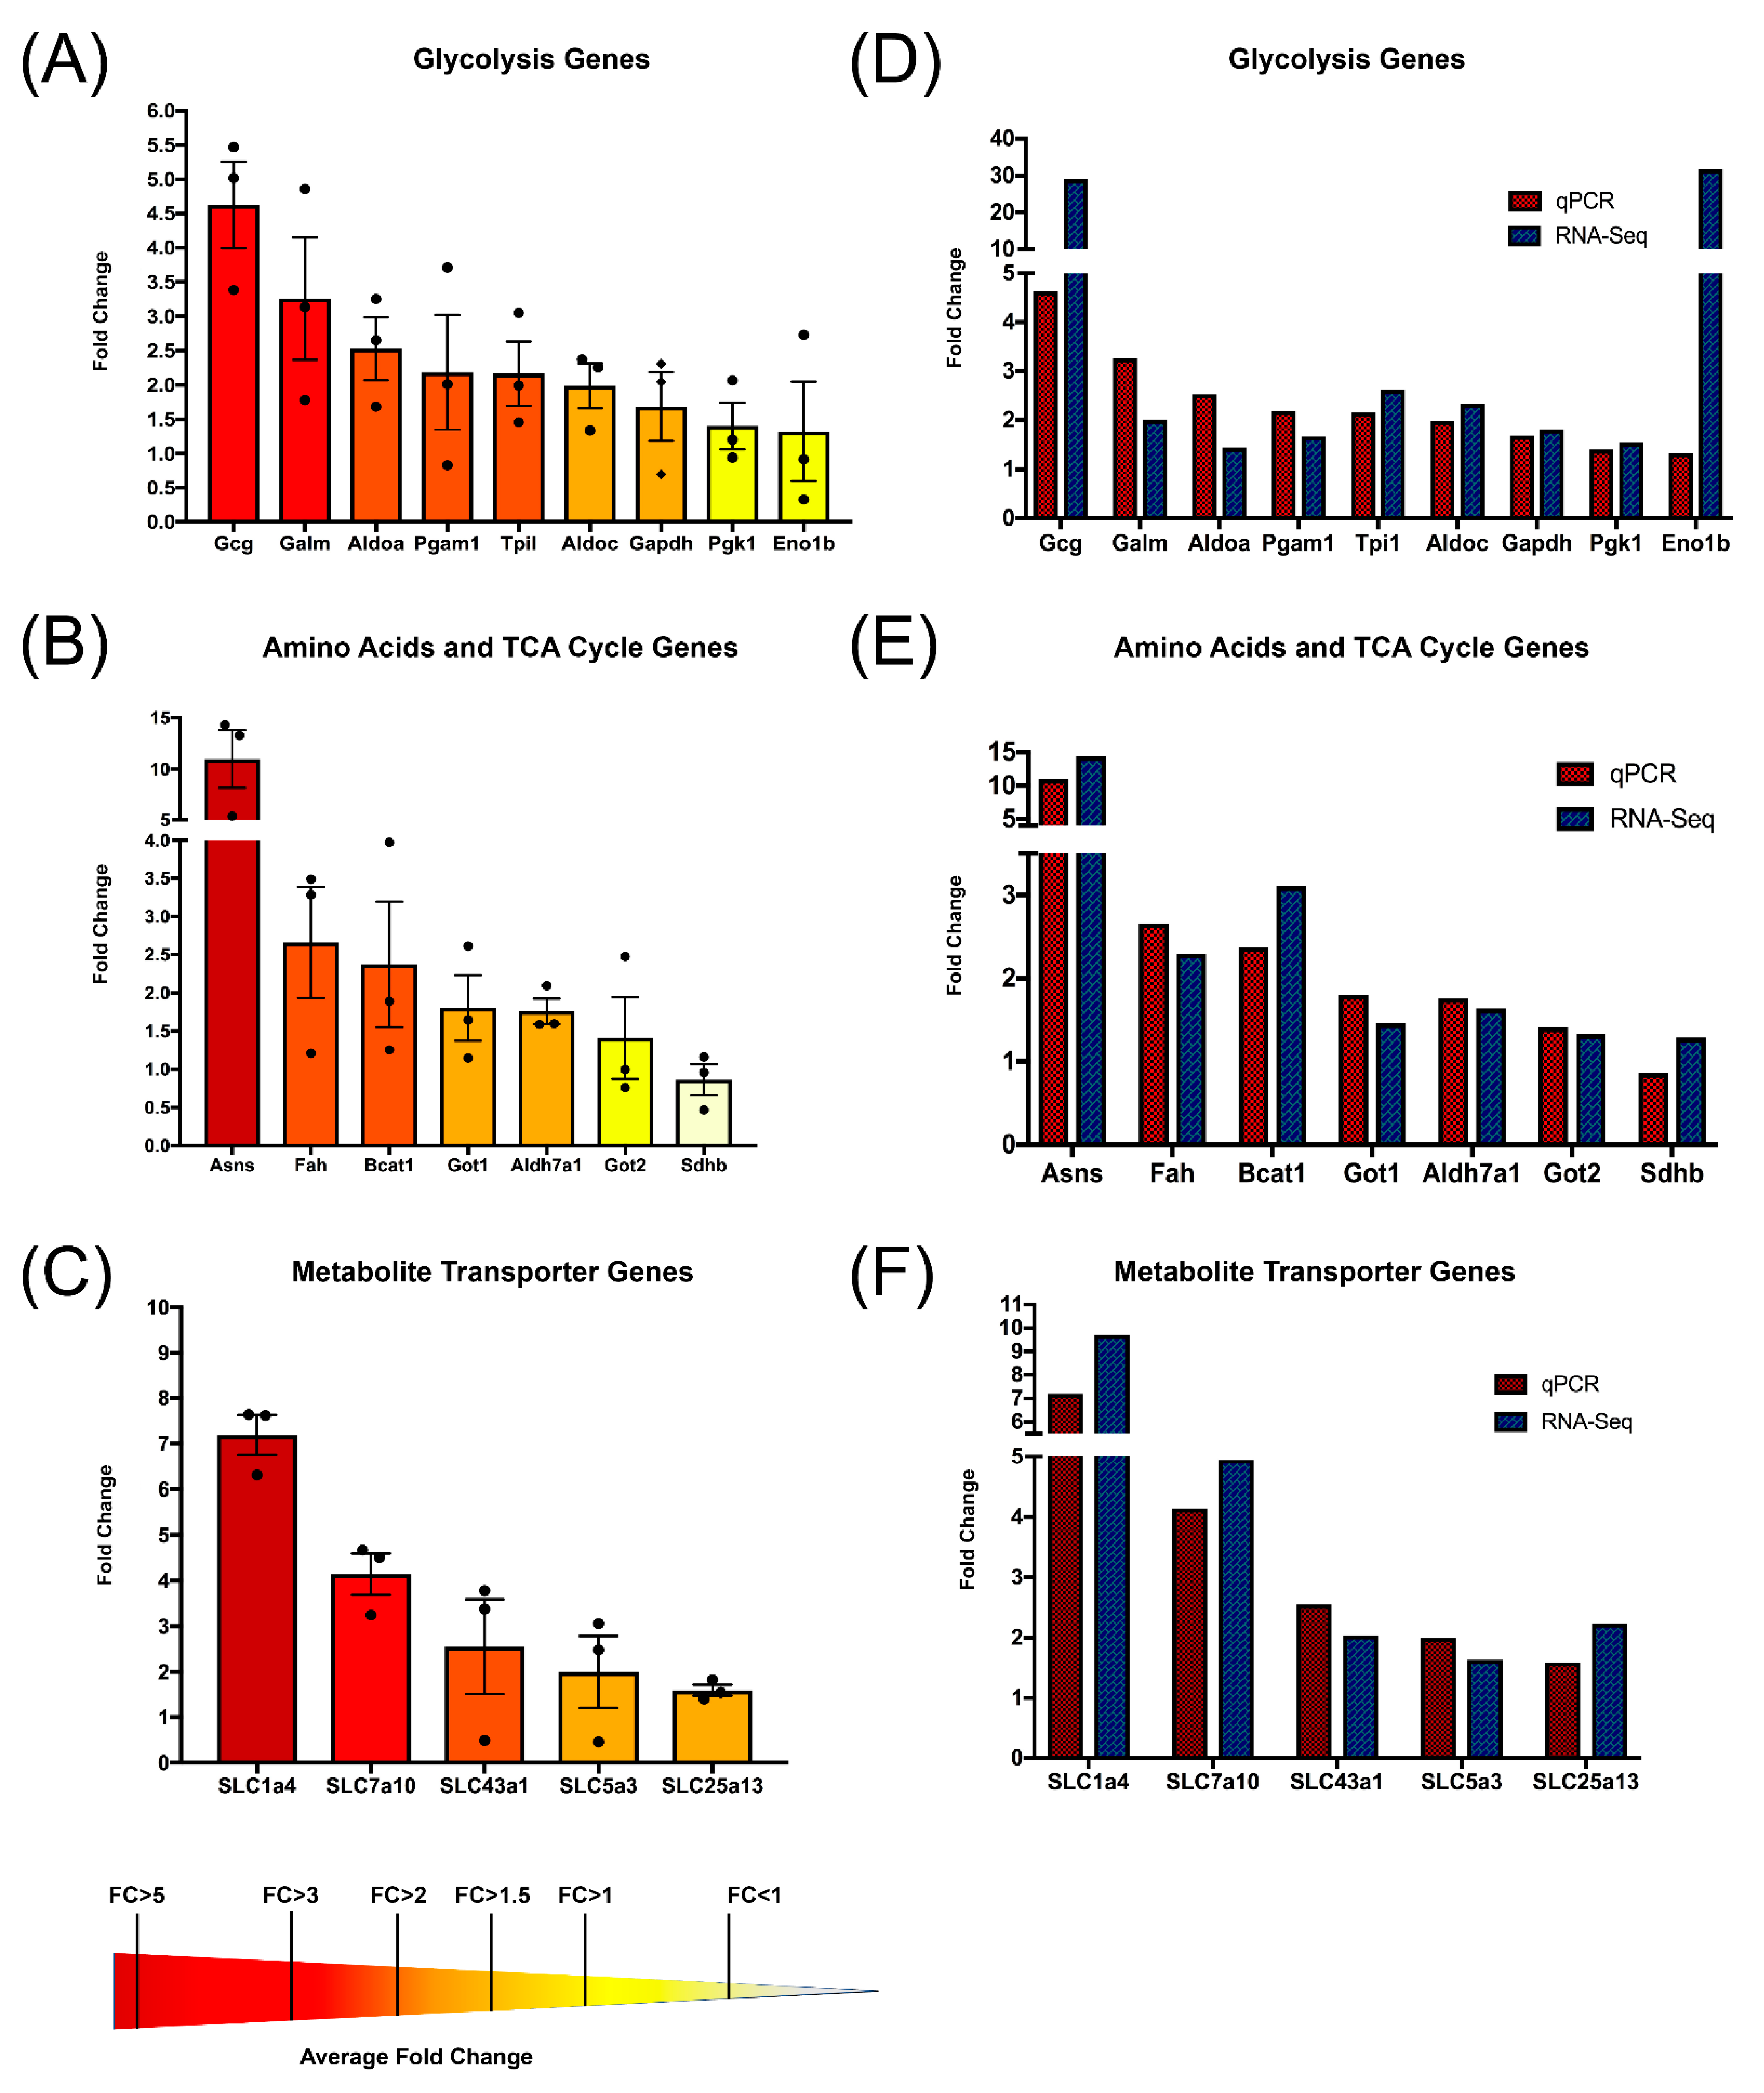
3.5. Quantitative PCR Validates That CD5 Removal Is Linked to Transcriptional Upregulation of Metabolic Genes
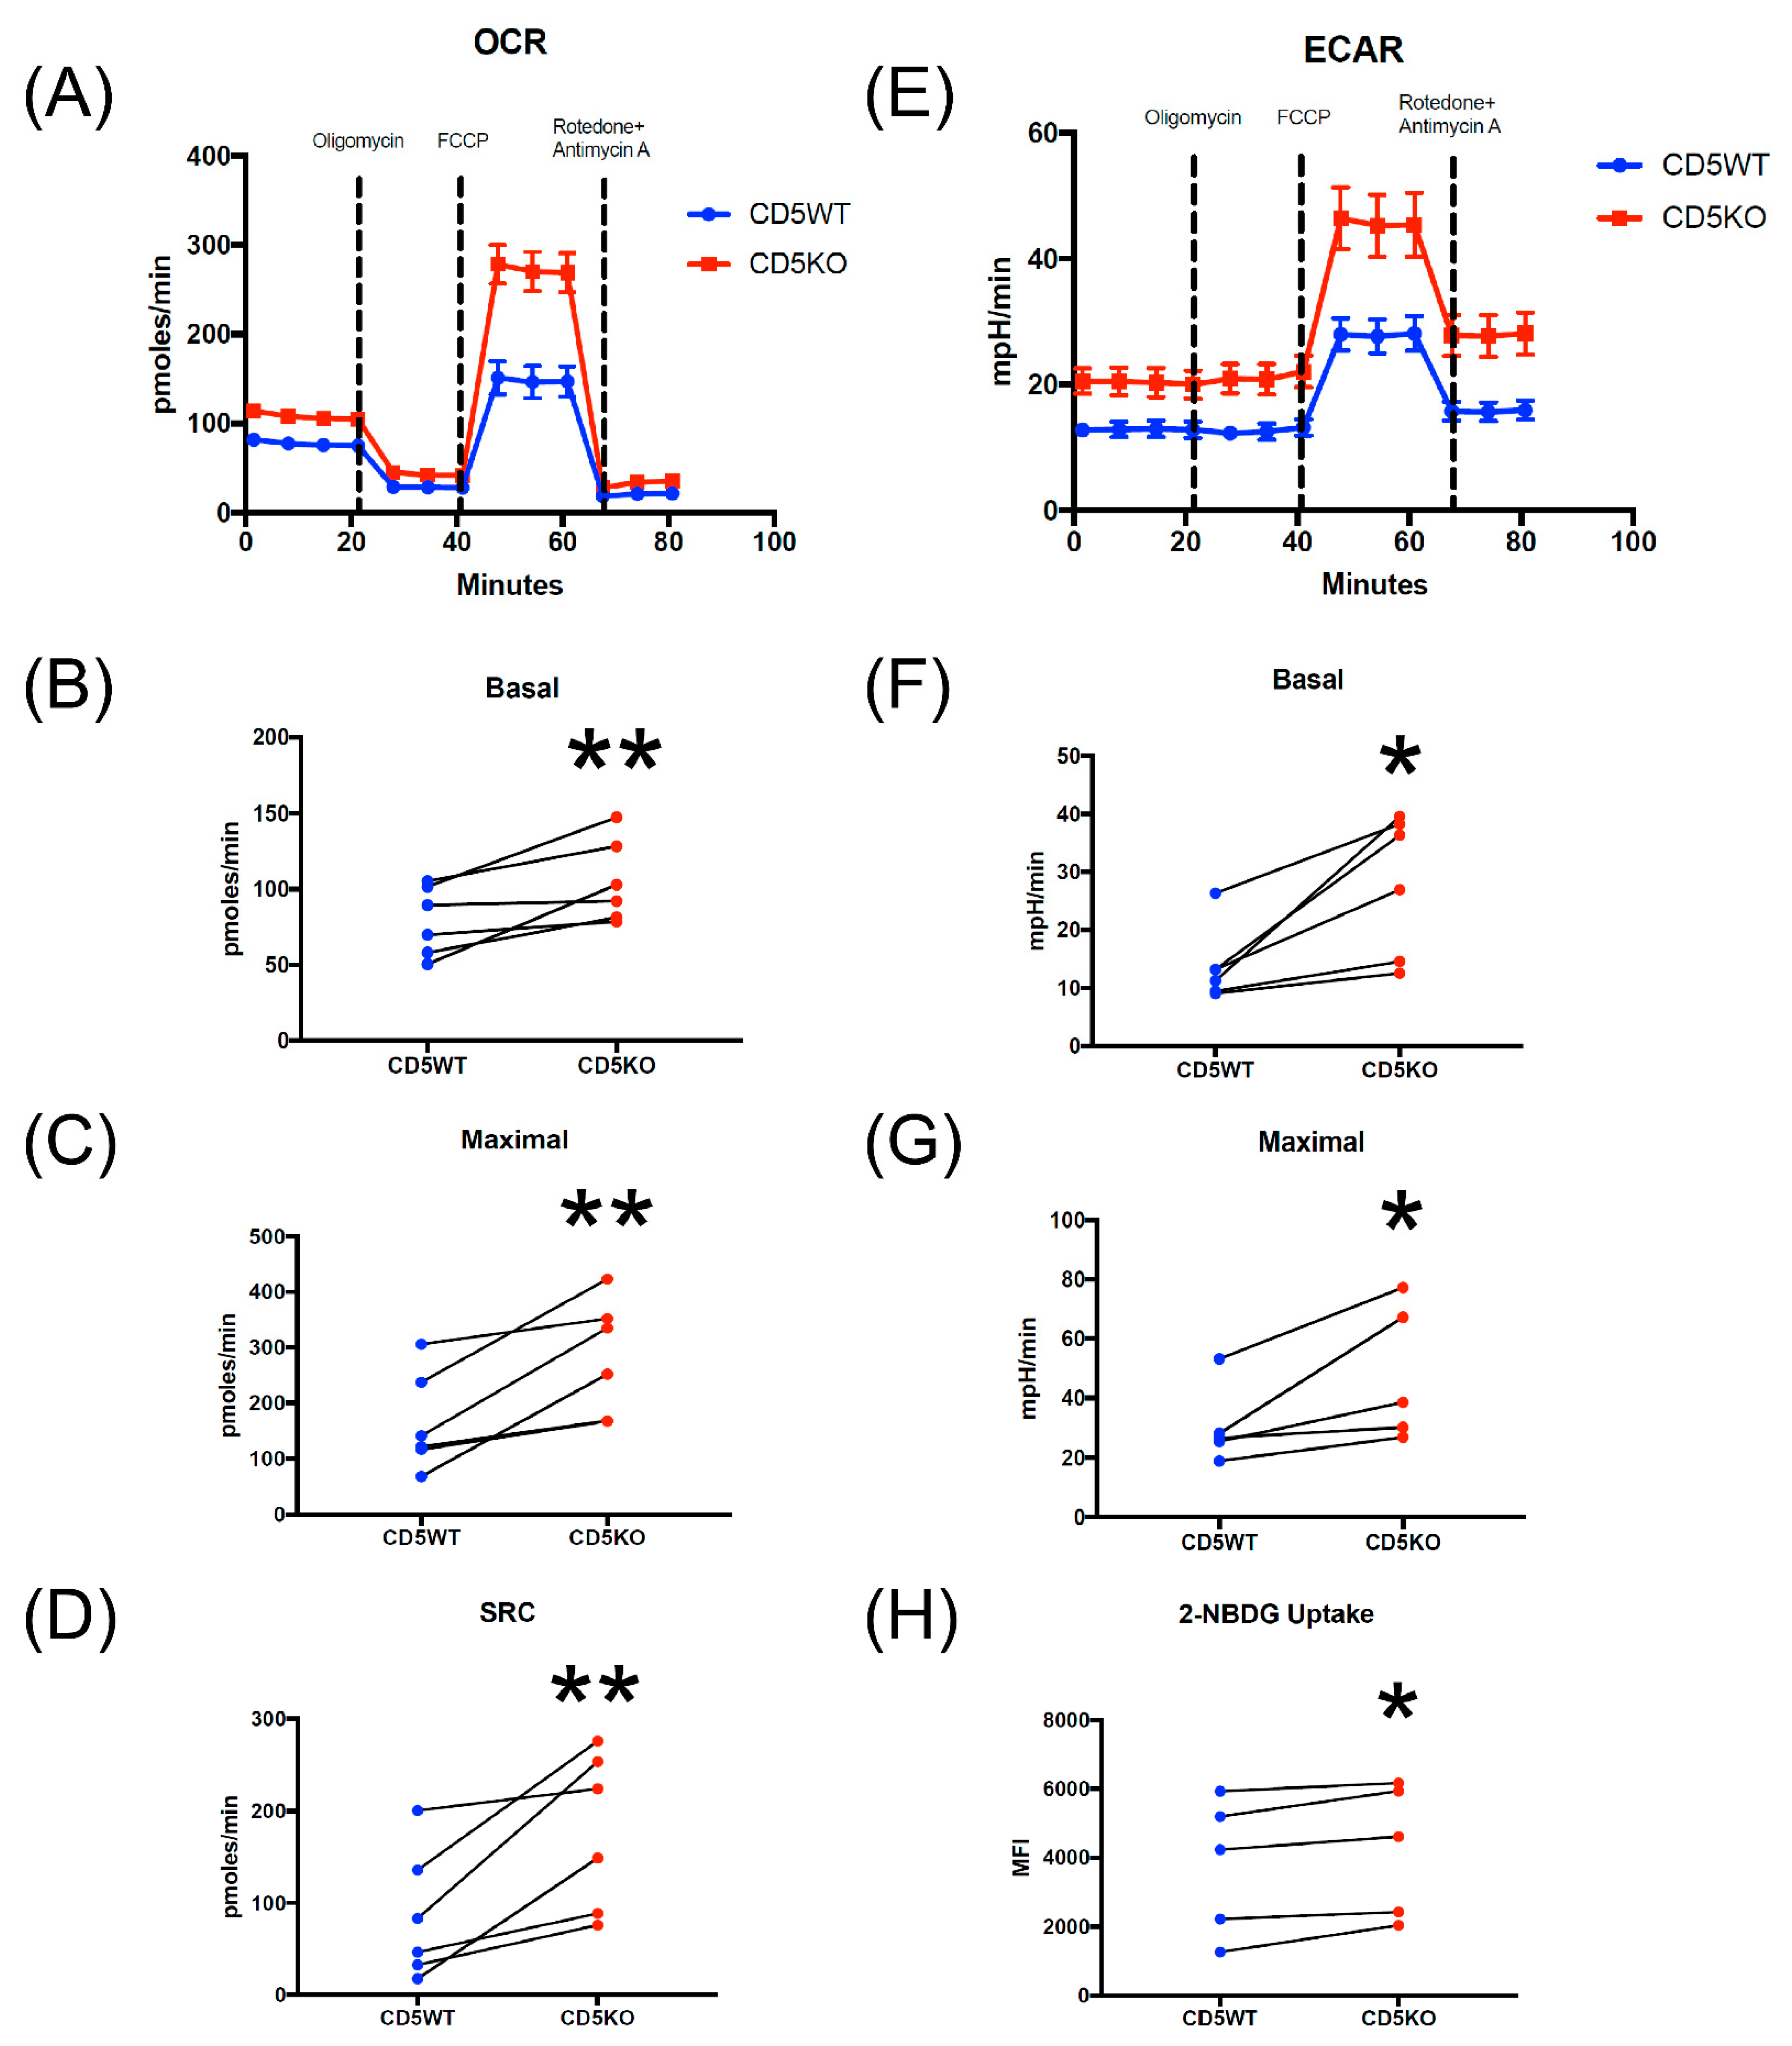
3.6. CD5KO Th Cells Have Different Metabolic Profiles Compared to CD5WT Th Cells
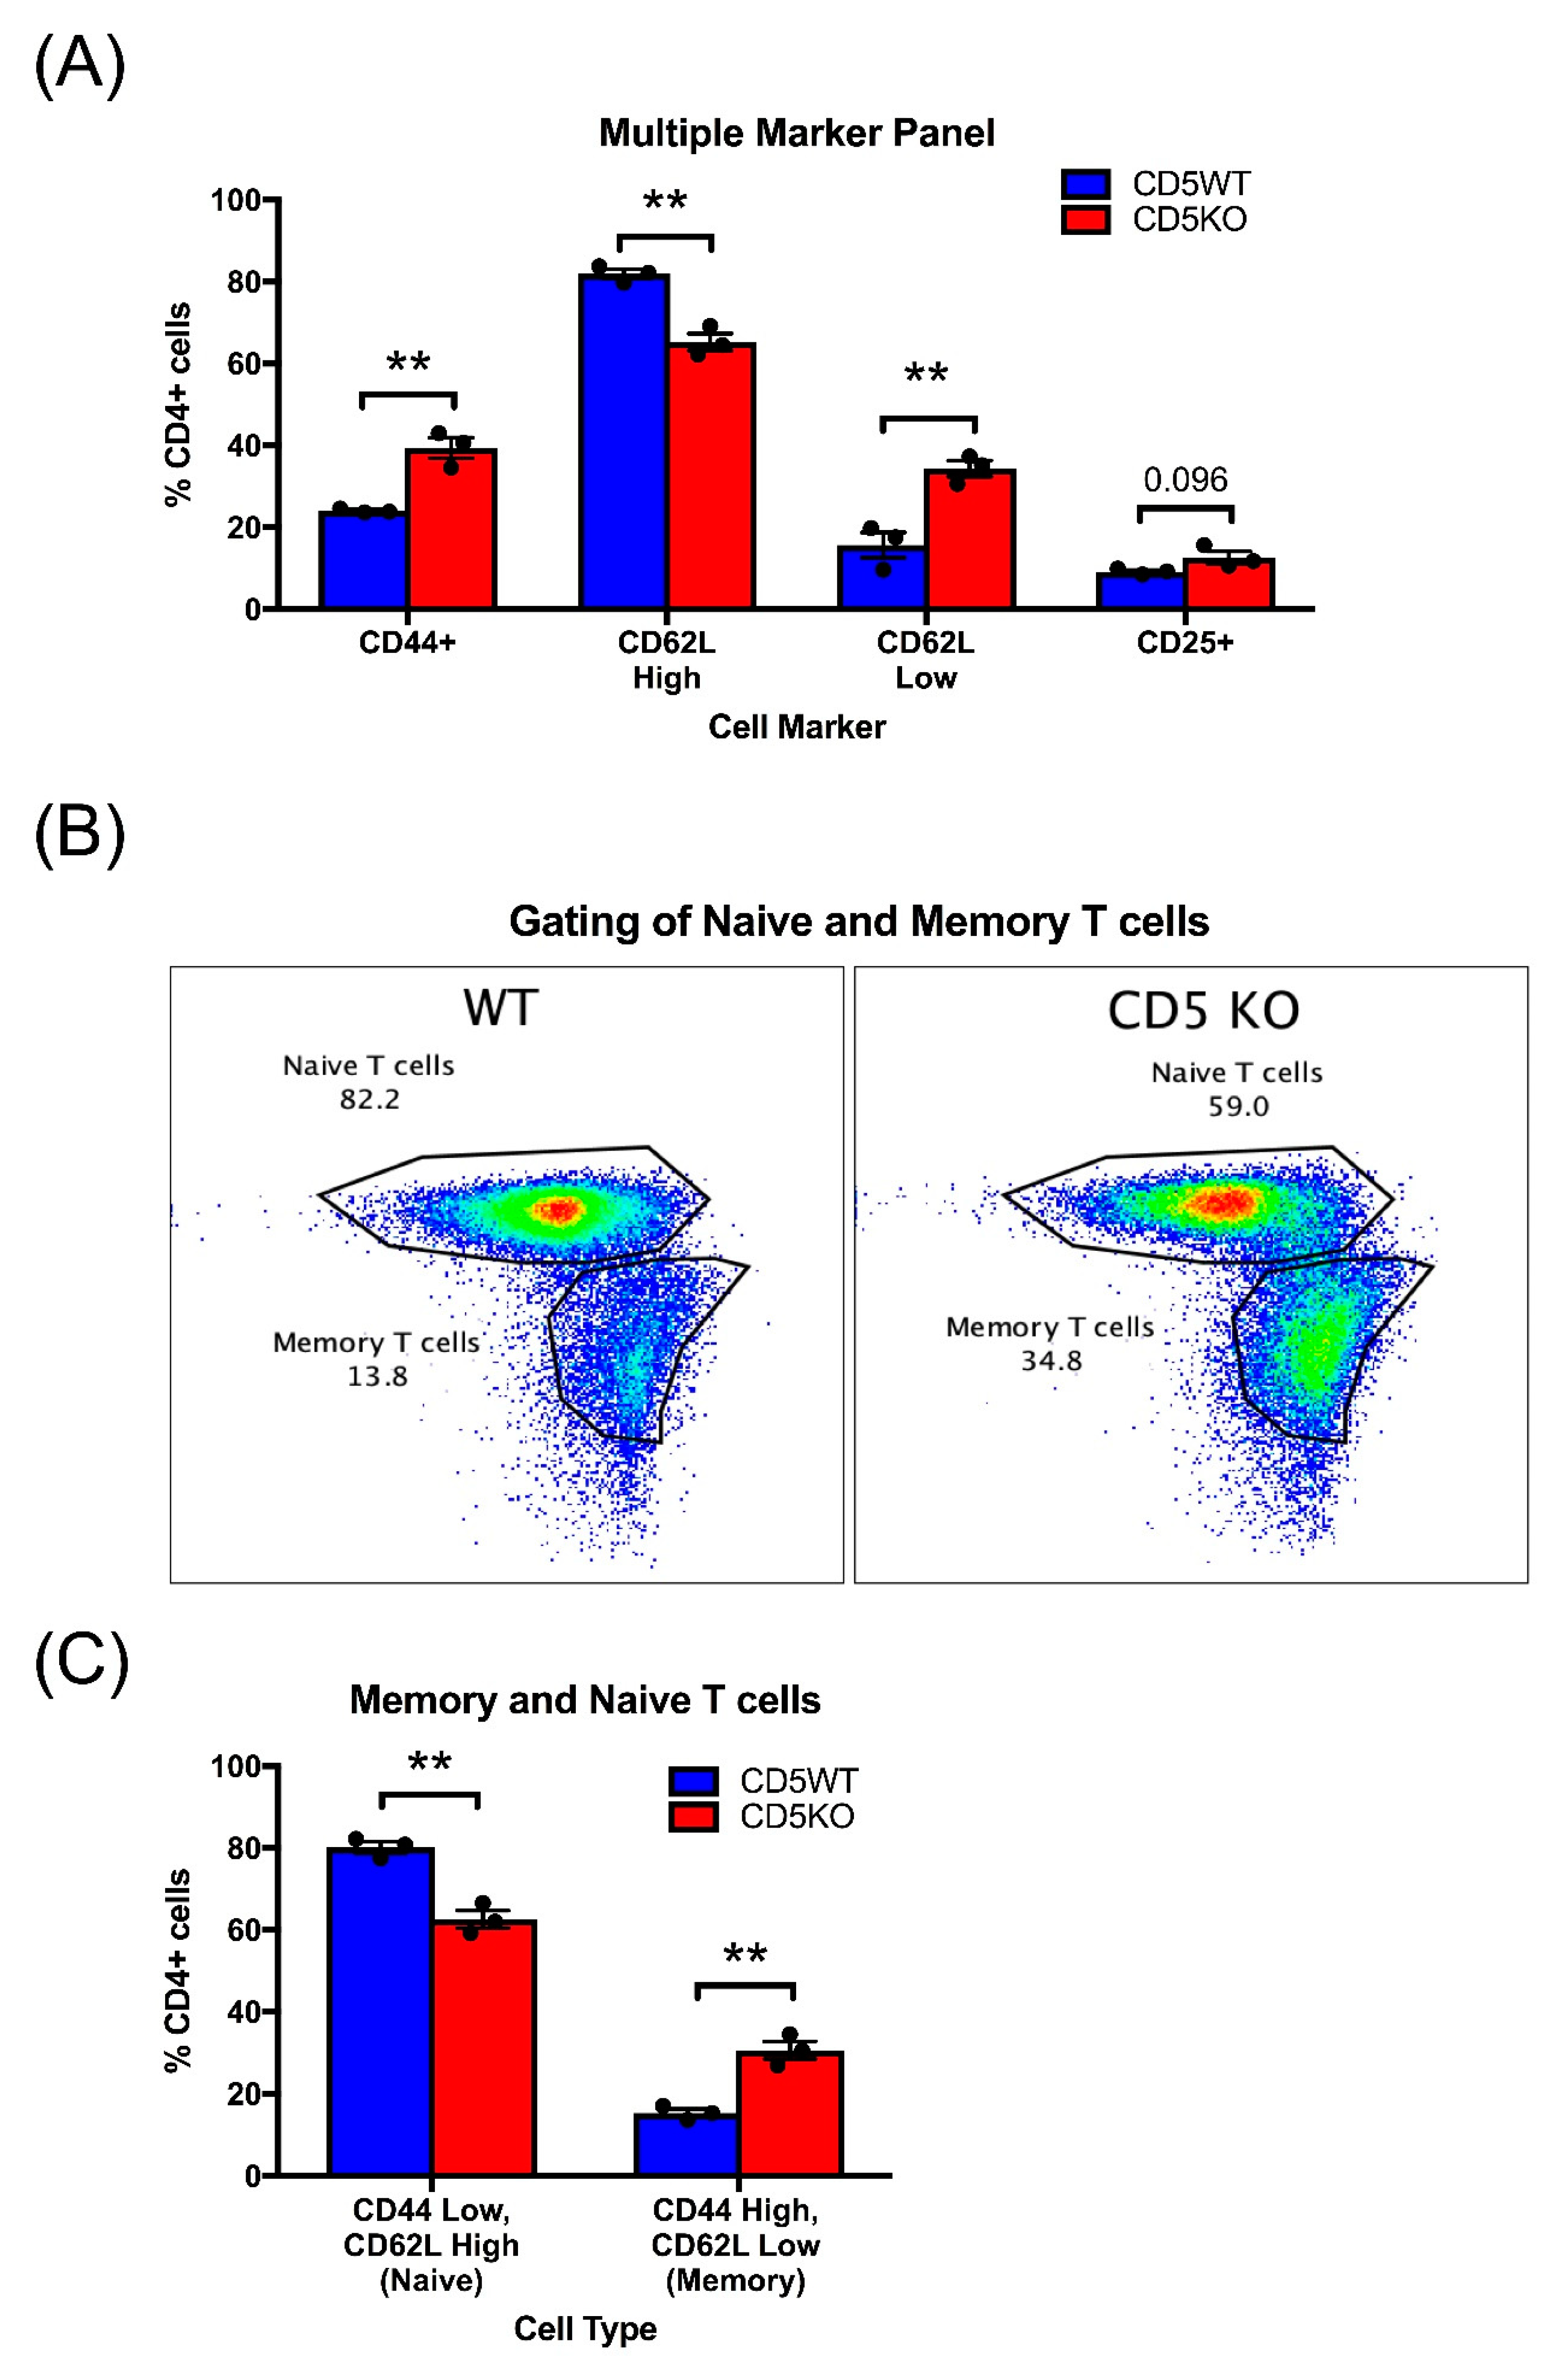
3.7. Unstimulated CD5KO CD4+ T Cells Have Phenotypic Differences in Comparison to CD5WT CD4+ T Cells
4. Discussion
Supplementary Materials
Author Contributions
Funding
Institutional Review Board Statement
Data Availability Statement
Acknowledgments
Conflicts of Interest
References
- Zhu, J.; Paul, W.E. CD4 T cells: Fates, functions, and faults. Blood 2008, 112, 1557–1569. [Google Scholar] [CrossRef] [Green Version]
- Bennett, S.R.; Carbone, F.R.; Karamalis, F.; Miller, J.F.; Heath, W.R. Induction of a CD8+ Cytotoxic T Lymphocyte Response by Cross-priming Requires Cognate CD4+ T Cell Help. J. Exp. Med. 1997, 186, 65–70. [Google Scholar] [CrossRef]
- Schoenberger, S.P.; Toes, R.; Van Der Voort, E.I.H.; Offringa, R.; Melief, C.J.M. T-cell help for cytotoxic T lymphocytes is mediated by CD40–CD40L interactions. Nature 1998, 393, 480–483. [Google Scholar] [CrossRef] [PubMed]
- Friedman, K.M.; Prieto, P.A.; Devillier, L.E.; Gross, C.; Yang, J.C.; Wunderlich, J.R.; Rosenberg, S.A.; Dudley, M.E. Tumor-specific CD4+ Melanoma Tumor-infiltrating Lymphocytes. J. Immunother. 2012, 35, 400–408. [Google Scholar] [CrossRef]
- Quezada, S.; Simpson, T.R.; Peggs, K.S.; Merghoub, T.; Vider, J.; Fan, X.; Blasberg, R.; Yagita, H.; Muranski, P.; Antony, P.A.; et al. Tumor-reactive CD4(+) T cells develop cytotoxic activity and eradicate large established melanoma after transfer into lymphopenic hosts. J. Exp. Med. 2010, 207, 637–650. [Google Scholar] [CrossRef] [PubMed] [Green Version]
- Inderberg, E.M.; Wälchli, S. Long-term surviving cancer patients as a source of therapeutic TCR. Cancer Immunol. Immunother. 2020, 69, 859–865. [Google Scholar] [CrossRef] [Green Version]
- Buck, M.D.; O’Sullivan, D.; Pearce, E.L. T cell metabolism drives immunity. J. Exp. Med. 2015, 212, 1345–1360. [Google Scholar] [CrossRef] [Green Version]
- Patsoukis, N.; Bardhan, K.; Chatterjee, P.; Sari, D.; Liu, B.; Bell, L.N.; Karoly, E.D.; Freeman, G.J.; Petkova, V.; Seth, P.; et al. PD-1 alters T-cell metabolic reprogramming by inhibiting glycolysis and promoting lipolysis and fatty acid oxidation. Nat. Commun. 2015, 6, 6692. [Google Scholar] [CrossRef] [Green Version]
- Pearce, E.L.; Pearce, E.J. Metabolic Pathways in Immune Cell Activation and Quiescence. Immunity 2013, 38, 633–643. [Google Scholar] [CrossRef] [PubMed] [Green Version]
- Almeida, L.; Lochner, M.; Berod, L.; Sparwasser, T. Metabolic pathways in T cell activation and lineage differentiation. Semin. Immunol. 2016, 28, 514–524. [Google Scholar] [CrossRef] [Green Version]
- Bantug, G.R.; Galluzzi, L.; Kroemer, G.; Hess, C. The spectrum of T cell metabolism in health and disease. Nat. Rev. Immunol. 2018, 18, 19–34. [Google Scholar] [CrossRef] [PubMed]
- Delgoffe, G.M.; Powell, J.D. Sugar, fat, and protein: New insights into what T cells crave. Curr. Opin. Immunol. 2015, 33, 49–54. [Google Scholar] [CrossRef] [PubMed] [Green Version]
- Weng, N.-P.; Araki, Y.; Subedi, K. The molecular basis of the memory T cell response: Differential gene expression and its epigenetic regulation. Nat. Rev. Immunol. 2012, 12, 306–315. [Google Scholar] [CrossRef] [PubMed] [Green Version]
- van der Merwe, P.A.; Davis, S.J. Molecular Interactions Mediating T Cell Antigen Recognition. Annu. Rev. Immunol. 2003, 21, 659–684. [Google Scholar] [CrossRef] [PubMed]
- Viganò, S.; Utzschneider, D.T.; Perreau, M.; Pantaleo, G.; Zehn, D.; Harari, A. Functional Avidity: A Measure to Predict the Efficacy of Effector T Cells? Clin. Dev. Immunol. 2012, 2012, 153863. [Google Scholar] [CrossRef] [Green Version]
- Zhong, S.; Malecek, K.; Johnson, L.A.; Yu, Z.; de Miera, E.V.-S.; Darvishian, F.; McGary, K.; Huang, K.; Boyer, J.; Corse, E.; et al. T-cell receptor affinity and avidity defines antitumor response and autoimmunity in T-cell immunotherapy. Proc. Natl. Acad. Sci. USA 2013, 110, 6973–6978. [Google Scholar] [CrossRef] [Green Version]
- Menk, A.V.; Scharping, N.; Moreci, R.S.; Zeng, X.; Guy, C.; Salvatore, S.; Bae, H.; Xie, J.; Young, H.A.; Wendell, S.G.; et al. Early TCR Signaling Induces Rapid Aerobic Glycolysis Enabling Distinct Acute T Cell Effector Functions. Cell Rep. 2018, 22, 1509–1521. [Google Scholar] [CrossRef] [Green Version]
- Chen, J.-L.; Morgan, A.J.; Stewart-Jones, G.; Shepherd, D.; Bossi, G.; Wooldridge, L.; Hutchinson, S.L.; Sewell, A.K.; Griffiths, G.M.; van der Merwe, P.A.; et al. Ca2+ Release from the Endoplasmic Reticulum of NY-ESO-1–Specific T Cells Is Modulated by the Affinity of TCR and by the Use of the CD8 Coreceptor. J. Immunol. 2010, 184, 1829–1839. [Google Scholar] [CrossRef] [PubMed] [Green Version]
- Freitas, C.M.T.; Johnson, D.K.; Weber, K.S. T Cell Calcium Signaling Regulation by the Co-Receptor CD5. Int. J. Mol. Sci. 2018, 19, 1295. [Google Scholar] [CrossRef] [Green Version]
- Schneider, H.; Smith, X.; Liu, H.; Bismuth, G.; Rudd, C.E. CTLA-4 disrupts ZAP70 microcluster formation with reduced T cell/APC dwell times and calcium mobilization. Eur. J. Immunol. 2008, 38, 40–47. [Google Scholar] [CrossRef] [Green Version]
- Wei, F.; Zhong, S.; Ma, Z.; Kong, H.; Medvec, A.; Ahmed, R.; Freeman, G.J.; Krogsgaard, M.; Riley, J.L. Strength of PD-1 signaling differentially affects T-cell effector functions. Proc. Natl. Acad. Sci. USA 2013, 110, E2480–E2489. [Google Scholar] [CrossRef] [PubMed] [Green Version]
- Miyajima, M.; Zhang, B.; Sugiura, Y.; Sonomura, K.; Guerrini, M.M.; Tsutsui, Y.; Maruya, M.; Vogelzang, A.; Chamoto, K.; Honda, K.; et al. Metabolic shift induced by systemic activation of T cells in PD-1-deficient mice perturbs brain monoamines and emotional behavior. Nat. Immunol. 2017, 18, 1342–1352. [Google Scholar] [CrossRef]
- McAlister, M.S.B.; Brown, M.H.; Willis, A.C.; Rudd, P.M.; Harvey, D.J.; Aplin, R.; Shotton, D.M.; Dwek, R.A.; Barclay, A.N.; Driscoll, P.C. Structural analysis of the CD5 antigen--expression, disulphide bond analysis and physical characterisation of CD5 scavenger receptor superfamily domain 1. Eur. J. Biochem. 1998, 257, 131–141. [Google Scholar] [CrossRef] [PubMed] [Green Version]
- Tabbekh, M.; Mokrani-Hammani, M.; Bismuth, G.; Mami-Chouaib, F. T-cell modulatory properties of CD5 and its role in antitumor immune responses. OncoImmunology 2013, 2, e22841. [Google Scholar] [CrossRef] [PubMed] [Green Version]
- Pena-Rossi, C.; Zuckerman, L.A.; Strong, J.; Kwan, J.; Ferris, W.; Chan, S.; Tarakhovsky, A.; Beyers, A.D.; Killeen, N. Negative regulation of CD4 lineage development and responses by CD5. J. Immunol. 1999, 163, 6494–6501. [Google Scholar] [PubMed]
- Sestero, C.M.; McGuire, D.; De Sarno, P.; Brantley, E.C.; Soldevila, G.; Axtell, R.C.; Raman, C. CD5-dependent CK2 activation pathway regulates threshold for T cell anergy. J. Immunol. 2012, 189, 2918–2930. [Google Scholar] [CrossRef] [Green Version]
- Brown, M.H.; Lacey, E. A Ligand for CD5 Is CD5. J. Immunol. 2010, 185, 6068–6074. [Google Scholar] [CrossRef]
- Luo, W.; Van De Velde, H.; Von Hoegen, I.; Parnes, J.R.; Thielemans, K. Ly-1 (CD5), a membrane glycoprotein of mouse T lymphocytes and a subset of B cells, is a natural ligand of the B cell surface protein Lyb-2 (CD72). J. Immunol. 1992, 148, 1630–1634. [Google Scholar]
- Biancone, L.; Bowen, M.A.; Lim, A.; Aruffo, A.; Andres, G.; Stamenkovic, I. Identification of a novel inducible cell-surface ligand of CD5 on activated lymphocytes. J. Exp. Med. 1996, 184, 811–819. [Google Scholar] [CrossRef] [Green Version]
- Blaize, G.; Daniels-Treffandier, H.; Aloulou, M.; Rouquié, N.; Yang, C.; Marcellin, M.; Gador, M.; Benamar, M.; Ducatez, M.; Song, K.-D.; et al. CD5 signalosome coordinates antagonist TCR signals to control the generation of Treg cells induced by foreign antigens. Proc. Natl. Acad. Sci. USA 2020, 117, 12969–12979. [Google Scholar] [CrossRef]
- Azzam, H.S.; DeJarnette, J.B.; Huang, K.; Emmons, R.; Park, C.-S.; Sommers, C.L.; El-Khoury, D.; Shores, E.W.; Love, P.E. Fine Tuning of TCR Signaling by CD5. J. Immunol. 2001, 166, 5464–5472. [Google Scholar] [CrossRef] [PubMed]
- Voisinne, G.; Garcia-Blesa, A.; Chaoui, K.; Fiore, F.; Bergot, E.; Girard, L.; Malissen, M.; Burlet-Schiltz, O.; de Peredo, A.G.; Malissen, B.; et al. Co-recruitment analysis of the CBL and CBLB signalosomes in primary T cells identifies CD5 as a key regulator of TCR -induced ubiquitylation. Mol. Syst. Biol. 2016, 12, 876. [Google Scholar] [CrossRef] [PubMed]
- Matson, C.A.; Choi, S.; Livak, F.; Zhao, B.; Mitra, A.; Love, P.E.; Singh, N.J. CD5 dynamically calibrates basal NF-κB signaling in T cells during thymic development and peripheral activation. Proc. Natl. Acad. Sci. USA 2020, 117, 14342–14353. [Google Scholar] [CrossRef] [PubMed]
- Alotaibi, F.; Rytelewski, M.; Figueredo, R.; Zareardalan, R.; Zhang, M.; Ferguson, P.J.; Vareki, S.M.; Najajreh, Y.; El-Hajjar, M.; Zheng, X.; et al. CD5 blockade enhances ex vivo CD8 + T cell activation and tumour cell cytotoxicity. Eur. J. Immunol. 2020, 50, 695–704. [Google Scholar] [CrossRef] [PubMed]
- Cox, J.E.; Thummel, C.S.; Tennessen, J.M. Metabolomic Studies in Drosophila. Genetics 2017, 206, 1169–1185. [Google Scholar] [CrossRef] [PubMed] [Green Version]
- Orjuela, S.; Huang, R.; Hembach, K.M.; Robinson, M.D.; Soneson, C. ARMOR: An Automated Reproducible MOdular Workflow for Preprocessing and Differential Analysis of RNA-seq Data. G3 2019, 9, 2089–2096. [Google Scholar] [CrossRef] [Green Version]
- Borst, P. The malate–aspartate shuttle (Borst cycle): How it started and developed into a major metabolic pathway. IUBMB Life 2020, 72, 2241–2259. [Google Scholar] [CrossRef] [PubMed]
- Rutter, J.; Winge, D.R.; Schiffman, J.D. Succinate dehydrogenase—Assembly, regulation and role in human disease. Mitochondrion 2010, 10, 393–401. [Google Scholar] [CrossRef] [Green Version]
- Lomelino, C.L.; Andring, J.T.; McKenna, R.; Kilberg, M.S. Asparagine synthetase: Function, structure, and role in disease. J. Biol. Chem. 2017, 292, 19952–19958. [Google Scholar] [CrossRef] [Green Version]
- Tönjes, M.; Barbus, S.; Park, Y.J.; Wang, W.; Schlotter, M.; Lindroth, A.M.; Pleier, S.V.; Bai, A.H.C.; Karra, D.; Piro, R.M.; et al. BCAT1 promotes cell proliferation through amino acid catabolism in gliomas carrying wild-type IDH1. Nat. Med. 2013, 19, 901–908. [Google Scholar] [CrossRef] [PubMed] [Green Version]
- Cheng, Q.; Wei, T.; Jia, Y.; Farbiak, L.; Zhou, K.; Zhang, S.; Wei, Y.; Zhu, H.; Siegwart, D.J. Dendrimer-Based Lipid Nanoparticles Deliver Therapeutic FAH mRNA to Normalize Liver Function and Extend Survival in a Mouse Model of Hepatorenal Tyrosinemia Type I. Adv. Mater. 2018, 30, e1805308. [Google Scholar] [CrossRef] [PubMed]
- Bateman, R.L.; Bhanumoorthy, P.; Witte, J.F.; McClard, R.W.; Grompe, M.; Timm, D.E. Mechanistic Inferences from the Crystal Structure of Fumarylacetoacetate Hydrolase with a Bound Phosphorus-based Inhibitor. J. Biol. Chem. 2001, 276, 15284–15291. [Google Scholar] [CrossRef] [PubMed] [Green Version]
- Milam, A.A.V.; Bartleson, J.M.; Buck, M.D.; Chang, C.-H.; Sergushichev, A.; Donermeyer, D.L.; Lam, W.Y.; Pearce, E.L.; Artyomov, M.N.; Allen, P.M. Tonic TCR Signaling Inversely Regulates the Basal Metabolism of CD4(+) T Cells. ImmunoHorizons 2020, 4, 485–497. [Google Scholar] [CrossRef] [PubMed]
- Wong, P.; Barton, G.; Forbush, K.A.; Rudensky, A.Y. Dynamic Tuning of T Cell Reactivity by Self-Peptide–Major Histocompatibility Complex Ligands. J. Exp. Med. 2001, 193, 1179–1187. [Google Scholar] [CrossRef]
- Haas, K.M.; Poe, J.C.; Steeber, D.A.; Tedder, T.F. B-1a and B-1b Cells Exhibit Distinct Developmental Requirements and Have Unique Functional Roles in Innate and Adaptive Immunity to S. pneumoniae. Immunity 2005, 23, 7–18. [Google Scholar] [CrossRef] [PubMed] [Green Version]
- Li, H.; Burgueño-Bucio, E.; Xu, S.; Das, S.; Olguín-Alor, R.; Elmets, C.A.; Athar, M.; Raman, C.; Soldevila, G.; Xu, H. CD5 on dendritic cells regulates CD4+ and CD8+ T cell activation and induction of immune responses. PLoS ONE 2019, 14, e0222301. [Google Scholar] [CrossRef]
- Wang, R.; Green, D.R. Metabolic reprogramming and metabolic dependency in T cells. Immunol. Rev. 2012, 249, 14–26. [Google Scholar] [CrossRef] [Green Version]
- Holub, B.J. Metabolism and Function of myo-Inositol and Inositol Phospholipids. Annu. Rev. Nutr. 1986, 6, 563–597. [Google Scholar] [CrossRef]
- Rivera, G.O.R.; Knochelmann, H.M.; Dwyer, C.J.; Smith, A.S.; Wyatt, M.M.; Rivera-Reyes, A.M.; Thaxton, J.E.; Paulos, C.M. Fundamentals of T Cell Metabolism and Strategies to Enhance Cancer Immunotherapy. Front. Immunol. 2021, 12, 645242. [Google Scholar] [CrossRef]
- Burgueno-Bucio, E.; Mier-Aguilar, C.A.; Soldevila, G. The multiple faces of CD5. J. Leukoc. Biol. 2019, 105, 891–904. [Google Scholar] [CrossRef]
- Voisinne, G.; De Peredo, A.G.; Roncagalli, R. CD5, an Undercover Regulator of TCR Signaling. Front. Immunol. 2018, 9, 2900. [Google Scholar] [CrossRef] [PubMed]
- Consuegra-Fernández, M.; Aranda, F.; Simoes, I.T.; Orta, M.; Sarukhan, A.; Lozano, F. CD5 as a Target for Immune-Based Therapies. Crit. Rev. Immunol. 2015, 35, 85–115. [Google Scholar] [CrossRef] [PubMed]
- Bengsch, B.; Johnson, A.L.; Kurachi, M.; Odorizzi, P.M.; Pauken, K.E.; Attanasio, J.; Stelekati, E.; McLane, L.M.; Paley, M.A.; Delgoffe, G.M.; et al. Bioenergetic Insufficiencies Due to Metabolic Alterations Regulated by the Inhibitory Receptor PD-1 Are an Early Driver of CD8(+) T Cell Exhaustion. Immunity 2016, 45, 358–373. [Google Scholar] [CrossRef] [PubMed] [Green Version]
- Sarhan, M.A.; Pham, T.N.Q.; Chen, A.Y.; Michalak, T.I. Hepatitis C Virus Infection of Human T Lymphocytes Is Mediated by CD5. J. Virol. 2012, 86, 3723–3735. [Google Scholar] [CrossRef] [Green Version]
- Buchbinder, E.I.; Desai, A. CTLA-4 and PD-1 Pathways: Similarities, Differences, and Implications of Their Inhibition. Am. J. Clin. Oncol. 2016, 39, 98–106. [Google Scholar] [CrossRef] [Green Version]


Publisher’s Note: MDPI stays neutral with regard to jurisdictional claims in published maps and institutional affiliations. |
© 2022 by the authors. Licensee MDPI, Basel, Switzerland. This article is an open access article distributed under the terms and conditions of the Creative Commons Attribution (CC BY) license (https://creativecommons.org/licenses/by/4.0/).
Share and Cite
Whitley, K.V.; Freitas, C.M.T.; Moreno, C.; Haynie, C.; Bennett, J.; Hancock, J.C.; Cox, T.D.; Pickett, B.E.; Weber, K.S. CD5 Deficiency Alters Helper T Cell Metabolic Function and Shifts the Systemic Metabolome. Biomedicines 2022, 10, 704. https://doi.org/10.3390/biomedicines10030704
Whitley KV, Freitas CMT, Moreno C, Haynie C, Bennett J, Hancock JC, Cox TD, Pickett BE, Weber KS. CD5 Deficiency Alters Helper T Cell Metabolic Function and Shifts the Systemic Metabolome. Biomedicines. 2022; 10(3):704. https://doi.org/10.3390/biomedicines10030704
Chicago/Turabian StyleWhitley, Kiara V., Claudia M. Tellez Freitas, Carlos Moreno, Christopher Haynie, Joshua Bennett, John C. Hancock, Tyler D. Cox, Brett E. Pickett, and K. Scott Weber. 2022. "CD5 Deficiency Alters Helper T Cell Metabolic Function and Shifts the Systemic Metabolome" Biomedicines 10, no. 3: 704. https://doi.org/10.3390/biomedicines10030704